Embed Size (px)
Citation preview

202.8 99HE 11
•::::..•.• •":iSi..::: S i f t : ' • • • . .?;.& ,SIfc, ^ . ^ i : • V : '. ' •'
M i; ill al

Social development |i
dimensions '•
• Technical options
• Finance model
• • • * , • ; • • ' • - M
ifllP Mm
Help Manual for Rural water Credit
LIBRARY !RCPO Box 93190, 250S AD THE HAGUE
Tel.: +31 70 30 689 80Fax: +31 70 35 899 64
BARCODE:LO:
by
Minnie Venter-Hildebrand12th Floor, Braamfontein Centre
Braamfontein 2017Johannesburg, South Africa
www.mvula.co.za
Index
Help Manual for Rural Water Credit 0
Background and Context 5
Acknowledgements 8
The Components to this Help Manual 9
Methodology of Local Level Demand Analysis 11
Critiques and defences of CV studies 12
How to minimise biases 12
Questionnaire structure 14
Willingness & Capacity to Pay Questionnaire 15
Data Capturing Methodology 26
General Considerations for inputting data 27
Template 1: Demographics 28
Template 2: Appliances 29
Template 3: Income Expenditure 29
Template 4: Water Use 30
Template 5: Yard Connections 31
Analysis: Contingent Valuation Methodology 33
Introduction 33
Template 1A: Demographics Out (Sec 1: Demographics)... 34
Template 2A: Appliances Out (Section 2: Wealth, Income andExpenditure) 36
Template 3A: Income Expenditure Out (Section 2: Wealth,Income and Expenditure) 37
Template 4A: Water Use Out (Section 3: Water Use) 39
Template 5A: Yard Out (Section 4: Yard Connections) 40
Spreadsheets - Examples of Templates 43
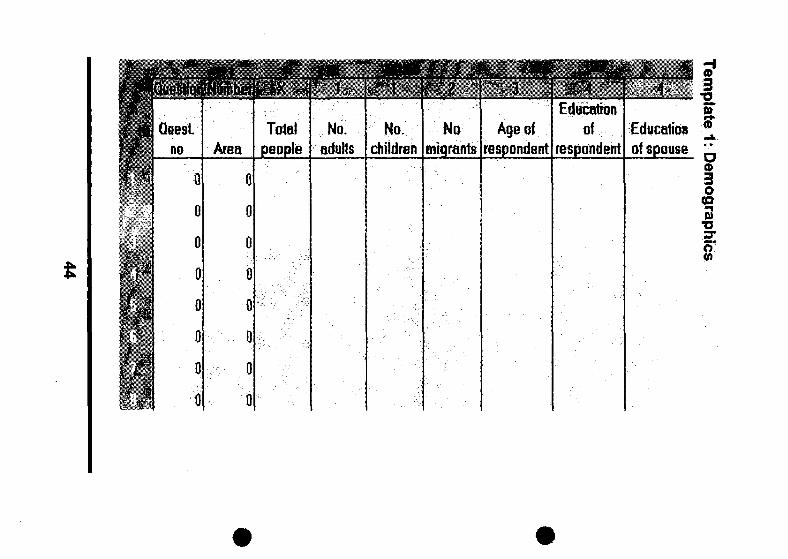
Template 1: Demographics 44
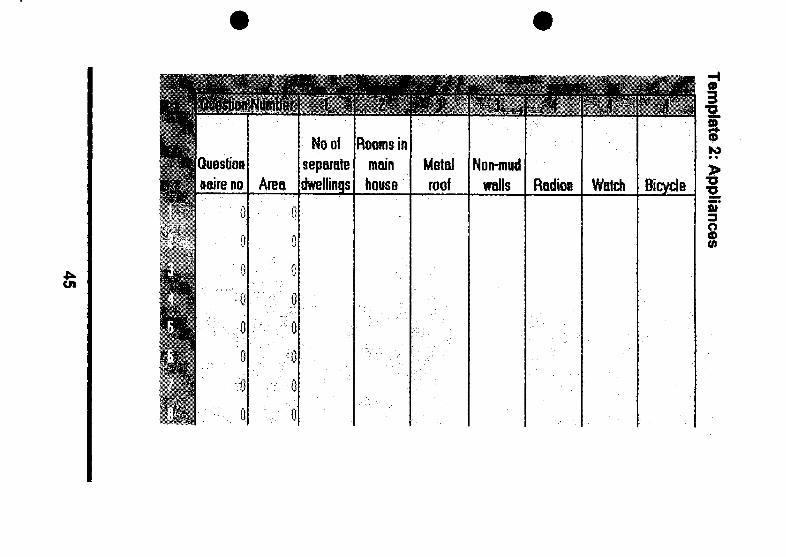
Template 2: Appliances 45
Template 3; Income and Expenditure 46
Template 4: Water Use 47
Template 5: Yard Connections 48
Output templates - Examples 49
Technical Options 53
Advantages & disadvantages 55
Infrastructural Requirements for Each Option 58
General Costs For Each Option 60
Summary 60
Financial Models 61
Individual Loans 61
Group Loans 62
Rural Water Supply Financial Model 64
Introduction 64
Model scope 64
Technical specifications 65
Structure of the model 65
Protection, colour coding and number format 66
Colour coding 66
Number format 67
Model inputs and outputs 67
Capital costs 69
The meaning of unpaid bills 76
Spreadsheets - Examples 78

Project Description: 78
Demography & Income: 79
Investment Scenario & Capital Costs: 80
Capital Grants & Finance to be raised: 81
Sources of Finance: 82
Estimated Water Consumption 83
Asset Replacement, Operating & Maintenance Expenditure.^
Monthly Bills: 85
Willingness to Pay and Total Amounts Unpaid: 86
Summary: 87
Savings Investment Finance Model 88
Introduction 88
Model scope 88
Technical specifications 89
Structure of the model 89
Protection, colour coding and number format 90
Protection 90
Colour coding 90
Number formats 91
Model inputs and outputs 91
Project Description 91
Demography and income 92
Service level scenarios and capital costs 92
Service level scenarios 92
Replacement value of shared infrastructure 93
Capital cost of on-site connections 94
Financing options: Groups, interest rates and inflation 94
Financing option 1: Savings ("pure" stokvel option) 96
Financing option 2: Communal loans with savings ascollateral 97
Financing option 2: Graphs 99
Estimated water consumption 99
Asset replacement, operating & maintenance expenditure 100
Monthly bills 101
Willingness to pay & amounts unpaid 102
Summary 103
The meaning of unpaid bills 103
Project Description 105
Demography and Income 106
Investment scenarios and capital cost 107
Financing Options: Groups, interest rates and inflation 108
Financing Options: Savings (pure stokvel option) 109
Financing Option 2: Communal Loans with Savings ascollateral 110
Financing Option 2: Graphs 111
Estimated Water Consumption 112
Asset replacement, Operating & Maintenance Expenditure. 113
Monthly Bills 114
Willingness to pay and total amounts unpaid 115
Summary 116
Training for Cost Recovery & Sustainability 117

JJUt T 0 d LLC t JJLM
The mission ofMvula Trust
is to improve the health and
welfare of poor and disadvantaged
South Africans in rural and peri-urban
communities by increasing access to
safe and sustainable water and
sanitation services
V>W

Background and Context
The manual is the culmination of work done by employees of andconsulting companies and individuals associated with the Mvula Trustin Johannesburg, South Africa.
The Mvula Trust is a South African NGO focusing on the provision ofbasic water services in five of the country's poorest provinces as wellas subject-specific research concerned with the alleviation of infra-structural disparities.
Mvula Trust's mission is to improve the health and welfare of poor anddisadvantaged South Africans in rural and peri-urban communities byincreasing access to safe and sustainable water and sanitation serv-ices. It is an independent organisation and operates within the strate-gic policy framework of the government and in close co-operation andpartnership with other development agencies. The Trust promotesefficient partnerships between public, private and non-governmentalbodies in service improvement, with the following key functions:
• to facilitate and finance a portfolio of community water supply andsanitation projects;
• to support water and sanitation policy development affecting serv-ice access for the poor;
• to build capacity for local-level agencies;
• to promote innovative approaches to sector development;
• to disseminate information relating to the sector and to learn les-sons from practical application; and to facilitate loan finance forhigher levels of service.
The advent of the new political dispensation in South Africa in 1994,came with a renewed sense of urgency to address the massive back-logs in service infrastructure for previously disadvantaged South Afri-cans. For most rural South Africans, clean water supplies are a prior

ity as good access to these means other benefits such as improvedhealth and other economic benefit spin-offs.
The delivery of basic water supplies through the Reconstruction andDevelopment Programme (RDP) and its associated Department ofWater Affairs' Community Water Supply and Sanitation Programme(CWSS) has resulted in thousands of rural households gaining accessto standpipe water supplies over the last few years.
While the success of the programme has been measured through thenumber of communal standpipes installed, the issue of sustainabilityhas not been adequately addressed, nor has cost recovery occurredto a significant extent. These problems have resulted in new thinkingemerging in the water sector which is beginning to be addressedthrough a shift in government policies.
The RDP guidelines stipulate that every citizen is entitled to a basicsupply defined as 25 litres per person per day, accessible at a walkingdistance of no more than 200 meters from the dwelling. In general,this has been a useful guideline for purposes of directing the hugewater supply infrastructure roll-out programme that followed. How-ever, experience since the onset of the RDP in 1994 has improvedunderstanding of the problem and how best to address it in order toensure schemes with a better chance to be sustainable. This hasmeant a need to change approaches accordingly. Some of the issueswhich exemplify the new approach include the following four princi-ples:
1. Water supply planners and design engineers now realise that ru-ral people cannot be regarded as being homogenous and havingsimilar aspirations. Whilst 25l/person/day may be the guidelineWorld Health Organisation requirement, there will always be othermembers of the community who will aspire for progressively more,and in a lot of cases can afford to pay for it. These people willprefer yard connections (on-site services) which will result inhigher water consumption. Schemes should, therefore, be de-signed and built to cope with this additional supply burden.
2. A demand for on-site water provision brings to those who desire it,an obligation to pay for their portion of the infrastructure that fallsoutside of the scope of government obligation (the South AfricanBill of Rights stipulates that access to water is a basic humanright). Considering the economic capacity of most rural house-
holds, on-side water provision will mean accessing loans or creditfor their infrastructural upgrading. This requires a number of dif-ferent levels or types of financing, namely risk-sharing or whole-sale finance to supply guarantee money to retail lenders (in formalfinancial institutions), to grant loans to community members orcommittees not eligible for commercial loans, traditional savingsschemes (ROCSAs, Credit Unions, etc.) whereby communitiesenter into collective savings schemes, borrow against these sav-ings by using it as collateral or guarantee.
3. There is a need to consider and avail suitable technical options forthe structured upgrade of older water schemes which were built tosupply 251/person/day. This should take cognisance of the factthat even in these areas there are people with higher aspirationswho may legally or illegally continue to make private connectionsin order to get supply volumes that they may require. If this is notaddressed early enough, it may jeopardise the supply integrity ofthe entire scheme resulting in other areas without water duringtimes of peak demand such as the early morning and the late af-ternoons.
4. Operations and maintenance (O&M) considerations need to comeout in the fore as there is now a greater need than ever before toensure that sufficient capacity exists locally to operate and main-tain water schemes. The local communities also need to be ade-quately trained on the need for O&M training as well as the costsassociated with these activities. Cost recovery has, therefore, be-come an integral consideration for design engineers and watersupply planners who in evaluating options for either upgradingexisting schemes or implementing new schemes now have toprovide for yard connections and higher levels of services.
The above context encouraged the Mvula Trust to start investigatingways of meeting the demand for higher levels of water provisionservices through a loan finance initiative as the calls for higher levelsof service from various communities were becoming increasingly evi-dent. In some areas, people rejected the RDP standard communalstandpipes in favour of waiting for household connections; and in oth-ers unauthorised connections were being made, without considerationbeing given to the capacity of the resource or the sustainability of thesystem.
Since it was clear that funding upgraded (on-site) water services wasnot part of government planning, and the private sector was not get-ting involved because of high repayment risk associated with the ruralpoor, an innovative approach needed to be investigated to meet thegrowing demand for upgraded water service.
The Loan Finance Facilitation Programme was launched by the Trustin 1997 and the programme hinges on the following two complemen-tary objectives:
• To provide policy-makers with a range of innovative financial,technical and institutional options that could be used in the imple-mentation of higher service level projects across the country, and
• To assist communities directly in accessing loan finance for provi-sion of services at better-than-basic levels.
AcknowledgementsThe Social Survey questionnaire was adapted from work done by Mi-chael Goldblatt (University of the Witwatersrand); the survey descrip-tions were adapted by Sue Elsey (University of the Witwatersrand),the Financial Models were developed by Bee Thompson of thePalmer Development Group in South Africa; the cover design sepa-rator sheets and graphics were designed by Joanne Matuszak fromthe Technikon Witwatersrand, and Lylle Hebbes, Johannesburg, andthe technical options information was supplied by Cecil Chibi, a con-sultant engineer with Mvula Trust. We are grateful to these organisa-tions and individuals for their input.
Funding for the research, compilation and production of the HelpManual for Rural Water Credit was obtained from the European Un-ion/NGO Fund.
The Help Manual for Rural Water Credit was researched, compiledand written by Minnie Venter-Hildebrand, Programme Manager at theMvula Trust.
8
The Components to this Help Manual
The manual consists of four components, all independently applicablebut taken as a collective, all dependent on one-another. The compo-nents are:
1. Contingent Valuation Methodology Survey
2. Technical Options
3. Financial Models
4. Programme and spreadsheet disk
The first two components, namely the Social Survey and TechnicalOptions feed into the Financial Models, which in turn is dependent onthe computer programme supplied with the manual.
This manual is intended as a guideline and help for planners and in-formal financial institutions exploring the possibilities of providingcredit to poor, rural households wanting to purchase the secondaryinfrastructure for on-site (higher levels) water services.
It aims to assist informal finance institutions to minimise their adminis-trative costs in assessing the viability of the prospective loans andtheir credit risk by using the financial model in Chapter 3 to calculatethe potential annual deficit or profit, taking into account the willingnessand capacity of their potential client or clients, to pay.
Planners will find the manual useful in the setting of water tariffs, usingthe defaults provided or inputting their own costings and in estimatingthe capacity of households to afford on-site services, thus planning foradequate infrastructural provision.
The computer programme for the Financial Model supplied as part ofthe manual gives two different calculation options regarding the infor-mation derived from the Social Surveys. The defaults used as a cal-culation option were reached through surveying 1,200 rural house-holds in the four poorest of South Africa's nine provinces. The modelmakes provision for the defaults to be substituted.
As the Social Surveys are expensive to conduct, and in the light ofdiminishing grant funding for research, areas or countries already in
9
possession of data should utilise their own information. The objectiveof including the Social Surveys in the Help Manual for Rural WaterCredit is to assist organisations and institutions in areas where theinformation does not exist and where research capacity (financial andhuman) is low.
The spreadsheets supplied in both the Social Survey antJ the Finan-cial Model chapters should serve as examples only and the templatescontained in the computer disk should be utilised for the analysis.
The chapter on Technical Options gives a rather broad overview oforvsite (higher levels) water services. It is by no means meant as ablue-print for application globally, but reflects the options and costscurrently under scrutiny by South African organisations and govern-ment departments concerned with these issues. It also assumes thatthe flat-rate system currently used by some communities may not be afair or ideal cost recovery system. Under prevailing South Africanconditions, it is, however, broadly applied to suit indigenous circum-stances, which include a lack of a more sophisticated revenue collec-tion infrastructure capacity.
The Help Manual for Rural Water Credit is deliberately produced asan easy-to-use, loose-leaf booklet so that out-of-date or country-specific information can be substituted for more current data if andwhen it becomes available. As the programme progresses, other fi-nancial options as well as a training component, will be added. It isrecommended that recipients of the volume without the savings-investment model and the training component, contact the MvulaTrust for the updated editions.
10

social
d c v e 1 o p m e n t
d i m e n s i o n $
Methodology of Local Level Demand Analysis
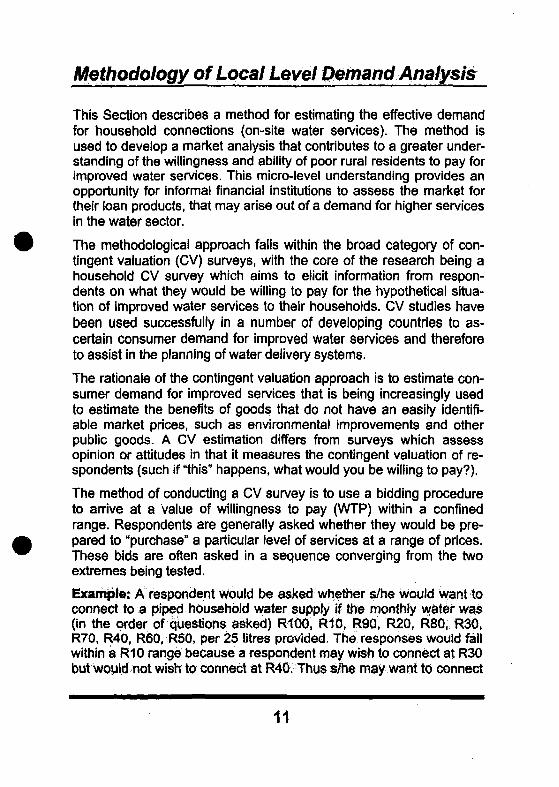
This Section describes a method for estimating the effective demandfor household connections (on-site water services). The method isused to develop a market analysis that contributes to a greater under-standing of the willingness and ability of poor rural residents to pay forimproved water services. This micro-level understanding provides anopportunity for informal financial institutions to assess the market fortheir loan products, that may arise out of a demand for higher servicesin the water sector.
The methodological approach falls within the broad category of con-tingent valuation (CV) surveys, with the core of the research being ahousehold CV survey which aims to elicit information from respon-dents on what they would be willing to pay for the hypothetical situa-tion of improved water services to their households. CV studies havebeen used successfully in a number of developing countries to as-certain consumer demand for improved water services and thereforeto assist in the planning of water delivery systems.
The rationale of the contingent valuation approach is to estimate con-sumer demand for improved services that is being increasingly usedto estimate the benefits of goods that do not have an easily identifi-able market prices, such as environmental improvements and otherpublic goods. A CV estimation differs from surveys which assessopinion or attitudes in that it measures the contingent valuation of re-spondents (such if "this" happens, what would you be willing to pay?).
The method of conducting a CV survey is to use a bidding procedureto arrive at a value of willingness to pay (WTP) within a confinedrange. Respondents are generally asked whether they would be pre-pared to "purchase" a particular level of services at a range of prices.These bids are often asked in a sequence converging from the twoextremes being tested.
Example: A respondent would be asked whether s/he Would want toconnect to a piped household water supply if the monthly water was(in the order of questions asked) R100, RIO, R90, R20, R80, R30,R70, R40, R60, R50, per 25 litres provided. The responses would fallwithin a R10 range because a respondent may wish to connect at R30but would not wish to Connect at R4G. Thus S/he may want to connect
11

at any point between these two values, although s/he is not offeredthese pfjjces (e.g. R37}. Thus the bid is actually for between R3Q andR40 (but not including R40).
Critiques and defences of CV studies
Three methodological critiques can be levelled at CV when it is ap-plied to hypothetical markets for utility services. All are based on con-cerns that respondents may not answer willingness-to-pay questionsaccurately and thus not reveal their 'true' willingness to pay. The pos-sibilities are that:
• respondents believe that they can influence a policy decision bynot answering the interview question truthfully - a strategic bias;
• the question format may itself influence the bid, and that respon-dents may give answers to please the interviewer and interpret theinitial price suggested as a clue to the correct bid - starting-pointbias;
• individuals may not understand the description of the goods orservice being hypothetically offered or may simply not take the hy-pothetical question seriously at all - hypothetical bias.
How to minimise biases
Strategic bias can be minimised by phrasing questions in such a wayas to clearly indicate that responses will not affect the decision-making process or by dividing respondents into two groups who areset a different question. The groups can be compared to evaluatewhether strategic bias has significantly altered responses. It can alsobe minimised by giving respondents no advance warning of the sur-vey to avoid the change of strategically considered answers.
Starting-point bias can be similarly tested for, by using both a highand low starting bid approach and testing for bias based on the start-ing point
12
Hypothetical bias can be reduced and assessed by using welltrained enumerators familiar with the community and by pre-testingthe questionnaire for clarity.
The reliability of the bids can be tested as follows:
• considering how many respondents refused to answer the surveyquestions or gave wildly unrealistic answers;
• comparing bids with payments for already existing services, suchas electricity; and
• assessing whether bids are influenced by households' socio-economic characteristics in a way that is in accordance with eco-nomic theory
13

Questionnaire structure
The household interviews are conducted on the basis of a formal in-terview procedure by means of a questionnaire divided into four parts.The first two parts deal with basic socio-economic aspects of thehousehold.
Section 1: deals with demographic data; these include a descriptionof the respondent's accommodation, the household's size and struc-ture, employment status, and education levels of the household.
Section 2: deals with household wealth, income and expenditure.Households will be asked direct questions concerning the levels ofhousehold income and expenditure. Given the frequent problems as-sociated with attempts to collect reliable data on household income,an additional procedure will be used to gather this information. Theobjective in doing this is to develop a suitable proxy for householdincome and wealth.
Section 3: deals with general services and the respondent's attitudestowards them. Questions will be asked as to which new service isneeded most - from a list including housing, electricity, water, sanita-tion, schools, clinics and roads and which service is the next mostimportant.
Section 4: specifically examines household water use practices. Thisincludes questions to ascertain where households currently obtaintheir water, how far away it is, how much water households use andhow much is paid by users for water. This section also consists ofhighly structured questions aimed at establishing what households arewilling to pay for improved water supplies.
The focus of the interview in this final section is on the estimation ofthe household's WTP for water. This will be done using two methods:the 'bidding game' in which respondents are asked what they wouldbe willing to pay, in specified increments, for a specified amount ofwater supplied through a metered household connection. The secondmethod is a simplified bidding process plus an open bid aimed at as-certaining the total monthly amounts that households would be willingto spend on an improved water supply.
14
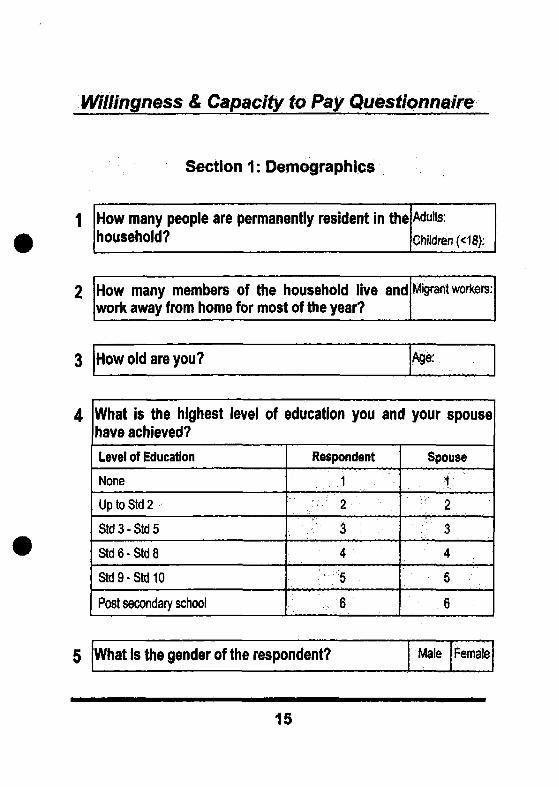
Willingness & Capacity to Pay Questionnaire
Section 1: Demographics
How many people are permanently resident in thehousehold?
Adults;
Children (<18):
How many members of the household live andwork away from home for most of the year?
Migrant workers:
How old are you? Age:
What is the highest level of education you and your spousehave achieved?
Level of Education
None
UptoStd2
Std 3 - Std 5
Std 6 - Std 8
Std 9-Std 10
Post secondary school
Respondent
2 ': :v
3
4
5
6
Spouse
• ' . . $ ' • ' '
;"• 2 . "
•;:;"• 3 :;
4
6
What is the gender of the respondent? Male Female
15
6
7
8
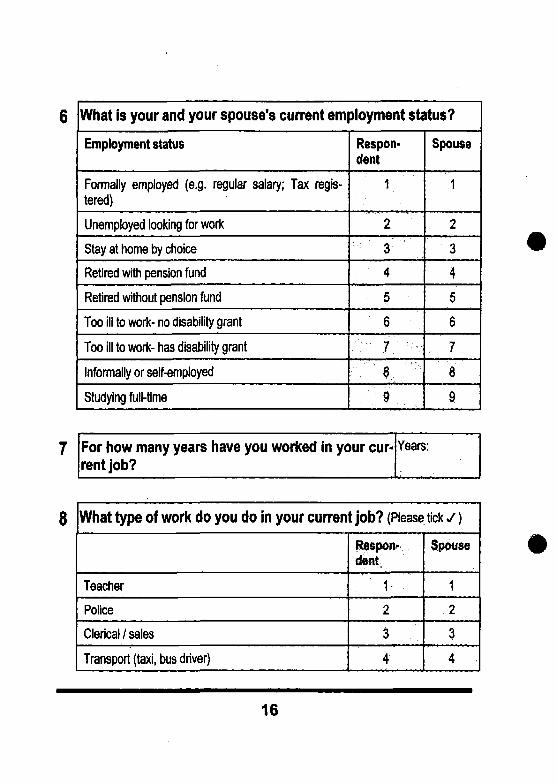
What is your and your spouse's current employment status?
Employment status
Formally employed (e.g. regular salary; Tax regis-tered)
Unemployed looking for work
Stay at home by choice
Retired with pension fund
Retired without pension fund
Too ill to work- no disability grant
Too ill to work- has disability grant
Informally or self-employed
Studying full-time
Respon-dent
' v V: 2
: . . • ; • 3 - . . : ' -
4
5
6
••••':- t ' ~ . ' - ^
\ . 8 •"•'"•
' . : 9 " • . . • . . .
Spouse
1
2
3
4
5
6
7
8
9
For how many years have you worked in your cur*rent job?
Years;
What type of work do you do in your current job? (Please tick s)
Teacher
Police
Clerical / sales
Transport (taxi, bus driver)
Respon-dent
•• .'' 1 .
2
3
4
Spouse
1
2
3
4
16
Tribal Authority
Shop owner
Production / mining
Builder
Other (please specify)
e •
• • 7 . ' • •
•• 5
:,.:6; .-.-
8
9
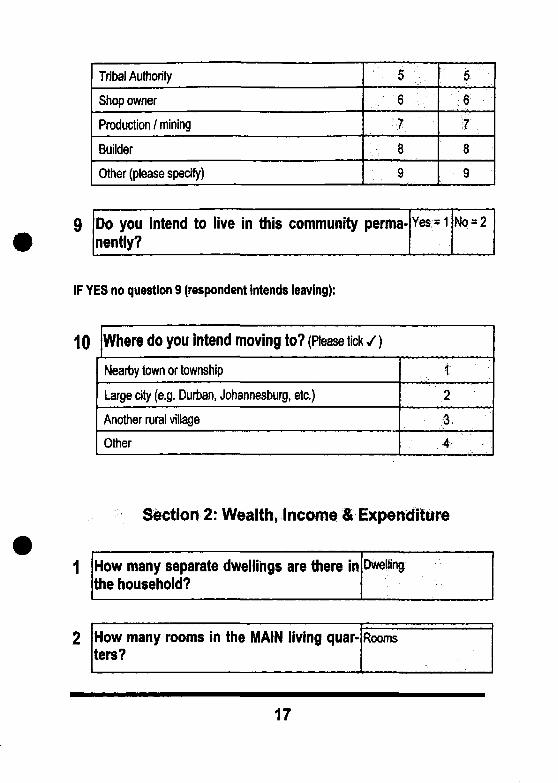
Do you intend to live in this community perma-nently?
Yes - 1 No = 2
IF YES no question 9 (respondent intends leaving):
10 Where do you intend moving to? (Please tick / )
Nearby town or township
Large city (e.g. Durban, Johannesburg, etc.)
Another rural village
Other
2
• : • • • . . * .
...-• . . 4 i : ' ^ !.
Section 2: Wealth, Income & Expenditure
How many separate dwellings are there inthe household?
Dwelling
How many rooms in the MAIN living quar
17
3
4
5
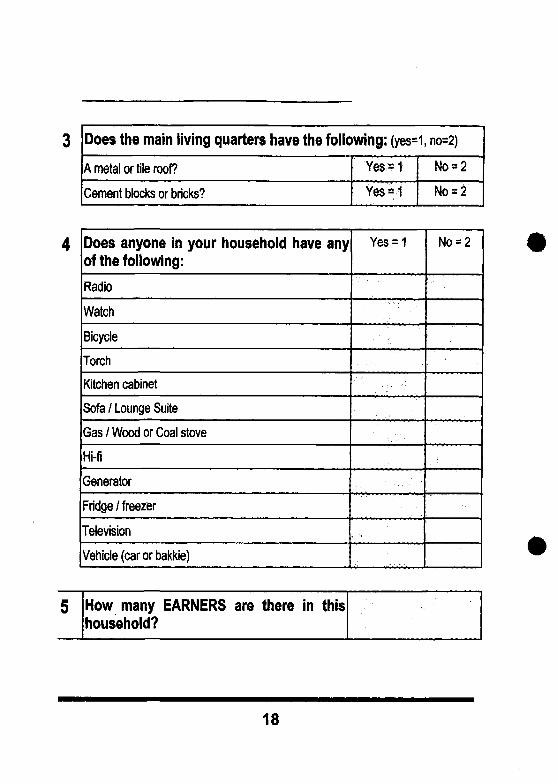
Does the main living quarters have the following: (yes=i
A metal or tile roof?
Cement blocks or bricks?
Yes ~ 1
Yes*1
Does anyone in your household have anyof the following:
Radio
Watch
Bicycle
Torch
Kitchen cabinet
Sofa / Lounge Suite
Gas / Wood or Coal stove
Hi-fi
Generator
Fridge / freezer
Television
Vehicle (car or bakkie)
Yes = 1
• • . • • •
• • , ; . • • . •
: . • ' • . • • . " • :
How many EARNERS are there in thishousehold?
no=2)
No = 2
No = 2
No = 2
18
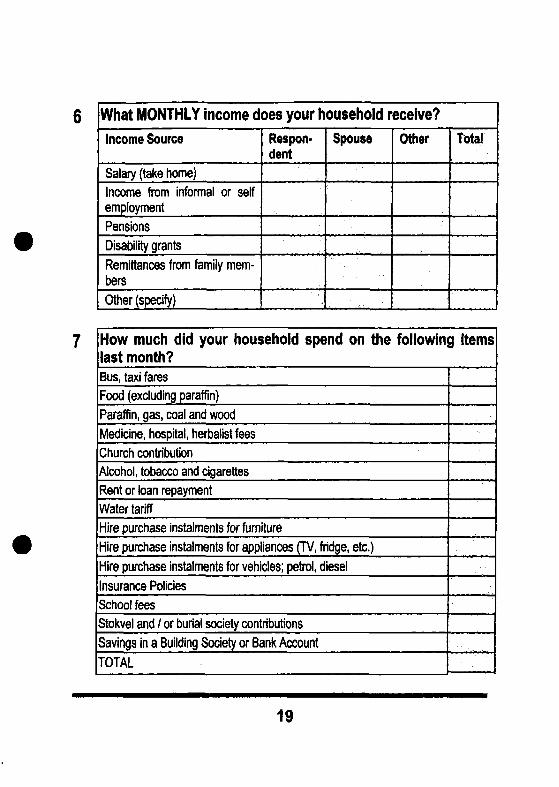
6 What MONTHLY income does your household receive?Income Source
Salary (take home)
Income from informal or selfemployment
Pensions
Disability grants
Remittances from family mem-bers
Other (specify)
Respon-dent
Spouse
. • • • • •
Other Total
How much did your household spend on the following itemslast month?Bus, taxi fares
Food (excluding paraffin)
Paraffin, gas, coal and wood
Medicine, hospital, herbalist fees
Church contribution
Alcohol, tobacco and cigarettes
Rent or loan repayment
Water tariff
Hire purchase instalments for furniture
Hire purchase instalments for appliances (TV, fridge, etc.)
Hire purchase instalments for vehicles; petrol, diesel
Insurance Policies
School fees
Stokvel and / or burial society contributions
Savings in a Building Society or Bank Account
TOTAL
19
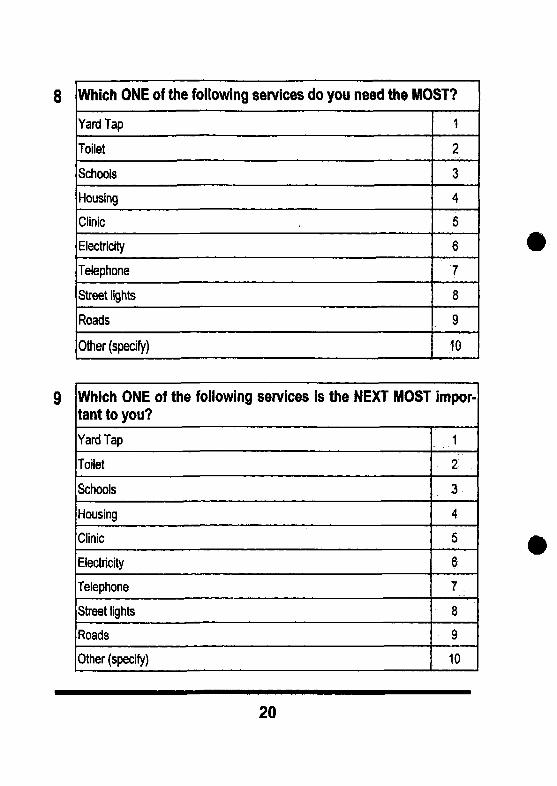
Which ONE of the following services do you need the MOST?
Yard Tap
Toilet
Schools
Housing
Clinic
Electricity
Telephone
Street lights
Roads
Other (specify)
1
2
3
4
5
6
78
9
10
Which ONE of the following servicestant to you?
Yard Tap
Toilet
Schools
Housing
Clinic
Electricity
Telephone
Street lights
Roads
Other (specify)
is the NEXT MOST impor-
1
2 ..
3
4
5
6
1 r
8
9
10
20
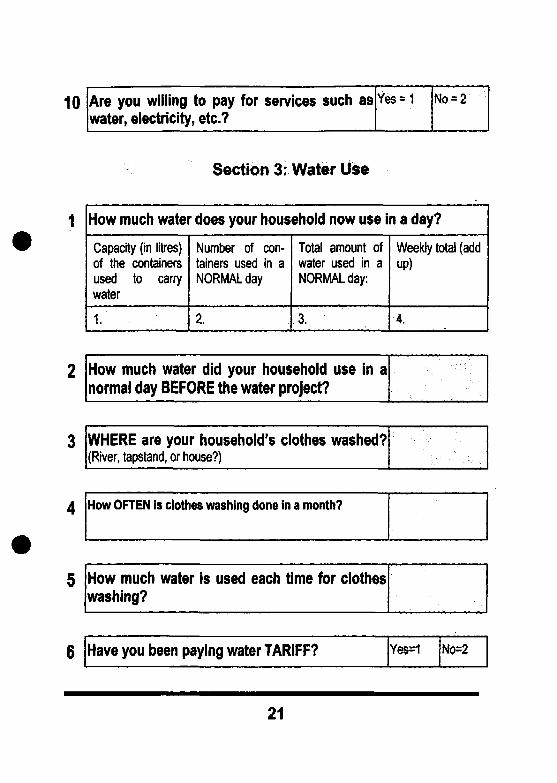
10 Are you willing to pay for services such aswater, electricity, etc.?
Yes = 1 N o - 2
Section 3: Water Use
How much water does your household now use in a day?
Capacity (in litres)of the containersused to canywater
1.
Number of con-tainers used in aNORMAL day
2.
Total amount ofwater used in aNORMAL day:
3.
Weekly total (addup)
4.
How much water did your household use in anormal day BEFORE the water project?
WHERE are your household's clothes washed?(River, tapstand, or house?)
How OFTEN is clothes washing done in a month?
How much water is used each time for clothes
6 Have you been paying water TARIFF? No=2
21
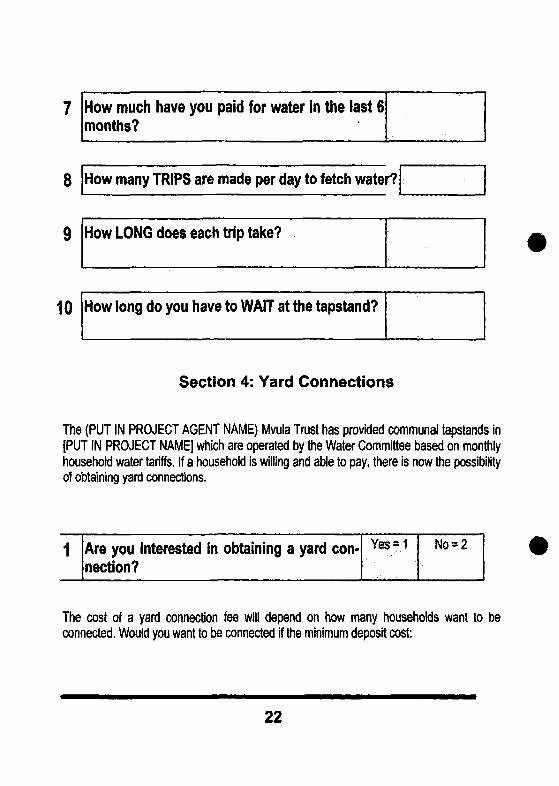
7
8
9
10
How much have you paid for water in the last 6months?
How many TRIPS are made per day to fetch water?
How LONG does each trip take?
How long do you have to WAIT at the tapstand?
Section 4: Yard Connections
The (PUT IN PROJECT AGENT NAME) Mvula Trust has provided communal tapstands in[PUT IN PROJECT NAME] which are operated by the Water Committee based on monthlyhousehold water tariffs. If a household is willing and able to pay, there is now the possibilityof obtaining yard connections.
Are you interested in obtaining a yard con-nection?
No = 2
The cost of a yard connection fee will depend on how many households want to beconnected. Would you want to be connected if the minimum deposit cost:
22
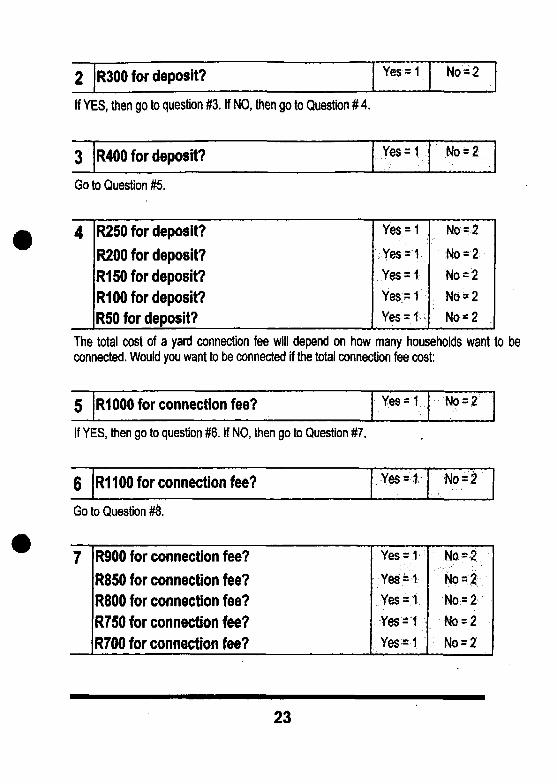
R300 for deposit? Yes-1 No = 2
If YES, then go to question #3. If NO, then go to Question # 4.
3 R400 for deposit? Yes = '
Go to Question #5.
4 R250 for deposit?
R200 for deposit?
R150 for deposit?
R100 for deposit?
R50 for deposit?
Yes = 1
:-.;.YesM,.Yes-1
Y0$ ~ 1
YeS=t:::::
No*2
No = 2
No = 2
No = 2
No* 2
The total cost of a yard connection fee will depend on how many households want to beconnected. Would you want to be connected if the total connection fee cost:
R1000 for connection fee? No-2
If YES, then go to question #6. If NO, then go to Question #7.
6 R1100 for connection fee? •Yes* : * , - No=
Go to Question #8.
7 R900 for connection fee?
R850 for connection fee?
R800 for connection fee?
R750 for connection fee?R700 for connection fee?
Yes-1
YeiMYes-1
Yes*t
..Yes*!-"
...No-3. :
No = 2
No -2
No = 2
23
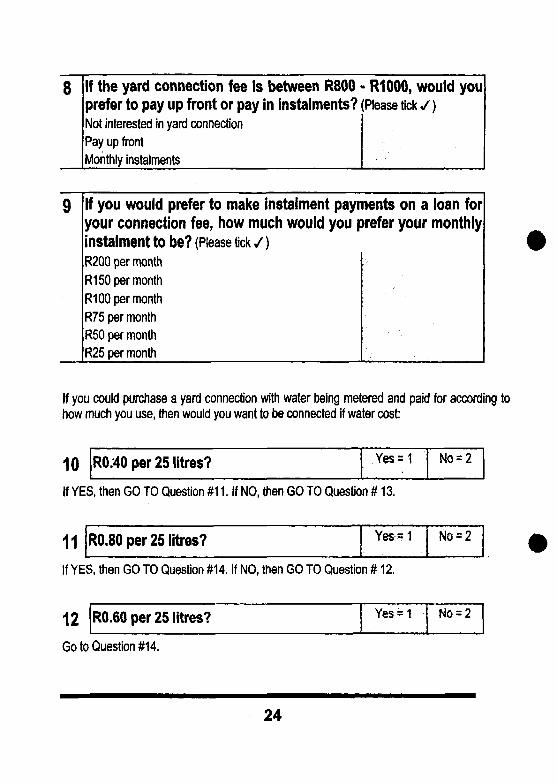
8 If the yard connection fee is between R800 • R1000, would youprefer to pay up front or pay in instalments? (Please tick y )Not interested in yard connection
Pay up front
Monthly instalments ^ ^ ^
9 If you would prefer to make instalment payments on a loan foryour connection fee, how much would you prefer your monthlyinstalment to be? (Please tick / )R200 per month
R150 per month
R100 per month
R75 per month
R50 per month
R25 per month
If you could purchase a yard connection with water being metered and paid for according tohow much you use, then would you want to be connected if water cost:
10 R0.40 per 25 litres?
If YES, then GO TO Question #11.
11 R0.80 per 25 litres?
If YES, then GO TO Question #14.
12 R0.60 per 25 litres?
Go to Question #14.
If NO,
If NO,
then
then
Yes=1
GO TO Question # 13.
Yes = 1
GO TO Question #12.
Yes = 1
No = 2
No = 2
No = 2
24
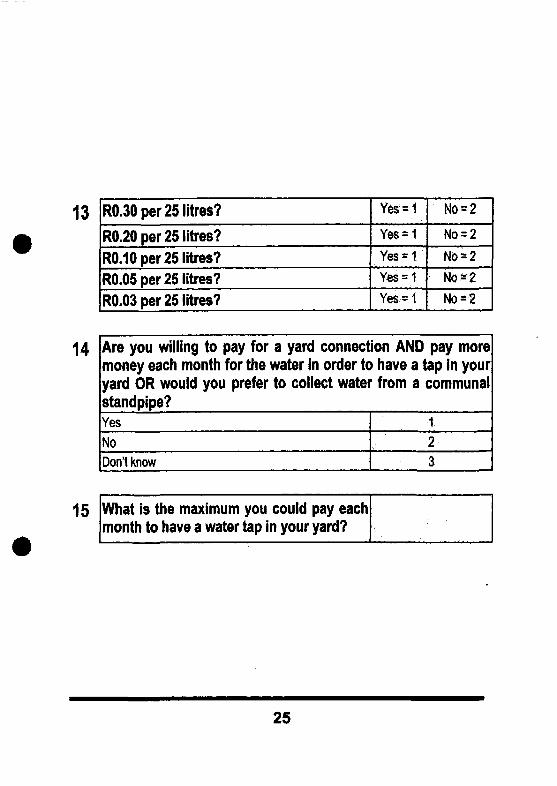
R0.30 per 25 litres?
R0.20 per 25 litres?13 Yes = No =
No-2
R0.10 per 25 litres? Yes * No = 2R0.05 per 25 litres? Yes = 1 No-2
R0.03 per 25 litres? Yes - No - 2
14
15
Are you willing to pay for a yard connection AND pay moremoney each month for the water in order to have a tap in youryard OR would you prefer to collect water from a communalstandpipe?YesNoDon't know
1
3
What is the maximum you could pay eachmonth to have a water tap in your yard?
25
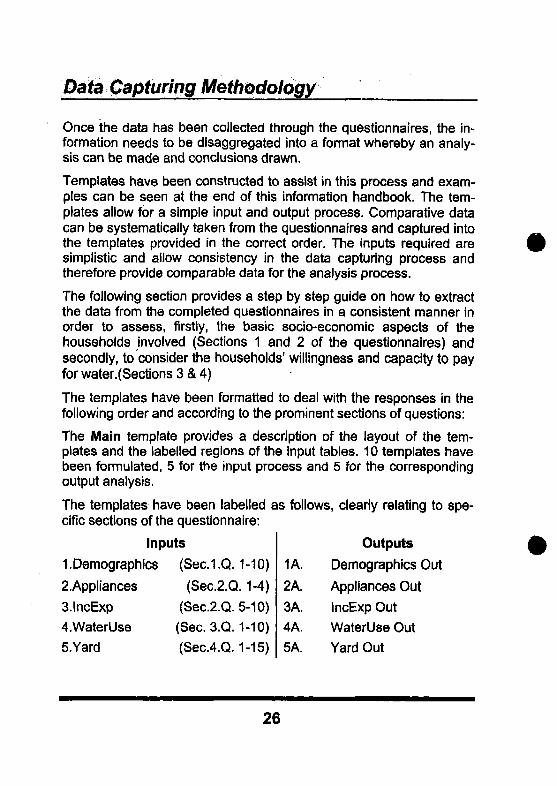
Data Capturing Methodology
Once the data has been collected through the questionnaires, the in-formation needs to be disaggregated into a format whereby an analy-sis can be made and conclusions drawn.
Templates have been constructed to assist in this process and exam-ples can be seen at the end of this information handbook. The tem-plates allow for a simple input and output process. Comparative datacan be systematically taken from the questionnaires and captured intothe templates provided in the correct order. The inputs required aresimplistic and allow consistency in the data capturing process andtherefore provide comparable data for the analysis process.
The following section provides a step by step guide on how to extractthe data from the completed questionnaires in a consistent manner inorder to assess, firstly, the basic socio-economic aspects of thehouseholds involved (Sections 1 and 2 of the questionnaires) andsecondly, to consider the households' willingness and capacity to payfor water.(Sections 3 & 4)
The templates have been formatted to deal with the responses in thefollowing order and according to the prominent sections of questions:
The Main template provides a description of the layout of the tem-plates and the labelled regions of the input tables. 10 templates havebeen formulated, 5 for the input process and 5 for the correspondingoutput analysis.
The templates have been labelled as follows, clearly relating to spe-cific sections of the questionnaire:
Inputs
1 .Demographics
2.Appliances
3.lncExp
4.WaterUse
5.Yard
(Sed.Q.(Sec.2.Q
(Sec.2.Q.
(Sec. 3.Q.
(Sec.4.Q.
1-10)
.1-4)
5-10)
1-10)
1-15)
1A.
2A.
3A.
4A.
5A.
Outputs
Demographics Out
Appliances Out
IncExp Out
WaterUse Out
Yard Out
26
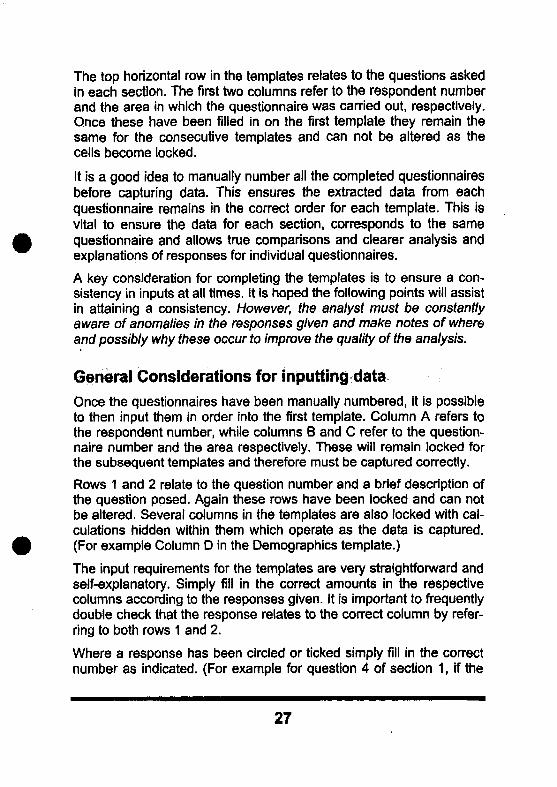
The top horizontal row in the templates relates to the questions askedin each section. The first two columns refer to the respondent numberand the area in which the questionnaire was carried out, respectively.Qnce these have been filled in on the first template they remain thesame for the consecutive templates and can not be altered as thecells become locked.
It is a good idea to manually number all the completed questionnairesbefore capturing data. This ensures the extracted data from eachquestionnaire remains in the correct order for each template. This isvital to ensure the data for each section, corresponds to the samequestionnaire and allows true comparisons and clearer analysis andexplanations of responses for individual questionnaires.
A key consideration for completing the templates is to ensure a con-sistency in inputs at all times. It is hoped the following points will assistin attaining a consistency. However, the analyst must be constantlyaware of anomalies in the responses given and make notes of whereand possibly why these occur to improve the quality of the analysis.
General Considerations for inputting dataOnce the questionnaires have been manually numbered, it is possibleto then input them in order into the first template. Column A refers tothe respondent number, while columns B and C refer to the question-naire number and the area respectively. These will remain locked forthe subsequent templates and therefore must be captured correctly.
Rows 1 and 2 relate to the question number and a brief description ofthe question posed. Again these rows have been locked and can notbe altered. Several columns in the templates are also locked with cal-culations hidden within them which operate as the data is captured.(For example Column D in the Demographics template.)
The input requirements for the templates are very straightforward andself-explanatory. Simply fill in the correct amounts in the respectivecolumns according to the responses given. It is important to frequentlydouble check that the response relates to the correct column by refer-ring to both rows 1 and 2.
Where a response has been circled or ticked simply fill in the correctnumber as indicated. (For example for question 4 of section 1, if the
27
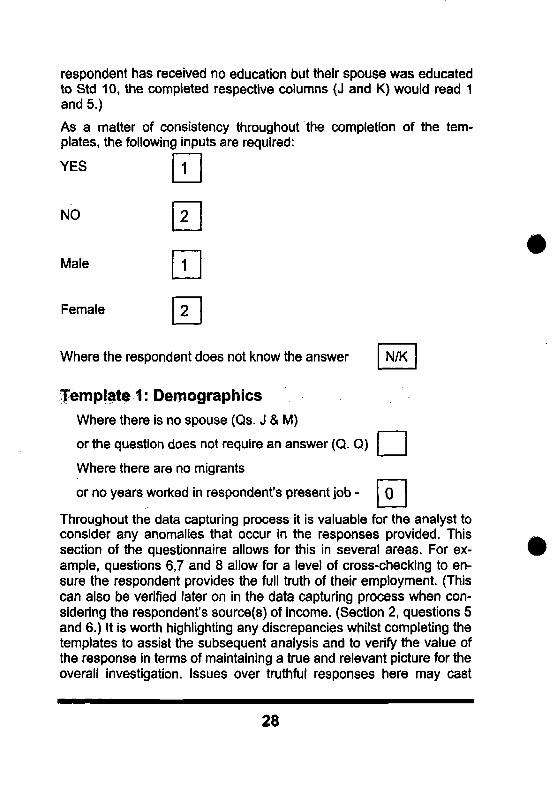
respondent has received no education but their spouse was educatedto Std 10, the completed respective columns (J and K) would read 1and 5.)
As a matter of consistency throughout the completion of the tem-plates, the following inputs are required:
YES 1
NO
Male
Female
N/K
0
Where the respondent does not know the answer
Template 1: DemographicsWhere there is no spouse (Qs. J & M)
or the question does not require an answer (Q. Q)
Where there are no migrants
or no years worked in respondent's present job -
Throughout the data capturing process it is valuable for the analyst toconsider any anomalies that occur in the responses provided. Thissection of the questionnaire allows for this in several areas. For ex-ample, questions 6,7 and 8 allow for a level of cross-checking to en-sure the respondent provides the full truth of their employment. (Thiscan also be verified later on in the data capturing process when con-sidering the respondent's source(s) of income. (Section 2, questions 5and 6.) It is worth highlighting any discrepancies whilst completing thetemplates to assist the subsequent analysis and to verify the value ofthe response in terms of maintaining a true and relevant picture for theoverall investigation. Issues over truthful responses here may cast
28
doubt over the subsequent responses in the second part of the ques-tionnaire referring to the willingness and capacity to pay for water.
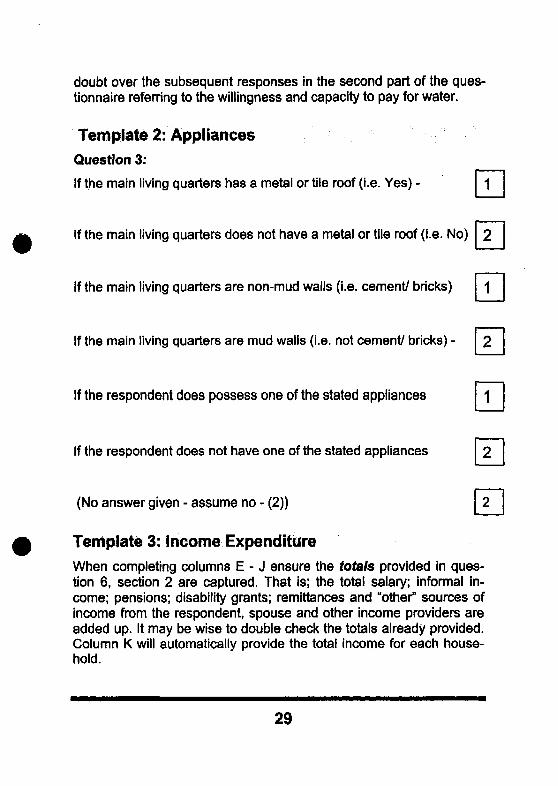
Template 2: Appliances
Question 3:
If the main living quarters has a metal or tile roof (i.e. Yes) -
If the main living quarters does not have a metal or tile roof (i.e. No)
If the main living quarters are non-mud walls (i.e. cement/ bricks)
If the main living quarters are mud walls (i.e. not cement/ bricks) -
If the respondent does possess one of the stated appliances
If the respondent does not have one of the stated appliances
(No answer given - assume no - (2))
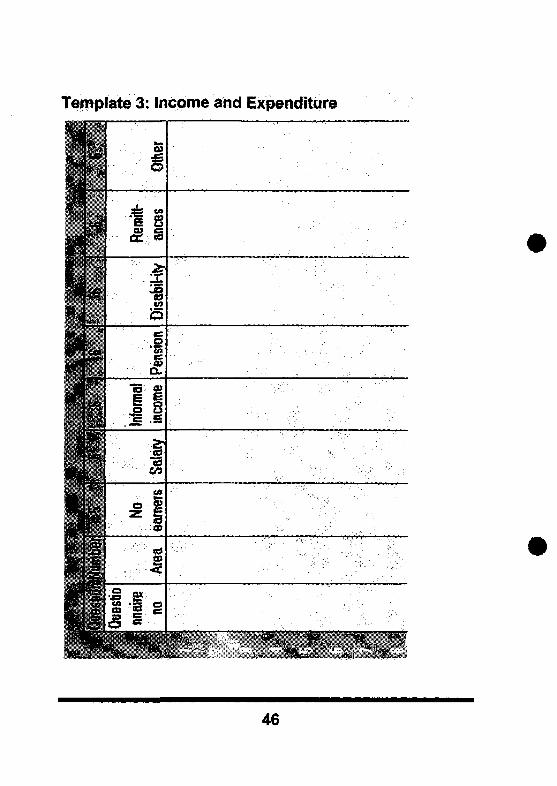
Template 3: Income Expenditure
When completing columns E - J ensure the totals provided in ques-tion 6, section 2 are captured. That is; the total salary; informal in-come; pensions; disability grants; remittances and "other" sources ofincome from the respondent, spouse and other income providers areadded up. It may be wise to double check the totals already provided.Column K will automatically provide the total income for each house-hold.
29
Again, it is important to refer back to the responses provided in tem-plate 1, in terms of the employment identified by the respondent forthemselves and their spouse. It may be apparent that informal in-comes are not noted in the first part of the questionnaire.
In completing columns L - Z ensure to insert the correct amount pro-vided. Also be aware of the fact that often the responses may begiven in terms of totals for the whole year, although the question re-quires a monthly figure. As such the analyst should calculate themonthly figure from the response provided. This is frequently the casewith column X, referring to expenditure on school fees. The inter-viewer should indicate on relevant questionnaires, the figure providedas a yearly total, otherwise discretion is required in inputting the re-sults to ensure the output is not severely skewed.
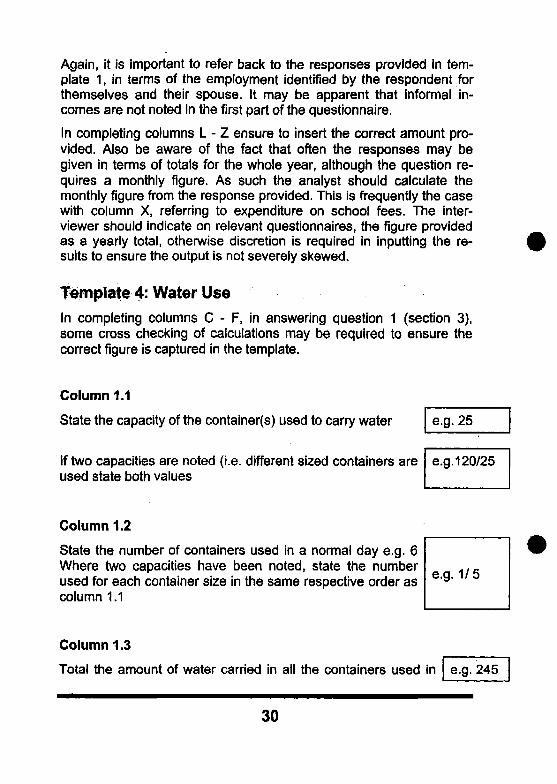
Template 4: Water UseIn completing columns C - F, in answering question 1 (section 3),some cross checking of calculations may be required to ensure thecorrect figure is captured in the template.
Column 1.1
State the capacity of the container(s) used to carry water
If two capacities are noted (i.e. different sized containers areused state both values
Column 1.2
State the number of containers used in a normal day e.g. 6Where two capacities have been noted, state the number 1 / 5
used for each container size in the same respective order as e ' 9 'column 1.1
e
e
•g-
•g-
25
120/25
Column 1.3
Total the amount of water carried in all the containers used in
30
e.g. 245
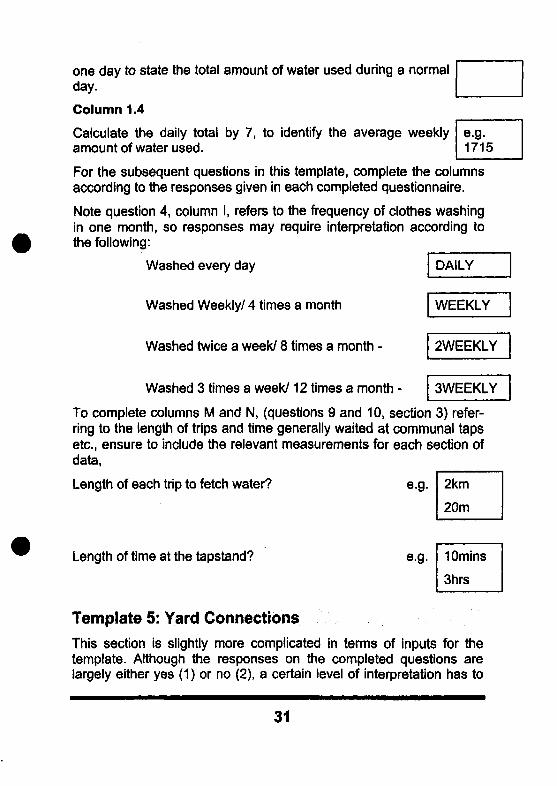
one day to state the total amount of water used during a normalday.
Column 1.4
Calculate the daily total by 7, to identify the average weeklyamount of water used.
e.g.1715
For the subsequent questions in this template, complete the columnsaccording to the responses given in each completed questionnaire.
Note question 4, column I, refers to the frequency of clothes washingin one month, so responses may require interpretation according tothe following:
Washed every day DAILY
Washed Weekly/ 4 times a month WEEKLY
Washed twice a week/ 8 times a month -
Washed 3 times a week/12 times a month -
2WEEKLY
3WEEKLY
To complete columns M and N, (questions 9 and 10, section 3) refer-ring to the length of trips and time generally waited at communal tapsetc., ensure to include the relevant measurements for each section ofdata,
Length of each trip to fetch water?
Length of time at the tapstand?
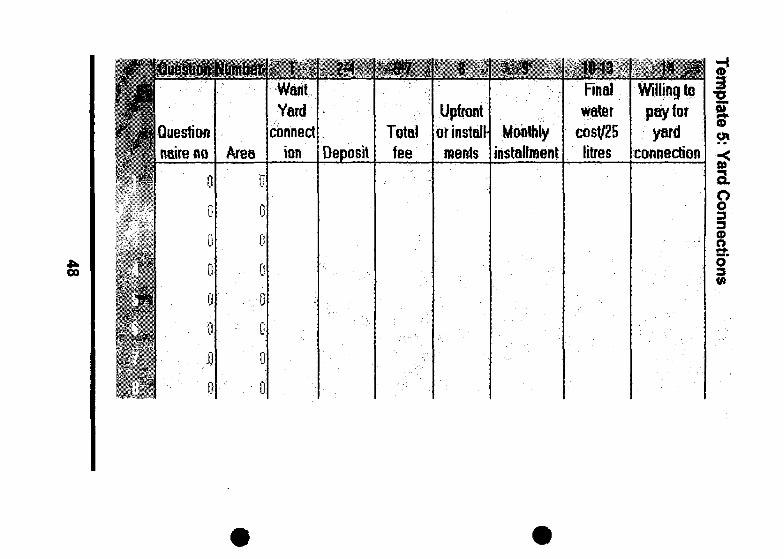
Template 5: Yard ConnectionsThis section is slightly more complicated in terms of inputs for thetemplate. Although the responses on the completed questions arelargely either yes (1) or no (2), a certain level of interpretation has to
31
e.g.
e.g.
2km
20m
10mins
3hrs
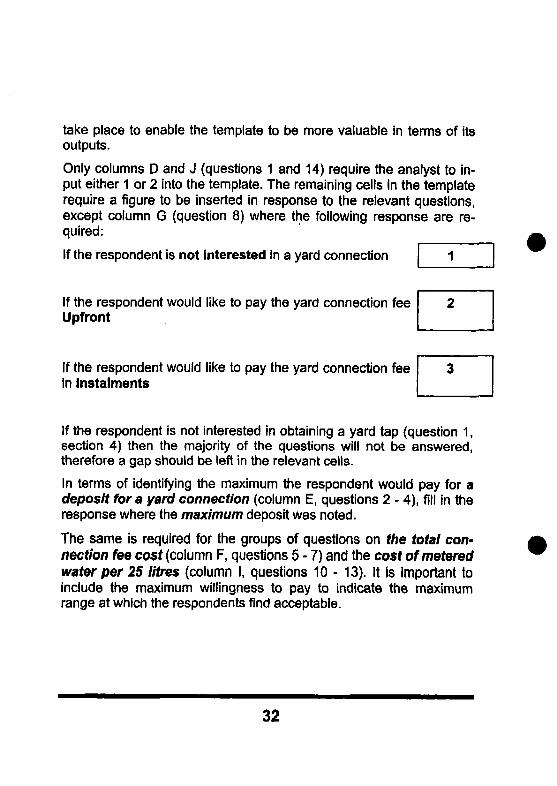
take place to enable the template to be more valuable in terms of itsoutputs.
Only columns D and J (questions 1 and 14) require the analyst to in-put either 1 or 2 into the template. The remaining cells in the templaterequire a figure to be inserted in response to the relevant questions,except column G (question 8) where the following response are re-quired:
If the respondent is not interested in a yard connection 1
If the respondent would like to pay the yard connection feeUpfront
If the respondent would like to pay the yard connection feein Instalments
If the respondent is not interested in obtaining a yard tap (question 1,section 4) then the majority of the questions will not be answered,therefore a gap should be left in the relevant cells.
In terms of identifying the maximum the respondent would pay for adeposit for a yard connection (column E, questions 2 - 4), fill in theresponse where the maximum deposit was noted.
The same is required for the groups of questions on the total con-nection fee cost (column F, questions 5 - 7) and the cost ofmeteredwater per 25 litres (column I, questions 10 - 13). It is important toinclude the maximum willingness to pay to indicate the maximumrange at which the respondents find acceptable.
32
Analysis: Contingent Valuation Methodology
IntroductionTo analyse the data, the templates provided must be considered inorder and cross-analysed with each other. It is important to ensure theoutput templates have correctly completed the quantitative dataanalysis within the tables. If the output templates appear incompleteor have not produced interpretable data check the inputs are correctwith reference to the previous section.
Once the quantitative data has been captured correctly, the first stageof the analysis is to identify the sample size taken in relation to thecommunity size under investigation. That is to identify the percentageof the community surveyed.
Secondly, it is important to highlight any pertinent issues relating tohow/ where the survey was undertaken. For example, was it neces-sary to hold a community meeting to inform people of the aims of thesurvey and to alleviate fears or mistrusts of the interviewers or theoutcomes of the survey. Such information can be received from thesocial researchers themselves in the form of qualitative data.
The output templates should be taken and analysed in order and ac-cording to the questions they relate to. However, clearly the re-sponses require cross-checking for accuracy in responses providedand also for purposes of cross-analysis for comparative considera-tions over certain issues and factors. The following points could beused as an indication of what the output templates indicate and wherecross-checking/ analysis could take place in order to consider the di-rect and indirect implications on capacity and willingness to pay forwater. This needs to be done after each section has been completed.
Throughout the analysis process the analyst should keep in mind thepoints noted during the data capturing procedure. For example, wherecontradictions occurred and anomalies in either whole or part datasets received from each are under investigation.
33
Template 1A: Demographics Out (Sec 1: Demograph-ics) •••••••• ;• " .••••;. ! .•:-.-• •••.:,.. " ...:•••- :/': • ;
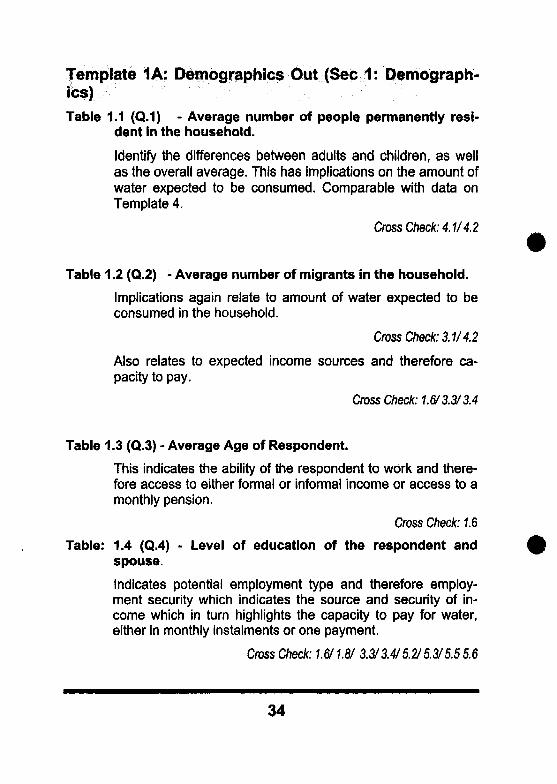
T a b l e 1 . 1 ( Q . 1 ) - A v e r a g e n u m b e r o f p e o p l e p e r m a n e n t l y r e s i -d e n t i n t h e h o u s e h o l d .
Identify the differences between adults and children, as wellas the overall average. This has implications on the amount ofwater expected to be consumed. Comparable with data onTemplate 4.
Cross Check: 4.1/4.2
Table 1.2 (Q.2) - Average number of migrants in the household.
Implications again relate to amount of water expected to beconsumed in the household.
Cross Check: 3.1/4.2
Also relates to expected income sources and therefore ca-pacity to pay.
Cross Check: 1.6/3.3/3.4
Table 1.3 (Q.3) * Average Age of Respondent.
This indicates the ability of the respondent to work and there-fore access to either formal or informal income or access to amonthly pension.
Cross Check: 1.6
Table: 1.4 (Q.4) - Level of education of the respondent andspouse.
Indicates potential employment type and therefore employ-ment security which indicates the source and security of in-come which in turn highlights the capacity to pay for water,either in monthly instalments or one payment.
Cross Check: 1.6/1.8/ 3.3/3.4/5.2/5.3/5.5 5.6
34
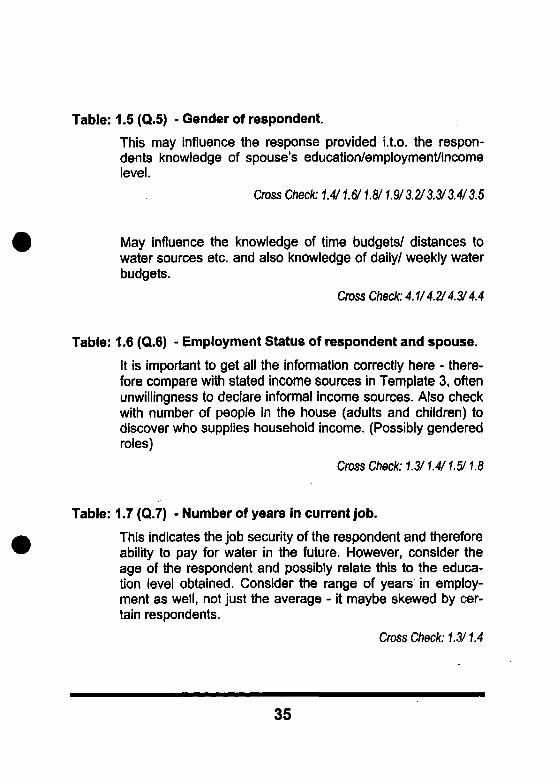
Table: 1.5 (Q.5) - Gender of respondent.
This may influence the response provided i.t.o. the respon-dents knowledge of spouse's education/employment/incomelevel.
Cross Check: 1.411.& 1.8/1.9/3.2/3.3/3.4/3.5
May influence the knowledge of time budgets/ distances towater sources etc. and also knowledge of daily/ weekly waterbudgets.
Cross Check: 4.1/4.2/4.3/4.4
Table: 1.6 (Q.6) - Employment Status of respondent and spouse.
It is important to get all the information correctly here - there-fore compare with stated income sources in Template 3, oftenunwillingness to declare informal income sources. Also checkwith number of people in the house (adults and children) todiscover who supplies household income. (Possibly genderedroles)
Cross Check: 1.3/1.4/1.5/1.8
Table: 1.7 (Q.7) • Number of years in current job.
This indicates the job security of the respondent and thereforeability to pay for water in the future. However, consider theage of the respondent and possibly relate this to the educa-tion level obtained. Consider the range of years in employ-ment as well, not just the average - it maybe skewed by cer-tain respondents.
Cross Check: 1.3/1.4
35
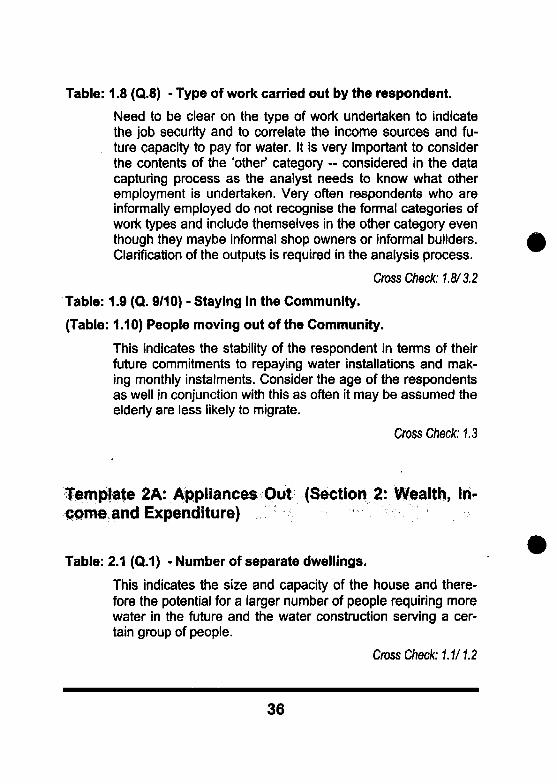
Table: 1.8 (Q.8) - Type of work carried out by the respondent.
Need to be clear on the type of work undertaken to indicatethe job security and to correlate the income sources and fu-ture capacity to pay for water. It is very important to considerthe contents of the 'other' category - considered in the datacapturing process as the analyst needs to know what otheremployment is undertaken. Very often respondents who areinformally employed do not recognise the formal categories ofwork types and include themselves in the other category eventhough they maybe informal shop owners or informal builders.Clarification of the outputs is required in the analysis process.
Cross Check: 1.8/3.2
Table: 1.9 (Q. 9/10) - Staying In the Community.
(Table: 1.10) People moving out of the Community.
This indicates the stability of the respondent in terms of theirfuture commitments to repaying water installations and mak-ing monthly instalments. Consider the age of the respondentsas well in conjunction with this as often it may be assumed theelderly are less likely to migrate.
Cross Check: 1.3
Template 2A: Appliances Out (Section 2: Wealth, In-come and Expenditure)
Table: 2.1 (Q.1) - Number of separate dwellings.
This indicates the size and capacity of the house and there-fore the potential for a larger number of people requiring morewater in the future and the water construction serving a cer-tain group of people.
Cross Check: 1.1/1.2
36
Table: 2.2 (Q.2) - The size of the main living quarters.
Again this indicates the potential for the household size to in-crease in the future and also indicates a suitable water sys-tem for the household, if they agree to the payment require-ments.
Table: 2.3 (Q.3) - The structure of the roof/ walls of the dwelling.
This indicates the capacity of the dwelling to support and in-corporate certain water systems if they were to be constructedon the site. It also indicates the availability of finance in thepast for upgrading on the property which may indicate thelevel of surplus income available for certain water systems/appliances.
Table:2.4 (Q.4) - Appliances in the household.
This indicates the wealth expenditure on certain consumableitems as well as necessities within the household in the pastand also indicates the availability of funds in the past. Can becorrelated with the monthly expenditure analysis per house-hold.
Cross Check: 3.5
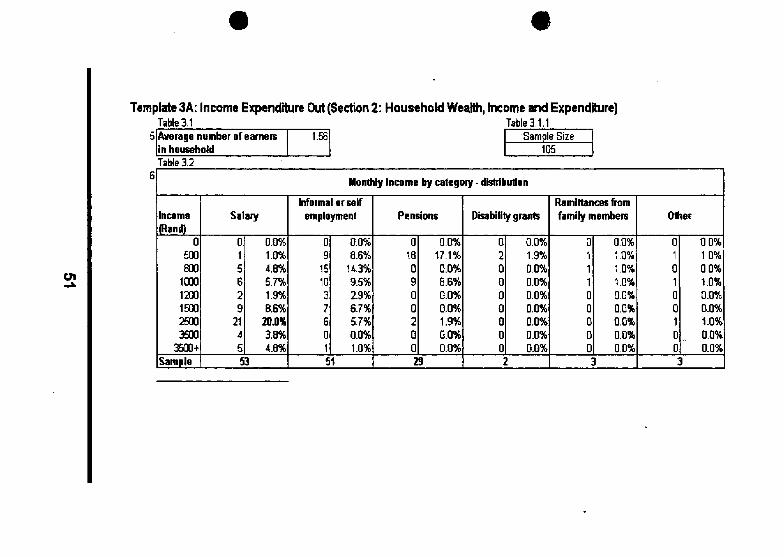
Template 3A: income Expenditure Out (Section 2:Wealth, Income and Expenditure)
Table: 3.1 (Q.5) - Number of earners in the household.
The average figure must be greater than 1 for a stable house-hold to survive. Can also correlate outputs here with previousconsiderations of employment for the respondent and theirspouse.
Cross Check: 1.6
37
Table: 3.2 (Q.6) - Income according to category and Rand.
This indicates the level of formal salary and informal incomeinto the household and into what income category in terms ofRand it on average falls into. This table also allows consid-eration of pensions and disability grants (often these shouldbe fixed around a specific figure as these are governmentfixed). The accuracy of the results can be correlated with ear-lier discussions on the respondents and spouse's employ-ment and income sources.
Cross Check: 1.6/1.8
Table: 3.3 (Q.6) - Monthly income combined.
This represents in specific categories (according to Rand permonth) where the majority respondents fall. It is important torecognise the norm for the majority but at the same time it isimportant to consider the distribution between the highest andlowest income levels. The community will rarely be homoge-nous, and it is important to consider broader capacity to payfor water/ installments etc.
Cross Check: 5.2/5.3/5.5/5.6
Table: 3.4 (Q.6) - Average income split Into categories.
This indicates the amounts, on average, earned each monthfrom a variety of sources. This can help indicate the total in-come for households which identify specific sources of in-come each month - though again the range of responsesmust be considered.
Table: 3.5 (Q.7) - Household Expenditure.
This can correlate the appliances in the household andtherefore the expected monthly expenditure on basic require-ments and consumables. Can also correlate information re-ceived regarding payment for water elsewhere in the survey,it must also be noted to take care in the figures supplies tothis part of the questionnaire. For example, ensure the
38

monthly payments into savings schemes is supplied ratherthan the total amount already in the savings account. Also,ensure a monthly figure is provided for school fees and notthe annual figure.
Cross Check: 2.4/4.3/4.4
Table: 3.6 (Q.8/9) - Services needed: 1" and 2nd priorities.
This assists in the independent identification of the need foron-site water service (a yard tap, etc.). Can correlate with theresponse given in terms of the 'interest' in obtaining a yardconnection.
Cross Check: 5.1
Table: 3.7 (Q.10) - Willingness to pay for services.
This also requires an independent response to a yes/noquestion regarding the willingness to pay for water. Can becorrelated with subsequent questions on the 'extent' of thewillingness to pay.
Cross Check: 5.1/5.2/5.3/5.5/5.6
Template 4A: Water Use Out (Section 3: Water Use)
Table 4.1 (Q.1.3) - Total amount of water used in a normal day.
Table 4.2 (Q.1.4) - Total amount of water used in a normal week.
As well as considering the average figure in answer to thisquestion it is also relevant to consider the range to responsesand to correlate this range with the range if household sizes -this therefore indicates the range of demand for water con-nections and also have implications on the cost of the wateretc., in terms of engineering purposes. Must also consider thegender of the respondent in order to identify the level of trust
39
the response can have in terms of the level of accurateknowledge the respondent may have.
Cross Check: 1.5
Table 4.3 (Q.6) . Water Tariffs been paid?
Can be correlated according to the gender of the respondentand other responses along similar lines, such as monthlyhousehold expenditure.
Cross Check: 1.5/3.5
Table 4.4 (Q.7) - How much has been paid in the last 6 months.
If this is relevant, the responses can indicate the respondentspast willingness to pay and also their capacity to pay in previ-ous months.
Cross Check: 3.5
Template 5A: Yard Out (Section 4: Yard Connections)
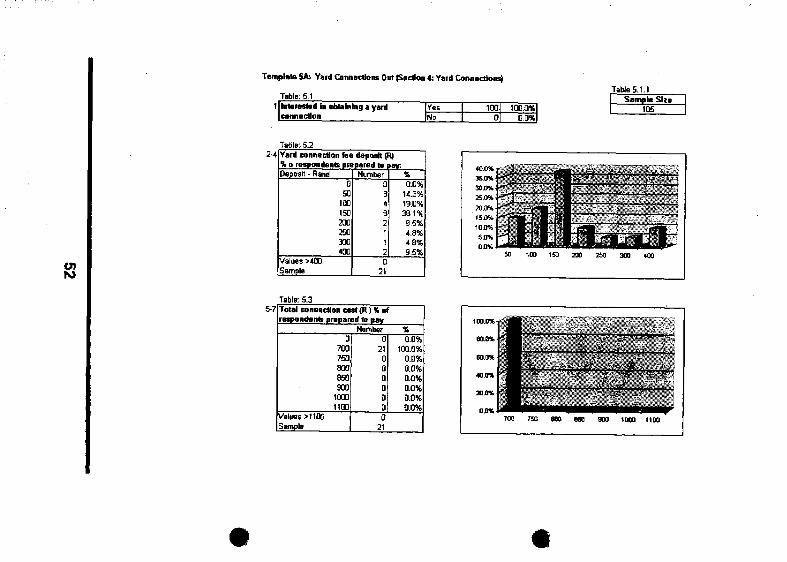
Table: 5.1 (Q.1) - Interested in obtaining a yard connection.
Correlates with previous questions on acceptance level of ayard connection. Plus it indicates the percentage of the overallrespondents who answered the subsequent section on theextent of this willingness to pay.
Cross Check: 3.7
40
Table: 5.2 (Q.2/4) - The percentage of respondents willing to paya certain amount for a yard connection fee.
The response here can be related to the average income permonth, plus the stability of the respondents employment (interms of formal employment). Again it is very important toconsider the distribution of responses, that is the minimumand maximum respondents are willing to pay and relate this tothe distribution of income categories in the sample taken.
Cross Check: 1.6/3.3
Table: 5.3 (Q. 5/7) - The percentage of respondents prepared topay a specific amount for the total connection cost.
It is important to relate the average figure (and the minimumand maximum figures) to the average income per month (andto the distribution of income per month within the sample).
Cross Check: 3.2/3.3
Table: 5.4 (Q. 8) • Preferred payment method if connection fee isbetween R800 and R1000
This relates to the previous table on the amount prepared topay for the total connection cost. But it is important to recog-nise the willingness to pay either upfront or in instalments, asthe response maybe socially/ culturally constructed andtherefore culturally dependent.
Table: 5.5 (Q.9) • Percentage of respondents willing to pay spe-cific amounts in instalments for loan for connection fee.
This is a vital part of the questionnaire in discovering the will-ingness in comparison to the capacity of the respondents topay for water. According to international research, there is ageneral willingness to spend 5% of households monthly in-come on water. Therefore, there is a need to calculate 5% of
41
the average income earned for the majority. Then calculatethe 5% of income for the lowest income earners. The resultingfigures must them be correlated with the willingness to paycertain amounts within this table of responses. In other words,the analyst must compare the willingness to pay monthly in-stallments with the capacity to pay.
Cross Check: 3.3
Table: 5.6 (Q.10/13) - The number of respondents prepared to payfor metered water.
It is important to consider the distribution of responses as wellas the average figure respondents are prepared to pay for.Compare the willingness to pay a specific amount per litrewith the number of litres consumed within different householdsizes.
Cross Check: 1.1/1.2/4.114.2
42
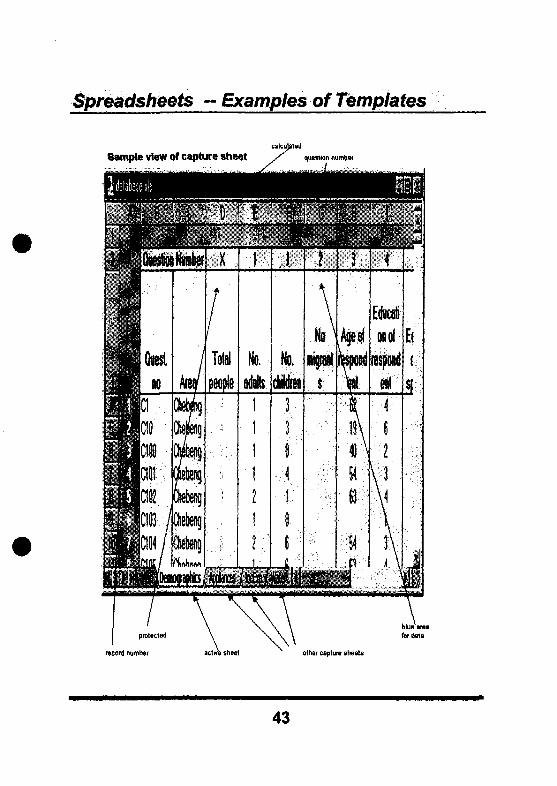
Spreadsheets ~ Examples ofTemplates
Sample view of capture sheet
protectedI
record number acti
blue'for data
othar capture sheets
43
Educationof
respondent
HOf
" i " 5
ISofjSnBlT
Questionitaire no
u
ft
10
0
')
Li
Area
fi
0
c0
-
Q
No ofseparatedwellings
Rooms inmainhouse
BSftMetalroof
Non-mudwalls Radion Watch
*££
Bicycle
i
oID
Template 3: Income and Expenditure
46

Template 4: Water Use
47
00
%
. < • ' • % .
•••" ; f f l
Quezon Number.
Questionnaireno
0
0
0
0
0
•I:: Q
Area
'••• o
0
o0
0
1 ' , -WantYard
connedion Deposit
Totalfee
'• 8 ,;
Upfrontor install-ments
%& -
Monthlyinstallment
; 19-13Finaiwater
litres
• ! "PI M
Willing topay foryard
connection
i•D
i
oo39
s5*
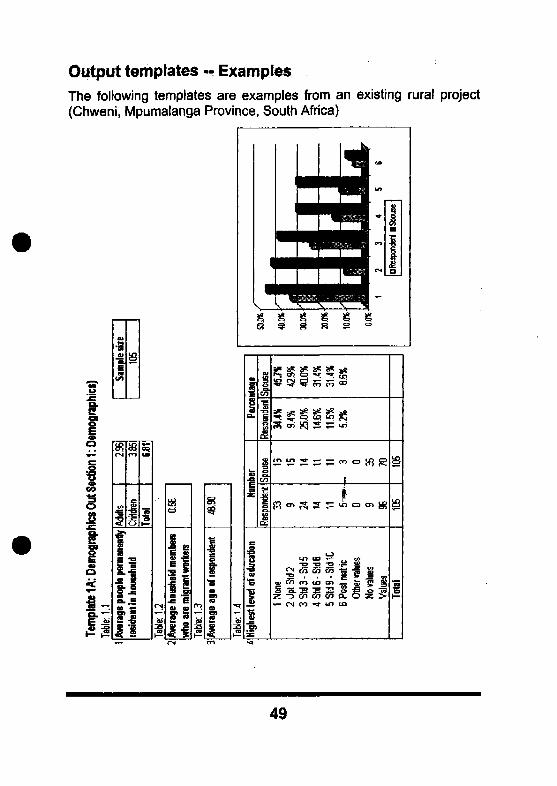
Output templates -- ExamplesThe following templates are examples from an existing rural project(Chweni, Mpumalanga Province, South Africa)
(V
S&•so
o
i
|
IIII
—̂ oi en ^* ts> to
ffi
49

Template 2A: Appliances Out (Section 2: Household Wealth, Income and Expenditure)
Dwelling and Appliances
Table:2.1Average number of separatedwell inns _ _ ^
1.74 Sample Size106
Table:2.22 Average number of rooms In
main living quarters4.97!
Tab!e:2.33 Structure of main living quartets
Metal or tile roof
Cement blocks or bricks
YesNoYesNo
Number
1032
1050
%
98.1%1.9%
100.D%0.0%
Appliances in household
RadioWatchBicycleTorchKitchen cabinetSofa/Lounge SuiteGas, wood or coal stoveHi-fiGeneratorTVVehicle
Number
101981528856487425
7525
%
96.2%93.3%14.3%26.7%81.0%61.0%82.9%40.0%4.8%
71.4%23.8%
1 2 3 4 5 6 7 8 9 10 11
Template 3A: Income Expenditure Out (Section 2: Household Wealth, Income and Expenditure)Table 3.1 Table3.1.1
5 Average number of earnersin household
1.56 Sample Size105
Table 3.2
Income(Rand)
0500800
10001200150025003500
3500+Sample
Salary
015629
2145
0.0%1.0%4.6%5.7%1.9%8.6%
2QJ0%3.8%4.6%
53
Monthly income
Informal or selfemployment
09
151037601
0.0%8.6%
14.3%9.5%2.9%6.7%5.7%0.0%1.0%
51
by category - distribution
Pensions
0160900200
0.0%17.1%0.0%8.6%0.0%0.0%1.9%0.0%0.0%
29
Disability grants
020000000
0.0%1.9%0.0%0.0%0.0%0.0%0.0%0.0%0.0%
2
Remittances fromfamily members
01110000
L 0
0.0%1.0%1.0%1.0%0.0%0.0%0.0%0.0%0.0%
3
Other
010100100
0.0%1.0%0.0%1.0%0.0%0.0%1.0%0.0%0.0%
3
Template SA; Yard ConnectloiK Out (Sedhtn 4: Yard Connections)
Table: 51Table 5.1.1
1 Interested in obtaining a yardconnection
Yes 100-0
tOO.0%0 0%
Sample Site105
UIto
TablB:5.2Yard connection tea deposit (R)% a respondents prepared t e iDeposit - Rand
050
100150200250300400
Values >400Sample
Number034
e2i12
wv:%0.0%
14.3%19.0%38.1%9.5%4.8%4.8%9.5%
021
Table: 5.35-7 Total connection cast (R) % ol
respondents prepared to payNumber %
a700750800850900
10001100
Values >1100Sample
0210000000
21
0.0%100.0%
0.0%0.0%0.0%0.0%0.0%0.0%
100.0%
eo.o%
$0 0%
•0.0%
200%
0,0%
i111TOO
f
TSO 600 850 900
-
•".*.•
aHai(000
- • •
-
• \ - -f •
mmrttoo

. . , * * •
t£chniCLJLI
p t i a
Technical Options
Four generic groups of promising approaches can be considered inorder to provide on-site (higher levels) water of services whilst ensur-ing that cost recovery is simultaneously addressed:
1. Yard connections with pre-paid meters. These could be comple-mented by communal pre-paid meters for that section of thepopulation, which cannot afford private connections.
2. Yard connections with conventional metering and billing systems.
3. Yard connections leading to individual storage tanks with an eq-uity valve or trickle feed inlet as well as an accompanying billings y s t e m . . ••• .. :....
:
4 . Yard connections leading to individual storage tanks with the sup-ply controlled from a manifold supplying a cluster of other home-steads. The manifold typically houses a series of valves for eachtank as well as a metering system. A billing system is also re-quired.
In evaluating all of the above, it is worth noting that current South Afri-can Department of Water Affairs and Forestry policy together with theWater Services Act No 108 of 1997, state that government will providegrant subsidies only to cater for shared infrastructure as well as com-munal standpoints (RDP standards discussed at the onset of thismanual). Additional infrastructure costs to provide yard connectionsand higher levels of service have to be borne by the home-owner ei-ther through cash payments or structured loans collectively, organisedby the community from financial institutions where normal credit appli-cation procedures are utilised.
53
1. Pre-Paid Meters
Pre-paid meter technology now provides commercially availablechoices such as small meters, which can be installed in each home-stead as a direct replacement to conventional meters. Communal pre-paid meters would then be installed for the section of the populationwhich could not afford private connections. A computer based data-base management system is then generally used to help manage thecost recovery operation. The computer is typically equipped with atoken re-charge port to provide new credit depending on amountstendered.
2. Conventional Metering
Conventional yard connections with a metering and billing system willcontinue to be an option for certain communities. Their applicabilitywill depend on the level of economic and institutional development ofthe community concerned. A fair amount of institutional infrastructureis also needed to make this option to be viable such as meter readers,a data capture and management system, an invoicing and billingsystem, etc.
3. Equity Valve or Trickle Feed
Trickle feed systems are based on yard connections which lead tosmall individual tanks in every homestead. The tanks are placed in anelevated position either on a dedicated stand or on the roof of ahouse. Homesteaders can be given a choice on the tank size, e.g.,200I or 500I depending on the need. A flat monthly rate is frequentlycharged depending on the tank size. Water into the tank is governedby an orifice valve which lets in water at a trickle flow rate (hence thename). The system, therefore, assists in "flattening" out peak demandon the supply system as water trickles in over a 24 hour period. Thissystem is flexible as bigger tanks can progressively be installed with awider orifice valve as water demand grows.
54
4. Manually Filled Individual Storage Tanks
Similarly to the trickle feed concept above, yard connections can beprovided with individual storage tanks of various sizes for everyhomestead. Clusters of tanks/homesteads in this instance are sup-plied from a single manifold which is controlled by a single water ven-dor. In this case, individual pipes are fed via a valve, which is openedand closed by the vendor/operator depending on the payment statusof the consumer household. A float switch is used to close off water toprevent it from overflowing. Like the trickle feed system, this system isalso flexible and is promoted as useful in creating job opportunities.
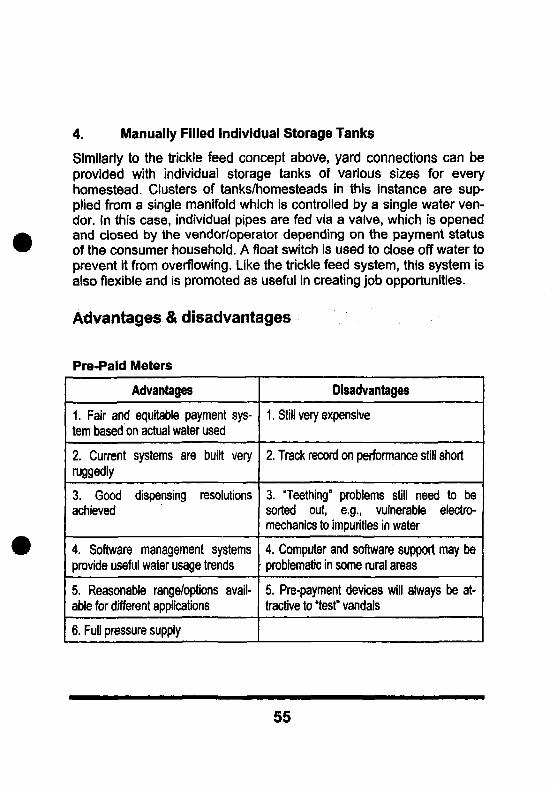
Advantages & disadvantages
Pre-Pald Meters
Advantages
1. Fair and equitable payment sys-tem based on actual water used
2. Current systems are built veryruggedly
3. Good dispensing resolutionsachieved
4. Software management systemsprovide useful water usage trends
5. Reasonable range/options avail-able for different applications
6. Full pressure supply
Disadvantages
1. Still very expensive
2. Track record on performance still short
3. "Teething" problems still need to besorted out, e.g., vulnerable electro-mechanics to impurities in water
4. Computer and software support may beproblematic in some rural areas
5. Pre-payment devices will always be at-tractive to "test" vandals
55
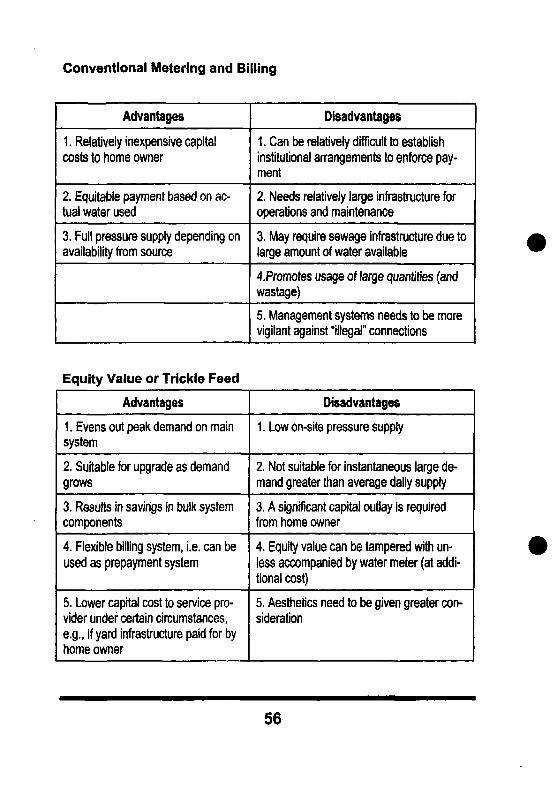
Conventional Metering and Billing
Advantages
1. Relatively inexpensive capitalcosts to home owner
2. Equitable payment based on ac-tual water used
3. Full pressure supply depending onavailability from source
Disadvantages
1. Can be relatively difficult to establishinstitutional arrangements to enforce pay-ment
2. Needs relatively large infrastructure foroperations and maintenance
3. May require sewage infrastructure due tolarge amount of water available
4.Promotes usage of large quantities (andwastage)
5. Management systems needs to be morevigilant against "illegal" connections
Equity Value or Trickle Feed
Advantages
1. Evens out peak demand on mainsystem
2. Suitable for upgrade as demandgrows
3. Results in savings in bulk systemcomponents
4. Flexible billing system, i.e. can beused as prepayment system
5. Lower capital cost to service pro-vider under certain circumstances,e.g., if yard infrastructure paid for byhome owner
Disadvantages
1. Low on-site pressure supply
2. Not suitable for instantaneous large de-mand greater than average daily supply
3. A significant capital outlay is requiredfrom home owner
4. Equity value can be tampered with un-less accompanied by water meter (at addi-tional cost)
5. Aesthetics need to be given greater con-sideration
56
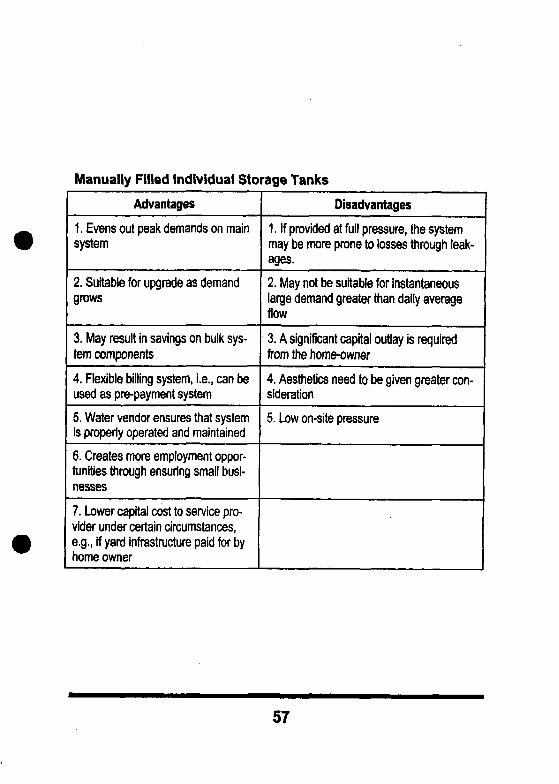
Manually Filled Individual Storage Tanks
Advantages
1. Evens out peak demands on mainsystem
2. Suitable for upgrade as demandgrows
3. May result in savings on bulk sys-tem components
4. Flexible billing system, i.e., can beused as pre-payment system
5. Water vendor ensures that systemis properly operated and maintained
6. Creates more employment oppor-tunities through ensuring small busi-nesses
7. Lower capital cost to service pro-vider under certain circumstances,e.g., if yard infrastructure paid for byhome owner
Disadvantages
1. If provided at full pressure, the systemmay be more prone to losses through leak-ages.
2. May not be suitable for instantaneouslarge demand greater than daily averageflow
3. A significant capital outlay is requiredfrom the home-owner
4. Aesthetics need to be given greater con-sideration
5. Low on-site pressure
57
Infrastructural Requirements for Each OptionThe main requirement needed to effect or implement any of thesesystems is that sufficient pressure is available in order to drive waterthrough the devices. Suppliers for the two main pre-paid meters inSouth Africa claim that pressure drops across their meters is negligi-ble or less than 1 m of water. The pressure required to supply water toeither trickle feed tanks or other individual storage tanks will, again, bea function of the height of the storage tank.
As indicated earlier, studies have indicated that there is a direct in-verse relationship between the amount of water consumed by ahousehold to the average distance walked to fetch the water. There-fore, the source and bulk shared infrastructure of a scheme need tobe sized to cope with the expected higher demand from higher level ofservices schemes. Whilst the daily requirements can be expected tobe fairly fixed and determined by the sum of reservoirs regardingschemes with dispersed storage tanks, the situation may be less cer-tain in schemes with either prepayment meters or conventional me-tering and billing systems. Schemes with the two latter cost recoverysystems/level of service should, therefore, be capable of providing percapita supplies of 50-150 I/day.
A computer system with a database management programme is gen-erally required for schemes with prepayment meters. This then maxi-mises on the abundance of information, which can be stored on eachtoken such as water use patterns of particular homesteads and otherdemographic data. Regarding manually filled individual storage sys-tems, a computer system may be considered and "nice to have" butnot essential at the water vendor level at least. Depending on the siteof the scheme and the number of water vendors, it may be absolutelynecessary as the number of water vendors increases and the databecomes too voluminous to manage.
The issue about human resource requirements for each technical op-tion is very difficult to predict as it is project specific depending on anumber of variables such as;
• the nature of the responsible water authority, e.g., water commit-tee, water utility, state structure (local authority), etc.
• the magnitude of the scheme
58
• geo-positional nature of scheme, e.g. rural, peri-urban, etc.
• the scheme's proximity from commercial service centres
• complexity of the bulk scheme to operate and maintain, i.e. does itinclude flocculation processes, pre-filtration stages, etc.
• the source of water - borehole, bulk supplied, spring, etc.
Hence, whilst it may be interesting to classify the human resourceconsiderations for each option, it would be a futile exercise as demon-strated above.
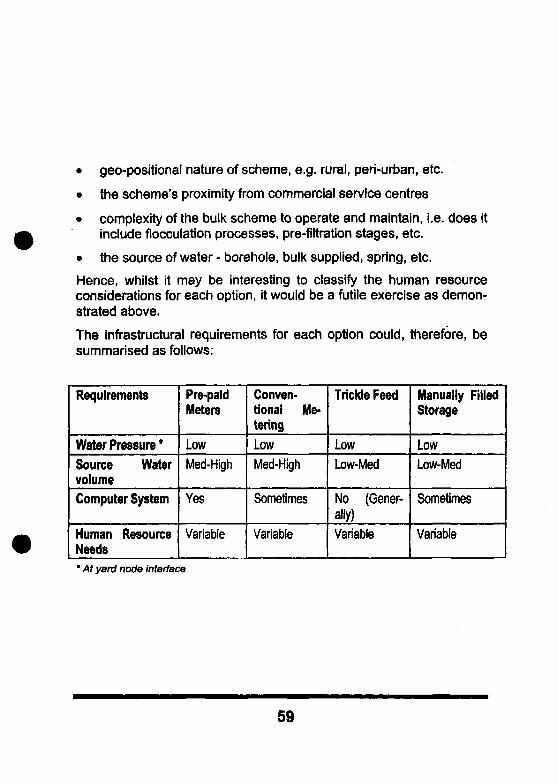
The infrastructural requirements for each option could, therefore, besummarised as follows:
Requirements
Water Pressure *Source WatervolumeComputer System
Human ResourceNeeds
Pre-paidMeters
LowMed-High
Yes
Variable
Conven-tional Me-teringLowMed-High
Sometimes
Variable
Trickle Feed
LowLow-Med
No (Gener-ally)Variable
Manually FilledStorage
LowLow-Med
Sometimes
Variable
* At yard node interface
59
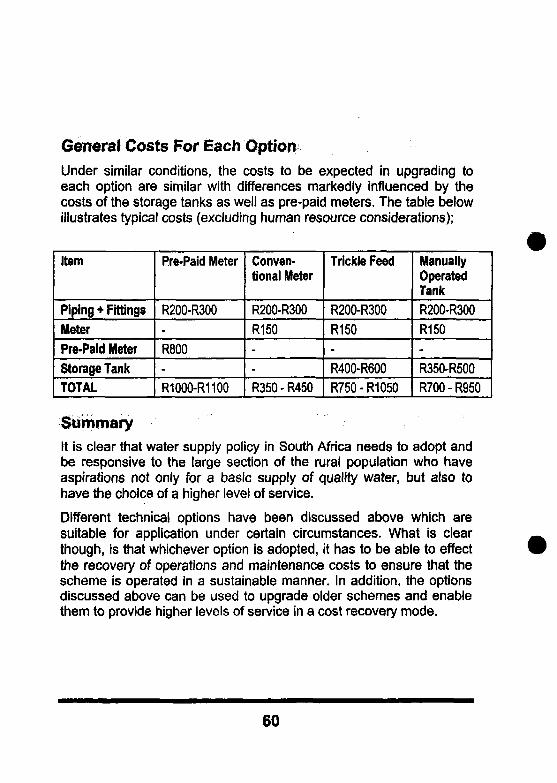
General Costs For Each OptionUnder similar conditions, the costs to be expected in upgrading toeach option are similar with differences markedly influenced by thecosts of the storage tanks as well as pre-paid meters. The table belowillustrates typical costs (excluding human resource considerations);
Item
Piping + FittingsMeterPre-Paid MeterStorage TankTOTAL
Pre-Paid Meter
R200-R300-R800-R1000-R1100
Conven-tional Meter
R200-R300R150--R350-R450
Trickle Feed
R200-R300R150-R400-R600R750 - R1050
ManuallyOperatedTankR200-R300R150-R350-R500R700 - R950
SummaryIt is clear that water supply policy in South Africa needs to adopt andbe responsive to the large section of the rural population who haveaspirations not only for a basic supply of quality water, but also tohave the choice of a higher level of service.
Different technical options have been discussed above which aresuitable for application under certain circumstances. What is clearthough, is that whichever option is adopted, it has to be able to effectthe recovery of operations and maintenance costs to ensure that thescheme is operated in a sustainable manner. In addition, the optionsdiscussed above can be used to upgrade older schemes and enablethem to provide higher levels of service in a cost recovery mode.
60
Financial Models
A founding principle of the Mvula Trust is the support for a DemandResponsive Approach (DRA) to sustainable development.. A criticalcharacteristic of this approach is for communities to make informedchoices about service options and delivery and to get 'buy-in' fromcommunities. Their willingness to pay for their choice of service lies atthe root of this 'buy-in'.
As part of the debate around financing higher levels of water services(on-site) in rural communities, a number of different loan options arediscussed in the following sections.
The first section, Retail Loan Option, is a calculus model that was de-veloped to assist formal and informal finance institutions to calculatepotential risk if loans are made to individuals. The aim is to entice fi-nance institutions to consider loans to poor rural households.
The model was developed for individual lending, as Mvula's first expe-rience and pilot projects showed a reluctance by the financial sector toenter into group loans.
Individual LoansIndividual loans were favoured for repayment reasons on the part ofthe finance sector because there could be a contractual relationshipbetween the borrower and the lender. The belief was that as soon asanother entity (such as a community-based organisation) was in-volved, risk would increase, especially if the finance institution couldnot exercise control over the entity. Unless the CBO has a proventrack record of cost recovery and repayments (including monthly O&Mand/or a deposit payment) a loan to them as a group would not be aviable option.
The departure point in seeing individuals as loan recipients or creditclients, was based on individual accountability and creditworthiness.The ultimate objective of this particular investigation was to provide acredit basis to individuals desiring housing and repeat infrastructuralloans.
61
Group Loans ,./'v::. ,/>;, "^.^V • > > ; ^ v , ^ :
The calculus model developed under the section, Savings InvestmentOption, is rooted in international microcredit trends, which centrecredit provision on solidarity group pressure. It departs from thepremise that financing and credit should be tailored around existingsavings scheme principles and habits in rural areas. Different types ofsavings schemes exist in South Africa which could be explored aspossible vehicles for credit to poor rural households.
• The solidarity group method adopts, as a foundation, traditionalcommunity savings principles including rotating savings (in SouthAfrica it is called 'Moholiswana') where the group contributes anamount of money monthly or weekly and each member of thegroup has a turn to receive all the money. This money can be usedby the individual member to purchase an item ordinarily outsidehis/her financial boundaries, or the money can be put up as collat-eral to borrow against. In peer group lending the members who re-ceive the loans, repay them on a weekly or monthly basis, with thegroup providing the guarantees for this repayment.
• Internationally, different ways of peer group borrowing and lendingexist. An example of this traditional method in South Africa iscalled 'Stokvels' or Savings Societies1. A stokvel is an informal ro-tating credit union where members agree to contribute a fixedamount of money regularly into a common pool and the funds socollected are allocated to members on rotation or in a time of need.
• The term stokvel derives from the early nineteenth-century cattle orstock fairs in the 1800s. The modern stokvel evolved from theburial societies that were formed during the gold mining boom inresponse to harsh conditions and widespread disease. Burial soci-ety members contributed to a pool of funds that were used to burythem when they died. The modern stokvel also serves as an em-ployment agency and advice bureau.
1 Much of section is taken from a book edited by the author. Thechapter quoted was written by G van Staden and M Stewart in Po-spects for Progress: Critical Choices for Southern Africa (Edited byMinnie Venter), 84-107, Maskew Miller Longman, 1994.
62
• The National Stokvels Association of South Africa was founded in1988, in order to bridge the divide between the formal economyand the informal community-based institutions that had evolvedover a century in developing environments. Black savings in SouthAfrica pro rata are the highest on the continent, yet black South Af-ricans have been denied access to savings pools that they havehelped generate.
• In a typical stokvel, all members of the group are obliged to borrowfrom the central 'kitty1, every month. The monies are repaid at aninterest rate lower than the normal bank prime rate and the surplusattained monthly from the interest, is saved by the group. At theend of a 12-month period, the collective savings are sharedamongst the group on an equal share basis, or invested in a con-ventional financial institution or the Stock Exchange or the group
. may decide to buy shares in a company as shareholders.
63

ncin I
model

retail
Rural Water Supply Financial Model
IntroductionThe Rural Water Supply Finance Model is, firstly, a tool to assess thefinancial viability of water supply schemes in rural villages when on-site services are provided to all or some households. Secondly, it is atool for deciding on financing options for such schemes. These func-tions are related, since favourable financing arrangements may rendera scheme viable that would otherwise not be so. Thirdly, the modelcan be used to determine the tariffs that will need to be charged bythe service provider.
The model calculates the amounts that households will be required topay to make the service financially viable. These amounts includeboth payments to the service provider and payments on private loans.It compares these payments with the amounts that households arewilling to pay for water. The total amount that will remain unpaid dur-ing the course of a year is then calculated, on the assumption thathouseholds pay no more than their maximum indicated amounts. Thesummary indicator of viability is the net cash flow of the scheme forthe year. If this is negative, the scheme is not financially viable andmust be reconsidered.
Model scopeThe model has been developed for application in rural villages wherenew water supply systems are to be provided, or where water supplysystems have been provided to the level of a standpipe service andare to be upgraded to provide on-site connections.
For the sake of simplicity only two levels of service are provided for,namely public standpipes and on-site services.
Only residential consumers (households) are considered.
64
Technical specificationsThe model is an Excel worksheet, and requires a Windows environ-ment.
Structure of the modelThe model is organised on ten sheets, numbered 1 to 10. Inputs andoutputs are ordered in a logical progression, as described below. Thenumber and heading of each sheet is given in brackets in the descrip-tion that follows. The name the tab in included, in inverted commas.
The model is organised as follows:
• a description of the area, planning year etc. (1. Project description"Des")
• demographic and income data (2. Demography and income "Res-CUs'1);
• three scenarios for the provision of services, and the capital costsassociated with each scenario (3. Investment scenarios and capitalcosts "Scenarios");
• financing options for each scenario (Capital grants and finance tobe raised "Capsubs"; 5. Sources of finance "CapFin");
• the consumption associated with each scenario, including provi-sion for water losses (6. Estimated water consumption "Cons");
• the costs of running the system for each scenario including, assetreplacement, pumping, treatment and other operating and mainte-nance costs (7. Asset replacement, operating and maintenanceexpenditure (R per year) "O&M");
• the payments required of households to ensure full cost recovery(8. Monthly bills "Bills");
• the likelihood of unpaid bills if the payments required exceed theamounts that households are able/willing to pay (9. Willingness topay and total amounts unpaid "WTP"); and
• a summary sheet of the key input and output variables, in a formatsuitable for printing (10. Summary "Summary").
65
Key outputs are the amounts of finance to be raised per householdand the monthly payments required. The indicator of viability is thetotal expected amount of unpaid bills: where unpaid amounts are pre-dicted the investment option is not likely to be financially sustainableand changes need to be made. Possible changes are discussed in thefinal section of this manual.
Protection, colour cod ing and number formatProtection
The sheets are protected so that the user can change data only in theinput blocks. This is to prevent accidental deletion of formulae as wellas illegitimate changes to the calculations or outputs.
Colour codingThe model is colour coded to allow for the easy identification of es-sential inputs, optional inputs, default values, ordinary outputs and keyoutputs.
Essential information is entered in the bright yellow blocks. Thereare no default values for these inputs and if the user does not enterany information the model will read the value as zero.
Optional inputs are entered in the light blue blocks. These are inputsfor which the model provides default values. If the user leaves a blueblock blank, the default value will be used.
The green blocks are for highlighting purposes. On sheet 3 theyhighlight the capital cost per household of the secondary infrastructureto be provided ("Scenarios"). On sheets 4 and 5 they highlight theamount of finance that needs to be raised per household ("CapSubs"and "CapFin"). On sheets 8 and 9 they highlight the monthly pay-ments that are required.
Default values are displayed in blue against the white background.Bold blue defaults are simply numbers that have been entered, whilenormal blue defaults have been calculated from other inputs in the
66
model. The method of calculation is generally recorded in a commentbox on the screen2.
General information and outputs are displayed in black against thewhite background.
Headings are highlighted in pale yellow.
Number formatAll (numerical) inputs must be entered in number format. Where per-centages are being entered, the model automatically converts thenumber entered to a percentage. For example, the user is requestedto enter an interest rate on private loans (sheet 5). An entry of "30" isread by the model as 30 percent. If the user were to enter "0.30", or"30%", the model would interpret this as 0.3 percent.
Model inputs and outputs1. Project Description
On this sheet the user records information such as the name of thevillage, the base year, the person responsible for the assessment andthe run number. The run number is for record keeping purposes only,for example run 1 may be the first round of modelling and run 2 maybe the second round after costs and/or service levels have been re-evaluated.
It is important to enter the base year as a number, since this is used tocalculate the year displays in the remainder of the model.
2. Demography and income
The population and number of households must be entered here. Themodel uses households rather than population as the unit of evalua-tion, but calculates the average size of households to serve as across-check on the numbers entered.
2 Comment boxes may be viewed by resting the cursor on a cell which displays a reddot/triangle in the top right-hand corner. In Excel 3.1, the command "View, notes" mustbe selected.
67
The expected rates of growth in the number of households in the baseyear, and five years later, are requested. Rates of growth for the inter-vening years are extrapolated. The model is designed to evaluate thefinancial viability of the water supply system for a population five yearsafter the base year. If the user wishes to deal with the current numberof households only, then he/she should enter as "0" the expectedgrowth.
Information on household income distribution is entered in four cate-gories. The default categories are R0-R500 per month, R501 to R1000 per month, R1 001 to R2 000 per month and more than R2 000per month. The percentage of households that falls into each of thesecategories must be entered for the base year, and an estimate madeof the likely distribution in five year's time. The default income distri-bution for the base years reflects the distribution in a "typical" ruralsettlement in South Africa. The default income distribution for year 5 isthe income distribution in the base year.
Although defaults are provided, it is important that the income distri-bution information is as accurate as possible for the village underconsideration. Income distribution and willingness to pay (discussedbelow) critically affect the likely affordability of the services to be pro-vided.
The model calculates an average monthly income based on categoryaverages. This is for information only and is not used in any furthermodel calculations.
3. Service level scenarios and capital costs
Service level scenarios
In the table entitled "Residential services by (year 5)", the service levelscenarios are determined by entering the proportion of householdswho, in year 5, will be provided with water from public standpipesonly. The model then calculates the proportion to be provided with on-site water.
Scenario 1 is fixed as the base-line scenario in which all householdsare provided with standpipe water only. Scenarios 2 and 3 are de-signed by the user. Scenario 3 is intended to be the most ambitious(or the most expensive) scenario, and scenario 2 an intermediate
68
scenario. The model calculates, and displays, the number of house-holds with standpipe and on-site services respectively.
For example, let scenario 2 be one in which 60 percent of householdsreceive yard tanks by year 5, while the remaining 40 percent remainserved by public standpipes only. Let scenario 3 be one in which allhouseholds receive yard tanks. The procedure is as follows:
• Enter the name of the on-site service ("Yard tank") into the yellowblock below "Public standpipes").
• Enter "40" into the yellow block below "Scenario 2".
• Enter "0" into the yellow block below "Scenario 3".
• Press F9 to calculate3.
The model will then display a "0", "60" and "100" in the blocks next to"Yard tanks". This means that in year 5, respectively 0%, 60% and100% of households will have been provided with the on-site servicefor each scenario. Respectively 100%, 40% and 0% will have accessto public standpipes only. The numbers of households involved aredisplayed in the bottom two rows of the table.
Capital costsWhen entering capital costs, a clear difference is made between "pri-mary" infrastructure and "secondary'1 infrastructure.
Primary infrastructure includes all bulk infrastructure, connectorpipelines, reservoirs, primary reticulation pipe work and public stand-pipes.
The total cost of providing the infrastructure required for scenario 1must be entered in the two yellow blocks below "Scenario 1" (cells H7and H8). Construction costs are entered in the top block, and othercosts area entered below this. The latter costs refer to items such as
3 Excel may be in manual or automatic calculation mode. If in manual mode, the usermust press F9 in order for the model to calculate. If in automatic mode, the model cal-culated each time a number has been entered. To change the calculation mode, see"Tools, Options, Calculation" on the tool bar.
69
overhead costs, management fees and training. Costs are entered inR'000.
If additional primary infrastructure needs to be provided in scenario 2,then the cost of this additional infrastructure must be entered in thenext column (cells 17 and 18). For example, if the provision of yardtanks to 60% of households requires and additional borehole and res-ervoir, the cost of this additional infrastructure must be recorded here.
If scenario 3 requires primary infrastructure over and above that suffi-cient for scenario 2, the additional costs must be entered in the finalcolumn of the table (cells J7 and J8). For example, increasing cover-age to 100% of households may require additional pumping capacity.
The total cost of primary infrastructure for each of the scenarios isshown as the cumulative total (row 10).
The secondary network refers to the additional pipelines, and anyother infrastructure required for on-site services, which is shared byhouseholds4.
The total amount required for scenario 2 is entered in the yellow blocknext to "Secondary network" (cell 112). This is entered in R'000 (notper household).
The additional amount required for scenario 3 is entered in the yellowblock in the "Scenario 3" column (cell J12)
Cumulative totals are displayed in the row below this. The cost perhousehold of the secondary distribution network is displayed in greenfor each scenario.
"Terminals" refer to the pipelines and on-site terminals that serveindividual sites. This therefore refers to the infrastructure that is notshared by other households. Costs are entered as Rands per house-hold.
4 Distribution stations can be classified as either primary or secondary, depending onhow they are to be financed: if they are to be financed by along with the primary network(usually by means of a capital subsidy), then the are best included as primary infra-structure.
70
The full cost of the infrastructure, if fully purchased, is entered in thetop row for each scenario (cells 117 andJ17). If the per site cost is thesame for both scenarios, a cost for scenario 2 only needs to be en-tered and the model will use this cost for scenario 3 (i.e. default forscenario 3 = cost for scenario 2).
The next four rows make provision for reducing the cost of this infra-structure, for example by households providing labour or bricks. Asubtotal is then shown (row 22).
Provision is made for a percentage discount on the final cost (enteredas a number).
The final cash cost per household of the terminals is shown in green.
4. Capital subsidies and finance to be raised
Capital subsidies for "primary" and "secondary" infrastructure aredealt with separately.
The total amount of grant finance to be provided for primary infra-structure in scenarios 1, 2 and 3 must be entered in the appropriateblue blocks (cells D8 - F8). If no values are entered, the model as-sumes that all "primary" infrastructure is paid for by means of a capitalgrant. Thus, the values in blue below the "Primary grant" boxes arethe cumulative total costs of the primary infrastructure, which themodel uses as default values (see "3. Investment scenarios andcapital costs" cells H10 - J10).
The total amount of grant finance to be provided for the secondarynetwork and on-site terminals is entered in the next row of yellowblocks. The model assumes that no subsidy is available for this "sec-ondary" infrastructure. The black values below the "Secondary grant"boxes show the total costs of this infrastructure, but are for informationonly and are not used as defaults.
The model then calculates, and displays, the total amounts of capitalfinance to be raised for primary and secondary infrastructure respec-tively. These are shown in R'000. The totals are also displayed.(Rows 15-17).
The last table on this sheet translates the capital costs of the primaryand secondary infrastructure, and the finance to be raised, to amounts
71
per household. Different amounts are applicable to households withpublic standpipes and on-site services respectively. The amounts offinance to be raised per household are highlighted in green. The topgreen blocks highlight the amounts to be raised for secondary infra-structure, and the bottom green blocks show the total amounts. Thetotal amount for each scenario = (the amount to be raised for primaryinfrastructure) + (the amount to be raised for secondary infrastruc-ture).
Note the model assumption that all households share equally in thecosts of the primary infrastructure.
5. Sources of finance
The next step is to decide on the sources of finance. The totalamounts to be raised per household are displayed in green. Theseamounts are the same as those displayed in green on the previousscreen (4. Capital grants and finance to be raised, rows 28 - 29).
The user needs to decide on the amounts to be paid up-front, bymeans of individual loans and, where applicable, by means of institu-tional loans (i.e. loans raised by the service provider). The amounts tobe raised by means of institutional loans and paid up-front are enteredin the yellow blocks for the three scenarios (below each other) byservice type (next to each other). The model calculates the amount tobe raised by means of individual loans as the residual. The percent-age distribution of these sources is shown in the columns next to theinput blocks, and the monthly capital charges (interest and redemptionpayments) due per household on the loans are displayed to the rightof these.
The total amounts to be raised, and the total interest and redemptionto be paid by the village as a whole, are displayed in the last two col-umns in Rands (columns M and N).
The capital charges (interest and redemption payments) displayed arecalculated using the interest rates and repayment periods entered bythe user at the top to the sheet (yellow blocks, row 5).
For scenarios 2 and 3, the totals of unpaid bills are displayed (in red)to the right of the sheet. The purpose of this is to immediately see.theeffects of alternative financing options on the likely financial viability of
72
the programme. This can however be properly evaluated only afterother recurrent costs and information on willingness to pay have beenentered. These unpaid amounts are intended for use once all the in-formation has been entered and the model is being fine-tuned.
6. Estimated water consumption
The user enters the expected monthly consumption of households byservice type, and expected physical losses as a percentage of totalconsumption. The model then calculates total water demand. Defaultamounts can be used in the absence of local information.
Water consumption information is required to calculate operating ex-penditure, particularly when bulk water is purchased, pumped and/ortreated. It can also be useful as a check on whether the proposedprimary infrastructure is designed to supply an appropriate amount ofwater: too little capacity will lead to obvious problems of supply whileexcessive capacity may mean higher than necessary asset replace-ment and maintenance costs.
7. Asset replacement, operating and maintenance expenditure
Recurrent costs (other than finance charges) are dealt with on thissheet.
• Asset replacement costs are entered as a percentage of the con-struction cost of the infrastructure. Different percentages apply toprimary infrastructure, the secondary network and terminals. De-faults are provided for these inputs. The total costs per year for thethree scenarios are shown in the last three columns of the table(cells H9-J9).
• Pumping costs are recorded by entering the percentage of averagedaily flow that is to be pumped in each scenario, and the cost ofdiesel and/or electricity in terms of the cost per kl of water pumped(c/kl). The average daily flow for each scenario is displayed at thetop of the table (cells I6-J6). The total annual costs are displayed inthe row in which costs are entered (cells H12-J12).
• Treatment costs are recorded by entering a cost per kl of watertreated (c/kl). The total annual costs are displayed as above.
73
• Bulk purchase costs are recorded by entering a cost per kl of waterbought (c/kl), and the percentage of the total amount used that ispurchased. The total annual costs are displayed as above.
• Other expenditure is entered as an amount per annum for eachscenario (cells H17-J17).
• Maintenance costs are entered as a percentage of the constructioncost of the infrastructure, as in the case of asset replacement (seeabove).
• Staff costs are calculated for each scenario by entering the numberof staff employed in each of four categories, at salaries entered bythe user.
• Provision is made for overheads as a percentage of staff costs. Adefault value of 10 percent of staff costs is provided.
The model then calculates total costs per annum for each of the sce-narios, in Rands (row 31). It also calculates the cost per kl of watersold and of water used, the latter including physical losses (R/kl, rows32 and 33).
8. Monthly bills
All the cost information required to calculate monthly payments is nowavailable. Provision should however be made for non-payment. In allvillages it is financially prudent for the service provider to make someprovision for non-payment. For example, funeral expenses may meanthat a household has insufficient resources to pay its water bill for amonth or two. If provision is made for this, then the service providercan accommodate such problems without jeopardising its financialviability. A non-payment rate of, say 5% should be allowed.
It is important to note that this non-payment is different from a perma-nent unwillingness/inability to pay for the services provided. Unpaidbills for the latter reason are dealt with on the next sheet as a "willing-ness to pay" issue.
Having set a non-payment rate, monthly payments (or household bills)can be calculated:
74
Up-front payments and capital charges were set on sheet 5 ("Sourcesof finance"). The decision to be taken on the current sheet is theamount to be paid to the service provider by households with andwithout on-site services respectively. The amounts to be paid are de-termined by entering a payment ratio for each scenario in the blueblocks (cells HG9 and 19). For example, entering a "2" for the on-siteservice means that the average monthly payment for this service willbe twice the payment for a standpipe service.
The decision on payment ratios is assisted by the provision of monthlycost ratios, which are calculated from the monthly costs of serviceprovision displayed in the third table on this screen. The cost ratiosare displayed to the right of the payment ratios in the top table. Thedefault payment ratios are equal to these cost ratios.
Once the payment ratios and "normal" non-payment rates have beenset, the model calculates monthly water bills payable to the serviceprovider to ensure that its total annual expenditure requirements aremet. These are displayed in the last three columns of the top table, forscenarios 1,2 and 3 respectively.
Other information displayed on this screen includes the up-front pay-ments and monthly capital charges due on personal loans. All pay-ments due by households are thus displayed here. "Total monthlypayments" refers to payments on personal loans plus payments to theservice provider. These are displayed in green. Total unpaid bills,which are calculated on the next sheet and discussed below, are re-flected here directly below the total monthly payments.
The total monthly income required by the service provider to ensurefinancial viability is shown in the last line on the sheet.
9. Willingness to pay and amounts unpaid
The monthly payments necessary for financial viability have been seton the previous sheet. The question to be answered on this sheet iswhether households are able/willing to make these payments. In orderto establish this, it is necessary firstly to establish willingness to payby income category, and secondly to allocate services to incomegroups to match willingness to pay with monthly bills.
75

• The user enters the amounts that households in each incomecategory are willing to pay in the blue blocks in the top right handtable (cells E7 to E10). The default amounts shown to the right ofthe input blocks are calculated as respectively 10%, 7.5%, 5% and5% of the average income for each category.
• Total monthly bills are displayed in green in the top right hand ta-ble. The amounts shown here are the total amounts calculated onthe previous screen and highlighted in green ("Bills", K14-M15).
• The model allocates services by assuming that on-site connectionsare allocated to higher income households first (bottom right handtable).
• The total amounts billed, paid and unpaid per year are shown inthe bottom left hand table. The total amounts paid are calculatedby assuming that households whose bills exceed the amounts theyare able/willing to pay, pay as much as they are able/willing to. Theremainder becomes "unpaid bills".
The meaning of unpaid billsIf a scenario produces unpaid amounts, it means that (some) house-holds are receiving services that they cannot afford or are unwilling topay for. The service provider will not remain financially viable, and thescenario needs to be re-examined to see where changes are possi-ble. Possible changes, within reason, include :
• negotiating increases in the amounts that households are willing topay;
• financing the infrastructure in a different manner, for example byrequiring larger up-front payments and thus smaller personalloans;
• reducing the cost of on-site services for example by encouragingvillagers to provide their labour and make bricks;
• negotiating more favourable loan conditions;
• reducing the proportion of households who are to receive on-siteservices;
76
• reducing operating and maintenance costs, for example by a dif-ferent staffing system; and
• reducing the amount of bulk and/or connector infrastructure pro-vided, if provision is made in this for large amounts of excess ca-pacity. This can save on asset replacement and maintenancecosts.
If these steps fail to eliminate non-payment, a more fundamental re-think of the project is necessary and a decision needs to be madewhether on-site service water provision is an option for the specificcommunity.
77
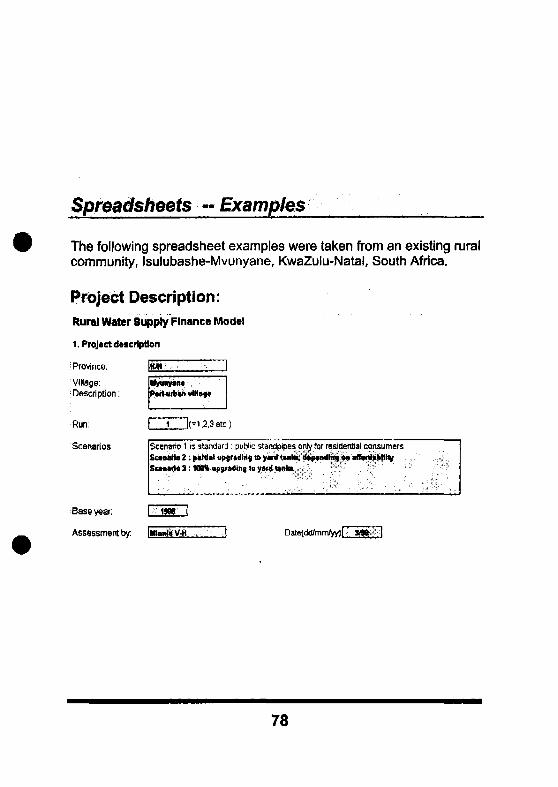
Spreadsheets - Examples
The following spreadsheet examples were taken from an existing ruralcommunity, Isulubashe-Mvunyane, KwaZulu-Natal, South Africa.
Project Description:Rural Water Supply Finance Model
1. Project diicriptton
i Province:
Village:Description:
Run:
Scenarios
Base year
Assessment by:
J
Pwt-witn v<H*g*
=1.2.3 etc)
Scenario 1 is standard : public stsndpipes only for residential consumersSemite 2: initial upgrading to yard unta, tft|»nd
: JW% upgrading tg ymd unki
Date(dd/mm/yy)[
78
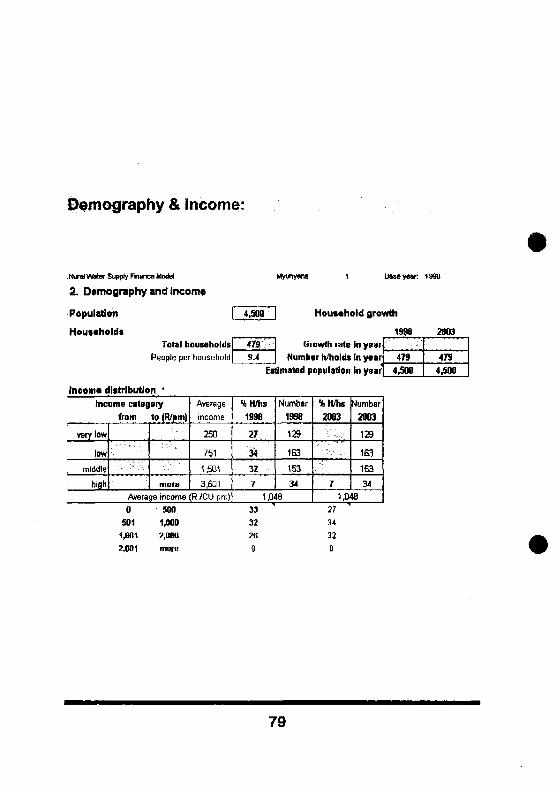
Demography & Income:
Rural water Supply Finance Model
2. Demography and Income
Population
HouMholdt
Incom* distribution
Mywiyane Base yen; 1898
Total households3eople per household
479
9.4
Houcahold growth
1998
Growth rate in year
Number h/holds In year
2003
Estimated population in year
479
4,500
479
4,500
Income category
from to (R/pm)
very law
low
middle
high more
Average
income
250
751
1,501
3,601
Average income (R /CU pm)
UH/hs
1998
27 ..
• • 3 4 .
32
7
Number
1998
129
163
153
34
1,048
%H/hs
2003
V';V........
7
dumber
2003
129
163
153
34
1J348
0
501
1,001
2,001
500
1,000
2,000
more
33
32
26
9
2734
32
0
79
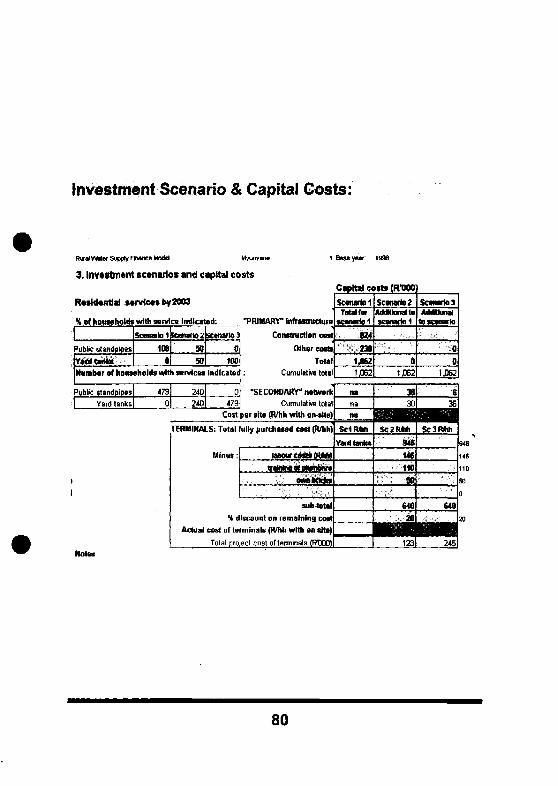
Investment Scenario & Capital Costs:
Rurd VMer SmvIV Prunes Modd Myunyana
3. lrw«stm*nt scenario* and capital costs
1 Banyw: 1999
Residential t»rvie«* fey 2003
% of households with service Indicated: "PRIMARY" infrastructure
Public standoiposYar t t ink iNumber of hom
Public standpipesYard tanks
Scenario 1
100
fcwunoz
SOSO
ahold* with services
4790
240
240
Scenario 3 Construction cost
0100
Other costs
Totalindicated: Cumulate total
0479
"SECONDARY" networkCumulative total
Cost per sits (R/hh with on*lte)
TERMINALS: Total fully purchased cost (R/hh)
Minus : W K W C O U J M W I )
ownlMUt*
sub-total
% discount on remaining costActual cost Df terminals (R/hh with on^He)
Total project cost of terminals (RW30)
Capital cotts (Fr000
ScenartoiTotal fbr
SEsmrlsi
824238
1,0621,062
nana
Scenario 2MdKionaltoscenario 1
01,0E2
3030
na Ml^aWB
Yard tanks
—
SC2M*
m..,,•:': • ' i W
WCV 50
640' •• : : :""20
123
ScenariosMaMoral
to scenario
0
01,062
: . : ' ' • / • • !
36• • 1SC3RJWI
640
245
946
146
110
SI
0
JO
Note*
80
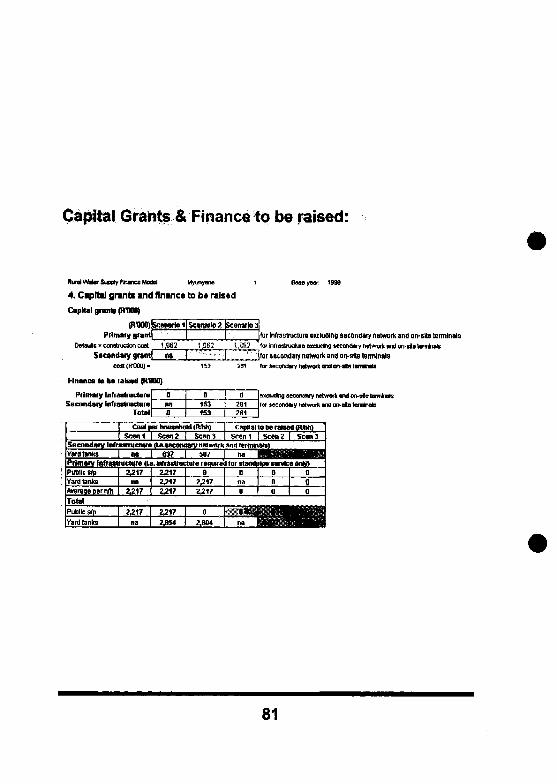
Capital Grants & Finance to be raised:
Rural V\WerSi«vly Finance Model Myunym
4. Capital grants and finance to be raised
Capital grants (RWO)
(RW
Primary grant
Deiauls • construction cost 1.062 1,062 1.082
scenario 1 Scenario!! Scenario 3
Secondary qnntl na I
Bweyear:
for Infrastructure excluding secondary network and on-sltt terminals
Tor infratfruchn exdudmg secondly notwwk and on-stotermtals
j ' ' l r sscondsry network ana on-slte terminate
tgr £ocond«rv network and cn-tte Itrttirutt
Flnutca to bg rabad (R«M)
Primaiy InfrntnictunSscondary Infiodructun
Total153
Scwii I Seani I Seen3
sxckdng seconctwy network and on-titefor »cond«y Mhnvfc and on-s<e terminals
capain to ne ramm (Rmii)Scent | Seen2 | Sam3
Sscondarv InfrastryctunYard tanksrrimsiy iitfrul"ublic s/pYard tanksAverage oerh/ri
Total
Public s/p
Yard tanks
(La-toconna I 637
Brv nolmOf K and lermii5S7
ructtire (U . Infrastructure require'2,217
na2,217
2^17
na
2J172^172,217
M17
2354
02^1722n
0
2,804
naIforstanot
0
0
na
a _•HI
00
a
• •
I—|aa0
•it• •
81
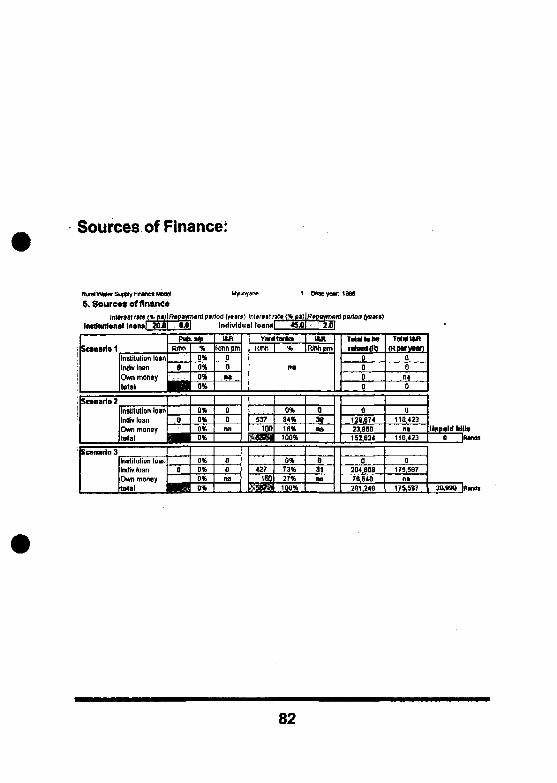
Sources of Finance:
6. Sourcat offlnane*Interest rats
liMHtithmal l o * » |
it psriod (years! Intersst r»l«(%pa) BtpaymBnl parlod (ysars)Individual loawl B i l l 2J|
82
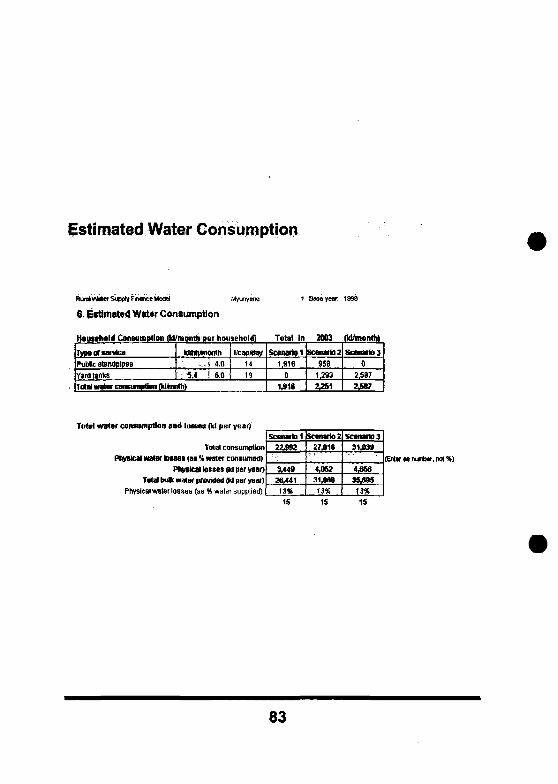
Estimated Water Consumption
Rud WHof Supply Tttrcc Moos
6. Estimated Water Consumption
Myunysne 1 Qaseyear 1998
HouMnoNf Consumption (Id/month oor household)
TmoTsantca
Public standpipes
Yam tanks
MMttnonth
'•••:• * A
4.06.0
l/csp/day
1419
TOM water consumption (kUmitti)
Total in
Scenario 11,916
01,916
2003
ScsratMZ
9SS1.293
231
nd/monthlScenario 3
02.S87
2,587
ToMI Walot cowumptlon and I m t e i (kl per year)
Total consumption
Pnysicai water losses (as 14 water consumed)
Pnyslcal kisses (hi per year)
Total Mitt water provided (kl per year)
Physical water losses (as % water supplied)
Scenario 1
22,992
3,440
28,441
1 3 *
Scenario 2
27.016
4.0S231488
13%
scenario 331JB9
445639,699
13%
(Entw as nunlw, not %)
IS 15
83
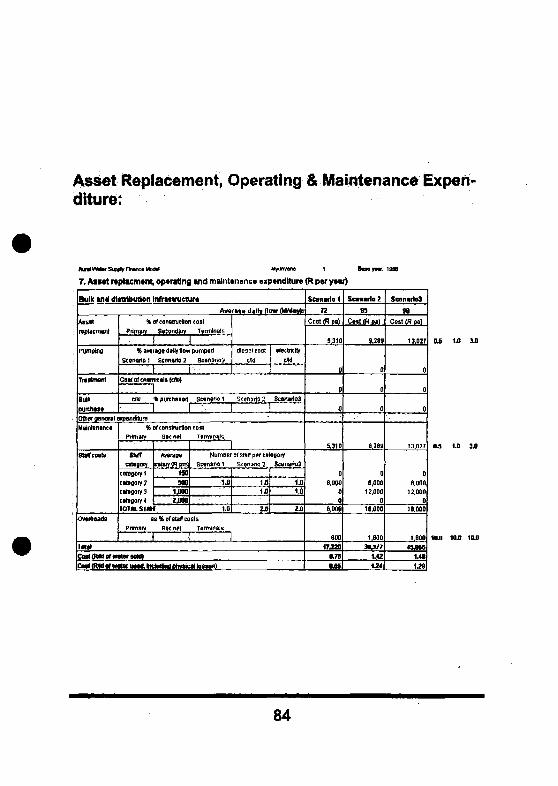
Asset Replacement, Operating & Maintenance Expen-diture:
Rural Wfctar Supply Fume* Mod* Myunyane 1 B u f l y w r
7. Aswt r«pliem»nt, operating ind maintenance expenditure (R p « ytur)
Bulk ind dinributien Infrutruetur*Averaqi} daily flow (kl/day):
Assetreplacment
Pumping
Treatment
BumpurchaseoowjpneraiMaintenance
aatr costs
Overtteads
% of construction costPrimary Secondary Terminals
% average deny flow pumped
Beeiwrio 1 Ecen«» 3 SeeM!i«3die$ei cost
tAt
slectnclly
catiMitiiimiciii (em
UK % purcnaieD Scenario 1
1mpendlture
% of construction costPrimary Sac r>rt T«rmln»K
stair
uAagory
cWegoryl
category J
category 3
category 4
Arerage
ISOJOS
1,™iflBa
TomstMf
stwjrio 2 Scenarios
Number of Starr per categoryScanafiA 1 Scvn^rio 7 Scenarios
1.0
1.0
OS % o l Starr costs
Phmatv sec net Terrninals
{ :.
2J>
1J)
lil
2J1
ToMCo* sugar t « u r M M >Cod (RM of w«or wed, I I K M I M I W M B S I towns)
Sainir io 1
72
C o s t « oi)
5,310
0
0
0
5,310
06,000
00
6,000
60017,220
0.75OJHi
ScnirlQ 2
65
Cost (R pa)
9.289
0
0
0
9.269
D
6,00012,000
016,000
1.800
1.42
124
1986
ScanarNU
Cost (R pa)
13.027
0
0
0
13.027
08,000
12,0000
18.000
1.6004 1 M 5
U»
10J) 1<LD 10.0
84
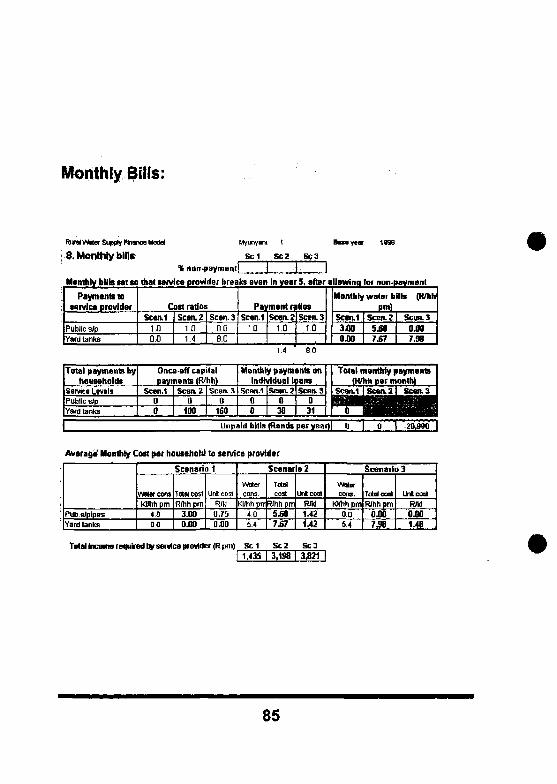
Monthly Bills:
Rural v"fcter Supoty f runcs Model
8. Monthly billsMyunyant 1
S c 1 SC2 SC3
% non-payment] .mJ" JMonthly bills w t «o that sanies provider breaks even in year 6, after allowing for nun-payment
Payments tosarvic* provider
Public s/pYard tanks
Cost ratiosScen.1
1.00.0
Seen. 21.01.4
Seen.30.08.0
Payment ratiosScon.1
1.0Scon. 2
1.0
1.4 '
Seen. 31.0
Monthly water bllb (R/hhpm)
Scen.13.000.00
SceaZ5.687.67
Seen. 3
7.988 0
Total payments byhouseholds
Servlco LevelsPublic s/pYard tanks
Once-off capitalpayments (R/hh)
Scen.100
Seen. %0
100
Seen. 3
__!L_j160
Monthly payments enindividual loans
SCftn.i
00
Seen. 2038
Scan. 3031
Total monthly payments
HiitiiiUnpaid bills (Rands poryear)! tt I 0 I 20,990 I
Average Monthly Cost pet household to service provider
Pubs/pipesYard tanks
Scenario 1
Water consKlftihpm
4.0
0.0
Total cost
Rfhhpm
3.000.00
Unit cost
Rfld0.750.00
Scenario 2
Watercons.
Kl/hh prr4.0
54
Totalcost
Vhhpm5£»TSl
Unlcost
RJM1.421.42
Scenario 3
Vtotarcom.
Kimhpm0.05.4
ToMcost
R/hhpm0J»7J8
umcoatR/kl04)01.48
Total Income retired by service provider (R pm) Set Sc 2 5c 3I 1.435 I 3,198 I 3,821"
85
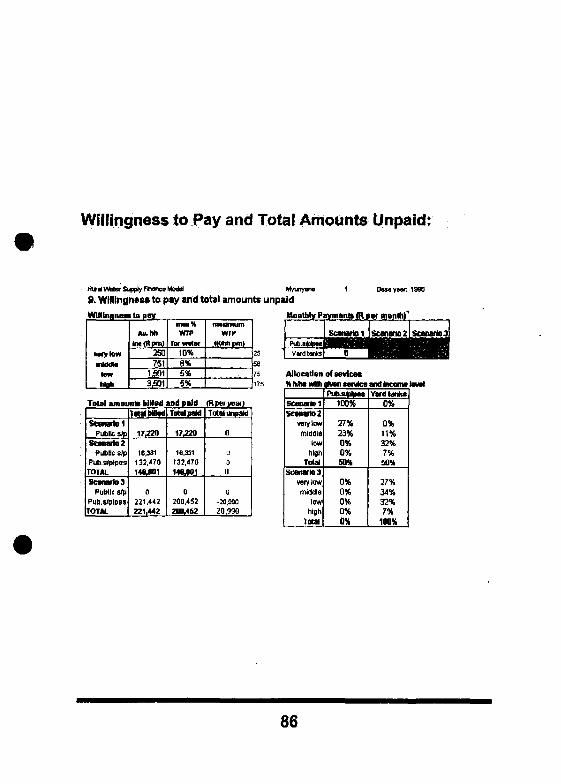
Willingness to Pay and Total Amounts Unpaid:
Myurrysw
9. W)llingn*t« to pay and total amounts unpaid
Wtlllnanoitopay.
Miy lowmkUta
lowIKOh
All. Mlint(Rpm)
250751
15013,501
row*WTP
formtor10%8%5%6%
frmamumWIP
(Mix pin)
Monthly Paymtntt (R tot month!*
55
75175
Allocation of tevlcet
Total amount! bHI«d ami paid (R per y»af)
Scenario 1Public alp
Scsnarlo2Public s/p
Pub snipesTOTALScanarioa
Public stoPub SnipesTOTAL
TMDMkjd
17220
16^31132.470140,901
0221,442221,442
Total paid
17,220
16,331132,470148,801
0200,452200,452
Total wipaM
0
0
0u
0-20.930
-20,990
Scenario 1
Scenario 2
vwylowmiddle
lowhigh
Total
scenario 3
vsrylow
middle
low
high
Total
PUumlpa*100%
27%23%0%0%50S
0%0%0%0%OK
Yardtank*0%
0%11%32%7%
50%
27%34%32%7%
100%
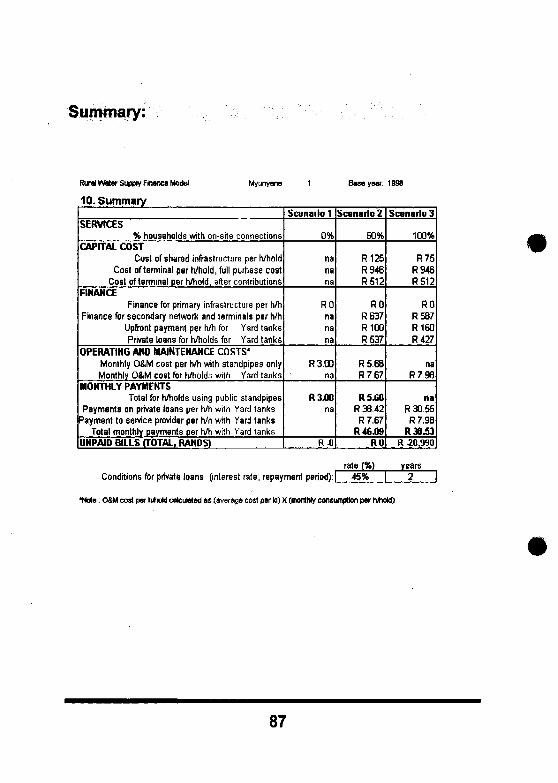
Summary:
Rural Water Supply Finance Model
10. Summary
Myunyane Base yew: 1998
SERVICES% households with on-site connections
CAPITAL COSTCost of shared infrastructure per h/hold
Cost of terminal per h/hold, full purhase costCost of terminal per h/hold, after contributions
FINANCEFinance for primary infrastructure per h/h
Finance for secondary network and terminals per h/hUpfrant payment per h/h for Yard tanksPrivate loans for h/holds for Yard tanks
OPERATING AND MAINTENANCE COSTS*Monthly O&M cost per h/h with standpipes onlyMonthly O&M cost for h/holds with Yard tanks
MONTHLY PAYMENTSTotal for h/holds using public standpipes
Payments on private loans per h/h with Yard tanksPayment to service provider per h/h with Yard tanks
Total monthly payments per h/h with Yard tanksUNPAID BILLS (TOTAL, RANDS)
Scenario 1
0%
nanana
ROnanana
R3.00na
R3.00na
Scenario 2
50%
R125R946R512
RORB37R100R537
R5.68R7.67
R5.68R 33.42R7.67
R 46.09RO
Scenario 3
100%
R75R946RS12
ROR587R16OR427
naR7.98
naR 30.55
R7.9BR 38.53
R -20,990
rate (%)Conditions for private loans (interest rate, repayment period): | 45%
years
•Note: OAM cost per hihoW calculated as (average cost per Id) X (monthly consumption per h/hold)
87

savingsC 3
investmentoption
Savings Investment Finance Model
IntroductionThe Savings Investment Finance Model is a tool to assess the costand affordability to households of proving on-site connections in ruralvillages, when the upgrading is communally financed. Communal orgroup financing can mean either joint saving, or joint saving andcommercial loans using savings as collateral. In both options, up-grading is staggered.
The model calculates the amounts that households will be required topay to make the service financially viable. These amounts includeboth payments to the service provider and payments to finance theon-site connections. It compares these payments with the amountsthat households are willing to pay for water. The total amount that willremain unpaid during the course of a year is then calculated, on theassumption that households pay no more than their maximum indi-cated amounts. The summary indicator of viability is the net cash flowof the scheme for the year. If this is negative, the scheme is not finan-cially viable and must be reconsidered.
Model scopeThe model has been developed for application in rural villages wherewater supply systems have been provided to the level of a standpipeservice, and are to be upgraded to provide on-site connections. It isassumed that the bulk and connector system has sufficient capacity tocater for the additional consumption, or that any such additions will begrant financed.
For the sake of simplicity only two levels of service are provided for,namely public standpipes and on-site services.
Only residential consumers (households) are considered.
88
Technical specificationsThe model is an Excel worksheet, and requires a Windows environ-ment.
Structure of the modelThe model is organised on twelve sheets, numbered 1 to 12. Inputsand outputs are ordered in a logical progression, as described below.The number and heading of each sheet is given in brackets in the de-scription that follows. The name of the sheet is included, in invertedcommas.
The model contains the following main components:
• a description of the area, planning year, etc. (1. Project description"Des");
• demographic and income data (2. Demography and income "Hhs");
• three scenarios for the provision of services, the replacement valueof shared infrastructure and the capital costs of providing on-siteconnections (3. Investment scenarios and capital costs "Scenar-ios");
• for the purposes of financing, information on the division of house-holds into 'stokvel' groups, as well as interest rates and inflationrate (4. Financing options: Groups, interest rates and inflation"Stokvels");
• financing option 1: savings only, or the "pure" Stokvel option (5.Financing option 1: Savings ("pure" Stokvel option) "FinOpi")
• financing option 2: savings and communal loans (6. Financing op-tion 2: Communal loans with savings as collateral "FinOp2")
• graphs associated with financing option 2 (7. Financing option 2:Graphs)
• the consumption associated with each scenario, including provi-sion for water losses (8. Estimated water consumption "Cons");
• the costs of running the system for each scenario including assetreplacement, pumping, treatment, staff and other operating and
89
maintenance costs (9. Asset replacement, operating and mainte-nance expenditure (R per year) "O&M");
• the payments required of households to ensure full cost recovery(10. Monthly bills "Bills");
• the likelihood of unpaid bills if the payments required exceed theamounts that households are able/willing to pay (11. Willingness topay and total amounts unpaid "WTP"); and
• a summary sheet of the key output variables, in a format suitablefor printing (12. Summary "Summary").
Key outputs include the amounts that households need to pay eachmonth to finance the upgrade and pay the water service provider. Theindicator of viability is the total expected amount of unpaid bills:where there are unpaid amounts, the investment option is not likely tobe financially sustainable and changes need to be made. Possiblechanges are discussed in the final section of this manual.
Protection, colour coding and number format
ProtectionThe sheets in the model are protected so that the user can changedata only in the input blocks. This is to prevent accidental deletion offormulae as well as illegitimate changes to the calculations or outputs.
Colour codingThe model is colour coded to allow for the easy identification of es-sential inputs, optional inputs, default values, ordinary outputs and keyoutputs.
• Essential information is entered in the bright yellow blocks.There are no default values for these inputs and if the user doesnot enter any information the model will read the value as zero.
• Optional inputs are entered in the light blue blocks. These areinputs for which the model provides default values. If the userleaves a blue block blank, the default value will be used.
90
• The green blocks are for highlighting purposes. These are essen-tial outputs.
• Default values are displayed in blue against the white background.Bold blue defaults are numbers that have been directly entered,while regular blue defaults have been calculated from other inputsin the model. The method of calculation is generally recorded in acomment box on the screen5.
• General information and outputs are displayed in black against thewhite background.
• Headings are highlighted in pale yellow.
Number formatsAll numerical inputs must be entered in number format. Where per-centages are being entered, the model automatically converts thenumber entered to a percentage. For example, the user is requestedto enter an inflation rate (sheet 4). An entry of "10" is read by themodel as 10 percent. If the user were to enter "0.10", or "10%", themodel would interpret this as 0.1 percent.
Model inputs and outputs
Project Description
On this sheet the user records information such as the name of thevillage, the base year, the person responsible for the assessment andthe run number. The run number is for record keeping purposes only,for example run 1 may be the first round of modelling and run 2 maybe the second round after costs and/or service levels and/or financingoptions have been re-evaluated.
5 Comment boxes may be viewed by resting the cursor on a cell whichdisplays a red dot/triangle in the top right-hand corner. In Excel 3.1,the command "View, notes" must be selected.
91
Demography and incomeThe population and number of households must be entered here. Themodel uses households rather than population as the unit of evalua-tion, but calculates the average size of households to serve as across-check on the numbers entered.
This version of the model assumes a fixed number of households,since the upgrade should be completed within a relatively short spaceof time. If the area is experiencing rapid growth and new householdsare to be included in the project, the user must estimate the finalnumber of households in the village.
Information on household income distribution is entered in four cate-gories. The default categories are RO to R500 per month, R501 to R1000 per month, R1 001 to R2 000 per month and more than R2 000per month. The percentage of households that falls into each of thesecategories must be entered. The default income distribution reflectsthe distribution in a "typical" rural settlement in South Africa.
Although defaults are provided, it is important that the income distri-bution information is as accurate as possible for the village underconsideration. Income distribution and willingness to pay (discussedbelow) critically affect the likely affordability of the services to be pro-vided.
The model calculates an average monthly income based on categoryaverages. This is for information only and is not used in any furthermodel calculations.
Service level scenarios and capital costs
Service level scenariosIn the table entitled "Residential services", the service level scenar-ios are determined by entering the proportion of households who, inyear 5, will be provided with water from public standpipes only. Themodel then calculates the proportion to be provided with on-site water.
Scenario 1 is fixed as the base-line scenario in which all householdsare provided with standpipe water only. Scenarios 2 and 3 are de-signed by the user. Scenario 3 is intended to be the most ambitious, in
92
which the highest proportion of households receive on-site connec-tions, and scenario 2 is an intermediate scenario. The model calcu-lates and displays the number of households with standpipe and on-site services respectively.
For example, scenario 2 could entail 60 percent of households re-ceiving yard tanks by year 5, with the remaining 40 percent beingserved by public standpipes only. Scenario 3 could be one in which allhouseholds receive yard tanks. The procedure is as follows:
• Enter the name of the on-site service (e.g.Tard tank") into theyellow block below "Public standpipes").
• Enter "40" into the yellow block below "Scenario 2".
• Enter "0" into the yellow block below "Scenario 3".
• Press F9 to calculate6.
The model will then display a "0", "60" and "100" in the blocks next to"Yard tanks". This means that, respectively, 0%, 60% and 100% ofhouseholds will be been provided with the on-site service in eachscenario. Respectively 100%, 40% and 0% will have access to publicstandpipes only. The numbers of households involved are displayedin the next three columns of the table.
Replacement value of shared InfrastructureThe user is asked to enter the replacement value of the shared infra-structure. "Shared infrastructure" refers to all bulk infrastructure, con-nector pipelines, reservoirs, primary reticulation pipe work and publicstandpipes "Replacement value" refers to the cost of constructing theinfrastructure at current prices. The cost is entered in R'OOOs.
6 Excel may be in manual or automatic calculation mode. If in manualmode, the user must press F9 in order for the model to calculate. If inautomatic mode, the model calculates each time a number has beenentered. To change the calculation mode, use "Tools, Options, Cal-culation" on the tool bar.
93
The purpose of this information is to estimate the amount that needsto be spent on maintenance each year, and the amount that needs tobe put aside for asset replacement (see screen 9 "O&M").
Capital cost of on-site connections"Terminals" refer to the pipelines and on-site terminals that serveindividual sites. This therefore refers to the infrastructure that is notshared by other households. Costs are entered in Rands per house-hold.
• The full cost of the infrastructure, if fully purchased, is entered inthe top row for each scenario (cells G18 and H18). If the per sitecost is the same for both scenarios, a cost for only scenario 2needs to be entered and the model will use this cost for scenario 3(i.e. default for scenario 3 = cost for scenario 2).
• The next four rows make provision for reducing the cost of this in-frastructure, for example by households providing labour or bricks.A subtotal is then shown (row 23).
• Provision is made for a percentage discount on the final cost (en-tered as a number).
• The final cash cost per household of the terminals is shown ingreen.
• The total cost of the project is shown in black in the last row of thetable, in R'000.
Financing options: Groups, interest rates and inflationThe next step is to decide how the on-site connections are to be fi-nanced. Two options exists, both of which involve communal savingand the staggering of upgrading. For both of these options, the com-munity is divided into a number of savings groups ("stokvels"). One ormore of these groups is upgraded at regular intervals, while all groupscontinue to make contributions until the project is completed and allloans have been repaid.
The rules of the programme are as follows:
94
1. If a household wishes to leave the scheme, it can be "bought out"by a household wishing to join. The new household must take overthe assets and liabilities of the departing households, so that theeffect on the scheme is neutral. The terms of this take-over are pri-vately negotiated between the parties.
2. If a household wishes to join the scheme when there is no house-hold wishing to be bought out, the new household must make alump-sum contribution equivalent to the total contributed by exist-ing participants, plus interest.
3. If a household wishes to leave the scheme but there is no house-hold wishing to join, it forfeits the contributions already made. Suchhouseholds may be compensated at the end of the project if thereare savings left, but this is at the discretion of the community.
On this screen, the total number of households and the numbers thatare to be provided with on-site connections in scenario 2 and scenario3 are displayed. Provision is made for more households to drop out ofthe scheme than join it, and the user is asked to specify the net num-ber of drop-outs for each scenario (default = 0).
The number of savings groups ("Stokvels") must then be specified forthe two scenarios, and the number of households in each group isdisplayed (row 16)7.
Three other inputs are required (all of which have defaults), namelythe deposit rat© (i.e. the interest earned on savings), the borrowingrate and the inflation rate. The defaults are estimates of current rates(1998). The loan repayment period is specified on screen 6.
The inflation rate is important because the cost of the terminals in-creases over time. The longer the project period, therefore, the higherthe average (nominal) cost per connection.
When entering interest and inflation rates, remember that they need tobe entered as numbers, not decimals or percentages. For example,enter "22" if you wish to record an interest rate of 22 percent.
7 The calculations assume that all the groups are of equal size.
95
Financing option 1: Savings ("pure" stokvel option)The first financing option entails all participating households makingmonthly contributions, which are deposited in a bank account to earninterest. When sufficient finance has been saved, one or more groupsare upgraded. All groups continue to make contributions, and thesavings are withdrawn at regular intervals until all participating house-holds have on-site connections. Additional contributions can be madeif the participating households want a lump sum at the end of the pe-riod. This option is referred to as the "pure" Stokvel option, because itdoes not involve raising loans.
In the table entitled "Timing", for each scenario the user specifies:
1. The frequency of upgrading phases, i.e. the number of monthsbetween the upgrading of groups. In this option, this is also the ini-tial saving period. For example, if a "3" is entered as the frequencyof upgrading phases, then all groups save for 3 months before anyupgrading is done. Then, every 3 months the selected number ofgroups (see point 2 below) are upgraded. The final group is up-graded as soon as enough finance is available (default = every 4months).
2. The maximum number of groups to be upgraded per phase.The model assumes that this number will be upgraded in allphases except the last, when the remaining group(s) will be up-graded (default = calculated so that there are no more than 5 up-grading phases).
The model then shows the number of phases that will be required,and the number of months taken to complete the project. Since thefinal group is upgraded as soon as enough has been saved, the finalphase may be shorter than the preceding phases.
In the table entitled "Contributions and additional savings", theuser specifies the amount that the participants wish to have saved asa group after completion of the project (default = 0). The total cost ofthe project is displayed for information (row 14). The model then cal-culates, and displays, the monthly contributions that are required to(1) finance the upgrade and (2) provide additional savings. The totalmonthly contribution required is displayed in green.
96
The bottom set of tables displays various items of information for thetwo scenarios. The first two rows show the number of connections perphase for the initial phases and the last phase respectively.
The average cost per connection is shown in the next row for eachscenario, in nominal terms. The higher the rate of inflation, and thelonger it takes to provide the connections, the higher will be this aver-age cost.
The total value of the contributions made over the period per house-hold for upgrading (before interest) is shown in the following row, andthis may be compared to the average cost. In this option, the value ofcontributions made for upgrading will always be lower than the costbecause of the interest earned on accumulated savings. The final rowshows the total value of contributions per household, including bothcontributions towards the upgrading and towards additional savings.
Financing option 2: Communal loans with savings ascollateral •••••... ' : :":. . / ' ^ ,/ • • ' • ; > . „ . ' ' • ' • \ .
This financing option entails a combination of communal saving andborrowing, using stokvel savings as collateral and as a source of in-terest income. Borrowing in this manner can significantly improve theloan terms, while the interest earned on savings helps to finance theproject.
Option 1 is the cheaper option in terms of the total contribution madeper household. However, if households can afford only relatively smallmonthly payments, this option would extend the project over too longa period. The second option allows the infrastructure to be built over arelatively short space of time, using loans that are cheaper than ifhouseholds were to raise individual loans.
The procedure is as follows: participating households (in their"Stokvel" groups) all contribute a certain fixed amount each month fora set number of months. A loan is then raised to finance the upgradingof a predetermined number of groups. All the groups continue to makemonthly contributions, but now only some of the money goes into thesavings account while the rest is used to pay the capital charges onthe loan. After a set number of months, a second loan is raised and alarger portion of the monthly contribution now goes towards payingcapital charges. This continues until the last group(s) have been pro-
97

vided with infrastructure. Households then continue to make monthlycontributions until all the loans have been paid off. The community willgenerally be left with an amount of money saved, the size of which willdepend on the monthly contributions made.
The "Timing" information for this option is entered in the same formatas for option 1, with the exception that the initial savings period isspecified separately from the frequency of upgrading phases.
In the table entitled "Contributions and additional savings", theuser specifies:
1. the loan repayment period (default = 24 months), and
2. the monthly contribution per household (default = calculated,on the basis of the cost per connection, loan repayment condi-tions and the initial savings period). This determines the viabilityof the programme, and the instruction is therefore highlighted ingreen.
The model then displays the following information;
1. The total number of months during which contributions aremade, including the initial savings period and the months requiredto fully repay all the loans. This is limited in the model to 60 monthsplus the initial saving period. If this maximum is exceed, a mes-sage "time!" will appear in the green block below (row 17) and themodel will not calculate the total amount saved.
2. The amount saved after completion of the project. This amountcannot be zero if loans are staggered, as explained on the nextscreen. In addition, the value of the savings account cannot fallbelow zero at any stage during the period. If the monthly contribu-tions are too low to maintain a positive balance in the savings ac-count, a message "savings!" will appear in the green block below(row 17) and the model will not calculate the total amount saved.
3. The total cost of the project, for purposes of comparison with theamount saved in each scenario.
The bottom set of tables displays various items of information for thetwo scenarios, as for option 1. The first two rows show the number ofconnections per phase for the initial phase(s) and the last phase re-spectively. The third row shows the average nominal cost per connec-
98

tion, and the last row shows the total contribution per household overthe full period. In this option, the total contribution will always exceedthe cost due to the interest paid on loans.
Financing option 2: GraphsThis screen provides a graphical representation of savings and loansfor scenarios 2 and 3 respectively.
The top two.graphs show the total value of the savings account(green) and the cumulative (or total) loan repayments made on loans,including both interest and redemption. If the "savings" message ap-pears on the previous screen, the savings (green) line will fall belowzero in the relevant scenario. The value of savings after the project isshown by the value of the green line at the end of the project. Thecumulative loan repayment is usually an S-curve because monthlyrepayments are initially small, increase as more loans are raised thendecrease as loans are paid off and no new ones are taken out. Thispattern of repayment is the reason why the total value of the savingsaccount will be greater than zero at the end of the period (sincemonthly contributions are constant).
The two bottom graphs show the total monthly contributions made bythe community (green), and the total monthly value of the loan repay-ments (black). It will be seen that total contributions are constant overthe period, while loan repayments generally begin small, peak aroundthe middle of the period and tail off at the end. This is because alarger number of loans are being repaid in the middle of the periodthan at either end. The exact shape of graph however depends on therepayment period, the frequency of upgrades and the rate of inflation.
Estimated water consumption
The model user enters the expected monthly consumption of house-holds by service type, and expected physical losses as a percentageof total consumption. The model then calculates total water demand.Default amounts can be used in the absence of local information.
Water consumption information is required to calculate operating ex-penditure, particularly when bulk water is purchased, pumped and/ortreated. It can also be useful as a check on whether the proposedprimary infrastructure is designed to supply an appropriate amount of
99
water: too little capacity will lead to obvious problems of supply whileexcessive capacity may mean higher than necessary asset replace-ment and maintenance costs.
Asset replacement, operating & maintenance expendi-ture •• : ' • • ' • ' • • ' ' . /.••• . :•;,. ;••:•" :'•• . "
Recurrent costs (other than finance charges) are dealt with on thissheet.
• Annual asset replacement costs are entered as a percentage ofthe replacement cost of the infrastructure (default = 0.8 percent).The replacement value is displayed, as entered on screen 2, andthe total cost per year is shown in the last three columns of the ta-ble for each scenario (cells H9-J9). Note that this is not necessarilyan actual expense, but a provision for future asset replacement.The user may wish to cancel out this expenditure (by entering a"0") while households are financing the upgrading.
• Pumping costs are recorded by entering the percentage of averagedaily flow that is to be pumped in each scenario, and the cost ofdiesel and/or electricity in terms of the cost per kl of water pumped(c/kl). The average daily flow for each scenario is displayed at thetop of the table (cells I6-J6). The total annual costs are displayed inthe row in which costs are entered (cells H12-J12).
• Treatment costs are recorded by entering a cost per kl of watertreated (c/kl). The total annual costs are displayed as above.
• Bulk purchase costs are recorded by entering a cost per kl of waterbought (c/kl), and the percentage of the total amount used that ispurchased. The total annual costs are displayed as above.
• Other expenditure is entered as an amount per annum for eachscenario (cells H17-J17).
• Maintenance costs are entered as a percentage of the replace-ment cost of the infrastructure, as in the case of asset replacement(see above).
• Staff costs are calculated for each scenario by entering the numberof staff employed in each of four categories, at salary amountsentered by the user.
100
• Provision is made for overheads as a percentage of staff costs. Adefault value of 10 percent of staff costs is used.
The model than calculates total costs per annum for each of the sce-narios, in Rands (row 31). It also calculates the cost per kl of watersold and of water used, the latter including physical losses (c/kl, rows32 and 33).
Monthly billsAll the cost information required to calculate monthly payments is nowavailable. Provision should however be made for non-payment to theservice provider. For example, funeral expenses may mean that ahousehold has insufficient resources to pay its water bill for a monthor two. If provision is made for this, then the service provider can ac-commodate such problems without jeopardising its financial viability.A non-payment rate of, say, 5% should be allowed.
It is important to note that this non-payment is different to a permanentunwillingness/inability to pay for the services provided. Unpaid bills forthe latter reason are dealt with on the next sheet as a "willingness topay" issue.
Having set a non-payment rate, monthly payments (or household bills)can then be calculated. The first decision to be taken on the currentsheet is the amount that needs to be paid to the service provider byhouseholds with and without on-site services respectively. Theamounts to be paid are determined by entering a payment ratio foreach scenario in the blue blocks (cells HG9 and 19). For example,entering a "2" for the on-site service means that the average monthlypayment for this service will be twice the payment for a standpipeservice.
The decision on payment ratios is assisted by the provision of monthlycost ratios, which are calculated from the monthly costs of serviceprovision displayed in the third table on this screen. The cost ratiosare displayed to the left of the payment ratios in the top table. Thedefault payment ratios are equal to these cost ratios.
Once the payment ratios and "normal" non-payment rates have beenset, the model calculates monthly water bills payable to the serviceprovider to ensure that its total annual expenditure requirements are
101
met. These are displayed in the last three columns of the top table, forscenarios 1, 2 and 3 respectively.
The second table on this screen displays the monthly household con-tributions toward the upgrade for financing option 1 and option 2 re-spectively. The second decision to be taken by the user is the fi-nancing option to be used. Entering a " 1 " into the blue block at thetop right hand corner of the table will select option 1, otherwise option2 will be selected (by default).
The green blocks in the last three columns display the total monthlypayments due by households, both to finance the upgrade and to paythe service provider for operating the service. Total unpaid bills, whichare calculated on the next sheet and discussed below, are reflectedhere directly below the total monthly payments.
The total monthly income required by the service provider to ensurefinancial viability is shown in the last line on the sheet.
Willingness to pay & amounts unpaid
The monthly payments necessary for financial viability have been seton the previous sheet. The question to be answered on this sheet iswhether households are able/willing to make these payments. In orderto establish this, it is necessary firstly to establish willingness to payby income category, and secondly to allocate services to incomegroups to match willingness to pay with monthly bills.
• The user enters the amounts that households in each incomecategory are willing to pay in the blue blocks in the top right handtable (cells E7 to E10). The default amounts shown to the right ofthe input blocks are calculated as respectively 10%, 7.5%, 5% and5% of the average income for each category.
• Total monthly bills are displayed in green in the top right hand ta-ble. The amounts shown here are the total amounts calculated onthe previous screen and highlighted in green ("Bills", K14-M15).
• The model allocates services by assuming that on-site connectionsare allocated to higher income households first (bottom right handtable).
102
• The total amounts billed, paid and unpaid per year are shown inthe bottom left hand table. The total amounts paid are calculatedby assuming that households whose bills exceed the amounts theyare able/willing to pay, pay as much as they are able/willing to. Theremainder becomes "unpaid bills".
SummaryTable 1 on the final sheet of the model summarises the key featuresof the two finance options for each scenario, in terms of monthly andtotal contributions per household, costs and total amounts saved bythe community.
Table 2 summarises the key features of the scenarios modelled. Thefirst row shows the percentage in each scenario with on-site connec-tions. The second row shows the full purchase cost of each connec-tion, and the third row shows the actual cost after household (in-kind)contributions and negotiated discounts. The next row shows themonthly financial contributions to be made per household to financethe on-site terminals. The financing option selected is displayed in thefirst column of the Table.
Monthly payments are then shown for households using public stand-pipes and those with on-site terminals respectively. The final rowshows the total amount of unpaid income per annum for each of thescenarios.
The meaning of unpaid bills
If a scenario produces unpaid amounts, it means that (some) house-holds are receiving services that they cannot afford to or are unwillingto pay for. The service provider will not remain financially viable, andthe scenario needs to be re-examined to see where changes are pos-sible. Possible changes, within reason, include:
• negotiating increases in the amounts that households are willing topay and/or longer saving periods between upgrades;
• financing the infrastructure in a different manner, for example se-lecting option 2 if option 1 has been selected;
103
• reducing the cost of on-site services for example by encouragingvillagers to provide their labour and make bricks;
• negotiating more favourable loan conditions and/or higher rates onsavings accounts;
• reducing the proportion of households to receive on-site services;
• reducing operating and maintenance costs, for example, through adifferent staffing system.
If these steps fail to eliminate non-payment, a more fundamental re-think of the project is necessary.
104

Ptoject Description
Province:
Village:Description:
Run:
Scenarios
Base year:
Assessment by:
MyunyangPsrtuiliari village
J(=1,2.3etc.)
Scenario 1 is standard • public standpipes only for residential consumersSctnaiio 2 : partial upgrading to yard tankf . .'.•" ' ' is *;••., * •'•S n n s r i o 3 i i O O l * u p g r a d i n g t o y a r d U n t o '' > i . y \ ; :::-;j: :::;, ,,:::|;::-;:
Date(dd/mm/yy)[
105
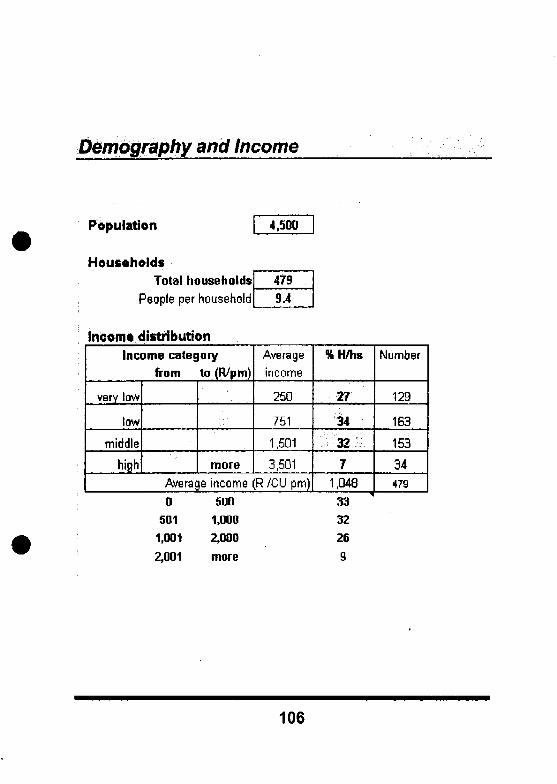
Demography and Income
Population 4,500
Households
Total households
People per household4799.4
Incom* distribution
Income category
from to (R/pm)
ve_ry_ low
low
middle
high more
Average
income
250
751
1.501
3,501
Average income (R /CU pm)
%H/hs
2?
34
S'nS.7
1,048
Number
129
163
153
34479
0501
1,001
2,001
5001,000
2,000
more
3332
26
9
106
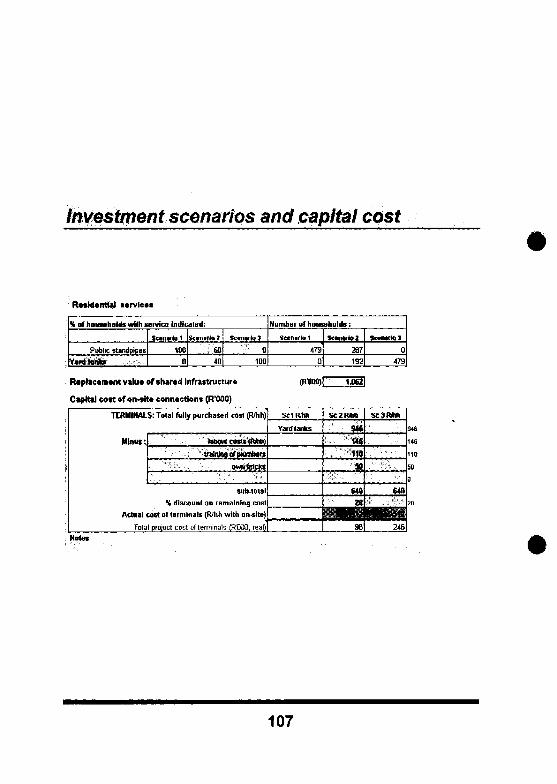
Investment scenarios and capital cost
FUtMantttt • t r v i e o i
S of hoimliDlilawithuivics Indicated:
Public sstamtpipesy.ni(«»ta .•*;« :
Scinvtoi
1000
Steimta?
40
Scgngrlo 3
••?;:: " 0
100
Number of households;
scenario 1
4790
sniMfiaz
287192
sumnai
0479
R*p l ic (m*nt valu* of shared infrastructure
Capital «OM «f on-sit* cennactions (R'000)
TERMINALS: Total fully purchased cost (R'hh)
Minis:
I
MMut costs (IVhti)
triMflgiirpluBibiirs
owiDrlcta
sub-iotai
% discount on rBmainfng costActual cost of terminals (R/hh with on-site)
Total project cost of termingls (ROGO, rBal)
sciRihh
Yardtanks
=
SC2RMI
' ***1 «
110
640
98
scanwi
£40
2ts\Notes
107
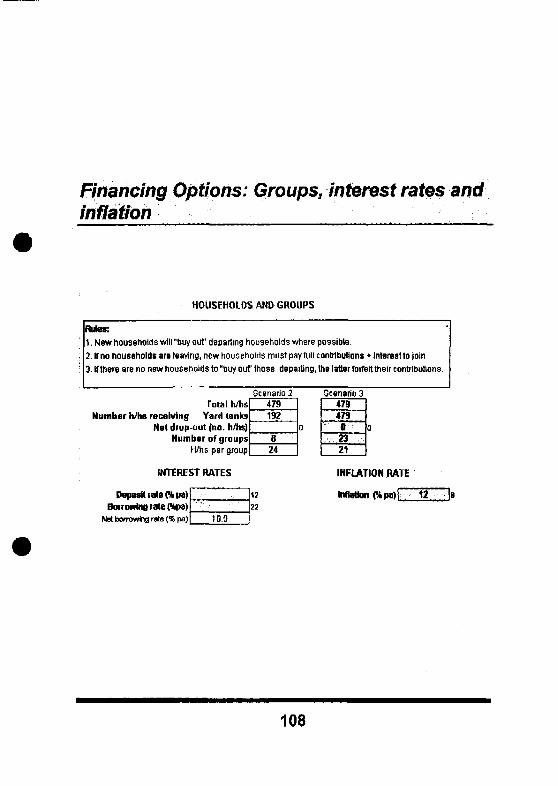
Financing Options: Groups, interest rates andinflation
HOUSEHOLDS AND GROUPS
Rules:1. New households will "buy ouf departing households where possible.2. If no households are leaving, new households must pay full contributions • Interest to join3. If there are no new households to "buy our those departing, the latter forfeit their contributions.
Total h/hsNumber h/hs receiving Yard tanks
Net drop out (no. h/hs)Number of groups
H/hs per group
INTEREST RATES
Scenario 2
479192
824
0
Scenario 34794790
•.'¥•.: 2 3 :;.',
21
Deposit ra»a ft pa)
Botrowino rate flkpa)
No) borrowing rate (% pa) 10.0
INFLATION RATE
Inflation (it pan 12
108
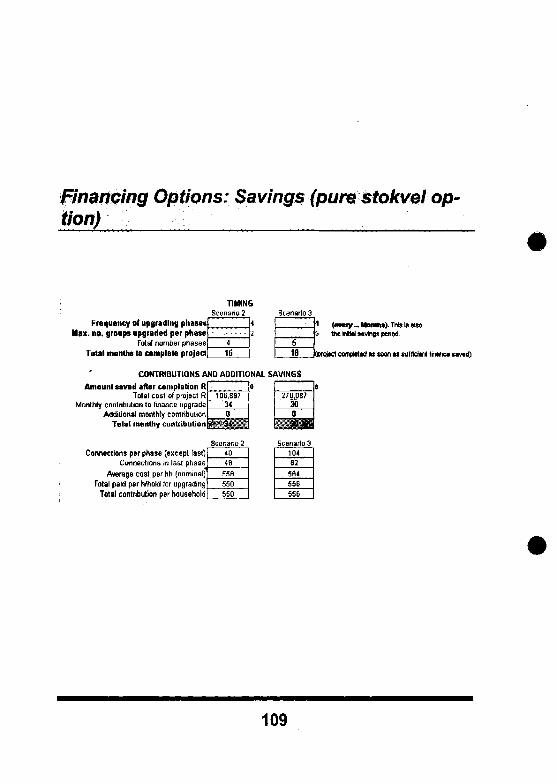
: Savings (pure stokvel op-tion)
Frequency of upgrading phase*Max. no. groups upgraded per phase
Total number phasesTotal months to complete project
TIMINGScenario 2 Scenario 3
416
4
2
518
<««y._ Month*). This is also5 the MM savings period.
[project completed « soon as sufficient finance saved)
CONTRIBUTIONS AND ADDITIONAL SAVINGS
Amount saved after completion R w
Total cost of project RMonthly contribution to finance upgrade
Additional monthly contributionTotal mouthy contribution |£
106,897340
D
270,067300
Connections per phase (except last)Connections in last phase
Average cost per hh (nominal)Total paid per h/hold for upgrading
Total contribution per household
Scenario 24848
558
550550
Scenario 310462
964556556
109
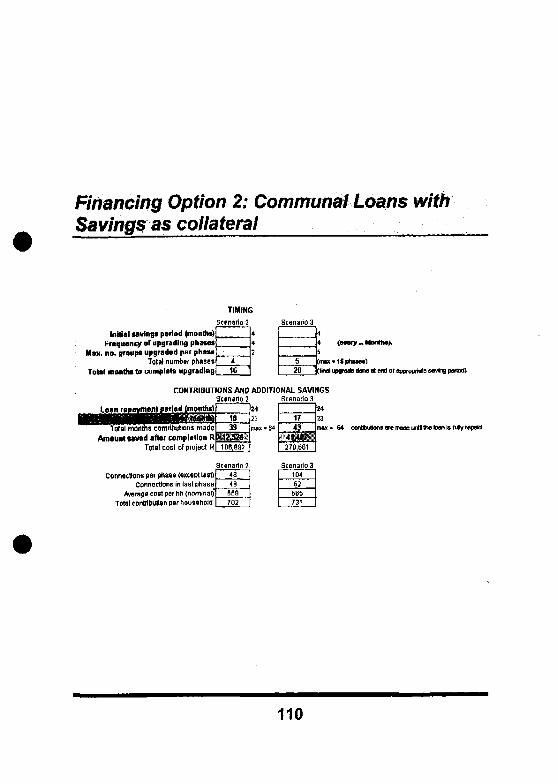
Financing Option 2: Communal Loans withSavings as collateral
Initial savings psriad (month.)
Fraquancy of upgrading phasesMax. no. groups upgraded par phaat
Total number phasesTotal month* to camBlau upgrading
TIMING
scenario 2
416
44
Scenario 3
520 •
445(max • IS phatn)(final upgrada done at end of epproprWe ssvtio period)
CONTRIBUTIONS AND ADDITIONAL SAVINGSScenario 2 Scenario 3
period ii _17
Total months contributions madeAmount tavnd after completion R
Total cost of project R
39
106,88?
24
max-6« - 64 artitAjfors are iradeunll the ban Is f i*y repaid
Connections per phase (except last)connections in last phase
Average cost per hh (nominal)Total contribution per household
Scenario 24349
558
702
Scenario 3104
63SEE731
110
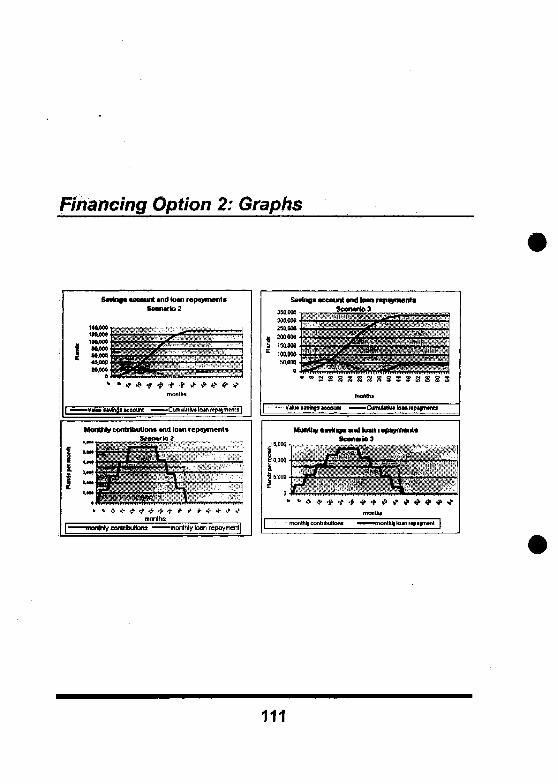
Financing Option 2: Graphs
Stvlnga account and loan repayments Savings account and loan repayment*
300,000
260.000
200,000
150.000
100,000
50,000
* >
p T ^P ,. VJIU, > wjnjf - Cumuttttv* totn rtptymnts
Monthly contribution* and loan repayments
monthly contritHikmi ^^^mt?nthly loan repayment]
Manthy tMtnge and knn refkayvrwnt*
JB.0O9
v.;:e'-"vlf
111
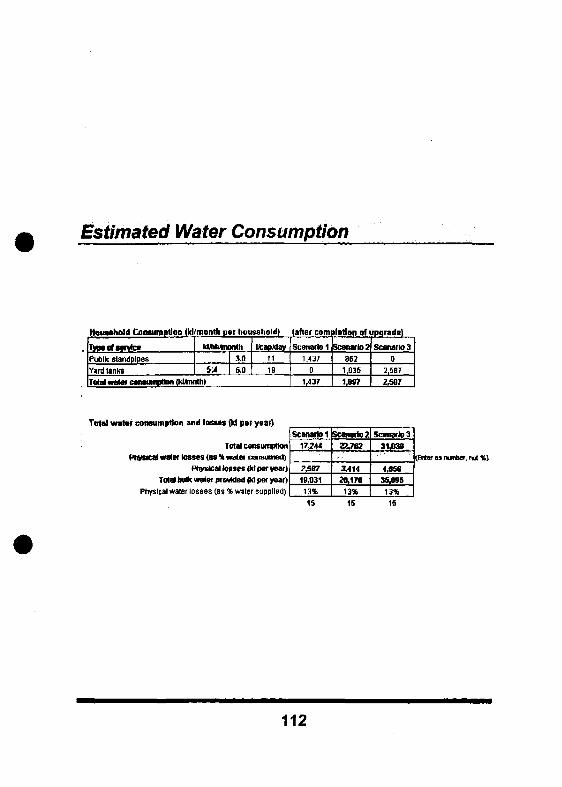
Estimated Water Consumption
Houwhold Consumption (Id/month per household)
Type of servicePublic standplpesYard tanks
kUiMnonth
.Si4
3.06,0
IfcapMay1119
Total water consumption (kUnnth)
(after cam
scenario 11,437
01,437
•ration of upqrade)
Scenario 2862
1,035
Scenario 30
2,5872,587
Total wat i r consumption and loraa* (kl pel year)
PWS* aterloTotal consumption
s (as % water consumed)Physical losses (kl per year)
Total bulk water prmMed (kl per year)Physical water losses (as % water supplied)
Scenario 117,244
2,58719,83113%
Scenario 222.782
3.41420,178
13%
Scenarios31,030
4.8S635,695
13%
(Ert« as number, not %)
15
112
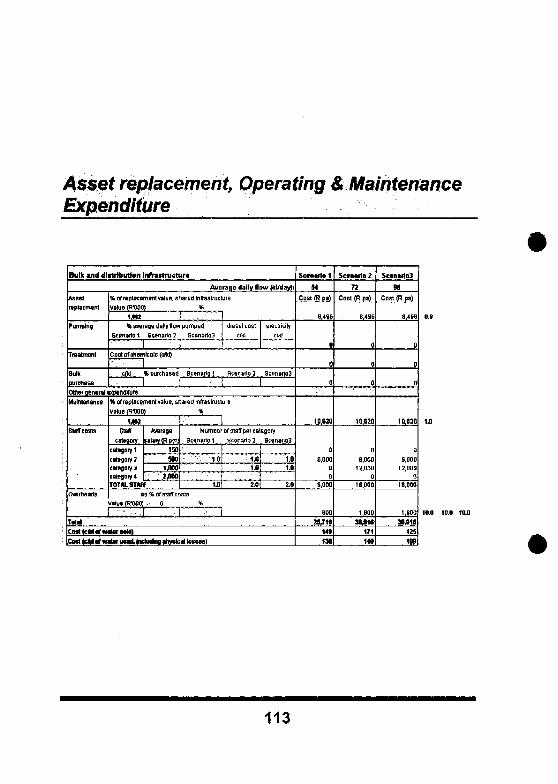
Asset replacement, Operating & MaintenanceExpenditure
Bulk ind distribution InftutructurtAverage dgllv flow |M/day):
Assetreplacment
Pumping
Treatment
BulkpurchaseOther generalMaintenance
Stall costs
overheads
TotalCoat (OM of mCostloMofun
% or replacement value, shared InfrastructureValue (RUOO) *
I/Kl% average dally flow pumped
Scenario 1 scenario 2 Scenarios
dieSel cd$t
C/kl
1. J
electricity
cojstofchsrnlcalo (c/H)
CIM * purchased Scenario 1 Scenario 3 Scenarios
1pcpenditure% of replacement value, shared Infrastructure
value IROOO) %
1.H2stair
categorycategory 1category]category icateooiy*
Average(alary (R prvjj
190900
1.0003,0011
TOTAL STAFf
Number Of staff per categoryScenario 1 Stflnarto 2 Sccn8rio3
1.0
1.0
1.0
J.o
1.01.0
2J1
™m(RD00; - o %
,;„:,;,:;„•;,•„;! •„;•••[ , ;
• a U H L taaidtag physical losses)
Scanarlii 1
94Cost (R pa)
8.496
0
0
0
10.E20
06,000
00
6,000
60025,716
149130
Scenario 2
72Cost fR pa)
6,496
0
0
0
10,620
06,000
12,0000
18,000
1,80038,916
171149
Scanario3
96Cost (R pa)
8,496
0
0
0
10,130
06.000
12,8600
18,000
1,60038*18
125
109
IOLO 1D.0 10-0
113
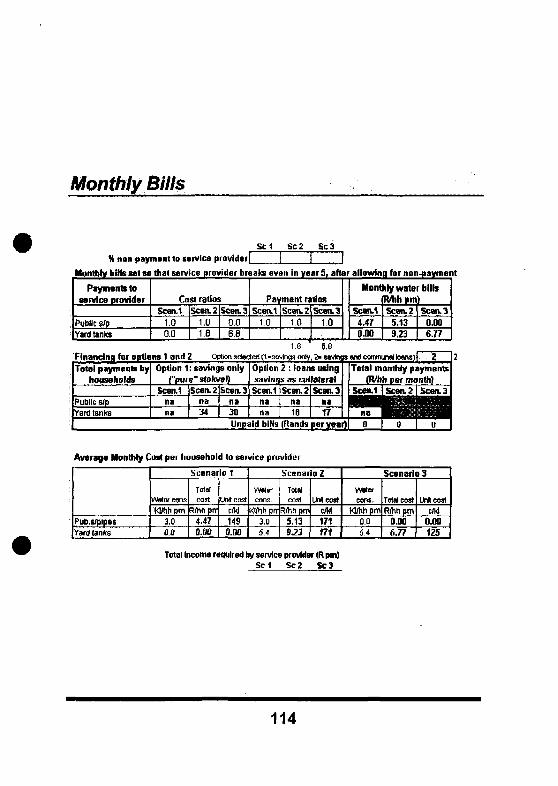
Monthly Bills
Sc1 Sc2 Sc3
* nonpayment to service provider! I I I
Monthly bills set so that service provider breaks even in year 5, after allowing for non-payment
Payments toservice provider
Public s/pYard tanks
Cost ratiosScen.1
1.00.0
Seen. 2
1,01.8
Seen. 3
0.06.6
Payment ratiosiScen^
1.0Scen.2
1,0Seen. 3
1,0
Mon«
Scen.1
4.470.00
ih/wateR/bhpmScen.2
S.139.23
r bills
Scan. 3
0.006.77
financing for options 1 and Z1.8 6.8
Option selected (1 -savings only, 2- wrings and canmural loans)I 2 |2Total monthly payments
(R/hh per month)Total payment* by
householdsOption 1: savings only
("pure"stokvel)Option Z : loans usingsavings as collateral
Scen.1 Scen.2 Seen.3Public s/pYard tanks 34
Scen.1
30
Scen.2
18
Seen. 3
17Unpaid bills (Rands per y»ar)
Average Monthly C U M per household to service provider
Pubs/pipesYard tanks
Scenario 1
WKer consM/hh pm
3.00.0
Totalcost
Wn prr4.470.00
Unit costc/kl149
0.00
Scenario 2
watercons.
<l/hh prr3,05.4
Totalcost
3/hh PIT
S.139.Z3
UnScojtcfkl171171
Scenario 3
watercons.
Kl/hhpm0.05.4
Total costR(hhpm
0.006.77
umtcostc/kl
0JU1Z5
Total income required by service provider (R pm)Sc 1 Sc 2 Sc 3
114
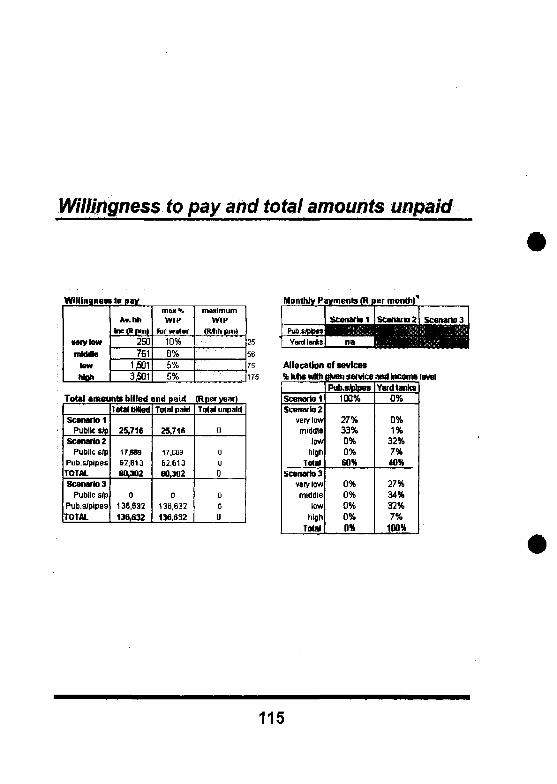
Willingness to pay and total amounts unpaid
Wllllnqnew to pay,,
very lowmlddto
lowhigh
A.. I *inc(Rpn>>
250751
1,5013501
WTPfor water
10%8%5%
maximumWTP
(R/Tihpm)
Monthly Payments (R per month)'1
25
56
75
175
Allocation of sevlca*
% Mis with given sendee and Income level
Total amounts billed and paid (R per year)
Scenario 1Public s/p
Scenario 2Public s/p
Pub.s/plpesTOTALScenario 3
Public s/pPub.s/plpes
TOTAL
Total UMed
25,716
17,63962,61380,302
0136,632136,632
Total paid
25,716
17,68962,61380,302
0136,632136,632
Total unpaid
0
000
000
Scenario 1Scenario 2
veiylowmiddle
lowhigh
TotalScenario 3
veiylowmiddle
lowhigh
Total
Pub.sMpes100%
27%33%0%0%60%
0%0%0%0%0%
Yardtanks0%
0%1%
32%7%40%
27%34%32%7%
100%
115
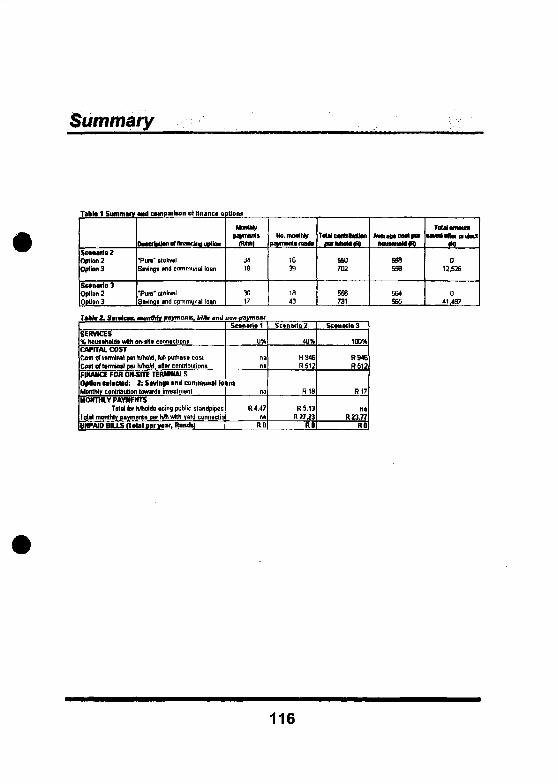
Summary
Tibia 1 Sumimiy and mmpariaon of flnanca optlora
Scanarlo 2Option 2Option 3
Scenario 3Option 2Options
DOOMW MftanCh, SMian
"Pura" stokvalSaving! »nd cummunal lo&n
Tun" slok™lSavings and communal fDan
MOMMygaymMs
<R*rO
3419
3017
No.momhVnavnaManwtt
1639
ie43
laulciMIIMlUonM-MiaUtR)
560702
em731
• W a s * coal parhauaanouro
55a55a
564S65
Tow m o maavM altar prulBd
TO
013,526
041.497
Tibia I, SanricM. manthhf paymanm. bills and non-payment
SERVICE*% touftholoi with on-iita connscliorreOUTTAl COSTCoat of laimlnal par h/nolo, full puitwii costC0ft of ttrmlnal par h/holdr aftar contributionsFINANCE FOR ON-SITf TERMINALSOption ulacud: 2: Swingt and communal IsMonthly contribution towards invastmuntMONTHLY PAYMENTS
Total for h/holds using public standpipeitotal monthly paYinants twr h/h with yard connactioUNPAID BILLSJTjt.l,.rr.r, Ran*)
Scanarlo 1
0%
h*na
insna
R4.47na
R0
Scanarlo 2
40%
R94ER512
R18
R5.13R21J3
RO
Scanarlo 3
100%
R9«R512
R 17
naR 23.77
R0
116

training
Training for Cost Recovery & Sustainability
The Mvula Trust has been an innovative leader in demand-driven ap-proaches to water supply and sanitation provision since its inceptionin 1993. The approach is unique in that it engages communities indecision-making and management of water services (including sanita-tion). Mvula's experience has supported what other internationalcommunity water and sanitation projects have argued for years, i.e.-effective capacity at the local level is a prerequisite to ensuring thesustainability of water and/or sanitation schemes.
Currently, in South Africa, very little training is being provided in thecommunity water supply and sanitation (CWSS) sector. There arevarious ad hoc project-related attempts to improve the skills base ofwater and sanitation committees, consultants and local governmentstaff. In Mvula's experience and through funders' evaluations of theimpact of this training, these courses vary considerably in terms ofquality and content and, for various reasons, usually lack meaningfulimpact. There is a significant gap between training needs and oppor-tunities in the CWSS sector.
The training component included in this Help Manual forms part of alarger initiative to develop an integrated South African CWSS sector-specific training programme which links proven participatory trainingmethods with the specific opportunities and constraints encounteredin the sector. The training approach utilises participatory trainingmethodology. The material examples on the following pages used inboth poster and board formats, depict the messages in the table be-low. If focuses firstly on the benefits of water, the reasons for commu-nities to sustain their own systems, community choice - both technicaland financial, etc. The material is interpretative, and should be used inconjunction with the slides and field experience.
117
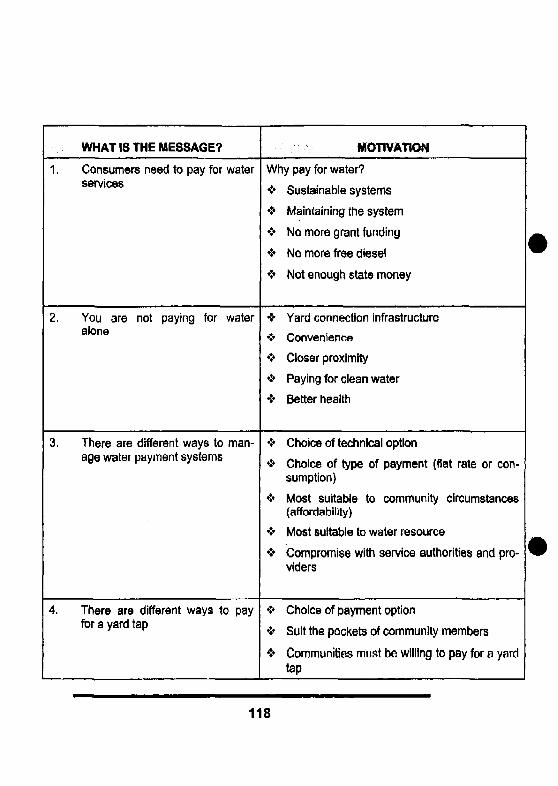
1.
2.
3.
4.
WHAT IS THE MESSAGE?
Consumers need to pay for waterservices
You are not paying for wateralone
There are different ways to man-age water payment systems
There are different ways to payfor a yard tap
MOTIVATION
Why pay for water?
• Sustainable systems
•
*•
•
•
Maintaining the system
No more grant funding
No more free diesel
Not enough state money
Yard connection infrastructure
Convenience
Closer proximity
Paying for clean water
Better health
Choice of technical option
Choice of type of payment (flat rate or con-sumption)
Most suitable to community circumstances(affordability)
Most suitable to water resource
Compromise with service authorities and pro-viders
Choice of payment option
Suit the pockets of community members
Communities must be willing to pay for a yardtap
118
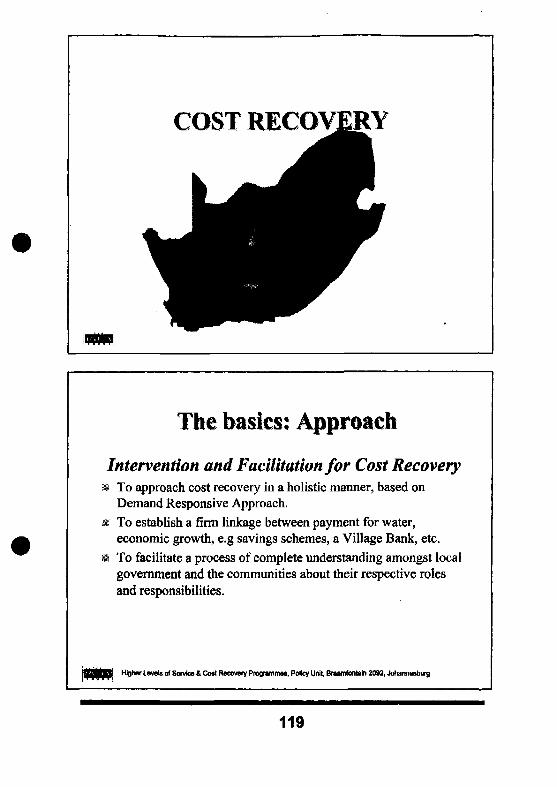
COST RECOVERY
The basics: Approach
Intervention and Facilitation for Cost Recovery» To approach cost recovery in a holistic manner, based on
Demand Responsive Approach.
* To establish a firm linkage between payment for water,economic growth, e.g savings schemes, a Village Bank, etc.
• To facilitate a process of complete understanding amongst localgovernment and the communities about their respective rolesand responsibilities.
Higher isveig of Swvfca & Cost Recovery Programmes. Policy Unit, Brumfbnttln 2082, Johwiwiburg
119
The basics: Approach(Cont.)
• To facilitate a process of cross-subsidisation of householdinfrastructure between local government and communities.
K To create an awareness amongst consumers of the benefits ofwater and their obligations to foster sustainability.
& To create a link between water and an ethos of savings.ii To use water as an entry-point for poverty alleviation and job
creation through the facilitation of multi-sectoral partnerships.
Higher Levels of Sen/flea & Cost Recovejy Programmes, PoHcy Unit, Braamfontefn 2092, Johannesburg
Cost Recovery: Introduction
Why do consumers need to pay forwater?
• Capital funds = insufficient
* Public funds = insufficient
is Payment guarantees sustainablesupply
* Health and other social benefits
si Economic growth potential &poverty alleviation
Higher Levels of Saves & Cos! Recovery Programmes, Policy Unit, Braamfontein 2092, Johannesburg
120
Payment Pre-conditions
Communities will pay if they:• Have a choice of technical options
a Have a choice of type of payment system
M Have a choice of service level: yard connection and/or
standpipe
m Are willing and able to pay for water
i Have affordable and resource-applicable technical options
m Have a workable compromise between WSA and WSP
» Acceptable service standard and delivery
Higher Levels of Service & Cost Recovery Programmes, Policy Unit, Braumfantnln 2082, Johannesburg
Payment Environment
Consumers will pay if:• They get their chosen service level
i The standard and quality of water is acceptable
it They perceive benefits such as:
a relationship between water and production
poverty alleviation and economic activity
relative cost of water versus other expenditure
• It is in the common interest of the communitym An enabling policy environment exists
Higher Levefe of Service & Cost Recovery Programme*, Policy Unit Bwunfontaln 2092, Johanrwsburg
121
Payment Environment
Consumers will pay if:(continued..)\
There is enforcement of paymentpolicy
. They have a perception of ownershipand responsibility
There is transparency andaccountability in financialmanagement
* A conducive institutional frameworkexists
Higher Levels of Service & Cost Recovery Programmes, Policy Unit, Braamfonteln 2092, Johannesburg
122
financial Options for Rural«£ater Provision
Rural Water Provision
Finance OptionsCommunity mobilised
funds --ngs Investment (Stokvels)>n
ngs ('pure' Stokvels)n
itional Loansil Loan Option
Subsidisation
123
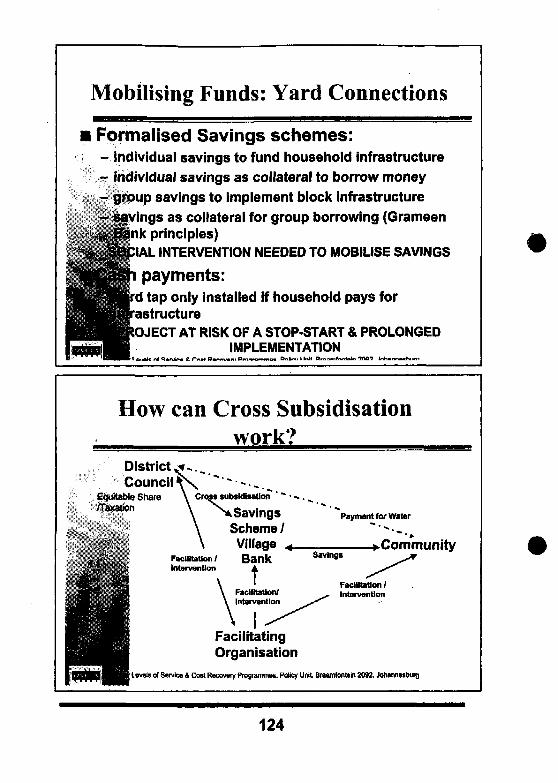
Mobilising Funds: Yard Connections
Formalised Savings schemes:- individual savings to fund household infrastructure
- individual savings as collateral to borrow money
- group savings to implement block infrastructureings as collateral for group borrowing (Grameen
ink principles)IAL INTERVENTION NEEDED TO MOBILISE SAVINGS
payments:tap only installed If household pays for
astructureOJECT AT RISK OF A STOP-START & PROLONGED
IMPLEMENTATIONn WWW Miannwhi m
How can Cross Subsidisationwork?
District ^ _Council V \ ~"~--.^m^
Equitable Share \ Crqsa subsidisation*" -
\ >a, Savings\ Scheme /\ Village ,
Savings
Facilitation/Intemntlon
Facilitation/ B a n kIntervention A
FacilltaUonVIntarvantion
FacilitatingOrganisation
Uvslt of Sttvloj & Crnt Recovsiy Pfograiraima, policy Unit, Braamfonleln 2092,
Payment for Water
-^Community
124
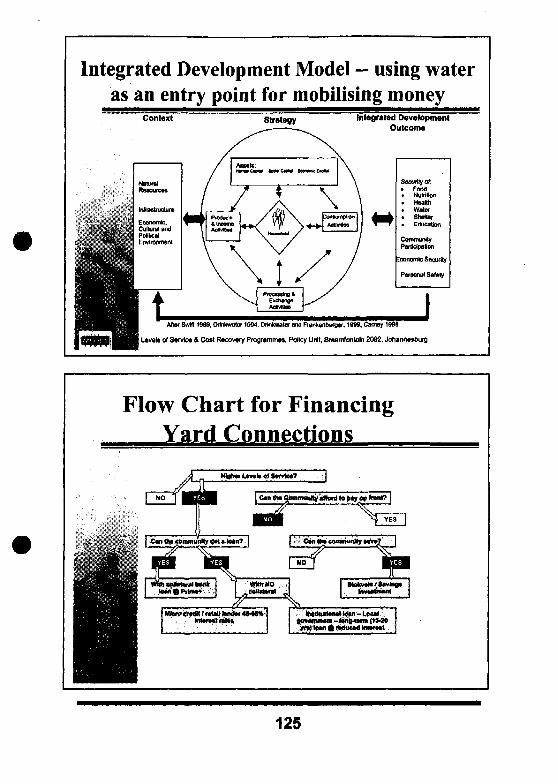
Integrated Development Model — using wateras an entry point for mobilising money
Context Strategy Integrated Development^ _ _ — - — — - ^ _ ^ Outcome
NBtUfBl1 Refourca*
•; . . .•;;• J d cnrnBtuaun
; s y l i i i i f t B i l Cultural andimmBSm P a n i c *
Environment
/
AiaaH:HK)«)Cv«l SKWCtflD IWWMtCVifl
\
/ / \ \ \
\\
Pnduci
V\
ActtvtUsa
J
Security of:• Food. Nutrition
. Water
• Shaltw• Education
CommunityParticipation
Economic Sacuflty
Personal Safety
^ 13 U H H U I Alnr Swift 1958, Drinkwater 1904, Orlnkwatar and Franfcsnbarger. 1M9. Camay 1996
I S S M B i H H I Levels of Service & Cost Recovery Programmes, Policy Unit, Braamfonlsin 2092, Johannuburg
Flow Chart for FinancingYard Connections
| Can tin ̂ mirrmnrty .Biinl to Myw W"t?
Stokvuiftaviftavineil
125
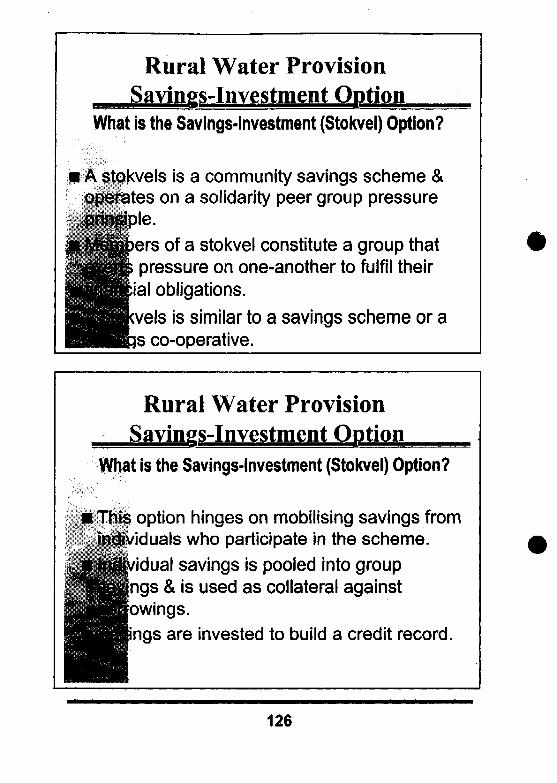
Rural Water ProvisionSavings-Investment Option
What is the Savings-Investment (Stokvel) Option?
i A stokvels is a community savings scheme &operates on a solidarity peer group pressureprfgple.
srs of a stokvel constitute a group thatpressure on one-another to fulfil their
;ial obligations.
<vels is similar to a savings scheme or ajs co-operative.
Rural Water ProvisionSavings-Investment Option
What is the Savings-Investment (Stokvel) Option?
This option hinges on mobilising savings fromiduals who participate in the scheme.
dual savings is pooled into groupngs & is used as collateral againstowings.
ngs are invested to build a credit record.
126
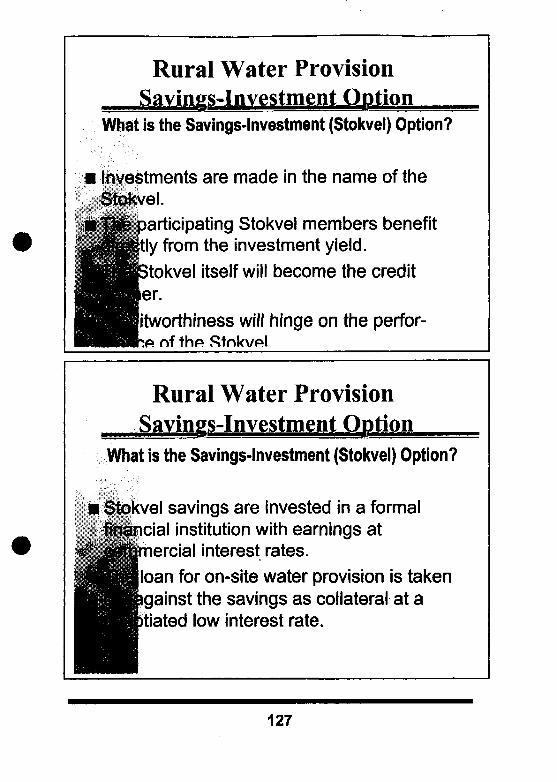
Rural Water ProvisionSavings-Investment Option
What is the Savings-Investment (Stokvel) Option?
Investments are made in the name of the
articipating Stokvel members benefittly from the investment yield.
tokvel itself will become the crediter.
itworthiness will hinge on the perfor-
Rural Water ProvisionSavings-Investment Option
What is the Savings-Investment (Stokvel) Option?
Stokvel savings are invested in a formalcial institution with earnings at
ercial interest rates.
loan for on-site water provision is takengainst the savings as collateral at atiated low interest rate.
127
Rural Water ProvisionSavings-Investment Option
What is the Savings-Investment (Stokvel) Option?
The collateral is on-going against borrowingsaj||J interest is offset against the loan.
el savings and borrowing occur parallel.
oans are staggered and repayments cal-d taking both interest earned and top-upnts into account.
Rural Water ProvisionSavings-Investment Option
What is the Savings-Investment (Stokvel) Option?
loan repayment % constitutes therence between % interest earned and %est paid.
duration of the process depends on theIs and speed of savings.
128
Rural Water ProvisionSavings-Investment Option
What is the Savings-Investment(Stokvel) Option?
en all loans are repaidStokvels savings cann be applied at thecretion of theicipating member
ups.
Rural Water ProvisionSavines-Investment ODtion
Advantages• This option is possible i
there is a total buy-in^ ^ J $ i n members.^ ^ H u p pressure'^^HHBances repayment
HH^ffings groups takeHHHonsibility for the
M i ntin9tima
Disadvantagesf • No enabling environ-
ment currently exists forthis type of loanarrangement.
• Training savings groupsis expensive.
• A facilitating organisa-tion is crucial to theprocess.
129

Rural Water ProvisionSayines-Investment Option
Advantages• The whole community
ultimately benefits from^ Jhe savings scheme.
Stokvel membersbecome credit-
her credit atotiated rates
DisadvantagesOn-site water provi-sion cannot happensimultaneously to allhouseholds.
The process is longand members mayloose interest.
Rural Water ProvisionSavings ('pure' Stokvel) Option
In the instance of the Savings ('pureStokvel) Option, no money is borrowedand the stokvel savings are depositedand withdrawn as and when thecommunity needs it.No savings are amassed.
130
Rural Water Provision:Institutional Loan Option
What is an institutional loan?
It is an urban model for paying for a utilitythrough levies, tariffs and taxes.
^ state structure such as a local authorityegotiates a loan with the D6SA at a lowterest rate, repayable over a 10-20 yearhod.
Rural Water Provision:Institutional Loan Option
What is an institutional loan? (cont.)The local authority takes full responsibility for
prepayments.local authority has the obligation to put
wn management processes in place forI lection of levies, tariffs or taxes.
management structure used by the localority can be negotiated with the Watermittee
131
Rural Water Provision:Institutional Loan Ontion
• CommunityWater tariff determined inconjunction with LocalAuthority
J § § j | | collected by Water
^ ^ ^ • K d into betweenJHI||||B Services ProviderIHHHuthority (WSAct)
• Local AuthorityTariffs determined &levied by Local Authorityand Water ServicesProvider (WC)Upkeep of resource i.t.o.negotiated obligations.
Rural Water Provision:Institutional Loan Option
Mvula Trust Facilitation Process
Service Agreement between Water Serviceswider and Authorityriff setting and affordability
onitoring of duties and responsibilities i.t.o.rvice Agreement
anagement obligations of Water Committee
nancial negotiations with financial institutions
132
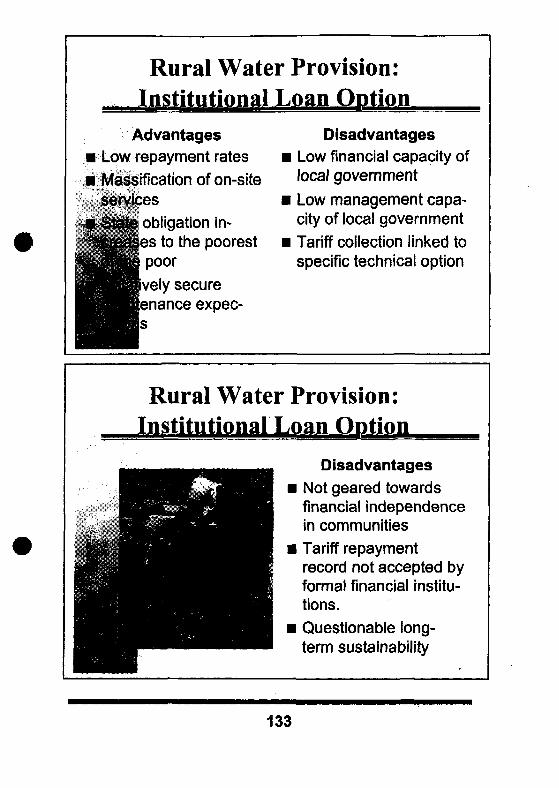
Rural Water Provision:Loan Ootion
AdvantagesLow repayment rates
Massification of on-site
obligation in-to the poorest
ively securelance expec-
s
DisadvantagesLow financial capacity oflocal government
Low management capa-city of local government
Tariff collection linked tospecific technical option
Rural Water Provision:Institutional Loan Ontion
DisadvantagesNot geared towardsfinancial independencein communities
Tariff repaymentrecord not accepted byformal financial institu-tions.
Questionable long-term sustainability
133
Rural Water ProvisionRetail LoanXkrtion
What is the Retail Loan Option?Retail lenders normally work in conjunctionwith financial guarantee schemes.
ese schemes underwrite a % of theicipated payment defaults.
|e retail lender enters into a loaneement with individual communitymbers or with a constituted organisation.
Rural Water ProvisionRetail Loan ODtion
What is the Retail Loan Option? (cont.)Loans are not supported by individual or
mmunity collateral.condition for a loan may be a small
osit from individuals, which is used asjurity.M payment history is taken into accountn a loan is considered.
134
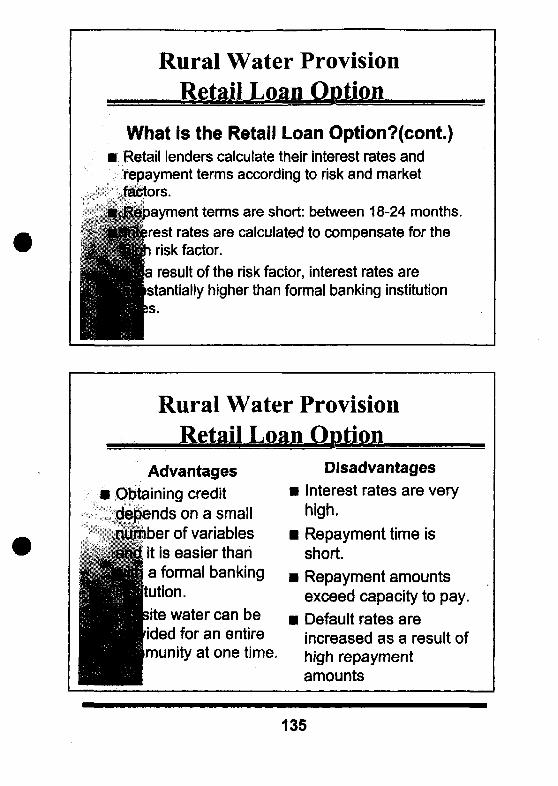
Rural Water ProvisionRetail Loan Qntion
What is the Retail Loan Option?(cont.)Retail lenders calculate their interest rates andrepayment terms according to risk and marketfactors.
ayment terms are short: between 18-24 months.rest rates are calculated to compensate for therisk factor.
|a result of the risk factor, interest rates arestantially higher than formal banking institutions.
Rural Water ProvisionRetail Loan Ootion
Advantages• Obtaining credit
depends on a smallnumber of variables
^ a n d it is easier thanjg^ajMjfl a formal bankingiSp|Hjtution.H^HHsite water can be^^HHpded for an entireH^^Kmunity at one time.•H
Disadvantages• Interest rates are very
high.• Repayment time is
short.• Repayment amounts
exceed capacity to pay.• Default rates are
increased as a result ofhigh repaymentamounts
135
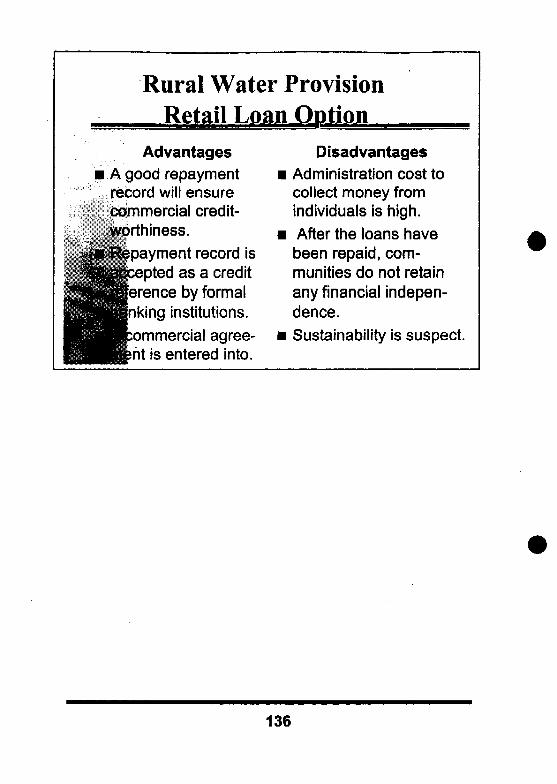
Rural Water ProvisionRetail Loan Option
Advantagesi A good repayment
record will ensure.^,, commercial credit-..^porthiness.^Repayment record is
JlBEcepted as a credit^^^merence by formal• • H | n k i n g institutions.•HHBommercial agree-P J U n t is entered into.
Disadvantages• Administration cost to
collect money fromindividuals is high.
• After the loans havebeen repaid, com-munities do not retainany financial indepen-dence.
• Sustainability is suspect.
136
'i' TechnicalOptions for
YardA Connections
Higher Lev«fs of Servte 8. Cost Recovery programmes. Policy Unit Bfaamfontein 2092, Johannesburg
Levels of Service
$ Rudimentary Systems$RDP Level® Low Pressure yard connections^Medium Pressure yard connections$Full Pressure yard connections
137

Technical Options* Option 1:
- Mixed levels of service: communal standpipe + yard taps and flat-rate payment system
* Option 2:- Higher levels of service: yard taps and manually metered payment
system (considering the indigent)
* Option 3 :
- Higher levels of service: yard taps and pre-payment meteringpayment system (considering the indigent)
$ Option 4:- Higher levels of service: yard tanks and manifold system (pre-
payment)
i Higher LBvels of Service & Cost Recovery Programmes, Policy Unit, Braamfontain 2092, Johannesburg
Technical Options
Option 1:- Communal standpipe + yard
tap and flat-rate payment1. Households pay a set fee for their
yard connection.
2. Households who do not want a yardconnection obtain water fromstandpipe and pay a set amount ofe.g. R20 per month.
3. Households who have a yardconnection pay a set amount of e.g.RiOper month
* Option 2:- Higher levels of service: yard
taps and manually meteredpayment system
1. Households pay a set fee for theiryard connection
2. Council supplies meter and x lengthof pipe and ownership rests withCouncil (see Cross-subsidisationmodel)
3. Monthly payment for waterconsumed with tariffs set to takethe indigent Into account.
Higher Levels of Service & CosI Recovery Programmes, Policy Unit, Braamfontain 2OD2. Johannesburg
138

Technical Options
* Option 3: *- Higher levels of service: yard
taps and pre-paymentmetering payment system
1. Households pay a set fee for theiryard connection.
2. Households enter into a savingsscheme and contribute to the cost ofthe pre-payment meter system -pipes
3. Council pays of the bulk of the pre-payment system — meters
4. Monthly consumption is paid for up-front
Option 4:- Higher levels of service: yard
tanks (pre-payment)J, Households enter into a savings
scheme and contribute to the cost ofthe tank in their yard.
2, Households pay in advance for tanksto be fitted.
The type of tank system depends on themanagement and institutionalarrangements agreed upon.
M I J W Higher Levels of Service & Cost Recovery programmes, Policy Unit, Braarofontsln 2092, Johannesburg
Technical OptionsOption 5:- Higher levels of service:
Manifold System (WaterBailiff)
1. Households contribute to the cost ofreticulation from the manifold totheir yards.
2. Aflat rate system applies and is paidto the bailiff who manages themanifold.
Operations depend on the managementand institutional arrangementsagreed upon between households,committee and council.
& COMMENTSThe chosen option dependson:- Existing reticulation —
reticulation upgrade necessaryor greenfields project?
- Numbers of householdsdesiring Higher Levels ofService -- economies of scale.
- Management system in place.- Institutional co-operation
Higher Levels of Service & Cost Recovery Programmes, Policy Unit Braamfontein 2092, Johannesburg
139
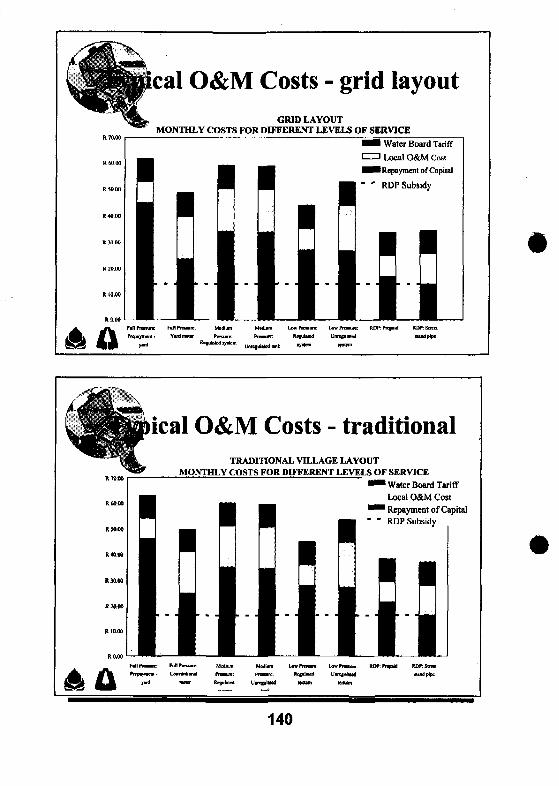
cal O&M Costs - grid layoutGRID LAYOUT
MONTHLY COSTS FOR DIFFERENT LEVELS OF SERVICE^ B Water Board Tariff
[ = 3 Local O&M Cost
^^H Repayment of Capital
" " RDP Subsidy
ical O&M Costs - traditionalTRADITIONAL VILLAGE LAYOUT
MONTHLY COSTS FOR DIFFERENT LEVELS OF SERVICE• " l i Water Board Tariff
Local O&M Cost" ^ " Repayment of Capital" " RDP Subsidy
140

12th floorBraamfontein Centre23 Jorissen StreetBraamfonteinJohannesburgSouth Africa
MVULAT R U S T
Supporting water and sanitatidSTcievelapment
i'O B.... 32351Braamfontein2017Tel: (Oil) 403-3425Fax:(011)403-1260