Embed Size (px)
Citation preview
An Introduction to Psychometric Testing
Key themes
� Psychometric testing
� Item writing
� Reliability
� Validity
� Exploratory factor analysis
� Confirmatory factor analysis
� Types and uses of psychometric tests
Learning outcomes
At the end of the chapter you should:
� Understand some of the ideas and criteria surroundingpsychometric testing
� Know what is meant by reliability in psychometric testing� Be able to explain what is meant by validity in psychometric
testing� How factor analysis is used in psychometric testing� The types and uses for different psychometric tests
Chapter 25
M25_MALT2908_02_SE_C25.QXD 8/12/09 8:18 PM Page 636
Types and uses of psychometric tests
In your career as a psychologist, you will come across a va-riety of psychometric tests. The main types of tests you willcome across in the personality, intelligence and individualdifferences literature are measures of personality, ability,motivation, educational and psychological work, clinicalassessment and attitude.
� Personality measures are designed to measure a set ofpsychological traits or characteristics, of the person that
remain relatively stable over time. An example of a per-sonality measure might be a measure of the five-factormodel of personality that would include questions andresponse choices that look for underlying tendencies ofthe person’s behaviour.
� Ability measures are designed to measure particularabilities. These test often include intelligence tests (thatmeasure an individual’s ability at a number of cognitiveprocesses such as perceptual speed, comprehension orreasoning) and Aptitude test (measurement of particularspecific skills suited for a particularly task. Therefore, abil-ity tests could include the measures of general intelligence,
CHAPTER 25 AN INTRODUCTION TO PSYCHOMETRIC TESTING 637
When you leave university, you may be attending a num-ber of job interviews. You may be aware that many em-ployers use psychometric tests as part of the interviewprocess for applicants. You may not be aware that in thespring of 2004, it was announced that personality testsdesigned to weed out racist applicants to the police wereintroduced in all 43 police forces in England and Wales.This was in response to a BBC documentary, The SecretPoliceman, which exposed racism in the Greater Manches-ter police force. You may also not be aware that, as theSunday Telegraph reported in October 2003, even JamesMurdoch, son of media tycoon Rupert Murdoch, wasreported to have to sit psychometric tests to find out if hewas fit to head his father’s company, satellite broadcasterBSkyB. In March 2003, the UK higher education ministerMargaret Hodge pointed to the diverse ways that univer-sities could develop different forms of assessment bywhich to improve decisions on student’s admission touniversity, and she encouraged universities simply to lookbeyond candidates’ exams. Margaret Hodge argued that,like employers, universities could use a whole range oftechniques including psychometric tests.
There is little doubt in our minds that measurement isa cornerstone of modern psychology. Even the govern-ment seems to be sanctioning measurement as animportant aspect of education and work. Psychologicaltests are of fundamental importance to research in manyareas of psychology. Probably the three areas in whichthat statement is most true are individual differences (in-cluding personality) and intelligence. However, psycho-logical tests are also of immense value in developingareas such as health psychology (with its growing em-phasis on quality of life), work psychology and educa-tional psychology, as well as in more traditional areassuch as social, cognitive and developmental psychology.
What we are going to do in this chapter, then, is intro-duce you to what makes a good psychometric test.There are some very simple but elegant ideas behind a
good test. Namely, a test should be both reliable (that is,those items within measures correlate and sometimesare consistent over time) and valid (that is, the testmeasures what it claims to measure).
You will have already been introduced to the terms‘reliability’ and ‘validity’ in research methods classes.Here, you will see how these ideas are central to psy-chometric testing.
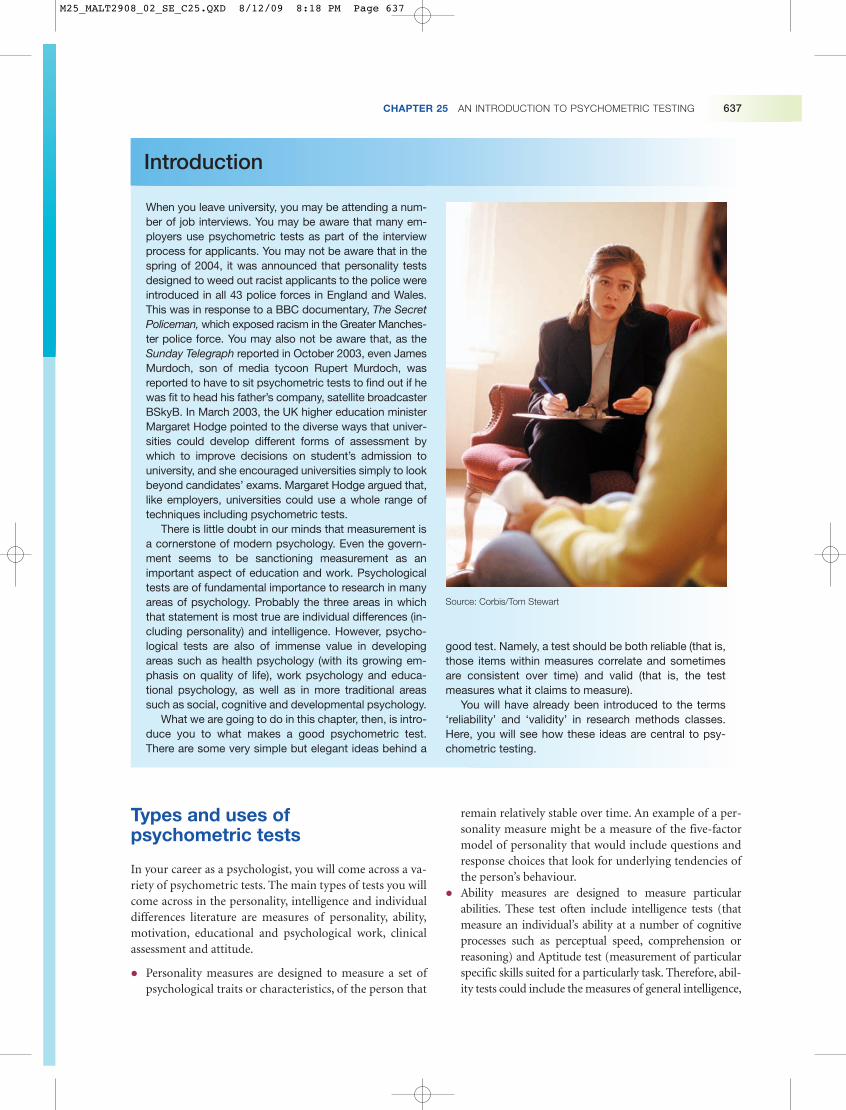
Source: Corbis/Tom Stewart
Introduction
M25_MALT2908_02_SE_C25.QXD 8/12/09 8:18 PM Page 637
638 PART 3 FURTHER DEBATES AND APPLICATIONS IN INDIVIDUAL DIFFERENCES
or creative thinking, or successful communication strate-gies in the workplace. Items from ability tests seek to testthese thought processes; here is an example:
‘Which of the following 5 makes the best compar-ison?’‘Son is to Father as nephew is to . . . .’
Respondents would then be given the following choices:(a) Niece, (b) Cousin, (c) Uncle, (d) Mother, (e) Sister.
� Motivation and attitude measures are usually concernedwith measuring particular beliefs towards something,such as work. So, for example, respondents would usu-ally be asked to respond to an item such as ‘I am satisfiedwith the work I do’.
� Neuropsychological tests are using measures of sensory,perceptual and motor performance used to assess differ-ent parts of psychophysiological activity and neurologi-cal functioning within the brain.
So, how are these different psychometric tests used? Forexample, in educational psychology, ability tests are used inthe study of educational success and may be used as a toolin school placement, in detecting possible learning disabil-ities, or in tracking intellectual development. Personalitytests are widely used in occupational psychology, particu-larly in job selection. What employers do is create their jobcriteria and then go some way in trying to match applicantsto these criteria via personality testing. For example, if anemployer wanted someone to sell a product, they wouldwant that person to be outgoing. Therefore, the employermight administer an extraversion test to all applicants tosee which of the candidates were more outgoing. Clearly,intelligence and attitude tests (particularly around motiva-tion to work) are also used in occupational settings. Psy-chometric tests are used in clinical psychology as a way ofdiagnosing clinical conditions and distinguishing betweenclinical groups. For example, a clinical psychologist mightcompare their current treatment group on a measureagainst a general population sample, as this might providea useful insight into how they should treat the clinicalgroup. Equally they may use neuropsychological tests to as-sess consequences of medical illnesses or conditions. Oneexample of such use might be among patients who have ex-perienced brain damage; certain psychometric tests, partic-ularly ability tests, might also be used to evaluate the extentof the damage and to later evaluate any improvement in apatient’s condition.
Throughout the rest of the chapter we are going to in-troduce you to many of the aspects of psychometric testingby way of developing our own psychometric test.
Developing a psychometric test
For this exercise we’re going to detail the development of anew measure of a concept, academic vindictiveness amongstudents. As you might realise there are many approachesthat students might take in their study. We’ve seen fromChapter 16 (The Application of Personality and Intelli-gence in Education and the Workplace), which details per-sonality, intelligence and education, that conscientiousnessis a good predictor of education performance. However, forthe purpose of this chapter, we’re wondering whether theremight be another individual difference variable in the waystudents approach their academic work, namely academicvindictiveness.1 This work was carried out in response to afinding that some students may make deliberate acts tosabotage others work, and/or feel angry towards someoneor act vengefully when they feel somebody in their aca-demic circle has wronged, misguided or surpassed themin some way (Crocker, Sommers and Luhtanen, 2002;Crocker and Luhtanen, 2003). Therefore, in the next fewsections we will be using this construct of academic vin-dictiveness, and the development of a scale to measureacademic vindictiveness to introduce you to a number ofpsychometric techniques.
Developing items for a psychometric test
Paul Kline (Kline, 1986), a United Kingdom psychometri-cian, points out that the secret to developing a very goodscale is writing very good questions. For Kline, if you donot write good items then you will never develop a goodpsychometric scale. Therefore, for Kline, developing theitems is a crucial part of the process. There are a number ofconsiderations you need to make when writing items for ascale, and in the next section we will introduce you to theseconsiderations while developing items for our own scale ofacademic vindictiveness.
The first thing to consider is to make the distinctionbetween two different types of questions: open format orclosed format questions. Open format are questions thatasked for some written detail but have no determined set ofresponses, e.g. ‘Tell us about the occasions when you havebeen academically vindictive’. Therefore, any answer can begiven to these questions. These types of questions lead tomore qualitative data because there are a large number ofpossible responses. These are the problems with open-format
1This is a construct that was developed by a colleague R. J. Lally and we are very grateful to her for allowing us to use some of her initial work on thisconstruct in this chapter.
M25_MALT2908_02_SE_C25.QXD 8/12/09 8:18 PM Page 638
CHAPTER 25 AN INTRODUCTION TO PSYCHOMETRIC TESTING 639
questions in a psychometric test. Given that they producea large number of possible answers, with each potentiallydifferent, open format questions are also time-consumingfor the researcher who has to analyse all the differentanswers.
As a consequence, in psychometric tests, researchers willtend to use closed-format questions. A closed format ques-tion is a question where there is a short question or state-ment followed by a number of options. See, for example,Exhibit 25.1.
Exhibit 25.1
Indicate the extent you disagree or agree with the following statement, as it applies to you.
1 I feel bitter towards those who do better Disagree Disagree Not Agree Agree than me on my course. strongly certain strongly
The main aim of closed format questions is to very sim-ply break down respondents answers into data that can bequantified into answers that give you the information youwant to know (i.e. to what extent do people agree or dis-agree with the statement as it applies to them).
However, the first stage of the process is to create theitems. Kline suggests that the first place to start is to writeas many items as possible. Now, this could be a matter ofsimple writing the items yourself, but this can be very labo-rious and you may also make mistakes or miss out impor-tant aspects. Therefore, in terms of initial item writing, youcould also use the following sources in writing items:
� Theoretical literature – Usually scales are not developedfrom an entirely new construct. There will always besome theoretical perspective which underpins the devel-opment of a new scale and the terms, phrases, and ideasthat appear in the theoretical literature should be used asthe basis for writing items.
� Experts – You could recruit experts in the area to sug-gest particular items for your scale. This will enhancethe quality.
� Colleagues – Colleague(s) or a co-researcher(s) canhelp you write items because, at the very least, this willgenerate more items than you could singly produce.
After you have written the initial set of items you need tostudy them and rewrite them. Again, use experts or col-leagues to examine the phrasing of each question and see ifthey can improve on them. It is also probably the case thatyou will have a large number of items.
It may then be a good idea to try to reduce the numberof items you have written if you feel there are a huge num-ber. It’s difficult to determine what a huge number is, but indeciding on the final number you might like to keep a fewpoints in mind:
� Kline suggests optimal length for any scale measuringone construct should be about 15 to 20 items. You mayneed many more items than this when initially con-structing the scale to ensure you end up with a scale ofan appropriate length.
� When you administer the scale in the first instance thegeneral rule is that you should have a certain number ofparticipants for each item of the administration; guide-lines change, but at least 5 participants to 1 item is accept-able, but ideally most researchers aim for 10 participantsto 1 item as a premium, with a minimum of 100 respon-dents. This is for statistical reasons because you need agood number of responses to ensure you are sure you havecaptured variation of responses across respondents. Youmight keep this in mind if you know how many partici-pants you are likely to get to fill in your scale on a first oc-casion. For example, if you had 40 items, you would need400 participants to answer the questionnaire. Therefore, ifyou were only likely to get 300 participants, you mightwish to reduce your items, or lower the criteria to 5 to 1.
� Who is the scale likely to be used with? It may be that ifthe scale is designed for clinical settings, or with chil-dren, or where available administration time is short,you might actually look to reduce the number of items,even before you’ve developed the final scale.
It is difficult to say what the optimal number of items is. Inmost cases you need to make a judgement. One way to deter-mine this is to get a group of participants, ideally experts, torate the items in terms of potential effectiveness of measur-ing the construct. You could determine which items areconsidered the strongest and should be retained (i.e. thoseitems rated highest by the participants) and which items areconsidered the weakest and could be excluded. This tech-nique could be used to exclude items from the first adminis-tration of the scale if you felt you had too many items.
Writing items for a psychometric test
To illustrate the process and some of the techniques usedin writing items we are going to talk about the develop-ment of a set of 23 items to measure vindictiveness. In de-veloping these sets of items we followed many of theprocedures outlined above. A few lecturers and students
M25_MALT2908_02_SE_C25.QXD 8/12/09 8:18 PM Page 639
wrote a list of 70 items. We then asked a group of five stu-dents to look at the items and suggest possible changes tothe wording of the items. We then repeated the exercisewith three lecturers.
For the purpose of the exercise we felt that 70 items weretoo many, so we decided to trim these down. We asked 5 students and 5 lecturers to rate the items in terms of their
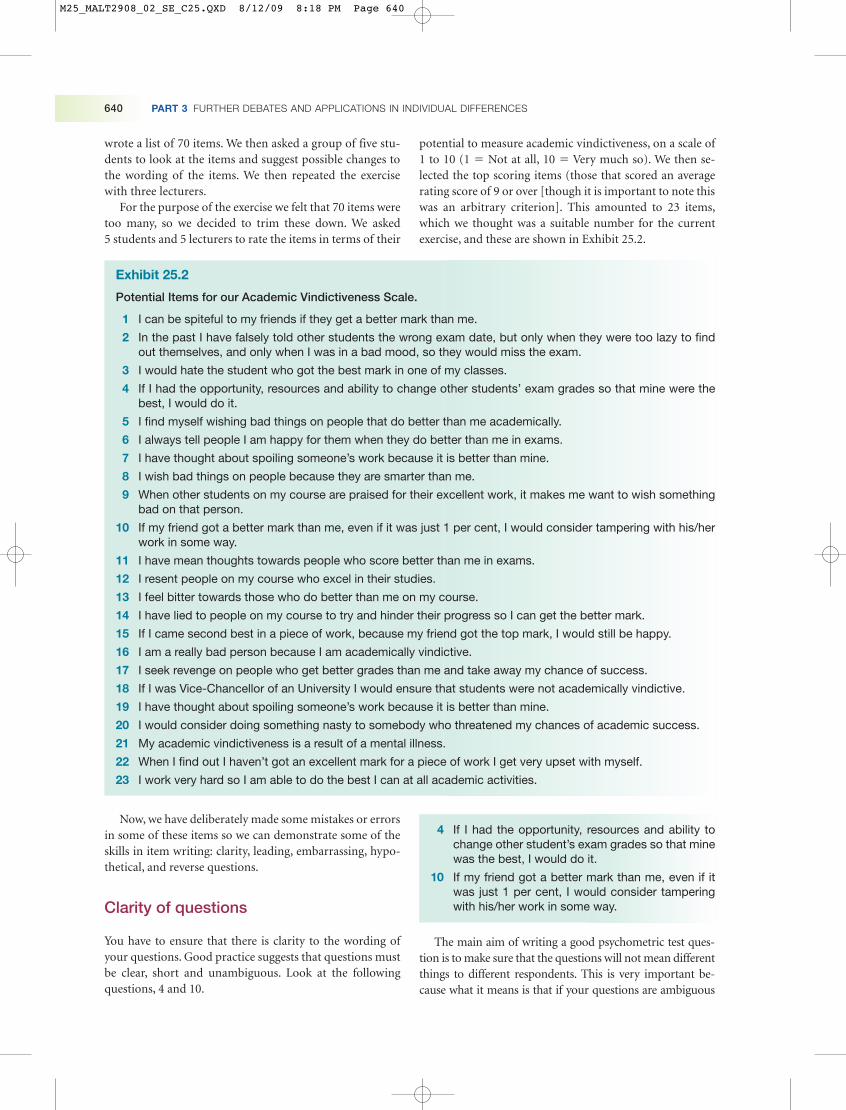
potential to measure academic vindictiveness, on a scale of1 to 10 (1 � Not at all, 10 � Very much so). We then se-lected the top scoring items (those that scored an averagerating score of 9 or over [though it is important to note thiswas an arbitrary criterion]. This amounted to 23 items,which we thought was a suitable number for the currentexercise, and these are shown in Exhibit 25.2.
640 PART 3 FURTHER DEBATES AND APPLICATIONS IN INDIVIDUAL DIFFERENCES
Exhibit 25.2
Potential Items for our Academic Vindictiveness Scale.
1 I can be spiteful to my friends if they get a better mark than me.
2 In the past I have falsely told other students the wrong exam date, but only when they were too lazy to findout themselves, and only when I was in a bad mood, so they would miss the exam.
3 I would hate the student who got the best mark in one of my classes.
4 If I had the opportunity, resources and ability to change other students’ exam grades so that mine were thebest, I would do it.
5 I find myself wishing bad things on people that do better than me academically.
6 I always tell people I am happy for them when they do better than me in exams.
7 I have thought about spoiling someone’s work because it is better than mine.
8 I wish bad things on people because they are smarter than me.
9 When other students on my course are praised for their excellent work, it makes me want to wish somethingbad on that person.
10 If my friend got a better mark than me, even if it was just 1 per cent, I would consider tampering with his/herwork in some way.
11 I have mean thoughts towards people who score better than me in exams.
12 I resent people on my course who excel in their studies.
13 I feel bitter towards those who do better than me on my course.
14 I have lied to people on my course to try and hinder their progress so I can get the better mark.
15 If I came second best in a piece of work, because my friend got the top mark, I would still be happy.
16 I am a really bad person because I am academically vindictive.
17 I seek revenge on people who get better grades than me and take away my chance of success.
18 If I was Vice-Chancellor of an University I would ensure that students were not academically vindictive.
19 I have thought about spoiling someone’s work because it is better than mine.
20 I would consider doing something nasty to somebody who threatened my chances of academic success.
21 My academic vindictiveness is a result of a mental illness.
22 When I find out I haven’t got an excellent mark for a piece of work I get very upset with myself.
23 I work very hard so I am able to do the best I can at all academic activities.
Now, we have deliberately made some mistakes or errorsin some of these items so we can demonstrate some of theskills in item writing: clarity, leading, embarrassing, hypo-thetical, and reverse questions.
Clarity of questions
You have to ensure that there is clarity to the wording ofyour questions. Good practice suggests that questions mustbe clear, short and unambiguous. Look at the followingquestions, 4 and 10.
The main aim of writing a good psychometric test ques-tion is to make sure that the questions will not mean differentthings to different respondents. This is very important be-cause what it means is that if your questions are ambiguous
4 If I had the opportunity, resources and ability tochange other student’s exam grades so that minewas the best, I would do it.
10 If my friend got a better mark than me, even if itwas just 1 per cent, I would consider tamperingwith his/her work in some way.
M25_MALT2908_02_SE_C25.QXD 8/12/09 8:18 PM Page 640
CHAPTER 25 AN INTRODUCTION TO PSYCHOMETRIC TESTING 641
(the meaning can be interpreted differently) then your par-ticipants will, in fact, be answering different questions. Thiswill muddy your results because you will never be sure whatinterpretation respondents have been answering. One of themain culprits of this is qualifying statements or trying toohard to capture all aspects of the situation. Question 4 is anexample of an item trying to capture all the prerequisites thatmight have to be in place that possibly underlie academicvindictiveness (opportunity, resources and ability). Thismeans that respondents might concentrate on aspects of thequestion that focus on the opportunity, resources and abilitybefore they were academically vindictive, rather than whetherthey have the tendency to be academically vindictive, there-fore making the question ambiguous. Question 10 seeks toqualify the possible extremity of academic vindictiveness byhighlighting issues about academic vindictiveness, even if thegap in scores was less than 1 per cent. Each of these questionscan be simplified as shown in Exhibit 25.3.
These questions are shorter and the meaning is much moreclear. They may not seek to be as exact as the previousversions, through the use of qualifying statements, but theyare unlikely to be ambiguous to respondents.
Leading questions
Leading questions are questions that try to steer the re-spondent to a particular answer, or in the direction of aparticular answer.
However, leading questions can arise quite undeliberatelyand can occur to the exact phrasing of the question. A bril-liant example of the use of leading questions was demon-strated in one episode of the 1986 Yes, Prime Minister BBCseries: Yes, Prime Minister is a fictional BBC comedy series setin the Prime Minister’s office in 10 Downing Street and fol-lows the Prime Ministerial career of Jim Hacker and strugglesto formulate and enact legislation or effect departmentalchanges opposed by the will of the British Civil Service. SirHumphrey Appleby, and his Principal Private SecretaryBernard Woolley. The interchange between Sir Humphreyand Bernard Woolley demonstrates how surveys can reachopposite conclusions about the introduction of national serv-ice (compulsory military service) for young people throughthe use of leading questions (see Exhibit 25.4).
Exhibit 25.3
4 If I had the opportunity to change other student’sexam grades so that mine was the best, I woulddo it.
10 If my friend got a better mark than me, I wouldconsider tampering with his/her work in some way.
Exhibit 25.4
Survey one
Sir Humphrey Appleby: Mr Woolley, are you worried about the rise in crime among teenagers?
Bernard Woolley: Yes.
Sir Humphrey Appleby: Do you think there is lack of discipline and vigorous training in our ComprehensiveSchools?
Bernard Woolley: Yes.
Sir Humphrey Appleby: Do you think young people welcome some structure and leadership in their lives?
Bernard Woolley: Yes.
Sir Humphrey Appleby: Do they respond to a challenge?
Bernard Woolley: Yes.
Sir Humphrey Appleby: Might you be in favour of reintroducing National Service?
Bernard Woolley: Er, I might be.
Sir Humphrey Appleby: Yes or no?
Bernard Woolley: Yes.
Sir Humphrey Appleby: Of course, after all you’ve said you can’t say no to that. On the other hand, the surveyscan reach opposite conclusions.
Survey two
Sir Humphrey Appleby: Mr Woolley, are you worried about the danger of war?
Bernard Woolley: Yes.
Sir Humphrey Appleby: Are you unhappy about the growth of armaments?
M25_MALT2908_02_SE_C25.QXD 8/12/09 8:18 PM Page 641
As you can see Sir Humphrey has been able to get BernardWoolley to reach two opposing conclusions by usingleading questions that Bernard Woolley will tend to agreewith.
Our question 16 is a leading question ‘I am a really badperson because I am academically vindictive’. It is askingrespondents to make a value judgement that they wouldfind it difficult to disagree with, and therefore they wouldbe led to answer because they feel they would be sayingsomething about themselves and place themselves in a badlight. We would suggest removing this question.
Perhaps our question 2 is a less obvious example of aleading question, see Exhibit 25.5.
Question 2, seeks to qualify the item asking about aca-demic vindictiveness by closely defining the situationaround the other student being lazy and whether the per-son was in a bad mood. This is clearly a situation in whichacademic vindictiveness may occur, but also seems to leadthe respondent in a particular direction by potentially ex-cusing the behaviour and almost suggesting that it couldbe acceptable under circumstances. Regardless of whetherit encourages people to ‘own up’ it is leading the respon-dent by suggesting they could be justified to make thestatement. We would suggest, in terms of directly assessingacademic vindictiveness, a better item might be as shownin Exhibit 25.6.
642 PART 3 FURTHER DEBATES AND APPLICATIONS IN INDIVIDUAL DIFFERENCES
Embarrassing questions
Generally, questions dealing with personal matters should beavoided. This is because this may make your respondent feelembarrassed or uncomfortable, and doing research thatcauses this type of feeling in participants is not good prac-tice, indeed it is frowned upon. Equally, it is not good for theresearcher because it may lead the participant to give incor-rect or misleading information, or fail to complete the rest ofthe questionnaire. So, great care should be taken when ask-ing personal or potentially embarrassing questions and youshould spend a lot of time thinking about how best to askthese questions. Our question 21 (‘My academic vindictive-ness is a result of a mental illness’) is a potentially embarrass-ing question and we should remove this item from our list.
Bernard Woolley: Yes.
Sir Humphrey Appleby: Do you think there’s a danger in giving young people guns and teaching them how to kill?
Bernard Woolley: Yes.
Sir Humphrey Appleby: Do you think it’s wrong to force people to take arms against their will?
Bernard Woolley: Yes.
Sir Humphrey Appleby: Would you oppose the reintroduction of conscription?
Bernard Woolley: Yes.
Exhibit 25.5
2 In the past I have falsely told other students thewrong exam date, but only when they were too lazyto find out themselves, and only when I was in abad mood, so they would miss the exam.
Exhibit 25.6
2 In the past I have falsely told other studentsthe wrong exam date, so they would miss theexam.
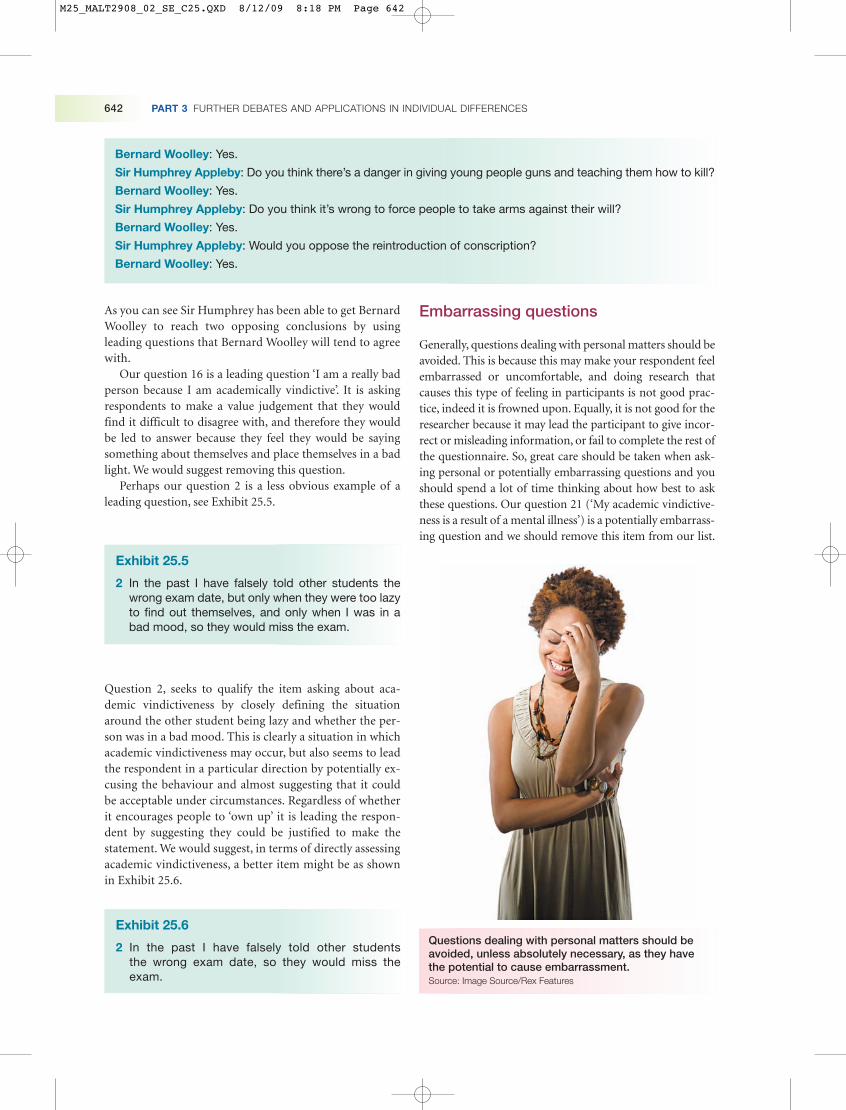
Questions dealing with personal matters should beavoided, unless absolutely necessary, as they havethe potential to cause embarrassment.Source: Image Source/Rex Features
M25_MALT2908_02_SE_C25.QXD 8/12/09 8:18 PM Page 642
CHAPTER 25 AN INTRODUCTION TO PSYCHOMETRIC TESTING 643
Stop and think
Cultural considerations
There is other good practice in writing good questions.Try to consider language or culture and make sure thatall questions can be understood by all people. Remem-ber, people sometimes have a poor reading age so try tomake the questions as simple as possible. Also some
questions may seem patronising to you, but people whohave a high reading age will still be able to understandthe question. Try to avoid jargon or technical language,particularly abbreviations.
Hypothetical questions
Hypothetical questions are questions that place the individualin a situation that they may never experience and ask themfor their opinion on something. So, for example, you mightask ‘If you were Prime Minister of the country, what wouldyou do about psychology lecturers’. These types of questionsmight produce colourful answers, but are considered badresearch practice because answers will be in response to asituation the person may never have considered rather thantheir real view or feelings about something. Our question 18(‘If I was Vice-Chancellor of a University I would ensure thatstudents were not academically vindictive’) is a hypotheticalquestion and therefore we should remove it from our list.
Questions with reverse wording
Researchers will often write items with some questions withreverse wording. This is usually done to force the person tak-ing the psychometric test to read it carefully and not just torespond to all the items in the same way. Also, it is good wayto check for people who haven’t taken answering the ques-tionnaire seriously, as it will show up with contradictory an-swers. Ideally, you should try to maximise the number ofreverse worded items in your scale, but we have just in-cluded reverse wording for two items, item 6 and item 15.
Therefore, taking all these changes into account, we havea final revised scale comprising 20 items as shown inExhibit 25.7.
Exhibit 25.7
1 I can be spiteful to my friends if they get a better mark than me.
2 I find myself wishing bad things on people that do better than me academically.
3 I would hate the student who got the best mark in one of my classes.
4 I feel bitter towards those who do better than me on my course.
5 In the past I have falsely told other students the wrong exam date, so they would miss the exam.
6 I always tell people I am happy for them when they do better than me in exams.
7 I have thought about spoiling someone’s work because it is better than mine.
8 I seek revenge on people who got better grades than me and take away my chances of success.
9 When other students on my course are praised for their excellent work, it makes me want to wish somethingbad on that person.
10 If my friend got a better mark than me, I would consider tampering with his/her work in some way.
11 I have mean thoughts towards people who score better than me in exams.
12 I resent people on my course who excel in their studies.
13 If I had the opportunity to change other students’ exam grades so that mine were the best, I would do it.
14 I have lied to people on my course to try and hinder their progress so I can get the better mark.
15 If I came second best in a piece of work, because my friend got the top mark, I would still be happy.
16 I wish bad things on people because they are smarter than me.
17 I do not like to help others with their work as it might result in them getting a better mark.
18 I would consider doing something nasty to somebody who threatened my chances of academic success.
19 When I find out I haven’t got an excellent mark for a piece of work I get very upset with myself.
20 I work very hard so I am able to do the best I can at all academic activities.
M25_MALT2908_02_SE_C25.QXD 8/12/09 8:18 PM Page 643
Response formats
Another important area to consider is the response formatof your scale. All closed format questions give a series ofchoices, and there is even good practice in terms of re-sponse choices to use. Of course, the response formatsgenerally vary.
644 PART 3 FURTHER DEBATES AND APPLICATIONS IN INDIVIDUAL DIFFERENCES
There are a number of different formats that can beused. One of the response formats used with a lot of tradi-tional personality tests is a ‘yes–no’ format or a ‘true–false’format. For example, the Eyenck Personality Questionnaire(Eysenck and Eyseck, 1975) uses this sort of format (seeExhibit 25.8).
Other scales measure the frequency of behaviour (i.e. howoften it occurs). For example, the COPE scale (Carver,Scheier and Weintraub, 1989), that measures individual’s
various coping attempts to deal with stress, uses the responseformat shown in Exhibit 25.9 to measure the frequency towhich people engage in various coping behaviours.
A common feature of many scales is the ‘Strongly Agree’to ‘Strongly Disagree’ format. Traditionally, these wereused with attitude scales, used to measure the extent ofagreement with different attitudinal statements. However,you will see the ‘agree–disagree’ response format used inmany different scales. For example, the Life Orientation
Test-Revised (Scheier, Carver and Bridges, 1994), which isused to measure optimism, uses a five-point ‘StronglyAgree’ to ‘Strongly Disagree’ scale to measure respondent’sdegree of agreement with statements in terms of how thestatements describe them, as shown in Exhibit 25.10.
Though sometimes some scales will ask respondents to indi-cate directly how much the statement describes them. Forexample, in the assessment of dispositional embarrassment
(Kelly and Jones, 1997) respondents are asked to indicate towhat extent the behaviour described in the statement is likethem (see Exhibit 25.11).
Exhibit 25.8
1 Does your mood often go up and down? Yes No
2 Do you often feel ‘fed-up’? Yes No
3 Do you suffer from nerves? Yes No
Exhibit 25.9
t02]]I try to grow as a person as a result of I usually I usually I usually do I usuallythe experience. don’t do do this a this a medium do this
this at all little bit amount a lot
I turn to work or other substitute activities I usually I usually I usually do I usuallyto take my mind off things. don’t do do this a this a medium do this
this at all little bit amount a lot
I get upset and let my emotions out. I usually I usually I usually do I usuallydon’t do do this a this a medium do this this at all little bit amount a lot
Exhibit 25.10
3]]In uncertain times, I usually expect Strongly Disagree Not certain Agree Stronglythe best. Disagree Agree
Overall, I expect more good things to Strongly Disagree Not certain Agree Strongly happen to me than bad. Disagree Agree
M25_MALT2908_02_SE_C25.QXD 8/12/09 8:18 PM Page 644
CHAPTER 25 AN INTRODUCTION TO PSYCHOMETRIC TESTING 645
Finally, you will also see response formats that try to assessthe extent of certain feelings or behaviours, and therefore,the responses will assess the extent that the respondent feelsabout something. So, for example, the PANAS scale (Watson,
There are fewer and fewer hard and fast rules about re-sponse formats these days. However, the main point is thatyour response format must make sense in terms of thequestions you are asking. Therefore discuss with col-leagues and test carefully the response format that you in-tend to use. Also, a general guideline is to use simple ratingscales or lists of choice, and where possible, minimise thenumber of choices. Five choices are thought to be the idealnumber.
Instructions
Finally, the instructions that precede the scale are crucial.Usually there may be no need for a great number ofinstructions, and they be rather simple. For example, theinstructions for Eysenck and Eysencks’ EPQ scale are asshown in Exhibit 25.13.
However, you might look for more general traits reflectingmore typical behaviours or attitudes. For example, for Kellyand Jones’ measure of dispositional embarrassment, theinstructions are as shown in Exhibit 25.14.
However, you may want to specify a particular time period.For example, in completing Watson et al.’s Positive andNegative Affect Scales, respondents are given the followinginstructions as shown in Exhibit 25.15.
Finally, you might want the respondents to think verycarefully about their responses. For example, you mightwant them to think about a specific instance, or a typicalset of responses in a particular circumstance. For exam-ple, Carver et al.’s COPE scale, which measures reactionsto stress, is preceded by the instructions shown inExhibit 25.16.
Clark and Tellegen, 1988) which measures positive andnegative affect, uses a scale that indicates the extent the par-ticipant feels about a particular emotion or feeling (seeExhibit 25.12).
Exhibit 25.11
Not at all Very much like me like me
1 I feel unsure of myself. 1 2 3 4 5 6 7
2 I don’t feel uncomfortable in public 1 2 3 4 5 6 7unless my clothing, hair, etc. are just right.
Exhibit 25.12
Interested Very slightly A little Moderately Quite a bit Extremely
Irritable Very slightly A little Moderately Quite a bit Extremely
Distressed Very slightly A little Moderately Quite a bit Extremely
Exhibit 25.13
INSTRUCTIONS: Please answer each question byputting a circle around the ‘YES’ or ‘NO’ following thequestion. There are no right or wrong answers, andno trick questions. Work quickly, and do not think toolong about the exact meaning of the questions.
Exhibit 25.14
We are interested in people’s personality attributes.Listed below are a variety of statements. Please readeach statement carefully and indicate to the left ofeach item the extent to which you feel it applies toyou using the following scale.
Exhibit 25.15
This scale consists of a number of words thatdescribe different feelings and emotions. Read eachitem and then mark the appropriate answer in thespace next to that word. Indicate to what extent youfeel this way right now, that is, at the present moment.Use the following scale to record your answers.
M25_MALT2908_02_SE_C25.QXD 8/12/09 8:18 PM Page 645
646 PART 3 FURTHER DEBATES AND APPLICATIONS IN INDIVIDUAL DIFFERENCES
The main thing is that the researcher thinks carefully aboutthe instructions, because this can be used not only to helpto make easier the administration of the question but alsoto direct the respondent to look at the questions in a partic-ular way, if so required.
Collecting the data
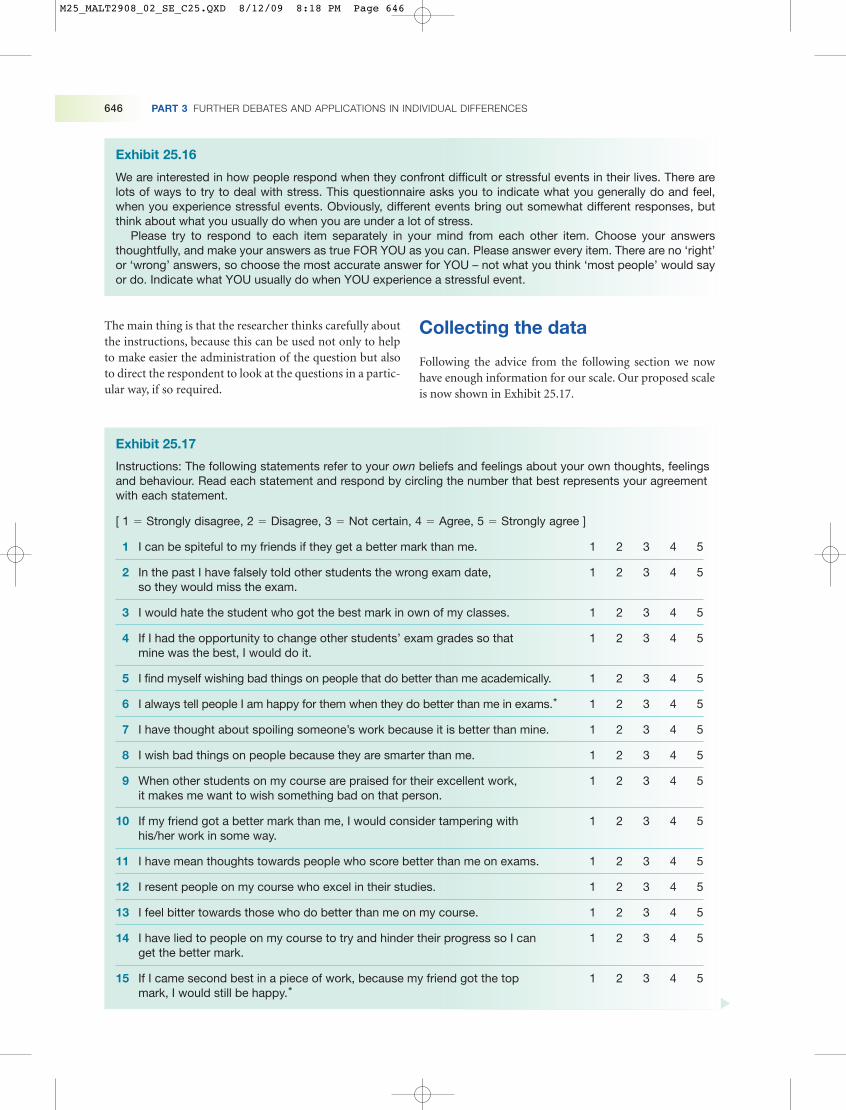
Following the advice from the following section we nowhave enough information for our scale. Our proposed scaleis now shown in Exhibit 25.17.
Exhibit 25.16
We are interested in how people respond when they confront difficult or stressful events in their lives. There arelots of ways to try to deal with stress. This questionnaire asks you to indicate what you generally do and feel,when you experience stressful events. Obviously, different events bring out somewhat different responses, butthink about what you usually do when you are under a lot of stress.
Please try to respond to each item separately in your mind from each other item. Choose your answersthoughtfully, and make your answers as true FOR YOU as you can. Please answer every item. There are no ‘right’or ‘wrong’ answers, so choose the most accurate answer for YOU – not what you think ‘most people’ would sayor do. Indicate what YOU usually do when YOU experience a stressful event.
Exhibit 25.17
Instructions: The following statements refer to your own beliefs and feelings about your own thoughts, feelingsand behaviour. Read each statement and respond by circling the number that best represents your agreementwith each statement.
[ 1 � Strongly disagree, 2 � Disagree, 3 � Not certain, 4 � Agree, 5 � Strongly agree ]
1 I can be spiteful to my friends if they get a better mark than me. 1 2 3 4 5
2 In the past I have falsely told other students the wrong exam date, so they would miss the exam.
1 2 3 4 5
3 I would hate the student who got the best mark in own of my classes. 1 2 3 4 5
4 If I had the opportunity to change other students’ exam grades so that mine was the best, I would do it.
1 2 3 4 5
5 I find myself wishing bad things on people that do better than me academically. 1 2 3 4 5
6 I always tell people I am happy for them when they do better than me in exams.* 1 2 3 4 5
7 I have thought about spoiling someone’s work because it is better than mine. 1 2 3 4 5
8 I wish bad things on people because they are smarter than me. 1 2 3 4 5
9 When other students on my course are praised for their excellent work, it makes me want to wish something bad on that person.
1 2 3 4 5
10 If my friend got a better mark than me, I would consider tampering with his/her work in some way.
1 2 3 4 5
11 I have mean thoughts towards people who score better than me on exams. 1 2 3 4 5
12 I resent people on my course who excel in their studies. 1 2 3 4 5
13 I feel bitter towards those who do better than me on my course. 1 2 3 4 5
14 I have lied to people on my course to try and hinder their progress so I can get the better mark.
1 2 3 4 5
15 If I came second best in a piece of work, because my friend got the top mark, I would still be happy.*
1 2 3 4 5
M25_MALT2908_02_SE_C25.QXD 8/12/09 8:18 PM Page 646
CHAPTER 25 AN INTRODUCTION TO PSYCHOMETRIC TESTING 647
The next step is to collect data to test these new items andassess whether you’ve got a good measure.Therefore,we needto administer the scale to some participants. Guidelines sug-gest that you should try to get a minimum of 5 respondentsto every item, ideally the number of respondents should be10 participants for every 1 item. Of course, as a student youmay not have access to that number of participants, but youshould try to get at least 2 or 3 respondents for each item.
We administered our scale to 402 students, 161 males and241 females, aged from 18 to 21 years, meaning we had a ratioof 20 to 1 in terms of participants to items. Having collectedthe data we can now use this data to examine the scale.
We have included a copy of this data as part of the on-line resources with this book. Go to pearsoneducation.co.uk/maltby if you want to download the data.
Reliability
In psychometric testing, there are two forms of reliability:internal reliability and reliability over time (test–retestreliability). You may wish to read an extended version ofsome of the theory that lies behind reliability statistics inthe ‘Stop and think: Reliability: the role of error’ box.
Stop and think
Reliability: the role of error
Reliability in psychometric testing is a response to errorin measurement. Error refers to a specific issue in re-search and that is, when you’re measuring anything inresearch, it is almost certain that your measurement willcontain error. Say, for example, I ask you the question,are you happy? I give you the option of ‘Yes’ or ‘No’.Now what I’m hoping to do is measure your happiness.However, there are possible sources of error in thismeasurement. For example, you may say ‘Yes’, there-fore you are happy. But you may not be totally happy,you may just be more happy than you are unhappy, butmy measure just determines that you are happy. There-fore there is possible error in my measurement becauseI’ve not exactly assessed the correct level of happiness,so my assessment of your happiness is not wrong(you’ve said you’re happy), but it has a degree of errorto it. There are other potential sources of error in meas-urement. Perhaps if I asked you two questions; are youhappy in ‘Work’ and ‘Life in general’ to determine yourhappiness. If you answered ‘Yes’ to both then youare happy. But it is perfectly possible that you are nothappy in other specific areas of your life, such as a rela-tionship. Therefore again there is potential for error here
because our measure of happiness missed out a ques-tion on relationships which would have changed ourassessment of your overall happiness. Also if I askedyou whether you were happy on a Monday, would yougive the same answer on the following Friday?
There are many sources of possible error in measure-ment. It is important to note that these errors are mostlyunknown quantities and often not measurable. For ex-ample, it is impossible to know what real happiness is.Therefore asking people are they happy and determin-ing on that whether they are happy or not has a hugepossible amount of error, because the extent and depthof happiness is probably unknown and probably wouldmake your head hurt just thinking about how to measureit. However, rather than simply giving up, researcherspersevere. As a researcher it is almost impossible toeradicate all possible sources of error from research,but what researchers do is try to guard against possibleerror so they can establish confidence in their work.Reliability statistics are used in psychometric testing toassess the extent to which a psychometric test is freefrom error and provide confidence and evidence for itsusefulness.
16 I seek revenge on people who get better grades than me and take away my chances of success.
1 2 3 4 5
17 I do not like to help others with their work as it might result in them getting a better mark.
1 2 3 4 5
18 I would consider doing something nasty to somebody who threatened my chances of academic success.
1 2 3 4 5
19 When I find out I haven’t got an excellent mark for a piece of work I get very upset with myself.
1 2 3 4 5
20 I work very hard so I am able to do the best I can at all academic activities. 1 2 3 4 5
M25_MALT2908_02_SE_C25.QXD 8/12/09 8:18 PM Page 647
648 PART 3 FURTHER DEBATES AND APPLICATIONS IN INDIVIDUAL DIFFERENCES
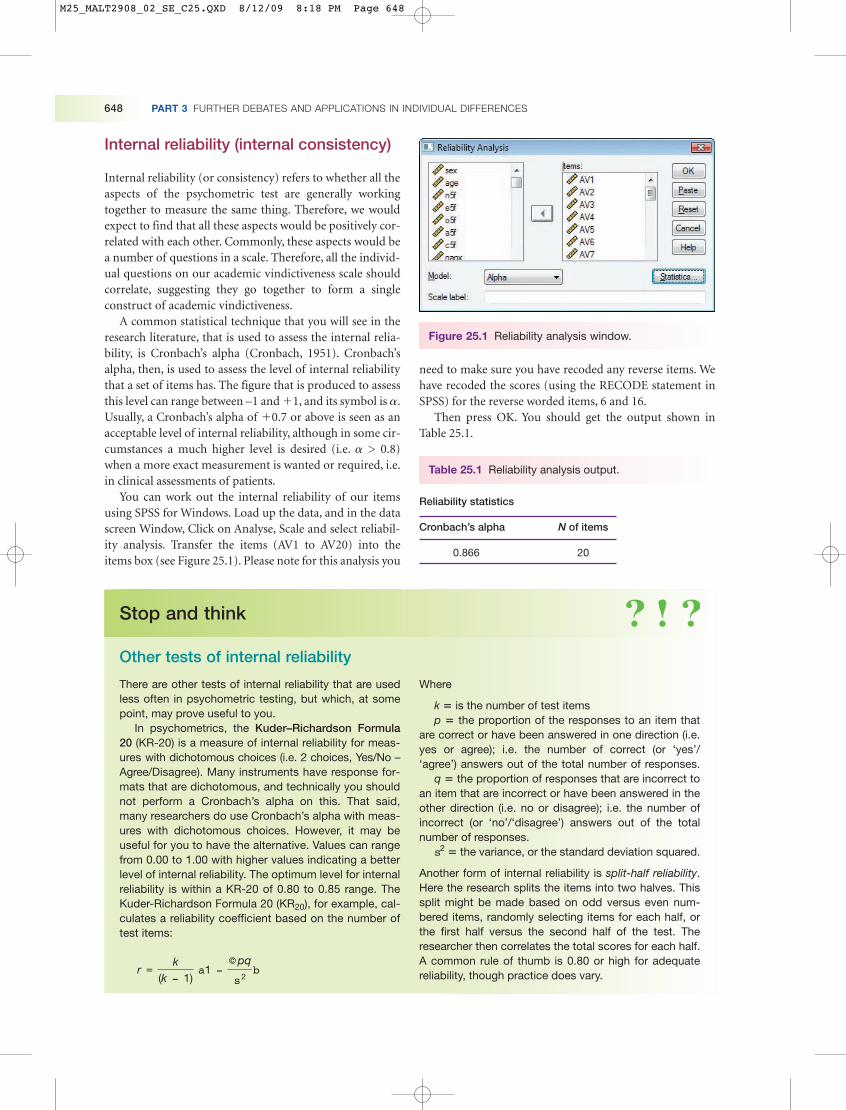
Internal reliability (internal consistency)
Internal reliability (or consistency) refers to whether all theaspects of the psychometric test are generally workingtogether to measure the same thing. Therefore, we wouldexpect to find that all these aspects would be positively cor-related with each other. Commonly, these aspects would bea number of questions in a scale. Therefore, all the individ-ual questions on our academic vindictiveness scale shouldcorrelate, suggesting they go together to form a singleconstruct of academic vindictiveness.
A common statistical technique that you will see in theresearch literature, that is used to assess the internal relia-bility, is Cronbach’s alpha (Cronbach, 1951). Cronbach’salpha, then, is used to assess the level of internal reliabilitythat a set of items has. The figure that is produced to assessthis level can range between –1 and �1, and its symbol is �.Usually, a Cronbach’s alpha of �0.7 or above is seen as anacceptable level of internal reliability, although in some cir-cumstances a much higher level is desired (i.e. � > 0.8)when a more exact measurement is wanted or required, i.e.in clinical assessments of patients.
You can work out the internal reliability of our itemsusing SPSS for Windows. Load up the data, and in the datascreen Window, Click on Analyse, Scale and select reliabil-ity analysis. Transfer the items (AV1 to AV20) into theitems box (see Figure 25.1). Please note for this analysis you
need to make sure you have recoded any reverse items. Wehave recoded the scores (using the RECODE statement inSPSS) for the reverse worded items, 6 and 16.
Then press OK. You should get the output shown inTable 25.1.
Stop and think
Other tests of internal reliability
There are other tests of internal reliability that are usedless often in psychometric testing, but which, at somepoint, may prove useful to you.
In psychometrics, the Kuder–Richardson Formula20 (KR-20) is a measure of internal reliability for meas-ures with dichotomous choices (i.e. 2 choices, Yes/No –Agree/Disagree). Many instruments have response for-mats that are dichotomous, and technically you shouldnot perform a Cronbach’s alpha on this. That said,many researchers do use Cronbach’s alpha with meas-ures with dichotomous choices. However, it may beuseful for you to have the alternative. Values can rangefrom 0.00 to 1.00 with higher values indicating a betterlevel of internal reliability. The optimum level for internalreliability is within a KR-20 of 0.80 to 0.85 range. TheKuder-Richardson Formula 20 (KR20), for example, cal-culates a reliability coefficient based on the number oftest items:
Where
k � is the number of test itemsp � the proportion of the responses to an item that
are correct or have been answered in one direction (i.e.yes or agree); i.e. the number of correct (or ‘yes’/‘agree’) answers out of the total number of responses.
q � the proportion of responses that are incorrect toan item that are incorrect or have been answered in theother direction (i.e. no or disagree); i.e. the number ofincorrect (or ‘no’/‘disagree’) answers out of the totalnumber of responses.
s2 � the variance, or the standard deviation squared.
Another form of internal reliability is split-half reliability.Here the research splits the items into two halves. Thissplit might be made based on odd versus even num-bered items, randomly selecting items for each half, orthe first half versus the second half of the test. Theresearcher then correlates the total scores for each half.A common rule of thumb is 0.80 or high for adequatereliability, though practice does vary.r =
k(k - 1)
a1 -©pq
s2b
Figure 25.1 Reliability analysis window.
Reliability statistics
Cronbach’s alpha N of items
0.866 20
Table 25.1 Reliability analysis output.
M25_MALT2908_02_SE_C25.QXD 8/12/09 8:18 PM Page 648
CHAPTER 25 AN INTRODUCTION TO PSYCHOMETRIC TESTING 649
Here the Cronbach’s alpha is � � 0.866 (or � � 0.87, as it isnormally rounded up to two decimal places). The currentCronbach’s alpha is good, above � � 0.7, and therefore is ofacceptable internal reliability.
Using internal reliability to select items
However, we can look a little closer at our scale to see if theinternal reliability of the scale can be improved. This is par-ticularly useful if the reliability of your items has fallenbelow the criteria of � � 0.7. You should routinely do thisanyway, because the procedures shown in Figure 25.2 allowyou to identify items that are performing poorly.
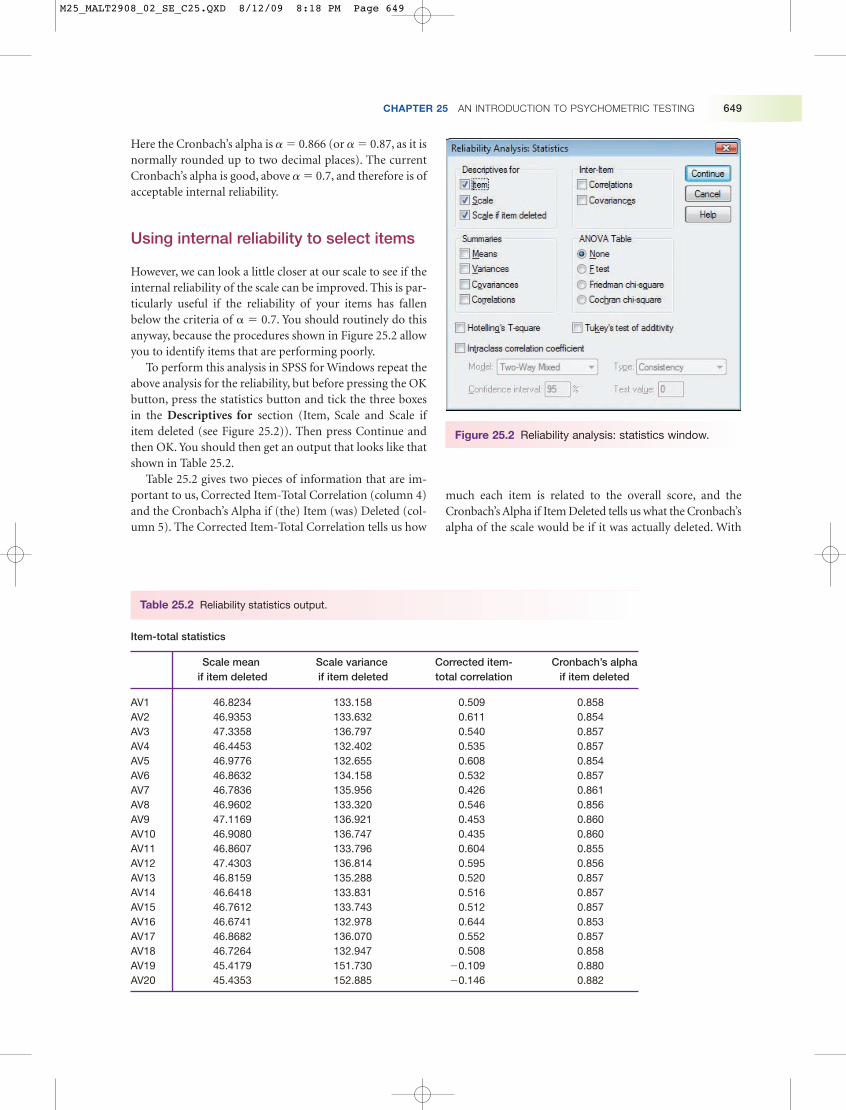
To perform this analysis in SPSS for Windows repeat theabove analysis for the reliability, but before pressing the OKbutton, press the statistics button and tick the three boxesin the Descriptives for section (Item, Scale and Scale ifitem deleted (see Figure 25.2)). Then press Continue andthen OK. You should then get an output that looks like thatshown in Table 25.2.
Table 25.2 gives two pieces of information that are im-portant to us, Corrected Item-Total Correlation (column 4)and the Cronbach’s Alpha if (the) Item (was) Deleted (col-umn 5). The Corrected Item-Total Correlation tells us how
much each item is related to the overall score, and theCronbach’s Alpha if Item Deleted tells us what the Cronbach’salpha of the scale would be if it was actually deleted. With
Item-total statistics
Scale mean Scale variance Corrected item- Cronbach’s alphaif item deleted if item deleted total correlation if item deleted
AV1 46.8234 133.158 0.509 0.858AV2 46.9353 133.632 0.611 0.854AV3 47.3358 136.797 0.540 0.857AV4 46.4453 132.402 0.535 0.857AV5 46.9776 132.655 0.608 0.854AV6 46.8632 134.158 0.532 0.857AV7 46.7836 135.956 0.426 0.861AV8 46.9602 133.320 0.546 0.856AV9 47.1169 136.921 0.453 0.860AV10 46.9080 136.747 0.435 0.860AV11 46.8607 133.796 0.604 0.855AV12 47.4303 136.814 0.595 0.856AV13 46.8159 135.288 0.520 0.857AV14 46.6418 133.831 0.516 0.857AV15 46.7612 133.743 0.512 0.857AV16 46.6741 132.978 0.644 0.853AV17 46.8682 136.070 0.552 0.857AV18 46.7264 132.947 0.508 0.858AV19 45.4179 151.730 �0.109 0.880AV20 45.4353 152.885 �0.146 0.882
Figure 25.2 Reliability analysis: statistics window.
Table 25.2 Reliability statistics output.
M25_MALT2908_02_SE_C25.QXD 8/12/09 8:18 PM Page 649

650 PART 3 FURTHER DEBATES AND APPLICATIONS IN INDIVIDUAL DIFFERENCES
We can see that the Cronbach’s alpha coefficient has im-proved to � � 0.88 (from 0.87) with the removal of AV20.However, if we look at the bottom table we can see thatitem AV19 shares a low negative correlation (–0.130) withthe overall score and removal of the item will improve theCronbach’s alpha to � � 0.897 (0.90 to two decimal places).Therefore, repeating the procedure and removing AV19produces Table 25.4.
You can see now that all the corrected item-total corre-lations are satisfactory (all above 0.5) and our alpha coeffi-cient of 0.90 can’t really be improved upon if we look at thefigures in the Cronbach’s Alpha if Item Deleted column.Consequently we would use the first 18 items for our Acad-emic Vindictiveness scale.
This type of analysis is useful for developing a scale,particularly when you first run the alpha coefficient, andthe alpha coefficient falls below a satisfactory criteria. Itmay be that by removing some items in this manner, oneitem at a time, you can improve the internal reliability ofthe scale.
these statistics we can see if any items are not contributingto the scale.
If we look at the Corrected Item-Total Correlation gooditems should correlate above 0.3 with the total score, andnot be below 0.20 (Kline, 1986). We can see here that itemsAV19 and AV20 are below this criteria (AV19 � –0.109;AV20 � –0.146). The Cronbach’s Alpha if Item Deletedcolumn also suggests that for both these items the currentalpha of � � 0.87 would be improved, to � � 0.880 (0.88)for AV19 and � � 0.882 (0.88) for AV20. These statisticssuggest the scale’s Cronbach’s alpha would be improved byremoving these two items.
What you do in these circumstances is remove one item ata time,with the worst performing item (i.e. lowest correlationand most improved Cronbach’s alpha) being the one that isremoved first,and then seeing what effect it has on the results.You continue this until there is no more improvement.
In our example, the worse performing item is ItemAV20. Therefore we recompute the Cronbach’s alpha withall the items except AV20. We then get an output that lookslike Table 25.3.
Reliability statistics
Cronbach’s alpha N of items
0.882 19
Item-total statistics
Scale mean Scale variance Corrected item- Cronbach’s alphaif item deleted if item deleted total correlation if item deleted
AV1 43.0597 135.847 0.512 0.876AV2 43.1716 136.402 0.611 0.873AV3 43.5721 139.417 0.548 0.875AV4 42.6816 135.145 0.535 0.875AV5 43.2139 135.101 0.621 0.872AV6 43.0995 136.748 0.539 0.875AV7 43.0199 138.364 0.440 0.878AV8 43.1965 135.819 0.557 0.874AV9 43.3532 139.446 0.464 0.877AV10 43.1443 139.371 0.442 0.878AV11 43.0970 136.626 0.602 0.873AV12 43.6667 139.455 0.604 0.874AV13 43.0522 137.980 0.524 0.875AV14 42.8781 136.471 0.521 0.875AV15 42.9975 136.421 0.516 0.876AV16 42.9104 135.658 0.648 0.872AV17 43.1045 138.852 0.553 0.875AV18 42.9627 135.742 0.507 0.876AV19 41.6542 155.309 �0.130 0.897
Table 25.3 Reliability statistics output.
M25_MALT2908_02_SE_C25.QXD 8/12/09 8:18 PM Page 650
CHAPTER 25 AN INTRODUCTION TO PSYCHOMETRIC TESTING 651
Reliability statistics
Cronbach’s alpha N of items
0.897 18
Stop and think
Mean scores and items
Another way of checking your items to see if the itemsare appropriate for your test is to look at the meanscores. This will give us some idea of the averagescores. Why is this useful? Well say, for example, one ofthe mean scores for one of the items was particularlyhigh. For example, for an item scored from 1 (Disagreestrongly) to 5 (Agree strongly), a high mean (e.g. Mean = 4.8)would mean that almost all people were just simplyAgreeing strongly with an item. This would mean that theitem produced little variance in responses, and would al-most be redundant for your scale because it would notdifferentiate between respondents, i.e. almost all peopleanswering that item would answer it in the same way.
We have in the table below listed the Mean and Stan-dard Deviations of all our 18 items selected so far, as wellas the minimum and maximum scores obtained from oursample for each item. As you can see we haven’t got anyextreme means (i.e. very high or low means), with mostof the means being above 2. However, two items are
worth further consideration; ‘I would hate the studentwho got the best mark in own of my classes’ (item 3) and‘I resent people on my course who excel in their studies’(item 12). Clearly the mean scores of these items are a lit-tle lower than the rest of the items and it is also worthnoting that the maximum score obtained for item 12 is 4(rather than 5) meaning no-one Strongly agreed with thisitem. The lower mean scores of these items might bedue to the phrasing of the items. For item 3, ‘hate’ is arather strong word to use and that some people mightnot want to agree with an item that includes such astrong term. Similarly, for item 12, people might be con-cerned with using the phrase that ‘resenting people whoexcel in studies’ and that might be problematic if youyourself excel in your studies because that may meanthat you resent yourself. These reasons are speculative.There is no evidence that these items are problematic,and may represent an accurate response to these state-ments. However, it would always be worth checking in
Table 25.4 Reliability statistics output.
Item-total statistics
Scale mean Scale variance Corrected item- Cronbach’s alphaif item deleted if item deleted total correlation if item deleted
AV1 39.2786 138.012 0.516 0.892AV2 39.3905 138.683 0.612 0.889AV3 39.7910 141.617 0.554 0.891AV4 38.9005 137.691 0.526 0.892AV5 39.4328 137.104 0.632 0.889AV6 39.3184 138.866 0.546 0.891AV7 39.2388 140.696 0.440 0.895AV8 39.4154 137.994 0.561 0.891AV9 39.5721 141.517 0.474 0.893AV10 39.3632 141.504 0.449 0.894AV11 39.3159 138.895 0.603 0.890AV12 39.8856 141.478 0.618 0.890AV13 39.2711 139.974 0.536 0.892AV14 39.0970 138.766 0.521 0.892AV15 39.2164 138.709 0.517 0.892AV16 39.1294 137.983 0.646 0.888AV17 39.3234 141.162 0.553 0.891AV18 39.1816 138.049 0.507 0.893
M25_MALT2908_02_SE_C25.QXD 8/12/09 8:18 PM Page 651

652 PART 3 FURTHER DEBATES AND APPLICATIONS IN INDIVIDUAL DIFFERENCES
Test–retest reliability (reliability over time)
Test–retest reliability assesses reliability over time. Re-searchers interested in constructs that are concerned withindividuals being relatively consistent in their attitudes andbehaviours over time are interested in test–retest reliability.In the personality, intelligence and individual differencesliterature, which is a literature interested in traits, you willsee reference to the stability of tests over time.
Say, for example, 402 respondents completed the newlydeveloped academic vindictiveness questionnaire. Wemight be interested in finding out whether the test meas-ured similar levels of academic vindictiveness in the
respondents at another time. Researchers typically testpeople either a week, two weeks or a month apart fromthe first administration, though some researchers willalso produce six-month, one-year and two-year intervalsbetween administrations. The ability of the academicvindictiveness test to find similar levels of academic vin-dictiveness across the 100 respondents would provideevidence of its stability, and therefore its test–retest relia-bility. A correlation statistic (i.e., the researcher wouldhope that there is a significant positive correlationbetween the two-test administrations) is the most oftenused indicator of test–retest reliability and normally avalue of the correlation of r � or > 0.7 or above is consid-ered as satisfactory.
future analyses how these two items perform, becauseyou may pick up other clues that these items are not per-forming as well as other items and come to conclusionthat they could be dropped. Or indeed it might be worth
considering rewording the item for future administra-tions. For example, with item 12 the clarity of the itemmight be improved by changing it to ‘I resent other peo-ple on my course who excel in their studies’.
Std Item Minimum Maximum Mean deviation
1 I can be spiteful to my friends if they get a better mark than me. 1.00 5.00 2.3756 1.289012 In the past I have falsely told other students the wrong exam
date, so they would miss the exam. 1.00 5.00 2.2637 1.07343
3 I would hate the student who got the best mark in one of my classes.
1.00 5.00 1.8632 .96765
4 If I had the opportunity to change other student’s exam grades so that mine were the best, I would do it.
1.00 5.00 2.7537 1.29127
5 I find myself wishing bad things on people that do better than me academically.
1.00 5.00 2.2214 1.14236
6 I always tell people I am happy for them when they do better than me in exams.*
1.00 5.00 2.3358 1.17078
7 I have thought about spoiling someone’s work because it is better than mine.
1.00 5.00 2.4154 1.25106
8 I wish bad things on people because they are smarter than me. 1.00 5.00 2.2388 1.203779 When other students on my course are praised for their excellent
work, it makes me want to wish something bad on that person.1.00 5.00 2.0821 1.11249
10 If my friend got a better mark than me, I would consider tampering with his/her work in some way.
1.00 5.00 2.2910 1.16575
11 I have mean thoughts towards people who score better than me in exams.
1.00 5.00 2.3383 1.07336
12 I resent people on my course who excel in their studies. 1.00 4.00 1.7687 .8869913 I feel bitter towards those who do better than me on my course. 1.00 5.00 2.3831 1.1110514 I have lied to people on my course to try and hinder their
progress so I can get the better mark.1.00 5.00 2.5572 1.22442
15 If I came second best in an piece of work, because my friend got the top mark, I would still be happy.*
1.00 5.00 2.4378 1.23836
16 I seek revenge on people who get better grades than me and take away my chances of success.
1.00 5.00 2.5249 1.06667
17 I do not like to help others with their work as it might result in them getting a better mark.
1.00 5.00 2.3308 1.00000
18 I would consider doing something nasty to somebody who threatened my chances of academic success.
1.00 5.00 2.4726 1.30623
M25_MALT2908_02_SE_C25.QXD 8/12/09 8:18 PM Page 652
CHAPTER 25 AN INTRODUCTION TO PSYCHOMETRIC TESTING 653
Stop and think
What is a correlation?
As a test, the correlation coefficient can take valuesranging from �1.00 through 0.00 to �1.00.
� A correlation of �1.00 would be a ‘perfect’ positiverelationship.
� A correlation of 0.00 would be no relationship (no sin-gle straight line can sum up the almost random distri-bution of points).
� A correlation of �1.00 would be a ‘perfect’ negativerelationship.
Commonly then, correlation statistics range from �1 to�1, and the symbol of a correlation is r. Therefore, re-searchers will report the direction of correlation coeffi-cients between variables. For example, the relationshipbetween neuroticism (anxious and worrying personalitytraits) and depression would be expected to fall withinthe 0.00 to �1.00 range, while the relationship betweenextraversion (outgoing, optimistic personality traits) anddepression would be expected to fall within the 0.00 to�1.00 range.
However, it is important to remember that the report-ing of correlation statistics doesn’t stop there. There aretwo ways of interpreting the strength of the correlation.The first is the significance level. You remember that alot of statistics involves interpreting whether a statisticaltest result is significant at either the 0.05 or 0.01 level.Therefore, commonly, researchers report whether thecorrelation is significant, be it a positive or negative rela-tionship.
However, it is also necessary to highlight the size ofthe correlation (the r statistic). Researchers often do thisto consider the weight of their findings, and this is alsoknown as effect size (Cohen, 1988). A correlation statis-tic of r � 0.1 and below is viewed as small, r � 0.3 asmedium (or moderate) and r � 0.5 as large. These areused as indicators of the relative importance of findings.Therefore, if a researcher has predicted that there will bea relationship between two variables, a positive correla-tion of 0.5 would be a more important finding than a cor-relation of 0.2.
Validity
Validity is concerned with whether a test is measuringwhat we claim it is measuring. Therefore if we’re proposingthat the 18 items developed above measure academic vin-dictiveness, how can we show this is a measure of academicvindictiveness? There is no absolute way of showing that itis a measure of academic vindictiveness; rather, whatwe would have to do is try to collect evidence through anumber of criteria to support the validity of our test as ameasure of academic vindictiveness. Traditionally, a num-ber of validity criteria can be applied to psychometric tests.
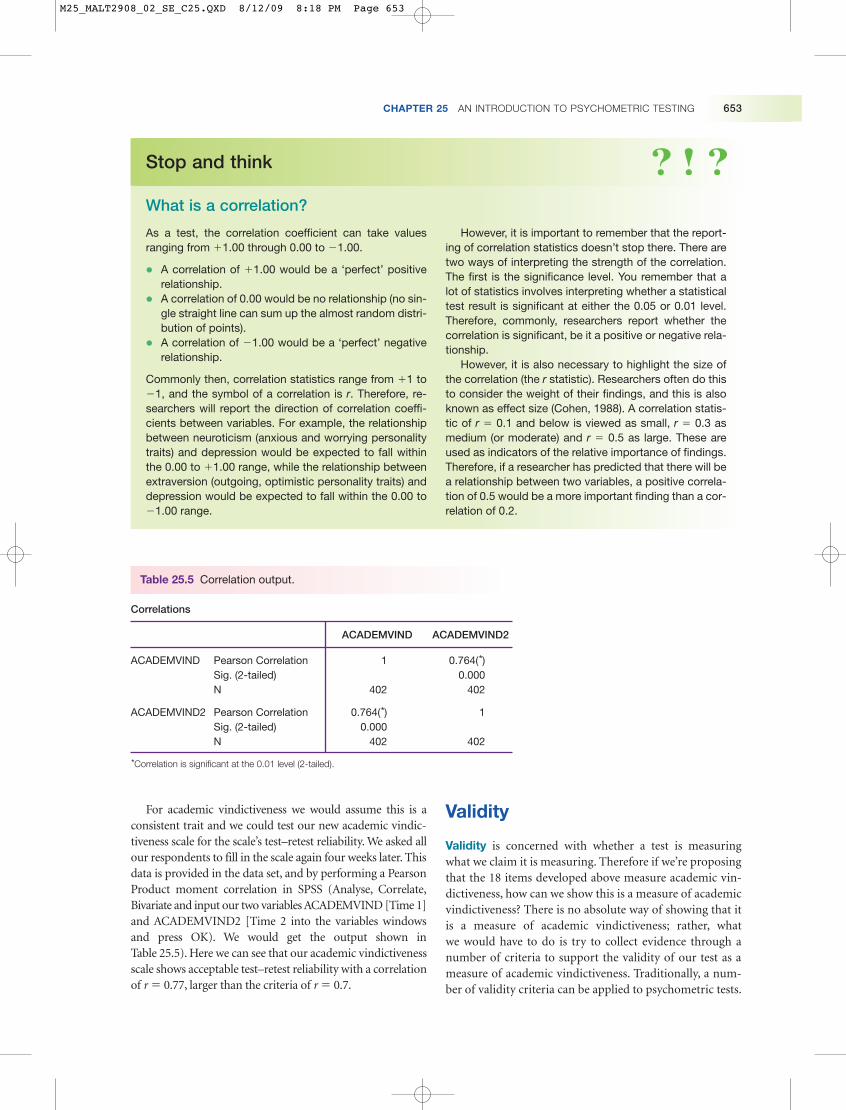
Table 25.5 Correlation output.
Correlations
ACADEMVIND ACADEMVIND2
ACADEMVIND Pearson Correlation 1 0.764(*)Sig. (2-tailed) 0.000N 402 402
ACADEMVIND2 Pearson Correlation 0.764(*) 1Sig. (2-tailed) 0.000N 402 402
*Correlation is significant at the 0.01 level (2-tailed).
For academic vindictiveness we would assume this is aconsistent trait and we could test our new academic vindic-tiveness scale for the scale’s test–retest reliability. We asked allour respondents to fill in the scale again four weeks later. Thisdata is provided in the data set, and by performing a PearsonProduct moment correlation in SPSS (Analyse, Correlate,Bivariate and input our two variables ACADEMVIND [Time 1]and ACADEMVIND2 [Time 2 into the variables windowsand press OK). We would get the output shown inTable 25.5). Here we can see that our academic vindictivenessscale shows acceptable test–retest reliability with a correlationof r � 0.77, larger than the criteria of r � 0.7.
M25_MALT2908_02_SE_C25.QXD 8/12/09 8:18 PM Page 653
654 PART 3 FURTHER DEBATES AND APPLICATIONS IN INDIVIDUAL DIFFERENCES
Stop and think
The difference between using a psychometric tests as a diagnostic test and as a variable
Psychometric tests are used as a powerful assessmentof clinical states. Here, we’re going to give an outline ofhow these are and should be used. One example of aclinical assessment instrument is the Edinburgh Postna-tal Depression Scale. The ten-item scale was developedby Cox, Holden and Sagovsky (1987) as a way of assist-ing primary care health professionals to detect Postna-tal Depression, thought to affect at least 10 per cent ofwomen, among mothers who have recently had a baby.Before using the scale, researchers need to be aware ofthe following three things:
1 Care should be taken to avoid the possibility of themother discussing her answers with others.
2 The mother should complete the scale herself, un-less she has limited English or has difficulty withreading.
3 The EPDS may be used at 6–8 weeks to screen post-natal women. The child health clinic, postnatalcheck-up, or a home visit may provide suitable op-portunities for its completion.
The scale has ten questions. But before going on tothe questions, any respondent is given the following theinstructions:
1 The mother is asked to underline the response whichcomes closest to how she has been feeling in theprevious seven days.
2 All ten items must be completed.
Respondents will be then asked to complete the follow-ing scale.
As you have recently had a baby, we would like toknow how you are feeling. Please UNDERLINE theanswer which comes closest to how you have felt INTHE PAST 7 DAYS, not just how you feel today.
1 I have been able to laugh and see the funny sideof things.
As much as I always couldNot quite so much nowDefinitely not so much nowNot at all
2 I have looked forward with enjoyment to things.
As much as I ever didRather less than I used toDefinitely less than I used toHardly at all
3 *I have blamed myself unnecessarily when thingswent wrong.
Yes, most of the timeYes, some of the timeNot very oftenNo, never
4 I have been anxious or worried for no goodreason.
No, not at allHardly everYes, sometimesYes, very often
5 *I have felt scared or panicky for no very goodreason.
Yes, quite a lotYes, sometimesNo, not muchNo, not at all
6 *Things have been getting on top of me.
Yes, most of the time I haven’t been able to copeat allYes, sometimes I haven’t been coping as well asusualNo, most of the time I have coped quite wellNo, I have been coping as well as ever
7 *I have been so unhappy that I have had difficultysleeping.
Yes, most of the timeYes, sometimesNot very oftenNo, not at all
8 *I have felt sad or miserable.
Yes, most of the timeYes, quite oftenNot very oftenNo, not at all
9 *I have been so unhappy that I have been crying.
Yes, most of the timeYes, quite oftenOnly occasionallyNo, never
M25_MALT2908_02_SE_C25.QXD 8/12/09 8:18 PM Page 654
CHAPTER 25 AN INTRODUCTION TO PSYCHOMETRIC TESTING 655
These different types of validity include:
� Convergent validity – A psychometric test’s convergentvalidity is assessed by the extent to which it shows asso-ciations with measures that it should be related to. So,for example, our new academic vindictiveness should berelated to other aspects of vindictiveness; for example, atendency to seek revenge, show spitefulness and venge-fulness, particularly in academic settings.
� Concurrent validity – A psychometric test is thought toshow concurrent validity when it shows acceptable cor-relations with known and accepted standard measuresof that construct. Therefore, it is slightly different toconvergent validity because it isn’t against other relatedcriteria, but criteria that are reportedly measuring thesame thing. So, we would expect our new academic vin-dictiveness to be related to other available measures ofacademic vindictiveness that already exist. However,sometimes this is difficult to assess if there are no othermeasures of the construct.
� Discriminant validity – Something shows discrimi-nant validity when it is not related to things that itshouldn’t be related to. Sometimes this is difficult to
assess because the finding needs to be useful. For ex-ample, there is little point suggesting that academicvindictiveness should not be related to cake-eating,because that tells us very little about the construct.Therefore, when sometimes examining the discrimi-nate validity of a construct, researchers suggest that thenew construct should not share high correlations withother constructs. For example, a measure of academicvindictiveness should not share a high correlation withany of the main five personality dimensions (neuroti-cism, agreeableness, extraversion, openness and con-scientiousness). However, we might expect that theacademic vindictiveness scale to share a small negativecorrelation with agreeableness, suggesting that thescale is largely independent of the five-factor model ofpersonality).
� Face validity – This aspect of validity is concerned withwhat the measure appears to measure. Therefore, when atest has face validity, it means that it does look like a testthat measures the concept it is designed to measure. Asin the case of our new academic vindictiveness, the bestway to consider this question would be to group together
10 *The thought of harming myself has occurredto me.
Yes, quite oftenSometimesHardly everNever
Answers are scored 0, 1, 2, and 3 according to in-creased severity of the symptoms. So for Item 1 ‘I havebeen able to laugh and see the funny side of things’. ‘Asmuch as I always could’ would be scored 0 and ‘Not atall’ would be scored 3, meaning a higher score ‘3’ wouldmean the respondent had not at all been able to laughand see the funny side of things indicating they may bedepressed. Items marked with an asterisk are reversescored (though they would not be marked on the scalethat is administered to participants). So, for example, forthe item 10, ‘The thought of harming myself has oc-curred to me’, ‘Yes quite often’ would be scored as 3and ‘Never’ as 0. A total score for the scale is then com-puted by adding together the scores.
In research terms, researchers would use an overallscore on the scale for use in correlational analysis.However, these scales can also be used to make anassessment. In terms of possible score, they couldrange from a minimum of 0 (not depressed at all) to 30(very depressed) across the 10 items. It is unlikely thatmany people will score 30 on the scale. Indeed Cox etal. (1987) suggest that anyone scoring above 10 orgreater may be suffering from possible depression.They also suggest that any assessment should also
look at item 10 closely for any possible suicidalthoughts.
This is the main thing about these sorts of question-naires; they are a tool to make an initial assessment.Cox et al. emphasise that the scale should not be usedover clinical judgement and is only a tool, and wheremothers score above 10 then a deeper clinical assess-ment should be performed to confirm the diagnosis.This is true of many of these types of tests; they are bestused as potential indicators, but should never be usedas a single indicator of anything.
There is one important distinction to make whenusing the test. Often, when using a psychometric testto measure any attitude or behaviour there is a tempta-tion to try to categorise people as falling into a grouphaving the attitude behaviour, or falling into a groupwho do not demonstrate that behaviour. However,rarely in research do researchers make this distinction.They will most often just use scores on the test as avariable, and try not to categorise people (unless theyhave a very good reason to do so). This is because, aswe have highlighted above, it is extremely difficult tomake a diagnosis (i.e. group someone) just using a testalone. Indeed for many tests it would be impossible tocategorise someone for a behaviour. What is the criteriathreshold for deciding if someone is intelligent or not,neurotic or not, or optimistic or not. Consequently in in-dividual difference and intelligence research we tend tolook at scores on scales, rather than splitting our sam-ples into diagnostic groups, realising that clinical ex-pertise is needed before making such distinctions.
M25_MALT2908_02_SE_C25.QXD 8/12/09 8:18 PM Page 655
656 PART 3 FURTHER DEBATES AND APPLICATIONS IN INDIVIDUAL DIFFERENCES
some experts in academic vindictiveness to judgewhether they think the questionnaire represents a goodmeasure of that construct.
� Content validity – refers to the extent to which a meas-ure represents all facets of the phenomena being meas-ured. So, for example, in the case of academicvindictiveness we might have some ideas about differenttypes of academic vindictiveness. For example, theremight be academic vindictive behaviours, academicvindictive attitudes and academic vindictive feelings.Therefore, does our measure of academic vindictivenesscover all these domains, i.e. does the content of the testtry to represent all aspects of academic vindictiveness(i.e. behaviours, attitudes and feelings)? If it doesn’t,then it cannot be said to have content validity.
� Predictive validity – This type of validity assesseswhether a measure can accurately predict something inthe future. For example, in the case of academic vindic-tiveness, it should be able to predict people acting in anacademically vindictive way in the future. Therefore,our researcher might administer our new academic vin-dictiveness to a group of students at the beginning ofthe academic year and then measure the extent to whichindividuals reported a number of academic vindictivebehaviours during the examination period at the end ofthe semester (for example, not sharing notes, not help-ing other people revise). If our new academic vindic-tiveness demonstrated predictive validity, it would beable to predict those students who didn’t share notes orhelp other people revise during the examination period.
� Third person rating of the individual – Getting otherpeople to rate the individual on the items of the ques-tionnaire is a very good way of potentially assessing thevalidity of the questionnaire because, ideally, the ratingsgiven by the participants and the other person should besimilar. Indeed sometimes it is referred to as the goldstandard of validity testing. Here, you might ask a per-son close to the individual filling in the questionnaire(e.g. a friend or member of family) to rate that individ-ual on each of the items of the questionnaire. Thereforeif the person’s ratings of the individual for each ques-tionare similar to the person’s actual answers, then thisprovides an independent assessment of the question-naire and validity for the questionnaire. So, for example,for our academically vindictive questionnaire, we wouldexpect scores for individuals to be correlated with theirfriends and family ratings of them.
However, psychometricians have developed some of theseideas into wider terms, and commonly in the modern psy-chometric literature you will see reference to two furtherideas: Criterion-related validity and Construct validity.Both these forms of validity combine different types of
validity we have just mentioned to form new concepts ofvalidity.
The first, criterion-related validity, assesses the value ofthe test by the respondents responses on other measures,i.e. criteria. Two types of measure fall under criterion-related validity, concurrent validity (assesses whether themeasure shows acceptable correlations with known andaccepted standard measures of that construct) andpredictive validity (assesses whether a measure can accu-rately predict something in the future).
The second is construct validity. Construct validity as amore general term and refers to validity that seeks to establisha clear relationship between the construct at a theoreticallevel and the measure that has been developed. Construct va-lidity can be informed by different types of validity previ-ously mentioned, but in 1959 two authors, Donald Campbelland Donald Fiske (Campbell and Fiske, 1959), introducedthat two types of validity: convergent validity (that the meas-ure shows associations with measures that it should berelated to) and discriminant validity (that the measure is notrelated to things that it should not be related to) as the sub-categories of construct validity and they developed a theorynamed the multitrait-multimethod which seeks to assess theconstruct validity of a measure by balancing the assessmentsbetween convergent validity and discriminant validity. Youcan read more about this method in the Stop and think box:Multitrait-multimethod matrix (page 000).
So let us test the validity of the academic vindictivenessscale using the following validity criteria. In this section we’regoing to present a number of validity checks to see to whatextent our new scale shows validity as a good measure of aca-demic vindictiveness. What is important to note is that thereis currently no other measure of academic vindictiveness sowe cannot carry out a concurrent validity check. We thereforeneed to look at the other forms of validity.
The first is convergent validity, which assesses the extentto which our scale shows associations with measures that itshould be related to. In this case, we could look at someother measure of traits that a person who is academicallyvindictive should also score high on. For example, theInternational Personality Item Pool (see Stop and think: In-ternational Personality Item Pool) provides public domain(free to use) access to a number of personality and individ-ual difference measures. For example, the site provides traitmeasures of Morality (e.g. ‘I would never scheme againstothers’), Integrity/Honesty (e.g. ‘I can be trusted to keepmy promises’) and Machiavellism (a trait that suggests thatdeceit is justified in pursuing and maintaining power, e.g.‘Find it easy to manipulate others’). Therefore, we wouldexpect a significant positive correlation between academicvindictiveness and Machiavellism and a significant nega-tive correlation between academic vindictiveness andmorality and integrity/honesty.
M25_MALT2908_02_SE_C25.QXD 8/12/09 8:18 PM Page 656

CHAPTER 25 AN INTRODUCTION TO PSYCHOMETRIC TESTING 657
In terms of discriminant validity a good strategy wouldbe to compare the academic vindictiveness scale to the five-factor personality measures; neuroticism, extraversion,agreeableness, conscientiousness and openness. Now, whilewe might expect academic vindictiveness to share a negativecorrelation with agreeableness (a tendency to be pleasantand accommodating), we can show discriminate validity forour measure by finding no significant relationship betweenour measure of academic vindictiveness and neuroticism,extraversion, conscientiousness and openness.
Our final attempt at validity is to examine third personratings of the individual on the scale. Here, we asked afriend of the participant to rate the participant on themeasure of academic vindictiveness. However, for thismeasure we asked the respondent to provide a friend whowas also a classmate, so as to ensure that the friend hadsome knowledge of how the respondent was in an aca-demic setting.
We now have a number of measures to establish validityof our scale. All these measures are included in the data setwe used earlier, and if you wish you can run your own cor-relational analysis (remember we showed you how to run acorrelation in the test – retest example, and remember ouracademic vindictiveness scale variable name in the dataset is ACADEMVIND). However, Table 25.6 shows the
correlations between our academic vindictiveness scaleand of morality, integrity/honesty and Machiavellism, thefive-factor model of personality and the friend’s rating ofthe respondent on the scale.
Our first set of results tries to establish convergentvalidity for our academic vindictiveness scale. In terms ofour predictions, academic vindictiveness shares a signifi-cant negative correlation with morality and integrity/honesty and a significant positive correlation withMachiavellism (see Table 25.6). What is also worth notinghere is the size of the correlations. You remember thatthe effect size of a correlation statistic of r � 0.1 isviewed as small, r � 0.3 as medium (or moderate) and r �
0.5 as large. Here, the correlations are at least of a mediumsize.
We also sought to examine both the convergent butmainly the discriminate validity of our academic vindic-tiveness scale by looking at the relationship between thescale and the five-factor model of personality (seeTable 25.7). Again, the findings are consistent with ourpredictions. Academic vindictiveness shares a significantnegative correlation with agreeableness (with a mediumeffect size), but our discriminate validity is demonstratedby its lack of any significant correlation with neuroticism,extraversion, openness and conscientiousness.
Stop and think
International Personality Item Pool
The International Personality Item Pool (IPIP) website(http://ipip.ori.org/ipip/) provides public domain ac-cess to a number of personality and individual differ-ence measures. The main reason for the development ofthe site is that a lot of measures of personality (theMMPI, 16PF and NEO-PI) are copyrighted by the test
authors and consequently cannot be used freely byother researchers, like you. The site provides freelyavailable versions of all the main personality measuresas well as over 200 measures of personality individualdifference traits.
Table 25.6 Pearson product moment correlation coefficients between academic vindictiveness andmorality, integrity/honesty and machiavellism.
Academic vindictiveness
Morality (IPIP) �0.453**
Integrity/honesty (IPIP) �0.410**
Machiavellism (IPIP) 0.344**
**p < 0.01
Table 25.7 Pearson product moment correlationcoefficients between academic vindictiveness and the five-factor personality dimensions.
Neuroticism 0.076Extraversion 0.013Openness �0.074Agreeableness �0.320(**)Conscientiousness �0.097
**p � 0.01
M25_MALT2908_02_SE_C25.QXD 8/12/09 8:18 PM Page 657
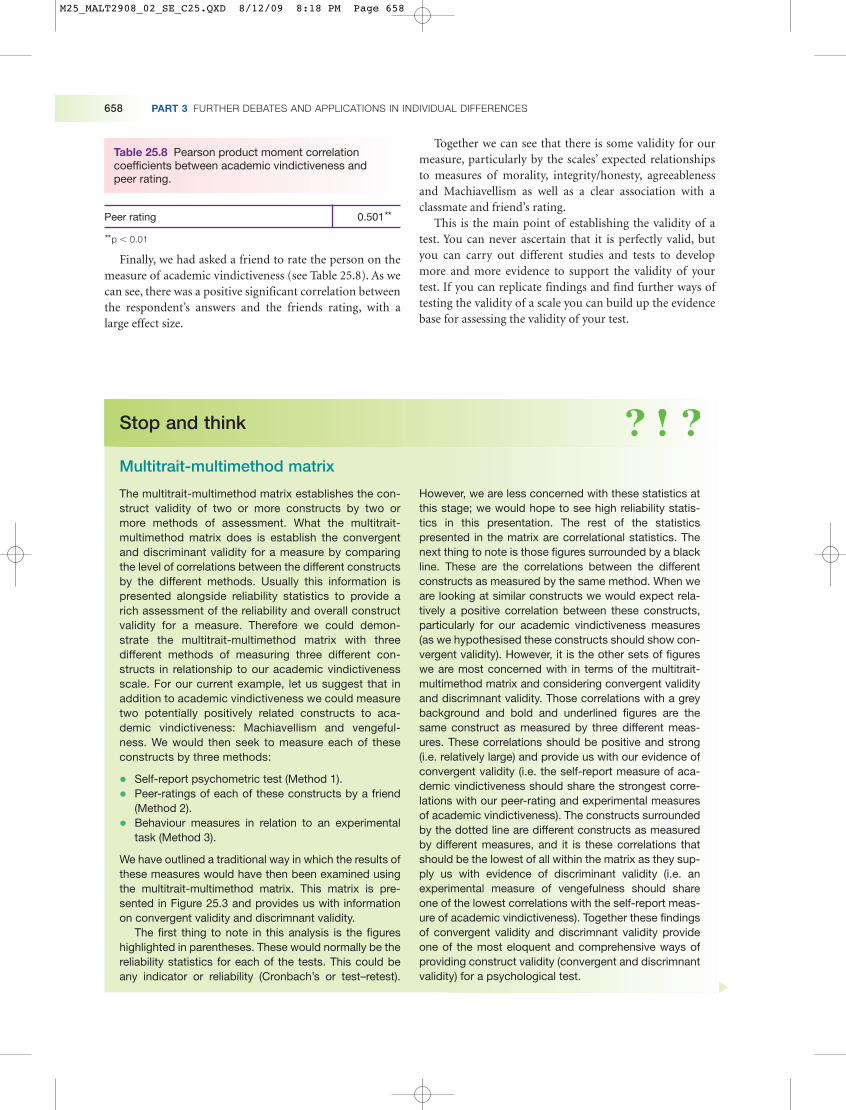
658 PART 3 FURTHER DEBATES AND APPLICATIONS IN INDIVIDUAL DIFFERENCES
Stop and think
Multitrait-multimethod matrix
The multitrait-multimethod matrix establishes the con-struct validity of two or more constructs by two ormore methods of assessment. What the multitrait-multimethod matrix does is establish the convergentand discriminant validity for a measure by comparingthe level of correlations between the different constructsby the different methods. Usually this information ispresented alongside reliability statistics to provide arich assessment of the reliability and overall constructvalidity for a measure. Therefore we could demon-strate the multitrait-multimethod matrix with threedifferent methods of measuring three different con-structs in relationship to our academic vindictivenessscale. For our current example, let us suggest that inaddition to academic vindictiveness we could measuretwo potentially positively related constructs to aca-demic vindictiveness: Machiavellism and vengeful-ness. We would then seek to measure each of theseconstructs by three methods:
� Self-report psychometric test (Method 1).� Peer-ratings of each of these constructs by a friend
(Method 2).� Behaviour measures in relation to an experimental
task (Method 3).
We have outlined a traditional way in which the results ofthese measures would have then been examined usingthe multitrait-multimethod matrix. This matrix is pre-sented in Figure 25.3 and provides us with informationon convergent validity and discrimnant validity.
The first thing to note in this analysis is the figureshighlighted in parentheses. These would normally be thereliability statistics for each of the tests. This could beany indicator or reliability (Cronbach’s or test–retest).
However, we are less concerned with these statistics atthis stage; we would hope to see high reliability statis-tics in this presentation. The rest of the statisticspresented in the matrix are correlational statistics. Thenext thing to note is those figures surrounded by a blackline. These are the correlations between the differentconstructs as measured by the same method. When weare looking at similar constructs we would expect rela-tively a positive correlation between these constructs,particularly for our academic vindictiveness measures(as we hypothesised these constructs should show con-vergent validity). However, it is the other sets of figureswe are most concerned with in terms of the multitrait-multimethod matrix and considering convergent validityand discrimnant validity. Those correlations with a greybackground and bold and underlined figures are thesame construct as measured by three different meas-ures. These correlations should be positive and strong(i.e. relatively large) and provide us with our evidence ofconvergent validity (i.e. the self-report measure of aca-demic vindictiveness should share the strongest corre-lations with our peer-rating and experimental measuresof academic vindictiveness). The constructs surroundedby the dotted line are different constructs as measuredby different measures, and it is these correlations thatshould be the lowest of all within the matrix as they sup-ply us with evidence of discriminant validity (i.e. anexperimental measure of vengefulness should shareone of the lowest correlations with the self-report meas-ure of academic vindictiveness). Together these findingsof convergent validity and discrimnant validity provideone of the most eloquent and comprehensive ways ofproviding construct validity (convergent and discrimnantvalidity) for a psychological test.
Finally, we had asked a friend to rate the person on themeasure of academic vindictiveness (see Table 25.8). As wecan see, there was a positive significant correlation betweenthe respondent’s answers and the friends rating, with alarge effect size.
Together we can see that there is some validity for ourmeasure, particularly by the scales’ expected relationshipsto measures of morality, integrity/honesty, agreeablenessand Machiavellism as well as a clear association with aclassmate and friend’s rating.
This is the main point of establishing the validity of atest. You can never ascertain that it is perfectly valid, butyou can carry out different studies and tests to developmore and more evidence to support the validity of yourtest. If you can replicate findings and find further ways oftesting the validity of a scale you can build up the evidencebase for assessing the validity of your test.
Table 25.8 Pearson product moment correlationcoefficients between academic vindictiveness and peer rating.
Peer rating 0.501**
**p � 0.01
M25_MALT2908_02_SE_C25.QXD 8/12/09 8:18 PM Page 658
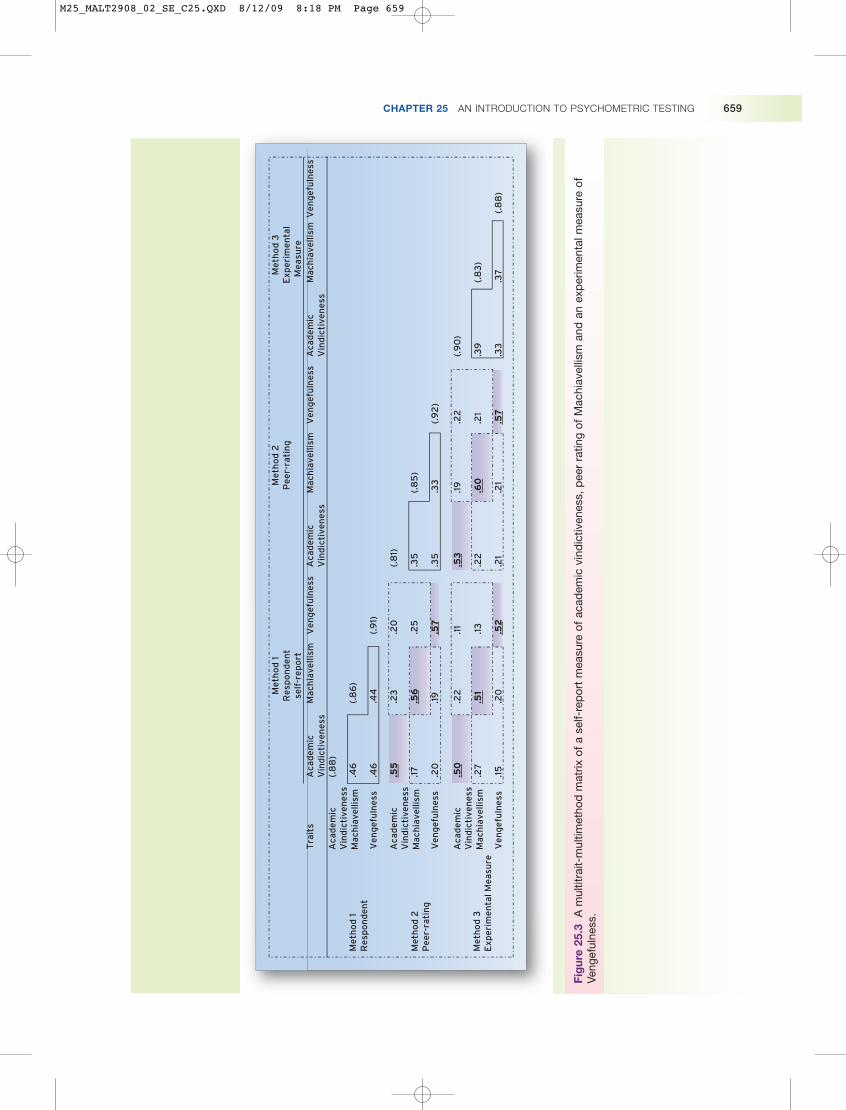
CHAPTER 25 AN INTRODUCTION TO PSYCHOMETRIC TESTING 659
Me
tho
d 1
Re
spo
nd
en
tse
lf-r
ep
ort
Me
tho
d 2
Pe
er-
rati
ng
Me
tho
d 3
Exp
eri
me
nta
lM
eas
ure
A
cad
em
icV
ind
icti
ven
ess
A
cad
em
icV
ind
icti
ven
ess
Mac
hia
velli
sm
Tra
its
Aca
de
mic
Vin
dic
tive
ne
ss
Ve
ng
efu
lne
ss
Ve
ng
efu
lne
ss
Aca
de
mic
Vin
dic
tive
ne
ssM
ach
iave
llism
Ve
ng
efu
lne
ss
Aca
de
mic
Vin
dic
tive
ne
ssM
ach
iave
llism
Ve
ng
efu
lne
ss
Mac
hia
velli
smA
cad
em
icV
ind
icti
ven
ess
V
en
ge
fuln
ess
Mac
hia
velli
smV
en
ge
fuln
ess
Mac
hia
velli
sm
(.8
8)
Me
tho
d 1
R
esp
on
de
nt
.46
.46
Me
tho
d 2
Pe
er-
rati
ng
.1
7
.20
Me
tho
d 3
Exp
eri
me
nta
l Me
asu
re
.27
.15
.55
.50
(.8
6)
.44
.56
.19
.51
.20
.23
.22
(.9
1)
.25
.57
.13
.52
.20
.11
.35
.35
.22
.21
(.8
1)
.53
(.8
5)
.33
.60
.21
.19
(.9
2)
.21
.57
.22
.39
.33
(.8
3)
.37
(.8
8)
(.9
0)
Fig
ure
25.3
A m
ultit
rait-
mul
timet
hod
mat
rix o
f a
self-
rep
ort
mea
sure
of
acad
emic
vin
dic
tiven
ess,
pee
r ra
ting
of M
achi
avel
lism
and
an
exp
erim
enta
l mea
sure
of
Veng
eful
ness
.
M25_MALT2908_02_SE_C25.QXD 8/12/09 8:18 PM Page 659

660 PART 3 FURTHER DEBATES AND APPLICATIONS IN INDIVIDUAL DIFFERENCES
Profile
Paul Kline
Professor Paul Kline was born in 1937. He became anacademic psychologist after training as an educationalpsychologist, which followed a period in which hetaught classics before moving on to completing his PhDat Manchester University. In 1969, he undertook a posi-tion in the Exeter University Psychology department,and he later became the first professor of Psychomet-rics in the United Kingdom.
It’s been noted by his colleagues that Kline, whoseuntimely death was in 1999, had two enthusiasms inpsychology – psychometrics and Freudian theory. Hewrote essential books on psychometrics. His 1986handbook of test construction provided an essentialand clear introduction to a complex field. His 1999 book
was essential in that it covered psychometric theory, thedifferent kinds of psychological tests and applied psy-chological testing as well as evaluating the best-published psychological tests. His 2000 book, The NewPsychometrics: Science, Psychology and Measurement,sought to use his knowledge of psychological measure-ment to argue that truly scientific forms of measurementcould be developed to create a new psychometrics thatwould transform psychology from a social science to apure science. However, perhaps, in his most famousbook, Fact and Fantasy in Freudian Theory, he was ableto combine statistics and Freudian theory and broughtforward many principles of reliability and validity to examine psychological studies of Freudian theory.
Stop and think
Self-assessment exercise
In our validity assessment of the academic vindictive-ness scale we didn’t examine the face validity and the pre-dictive validity of our test. Can you think of an empirical
study that would test the academic vindictiveness scalefor both these sets of validity?
Advanced techniques inpsychometric evaluation: factor analysis
In this section we are going to introduce you to an advancedanalysis technique that can be used to look at the psycho-metric properties of items. Factor analysis, in a psychomet-ric test context, refers, in the first instance, to the area thatwe covered within the internal reliability of a test earlier inthis chapter. In this part of this chapter we are very inter-ested in seeing whether a number of items correlatedtogether to form a single scale. However, what happens ifthe scale you’ve developed is designed to have more thanone element to it? For example, personality measures have anumber of factors; the five-factor personality scale has fivefactors. What happens if a number of elements exist to ouracademic vindictiveness measure, not just one? Well, onetechnique that is used to explore these issues is factor analy-sis. In this section we’re going to explain two types of factoranalysis to you: exploratory factor analysis and confirma-tory factor analysis. Exploratory factor analysis (EFA) isused for exploring what elements (or as they are known,factors) underlie sets of items. Confirmatory factor analysis
(CFA) is used to try to confirm what you may have foundwith exploratory factor analysis.
Factor analysis
Factor analysis is a multivariate (multiple variables) ‘datareduction’ statistical technique that allows us to simplify thecorrelational relationships between a number of variables.
Why would you wish to do so? Imagine if you wanted tolook at the relationships between variables 1 to 20. Thiswould imply having to interpret 190 relationships betweenvariables. (For example, variable 1 can be correlated withvariables 2 through 20. And, variable 2 can be separatelyassociated with variables 3 through 20, variable 3 with vari-ables 4 through 20 and so on.) Identifying real patterns iscomplicated further because the relationship between, forexample, variables 1 and 12 may be affected by the separaterelationships each of these variables has with variable 13,with variable 14 and so on. This complicated explanationof 190 relationships is a nightmare for researchers. Theresearcher will find it difficult to explain which variable isactually related to which other variables, as they may beuncertain whether the apparent relationship between two
M25_MALT2908_02_SE_C25.QXD 8/12/09 8:18 PM Page 660
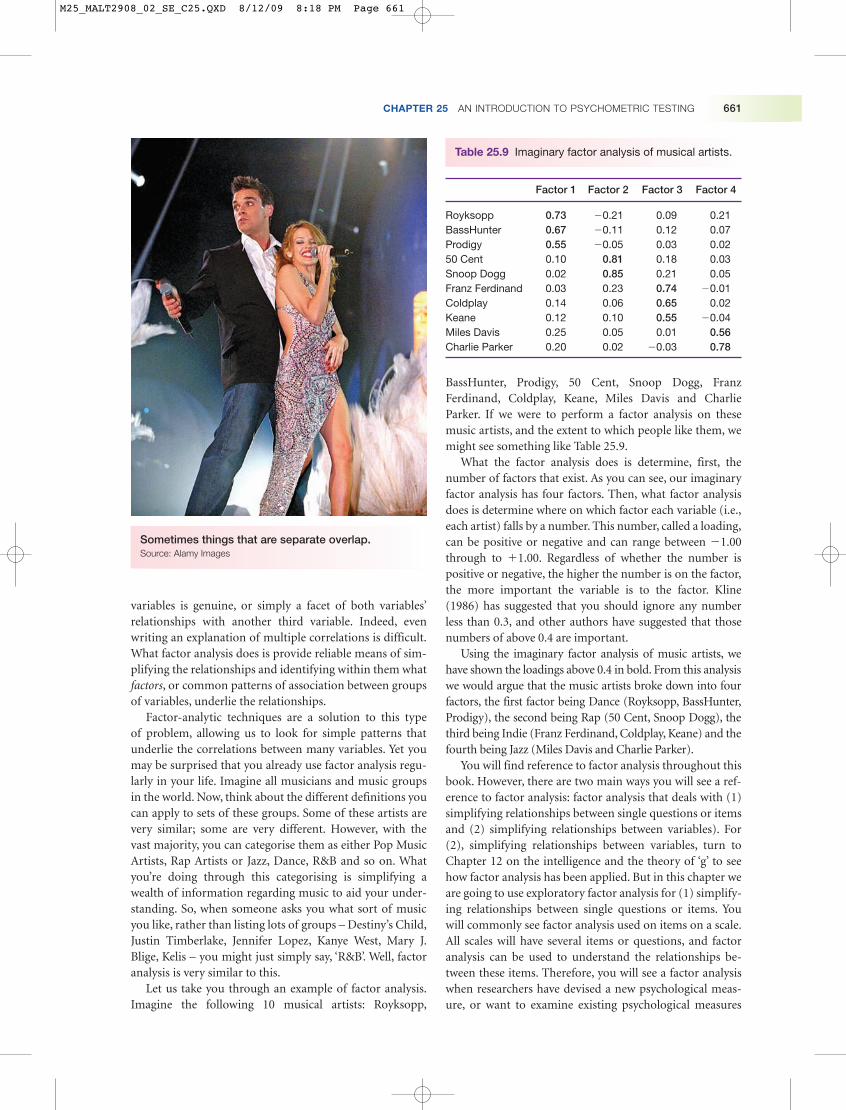
CHAPTER 25 AN INTRODUCTION TO PSYCHOMETRIC TESTING 661
variables is genuine, or simply a facet of both variables’relationships with another third variable. Indeed, evenwriting an explanation of multiple correlations is difficult.What factor analysis does is provide reliable means of sim-plifying the relationships and identifying within them whatfactors, or common patterns of association between groupsof variables, underlie the relationships.
Factor-analytic techniques are a solution to this typeof problem, allowing us to look for simple patterns thatunderlie the correlations between many variables. Yet youmay be surprised that you already use factor analysis regu-larly in your life. Imagine all musicians and music groupsin the world. Now, think about the different definitions youcan apply to sets of these groups. Some of these artists arevery similar; some are very different. However, with thevast majority, you can categorise them as either Pop MusicArtists, Rap Artists or Jazz, Dance, R&B and so on. Whatyou’re doing through this categorising is simplifying awealth of information regarding music to aid your under-standing. So, when someone asks you what sort of musicyou like, rather than listing lots of groups – Destiny’s Child,Justin Timberlake, Jennifer Lopez, Kanye West, Mary J.Blige, Kelis – you might just simply say, ‘R&B’. Well, factoranalysis is very similar to this.
Let us take you through an example of factor analysis.Imagine the following 10 musical artists: Royksopp,
BassHunter, Prodigy, 50 Cent, Snoop Dogg, Franz Ferdinand, Coldplay, Keane, Miles Davis and CharlieParker. If we were to perform a factor analysis on thesemusic artists, and the extent to which people like them, wemight see something like Table 25.9.
What the factor analysis does is determine, first, thenumber of factors that exist. As you can see, our imaginaryfactor analysis has four factors. Then, what factor analysisdoes is determine where on which factor each variable (i.e.,each artist) falls by a number. This number, called a loading,can be positive or negative and can range between �1.00through to �1.00. Regardless of whether the number ispositive or negative, the higher the number is on the factor,the more important the variable is to the factor. Kline(1986) has suggested that you should ignore any numberless than 0.3, and other authors have suggested that thosenumbers of above 0.4 are important.
Using the imaginary factor analysis of music artists, wehave shown the loadings above 0.4 in bold. From this analysiswe would argue that the music artists broke down into fourfactors, the first factor being Dance (Royksopp, BassHunter,Prodigy), the second being Rap (50 Cent, Snoop Dogg), thethird being Indie (Franz Ferdinand, Coldplay, Keane) and thefourth being Jazz (Miles Davis and Charlie Parker).
You will find reference to factor analysis throughout thisbook. However, there are two main ways you will see a ref-erence to factor analysis: factor analysis that deals with (1)simplifying relationships between single questions or itemsand (2) simplifying relationships between variables). For(2), simplifying relationships between variables, turn toChapter 12 on the intelligence and the theory of ‘g’ to seehow factor analysis has been applied. But in this chapter weare going to use exploratory factor analysis for (1) simplify-ing relationships between single questions or items. Youwill commonly see factor analysis used on items on a scale.All scales will have several items or questions, and factoranalysis can be used to understand the relationships be-tween these items. Therefore, you will see a factor analysiswhen researchers have devised a new psychological meas-ure, or want to examine existing psychological measures
Table 25.9 Imaginary factor analysis of musical artists.
Factor 1 Factor 2 Factor 3 Factor 4
Royksopp 0.73 �0.21 0.09 0.21BassHunter 0.67 �0.11 0.12 0.07Prodigy 0.55 �0.05 0.03 0.0250 Cent 0.10 0.81 0.18 0.03Snoop Dogg 0.02 0.85 0.21 0.05Franz Ferdinand 0.03 0.23 0.74 �0.01Coldplay 0.14 0.06 0.65 0.02Keane 0.12 0.10 0.55 �0.04Miles Davis 0.25 0.05 0.01 0.56Charlie Parker 0.20 0.02 �0.03 0.78
Sometimes things that are separate overlap.Source: Alamy Images
M25_MALT2908_02_SE_C25.QXD 8/12/09 8:18 PM Page 661
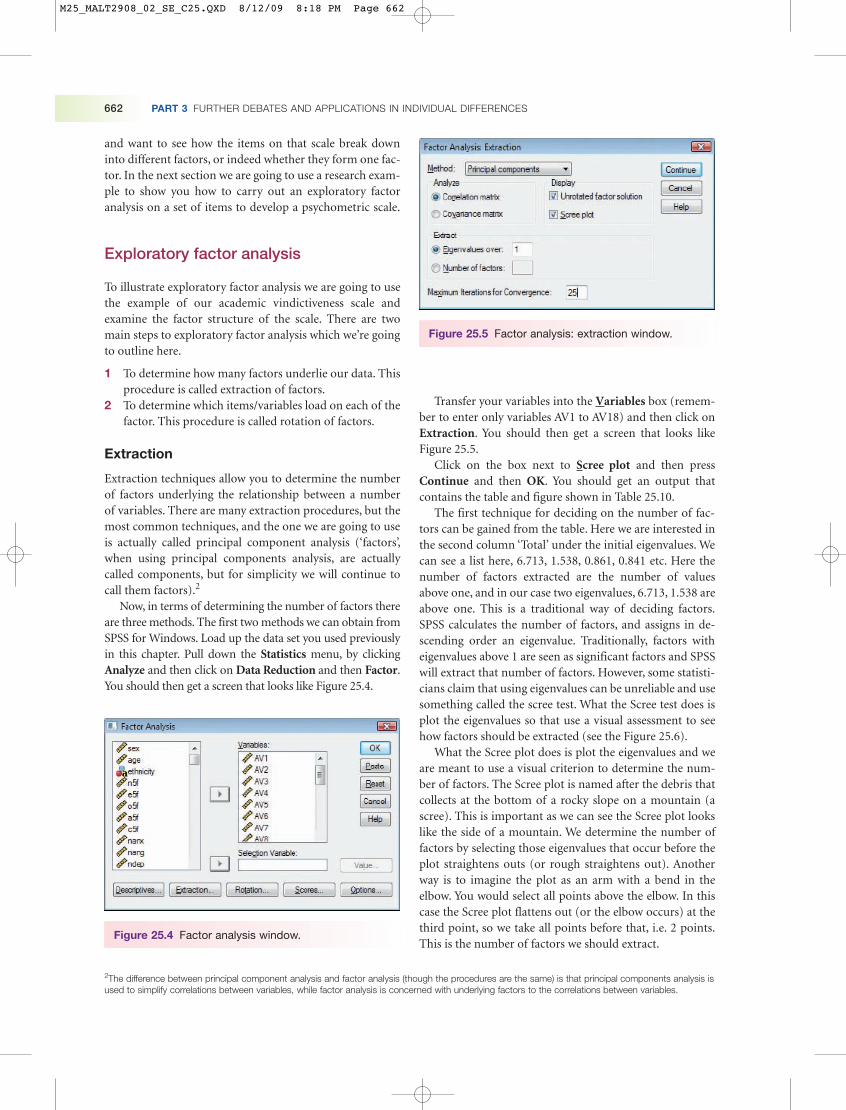
662 PART 3 FURTHER DEBATES AND APPLICATIONS IN INDIVIDUAL DIFFERENCES
and want to see how the items on that scale break downinto different factors, or indeed whether they form one fac-tor. In the next section we are going to use a research exam-ple to show you how to carry out an exploratory factoranalysis on a set of items to develop a psychometric scale.
Exploratory factor analysis
To illustrate exploratory factor analysis we are going to usethe example of our academic vindictiveness scale andexamine the factor structure of the scale. There are twomain steps to exploratory factor analysis which we’re goingto outline here.
1 To determine how many factors underlie our data. Thisprocedure is called extraction of factors.
2 To determine which items/variables load on each of thefactor. This procedure is called rotation of factors.
Extraction
Extraction techniques allow you to determine the numberof factors underlying the relationship between a numberof variables. There are many extraction procedures, but themost common techniques, and the one we are going to useis actually called principal component analysis (‘factors’,when using principal components analysis, are actuallycalled components, but for simplicity we will continue tocall them factors).2
Now, in terms of determining the number of factors thereare three methods. The first two methods we can obtain fromSPSS for Windows. Load up the data set you used previouslyin this chapter. Pull down the Statistics menu, by clickingAnalyze and then click on Data Reduction and then Factor.You should then get a screen that looks like Figure 25.4.
Transfer your variables into the Variables box (remem-ber to enter only variables AV1 to AV18) and then click onExtraction. You should then get a screen that looks likeFigure 25.5.
Click on the box next to Scree plot and then pressContinue and then OK. You should get an output thatcontains the table and figure shown in Table 25.10.
The first technique for deciding on the number of fac-tors can be gained from the table. Here we are interested inthe second column ‘Total’ under the initial eigenvalues. Wecan see a list here, 6.713, 1.538, 0.861, 0.841 etc. Here thenumber of factors extracted are the number of valuesabove one, and in our case two eigenvalues, 6.713, 1.538 areabove one. This is a traditional way of deciding factors.SPSS calculates the number of factors, and assigns in de-scending order an eigenvalue. Traditionally, factors witheigenvalues above 1 are seen as significant factors and SPSSwill extract that number of factors. However, some statisti-cians claim that using eigenvalues can be unreliable and usesomething called the scree test. What the Scree test does isplot the eigenvalues so that use a visual assessment to seehow factors should be extracted (see the Figure 25.6).
What the Scree plot does is plot the eigenvalues and weare meant to use a visual criterion to determine the num-ber of factors. The Scree plot is named after the debris thatcollects at the bottom of a rocky slope on a mountain (ascree). This is important as we can see the Scree plot lookslike the side of a mountain. We determine the number offactors by selecting those eigenvalues that occur before theplot straightens outs (or rough straightens out). Anotherway is to imagine the plot as an arm with a bend in theelbow. You would select all points above the elbow. In thiscase the Scree plot flattens out (or the elbow occurs) at thethird point, so we take all points before that, i.e. 2 points.This is the number of factors we should extract.
Figure 25.4 Factor analysis window.
Figure 25.5 Factor analysis: extraction window.
2The difference between principal component analysis and factor analysis (though the procedures are the same) is that principal components analysis isused to simplify correlations between variables, while factor analysis is concerned with underlying factors to the correlations between variables.
M25_MALT2908_02_SE_C25.QXD 8/12/09 8:18 PM Page 662

CHAPTER 25 AN INTRODUCTION TO PSYCHOMETRIC TESTING 663
Total variance explained
Initial eigenvalues Extraction sums of squared loadings
Component Total % of Variance Cumulative % Total % of variance Cumulative % Total
1 6.713 37.295 37.295 6.713 37.295 37.295 5.8052 1.538 8.542 45.837 1.538 8.542 45.837 5.4683 0.861 4.784 50.6214 0.814 4.520 55.1415 0.775 4.303 59.4446 0.756 4.200 63.6447 0.729 4.049 67.6938 0.697 3.870 71.5639 0.666 3.702 75.265
10 0.621 3.449 78.71311 0.599 3.328 82.04212 0.545 3.029 85.07113 0.531 2.949 88.02014 0.505 2.807 90.82715 0.471 2.618 93.44516 0.412 2.288 95.73317 0.393 2.182 97.91518 0.375 2.085 100.000
Extraction method: principal component analysis.*When components are correlated, sums of squared loadings cannot be added to obtain a total variance.
Table 25.10 Extraction output.
Rotationsums ofsquaredloadings*
181716151413121110987654321
Component number
7
6
5
4
3
2
1
0
Eig
envalu
e
Scree plot
Figure 25.6 Scree plot.
M25_MALT2908_02_SE_C25.QXD 8/12/09 8:18 PM Page 663
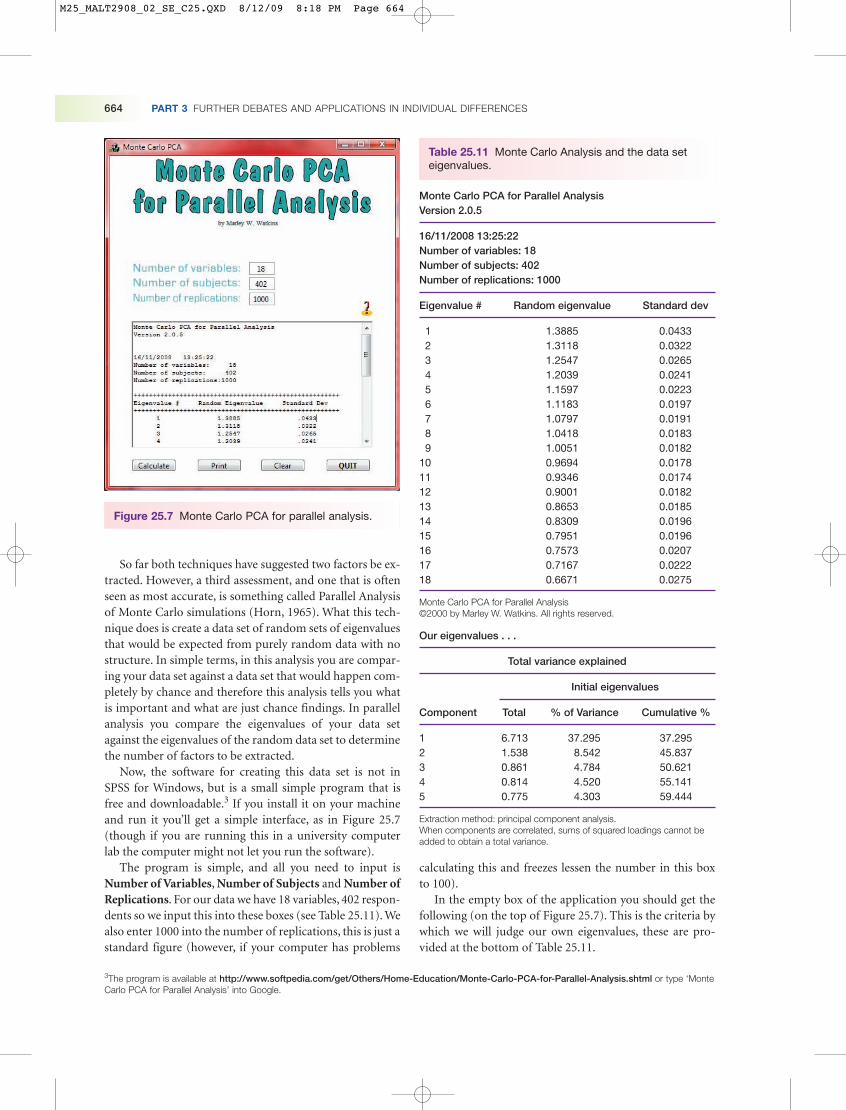
664 PART 3 FURTHER DEBATES AND APPLICATIONS IN INDIVIDUAL DIFFERENCES
So far both techniques have suggested two factors be ex-tracted. However, a third assessment, and one that is oftenseen as most accurate, is something called Parallel Analysisof Monte Carlo simulations (Horn, 1965). What this tech-nique does is create a data set of random sets of eigenvaluesthat would be expected from purely random data with nostructure. In simple terms, in this analysis you are compar-ing your data set against a data set that would happen com-pletely by chance and therefore this analysis tells you whatis important and what are just chance findings. In parallelanalysis you compare the eigenvalues of your data setagainst the eigenvalues of the random data set to determinethe number of factors to be extracted.
Now, the software for creating this data set is not inSPSS for Windows, but is a small simple program that isfree and downloadable.3 If you install it on your machineand run it you’ll get a simple interface, as in Figure 25.7(though if you are running this in a university computerlab the computer might not let you run the software).
The program is simple, and all you need to input isNumber of Variables, Number of Subjects and Number ofReplications. For our data we have 18 variables, 402 respon-dents so we input this into these boxes (see Table 25.11). Wealso enter 1000 into the number of replications, this is just astandard figure (however, if your computer has problems
calculating this and freezes lessen the number in this boxto 100).
In the empty box of the application you should get thefollowing (on the top of Figure 25.7). This is the criteria bywhich we will judge our own eigenvalues, these are pro-vided at the bottom of Table 25.11.
3The program is available at http://www.softpedia.com/get/Others/Home-Education/Monte-Carlo-PCA-for-Parallel-Analysis.shtml or type ‘MonteCarlo PCA for Parallel Analysis’ into Google.
Figure 25.7 Monte Carlo PCA for parallel analysis.
Table 25.11 Monte Carlo Analysis and the data seteigenvalues.
Monte Carlo PCA for Parallel AnalysisVersion 2.0.5
16/11/2008 13:25:22Number of variables: 18Number of subjects: 402Number of replications: 1000
Eigenvalue # Random eigenvalue Standard dev
1 1.3885 0.04332 1.3118 0.03223 1.2547 0.02654 1.2039 0.02415 1.1597 0.02236 1.1183 0.01977 1.0797 0.01918 1.0418 0.01839 1.0051 0.0182
10 0.9694 0.017811 0.9346 0.017412 0.9001 0.018213 0.8653 0.018514 0.8309 0.019615 0.7951 0.019616 0.7573 0.020717 0.7167 0.022218 0.6671 0.0275
Monte Carlo PCA for Parallel Analysis©2000 by Marley W. Watkins. All rights reserved.
Our eigenvalues . . .
Total variance explained
Initial eigenvalues
Component Total % of Variance Cumulative %
1 6.713 37.295 37.2952 1.538 8.542 45.8373 0.861 4.784 50.6214 0.814 4.520 55.1415 0.775 4.303 59.444
Extraction method: principal component analysis.When components are correlated, sums of squared loadings cannot beadded to obtain a total variance.
M25_MALT2908_02_SE_C25.QXD 8/12/09 8:18 PM Page 664

CHAPTER 25 AN INTRODUCTION TO PSYCHOMETRIC TESTING 665
We then compare each of our eigenvalues against therandom eigenvalues in turn. So we compare the first ofour eigenvalues against the first random eigenvalues, andthen each one after that. At first, our eigenvalues exceedthose in the random data set, but when they stop exceed-ing the ones in the data set that’s our criteria for determin-ing the number of factors. For example, our firsteigenvalue ‘6.713’ exceeds the first eigenvalue in the ran-dom data set ‘1.3885’. Similarly, our second eigenvalue‘1.538’ exceeds the second eigenvalue in the random dataset, ‘1.3118’. However, our third eigenvalue, ‘0.861’ fails toexceed the third eigenvalue in the random dataset, ‘1.2547’.This is our criteria for determining those factors, we onlyextract those factors that are greater in value than corre-sponding values in the data set. That is, because the gener-ated data set is of purely random data, we are only surethat those eigenvalues that exceed the value in the randomdata set are not created by chance. Here two of our eigen-values exceed the values in the random data set, and there-fore we would select two factors.
Among our data set all three criteria suggest that twofactors be extracted from our data set.
Rotation
Rotation is necessary when extraction techniques suggestthere are two or more factors to extract. Simply put, the ro-tation of factors is designed to give us an idea of how thefactors we extract are related, and provides a clear pictureof which items load on which factor.
There are two sets of rotations techniques.
1 Orthogonal rotations – These are rotations that as-sume that each factor shares no association and arespecifically unique. This is often used in psychologywhen applying a theoretical model to factor analysis andthe model predicts that the factors are independent.
2 Oblique Rotations – These tend to be used moreoften, as this procedure outlines the position of factorsto one another, i.e. determines how they are usuallyrelated. The most specific procedure most often usedfor this is a technique called oblimin.
Each of these categories has a number of different typesof rotation within them. However, the most specific proce-dure most often used for orthogonal rotations is a tech-nique called varimax. The most specific procedure mostoften used for oblique rotations is a technique called oblimin.Usually, there are reasons for doing one or another. For ex-ample, researchers tend to prefer oblique rotations becausethey actually indicate how the different factors are relatedto one another. However, researchers will use orthogonalrotations when they feel the factors should be independent.Because of these differing views, and this would make sensewhen exploring factors, researchers tend to use both and
report on those that produce the clearest results. We willnow take you through an example that uses both these ro-tation techniques to illustrate rotation to you.
OK, we need to run our factor analysis procedure againas before, but this time in the Factor Analysis Window wepress the Rotation button. You will then get a Window thatlooks like Figure 25.8. Click on Direct Oblimin and pressContinue and then OK. Then run the whole procedureagain, but this time click on Varimax. Then run the wholeprocedure again.
You should have two outputs that contain the tablesshown in Figure 25.8. For the oblimin rotation the outputyou should look at is the pattern matrix (Table 25.12a). Forthe varimax rotation the output you should look at is therotated component matrix (Table 25.12b). We have includedthe items so you can accurately see the item. In the SPSS out-put you will just have the variable names.
First, we’re going to look at the first table (Table 25.12a),the pattern matrix for the oblimin rotation. Each item loadson a factor. Loadings are the strength of the variable in defin-ing the factor. Loadings on factors can be positive or nega-tive, and when a number happen together this means verylittle to us at this stage. For instance, in the present example,the large majority of the loading on the first factor are posi-tive and the large majority of the loadings on the second fac-tor are negative. However, an item with a negative loading ona factor with a lot of items with a positive loading (or viceversa) would indicate that this variable has an inverse rela-tionship with these other variables on the factor.
Now what we have to determine is what factor whichitem loads on. Opinions are fairly arbitrary about the pointat which an item loads on a factor. However, Child (2006)suggests that anything above 0.44 could be thought of asimportant, with increased value of the loading becomingmore vital in determining what the factor is Kline (1986)suggests that you should not ignore any loading below 0.3.More commonly a high loading (i.e. 0.40 or higher) on one
Figure 25.8 Factor analysis: rotation window.
M25_MALT2908_02_SE_C25.QXD 8/12/09 8:18 PM Page 665

666 PART 3 FURTHER DEBATES AND APPLICATIONS IN INDIVIDUAL DIFFERENCES
factor and also a low loadings (i.e. 0.20 or smaller) on allother factors is another suitable criteria to apply. However,what you need to remember is the higher the loading themore important that item is to that factor.
So if we look at the rotated solution for our data, we cansee that all the items, with the exception of AV1, AV2, AV3,AV4, AV6, AV7, AV14 and AV16 load on the first factor above0.52. The items AV1, AV2, AV3, AV4, AV6, AV7, AV14 andAV16 load on the second factor above 0.56. So, we would sug-gest that we have two factors on which different items load.
But what about the orthogonal rotation? Well this cur-rent analysis, and comparison of the two tables, raises animportant point. From factor analytic techniques you arealways looking for a clear interpretation. What we mean bya clear interpretation is that all variables should load highlyon one factor, and low on all other factors like our example.If you have a number of variables which load on a numberof factors, or variables that load on none of the factors thenthere is something wrong with your extraction techniques.Loading of a number of variables above the criteria of 0.44and 0.3 across different factors might suggest you have notextracted enough factors, while if a number of variables donot load on any factor then you have extracted too many.(However, don’t necessarily concern yourself if one vari-able loads on two factors. This is known as a cross-loadingand may be due to a variable being ambiguous, a bad item(i.e. it should not be there) or genuinely being applicable toboth factors.) Also, if you have an interpretation that isconsistent with theory, or just makes common sense, thenit is useful. However, most of all, you are looking for a clearinterpretation with clear loadings.
If we are looking at Table 25.12b then we can see thatthis is a less clear solution. Items generally load in the sameway, with the majority of items loading on factor 1 and theitems AV1, AV2, AV3, AV4, AV6, AV7, AV14 and AV16 load-ing on factor 2. However, one of the items AV5, AV8 andAV12 loads above 0.3 on both factors. This is a less clear in-terpretation than the previous one where the items are soclearly defined onto one factor (loading highest on one,and low on all other factors). Therefore we would mostlikely proceed with the oblimin solution, noting in thewrite-up that we had done both, and the oblimin rotationhad produced the clearest solution.
We have a final job to do. We need to give our resultssome meaning. The next job is to define these factors. Thereason we used the word ‘define’ is that factor analysis doesnot tell you the nature of the factor, you decide that foryourself. That is, you look at what variables load on a factorand then you give that factor a name. What you call the fac-tor is up to you, it is usually a general term representing thefactor. However, the way in which you define the factor isby looking at the loading on the factor. To do this you haveto return to the items. We have outlined the oblimin rota-tion again in Table 25.13.
(b) Rotated component matrix
Component
1 2
AV1 0.159 0.687AV2 0.216 0.752AV3 0.187 0.704AV4 0.203 0.644AV5 0.651 0.319AV6 0.275 0.603AV7 0.186 0.536AV8 0.564 0.309AV9 0.531 0.219AV10 0.613 0.097AV11 0.716 0.208AV12 0.636 0.314AV13 0.636 0.200AV14 0.320 0.514AV15 0.580 0.231AV16 0.297 0.713AV17 0.690 0.163AV18 0.577 0.215
Extraction method: principal component analysis.Rotation method: varimax with Kaiser normalisation.Rotation converged in three iterations.
Table 25.12 Pattern matrix (a) and rotated componentmatrix (b).
(a) Pattern matrix
Component
1 2
AV1 �0.072 �0.745AV2 �0.029 �0.799AV3 �0.044 �0.753AV4 �0.003 �0.677AV5 0.645 �0.125AV6 0.097 �0.601AV7 0.017 �0.558AV8 0.546 �0.146AV9 0.542 �0.053AV10 0.684 0.121AV11 0.764 0.031AV12 0.630 �0.124AV13 0.672 0.010AV14 0.183 �0.480AV15 0.595 �0.048AV16 0.081 �0.722AV17 0.749 0.074AV18 0.597 �0.031
Extraction method: principal component analysis.Rotation method: oblimin with Kaiser normalisation.Rotation converged in five iterations.
M25_MALT2908_02_SE_C25.QXD 8/12/09 8:18 PM Page 666
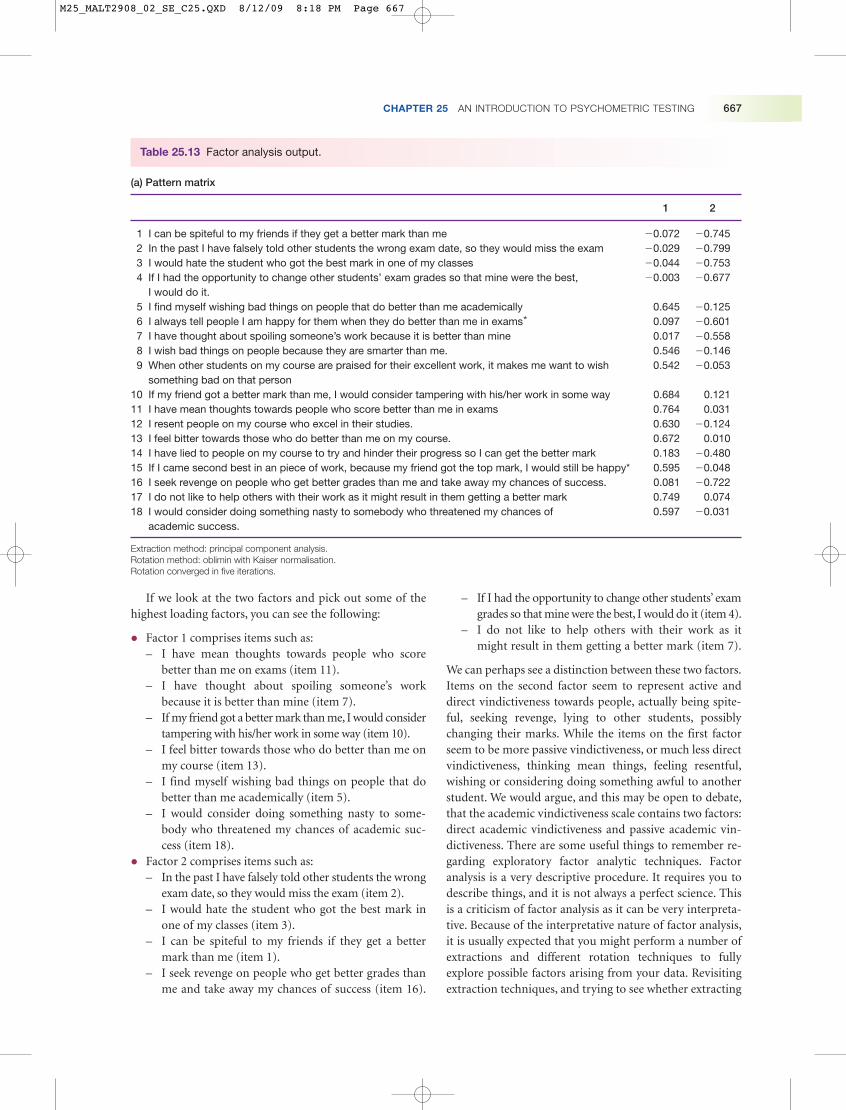
CHAPTER 25 AN INTRODUCTION TO PSYCHOMETRIC TESTING 667
Table 25.13 Factor analysis output.
(a) Pattern matrix
1 2
1 I can be spiteful to my friends if they get a better mark than me �0.072 �0.7452 In the past I have falsely told other students the wrong exam date, so they would miss the exam �0.029 �0.7993 I would hate the student who got the best mark in one of my classes �0.044 �0.7534 If I had the opportunity to change other students’ exam grades so that mine were the best,
I would do it.�0.003 �0.677
5 I find myself wishing bad things on people that do better than me academically 0.645 �0.1256 I always tell people I am happy for them when they do better than me in exams* 0.097 �0.6017 I have thought about spoiling someone’s work because it is better than mine 0.017 �0.5588 I wish bad things on people because they are smarter than me. 0.546 �0.1469 When other students on my course are praised for their excellent work, it makes me want to wish
something bad on that person0.542 �0.053
10 If my friend got a better mark than me, I would consider tampering with his/her work in some way 0.684 0.12111 I have mean thoughts towards people who score better than me in exams 0.764 0.03112 I resent people on my course who excel in their studies. 0.630 �0.12413 I feel bitter towards those who do better than me on my course. 0.672 0.01014 I have lied to people on my course to try and hinder their progress so I can get the better mark 0.183 �0.48015 If I came second best in an piece of work, because my friend got the top mark, I would still be happy* 0.595 �0.04816 I seek revenge on people who get better grades than me and take away my chances of success. 0.081 �0.72217 I do not like to help others with their work as it might result in them getting a better mark 0.749 0.07418 I would consider doing something nasty to somebody who threatened my chances of
academic success.0.597 �0.031
Extraction method: principal component analysis.Rotation method: oblimin with Kaiser normalisation.Rotation converged in five iterations.
If we look at the two factors and pick out some of thehighest loading factors, you can see the following:
� Factor 1 comprises items such as:– I have mean thoughts towards people who score
better than me on exams (item 11).– I have thought about spoiling someone’s work
because it is better than mine (item 7).– If my friend got a better mark than me, I would consider
tampering with his/her work in some way (item 10).– I feel bitter towards those who do better than me on
my course (item 13).– I find myself wishing bad things on people that do
better than me academically (item 5).– I would consider doing something nasty to some-
body who threatened my chances of academic suc-cess (item 18).
� Factor 2 comprises items such as:– In the past I have falsely told other students the wrong
exam date, so they would miss the exam (item 2).– I would hate the student who got the best mark in
one of my classes (item 3).– I can be spiteful to my friends if they get a better
mark than me (item 1).– I seek revenge on people who get better grades than
me and take away my chances of success (item 16).
– If I had the opportunity to change other students’ examgrades so that mine were the best, I would do it (item 4).
– I do not like to help others with their work as itmight result in them getting a better mark (item 7).
We can perhaps see a distinction between these two factors.Items on the second factor seem to represent active anddirect vindictiveness towards people, actually being spite-ful, seeking revenge, lying to other students, possiblychanging their marks. While the items on the first factorseem to be more passive vindictiveness, or much less directvindictiveness, thinking mean things, feeling resentful,wishing or considering doing something awful to anotherstudent. We would argue, and this may be open to debate,that the academic vindictiveness scale contains two factors:direct academic vindictiveness and passive academic vin-dictiveness. There are some useful things to remember re-garding exploratory factor analytic techniques. Factoranalysis is a very descriptive procedure. It requires you todescribe things, and it is not always a perfect science. Thisis a criticism of factor analysis as it can be very interpreta-tive. Because of the interpretative nature of factor analysis,it is usually expected that you might perform a number ofextractions and different rotation techniques to fullyexplore possible factors arising from your data. Revisitingextraction techniques, and trying to see whether extracting
M25_MALT2908_02_SE_C25.QXD 8/12/09 8:18 PM Page 667
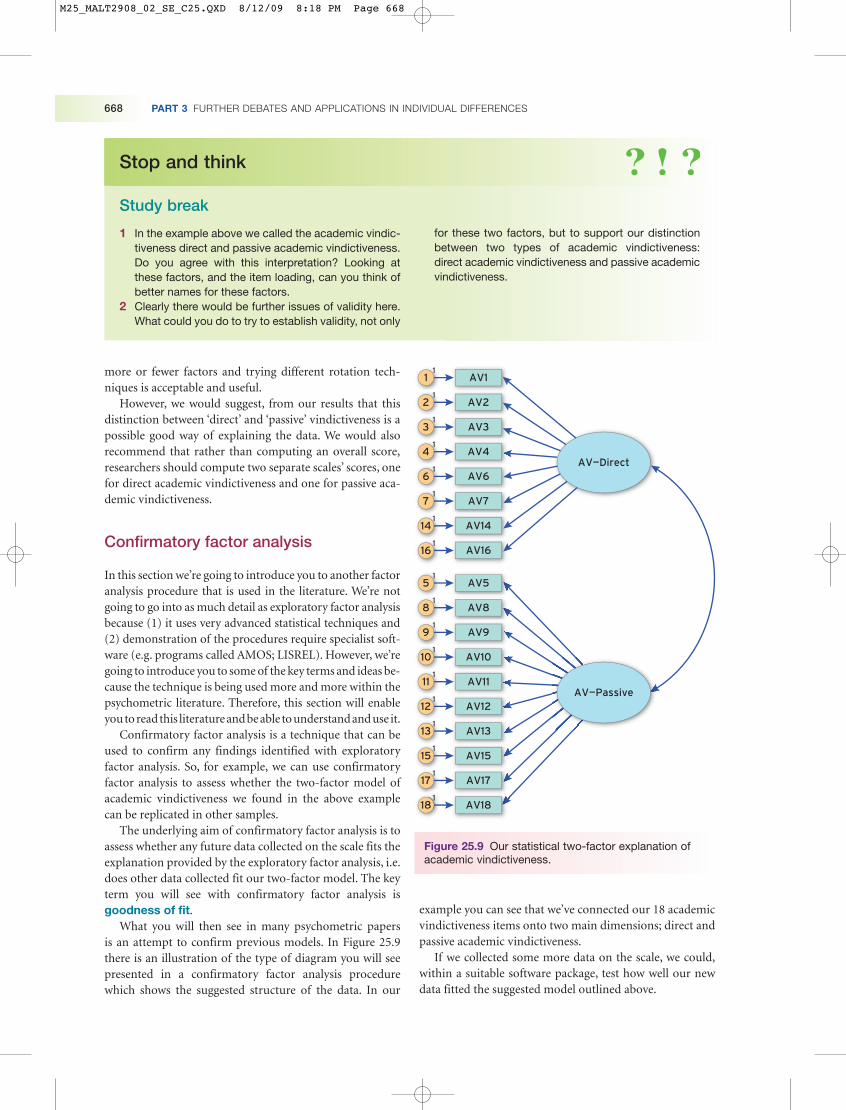
668 PART 3 FURTHER DEBATES AND APPLICATIONS IN INDIVIDUAL DIFFERENCES
more or fewer factors and trying different rotation tech-niques is acceptable and useful.
However, we would suggest, from our results that thisdistinction between ‘direct’ and ‘passive’ vindictiveness is apossible good way of explaining the data. We would alsorecommend that rather than computing an overall score,researchers should compute two separate scales’ scores, onefor direct academic vindictiveness and one for passive aca-demic vindictiveness.
Confirmatory factor analysis
In this section we’re going to introduce you to another factoranalysis procedure that is used in the literature. We’re notgoing to go into as much detail as exploratory factor analysisbecause (1) it uses very advanced statistical techniques and(2) demonstration of the procedures require specialist soft-ware (e.g. programs called AMOS; LISREL). However, we’regoing to introduce you to some of the key terms and ideas be-cause the technique is being used more and more within thepsychometric literature. Therefore, this section will enableyoutoreadthis literatureandbeable tounderstandanduse it.
Confirmatory factor analysis is a technique that can beused to confirm any findings identified with exploratoryfactor analysis. So, for example, we can use confirmatoryfactor analysis to assess whether the two-factor model ofacademic vindictiveness we found in the above examplecan be replicated in other samples.
The underlying aim of confirmatory factor analysis is toassess whether any future data collected on the scale fits theexplanation provided by the exploratory factor analysis, i.e.does other data collected fit our two-factor model. The keyterm you will see with confirmatory factor analysis isgoodness of fit.
What you will then see in many psychometric papersis an attempt to confirm previous models. In Figure 25.9there is an illustration of the type of diagram you will seepresented in a confirmatory factor analysis procedurewhich shows the suggested structure of the data. In our
example you can see that we’ve connected our 18 academicvindictiveness items onto two main dimensions; direct andpassive academic vindictiveness.
If we collected some more data on the scale, we could,within a suitable software package, test how well our newdata fitted the suggested model outlined above.
Stop and think
Study break
1 In the example above we called the academic vindic-tiveness direct and passive academic vindictiveness.Do you agree with this interpretation? Looking atthese factors, and the item loading, can you think ofbetter names for these factors.
2 Clearly there would be further issues of validity here.What could you do to try to establish validity, not only
for these two factors, but to support our distinctionbetween two types of academic vindictiveness:direct academic vindictiveness and passive academicvindictiveness.
AV—Direct
AV2
AV111
21
31
41
61
71
141
161
AV3
AV4
AV16
AV6
AV7
AV14
51
81
91
101
111
121
131
151
171
1881
AV5
AV8
AV9
AV10
AV11
AV12
AV13
AV15
AV17
AV18
AV—Passive
Figure 25.9 Our statistical two-factor explanation ofacademic vindictiveness.
M25_MALT2908_02_SE_C25.QXD 8/12/09 8:18 PM Page 668

CHAPTER 25 AN INTRODUCTION TO PSYCHOMETRIC TESTING 669
We assess the goodness of fit of the data by the use of thegoodness of fit statistics. As with any statistical procedure,there are several of these statistics, and what you will find isthat authors report a number of these statistics to provide anoverall assessment of the goodness of fit. The statistics youwill usually see are as follows, and we have provided somesuggested criteria by which goodness of fit is assessed.
� chi-square (�2)� the goodness of fit index (GFI)� normed fit index (NFI)� comparative fit index (CFI)� adjusted goodness of fit (AGFI)� index root-mean-square residual (SRMR)� the root-mean square error of approximation (RMSEA).
These figures produced by the analysis vary. The chi-square statistic usually provides quite a large number, i.e.around 1000. Analysis for GFI, AGFI, NFI and CFI typicallyrange from 0.00 to 1.00 with higher figures (i.e. those nearerto 1) indicating a better fit. The SRMR and RMSEA producefigures that centre around a low figure, e.g. working towards0.01, with lower figures indicating better fit. As the chi-squared test is highly sensitive to sample size, it is usually justreported.Authors such as Hu and Bentler (1999) suggest thata good model fit is individually indicated with approximatevalues of GFI, NFI and CFI above 0.95, and AGFI should alsobe at least 0.90, SRMR below 0.08, RMSEA below 0.06,should be conventional values for accepting good models.
We subjected some new data we had collected among300 adults to confirmatory factor analysis. We computedthe following goodness of fit from the data:
� chi-square, �2 � 931.4� the goodness of fit index (GFI) � 0.957� normed fit index (NFI) � 0.950� comparative fit index (CFI) � 0.988� adjusted goodness of fit (AGFI) � 0.952� index root-mean-square residual (SRMR) � 0.038� the root-mean square error of approximation (RMSEA) �
0.013.
Using our criteria we can see that all our values exceed (interms of the GFI, NFI, CFI and AGFI) and fall below(SRMR and RMSEA) the criteria, and, therefore, ourcurrent two-factor model presents a good explanation ofthe data.
One final use of confirmatory factor analysis is that it isvery useful for comparing different explanations for data. So,for example, if there were two competing explanations forhow a scale should be structured, then you could performconfirmatory factor analysis on both interpretations to seewhich presented the best fit. For example, with our academicvindictiveness scale, we could suggest an alternative idea, thatgiven our earlier findings with the internal reliability analysis,the academic vindictiveness comprised one not two factors.
So, for example, our alternative model would look likeFigure 25.10.
We ran a confirmatory analysis on this model and foundthe following statistics:
� chi-square, �2 � 826.2� the goodness of fit index (GFI) � 0.917� normed fit index (NFI) � 0.910� comparative fit index (CFI) � 0.928� adjusted goodness of fit (AGFI) � 0.882� index root-mean-square residual (SRMR) � 0.142� the root-mean square error of approximation (RMSEA) �
0.011.
These fit statistics for our data and model are quite good, infact, you may see that many researchers would suggest, thatthough not a good fit, it is certainly reasonable. Nonetheless,the statistics aren’t as good as for the statistics for a two-factormodel, and therefore we would suggest that there is evidencethat our academic vindictiveness scale comprises two factors.You will often see this technique in psychometric papers, withauthors comparing different models using these statistics asa basis of comparison, based on either previous findings or
1
AV2
AV111
21
31
41
51
61
71
81
91
101
111
121
131
141
151
161
171
181
AV3
AV4
AV8
AV5
AV6
AV9
AV10
AV11
AV12
AV13
AV14
AV15
AV16
AV7
AV17
AV18
ACV
Figure 25.10 Our statistical one-factor explanation of academic vindictiveness.
M25_MALT2908_02_SE_C25.QXD 8/12/09 8:18 PM Page 669
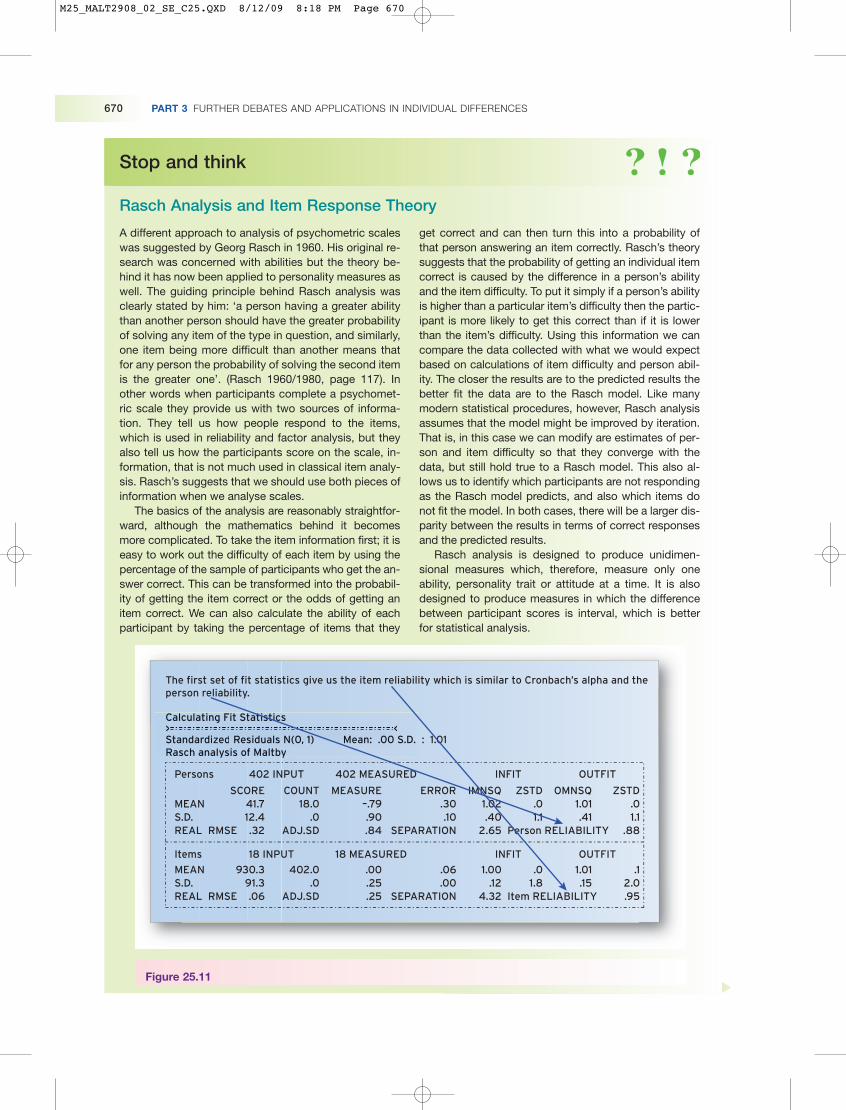
670 PART 3 FURTHER DEBATES AND APPLICATIONS IN INDIVIDUAL DIFFERENCES
Stop and think
Rasch Analysis and Item Response Theory
A different approach to analysis of psychometric scaleswas suggested by Georg Rasch in 1960. His original re-search was concerned with abilities but the theory be-hind it has now been applied to personality measures aswell. The guiding principle behind Rasch analysis wasclearly stated by him: ‘a person having a greater abilitythan another person should have the greater probabilityof solving any item of the type in question, and similarly,one item being more difficult than another means thatfor any person the probability of solving the second itemis the greater one’. (Rasch 1960/1980, page 117). Inother words when participants complete a psychomet-ric scale they provide us with two sources of informa-tion. They tell us how people respond to the items,which is used in reliability and factor analysis, but theyalso tell us how the participants score on the scale, in-formation, that is not much used in classical item analy-sis. Rasch’s suggests that we should use both pieces ofinformation when we analyse scales.
The basics of the analysis are reasonably straightfor-ward, although the mathematics behind it becomesmore complicated. To take the item information first; it iseasy to work out the difficulty of each item by using thepercentage of the sample of participants who get the an-swer correct. This can be transformed into the probabil-ity of getting the item correct or the odds of getting anitem correct. We can also calculate the ability of eachparticipant by taking the percentage of items that they
get correct and can then turn this into a probability ofthat person answering an item correctly. Rasch’s theorysuggests that the probability of getting an individual itemcorrect is caused by the difference in a person’s abilityand the item difficulty. To put it simply if a person’s abilityis higher than a particular item’s difficulty then the partic-ipant is more likely to get this correct than if it is lowerthan the item’s difficulty. Using this information we cancompare the data collected with what we would expectbased on calculations of item difficulty and person abil-ity. The closer the results are to the predicted results thebetter fit the data are to the Rasch model. Like manymodern statistical procedures, however, Rasch analysisassumes that the model might be improved by iteration.That is, in this case we can modify are estimates of per-son and item difficulty so that they converge with thedata, but still hold true to a Rasch model. This also al-lows us to identify which participants are not respondingas the Rasch model predicts, and also which items donot fit the model. In both cases, there will be a larger dis-parity between the results in terms of correct responsesand the predicted results.
Rasch analysis is designed to produce unidimen-sional measures which, therefore, measure only oneability, personality trait or attitude at a time. It is alsodesigned to produce measures in which the differencebetween participant scores is interval, which is betterfor statistical analysis.
The first set of fit statistics give us the item reliability which is similar to Cronbach’s alpha and theperson reliability.
Calculating Fit Statistics> <Standardized Residuals N(0, 1) Mean: .00 S.D. : 1.01Rasch analysis of Maltby
Persons 402 INPUT 402 MEASURED INFIT OUTFIT
SCORE COUNT MEASURE ERROR IMNSQ ZSTD OMNSQ ZSTDMEAN 41.7 18.0 –.79 .30 1.02 .0 1.01 .0S.D. 12.4 .0 .90 .10 .40 1.1 .41 1.1REAL RMSE .32 ADJ.SD .84 SEPARATION 2.65 Person RELIABILITY .88
Items 18 INPUT 18 MEASURED INFIT OUTFIT
MEAN 930.3 402.0 .00 .06 1.00 .0 1.01 .1S.D. 91.3 .0 .25 .00 .12 1.8 .15 2.0REAL RMSE .06 ADJ.SD .25 SEPARATION 4.32 Item RELIABILITY .95
C l l ti Fit St ti ti
Raschh analysis of Maltby
Calcuulating Fit Statistics> <Standadardirdizedzed Re Residsidualuals N(0, 1) Mean: .00 S.D. Raschh analysis of Maltby
Figure 25.11
M25_MALT2908_02_SE_C25.QXD 8/12/09 8:18 PM Page 670
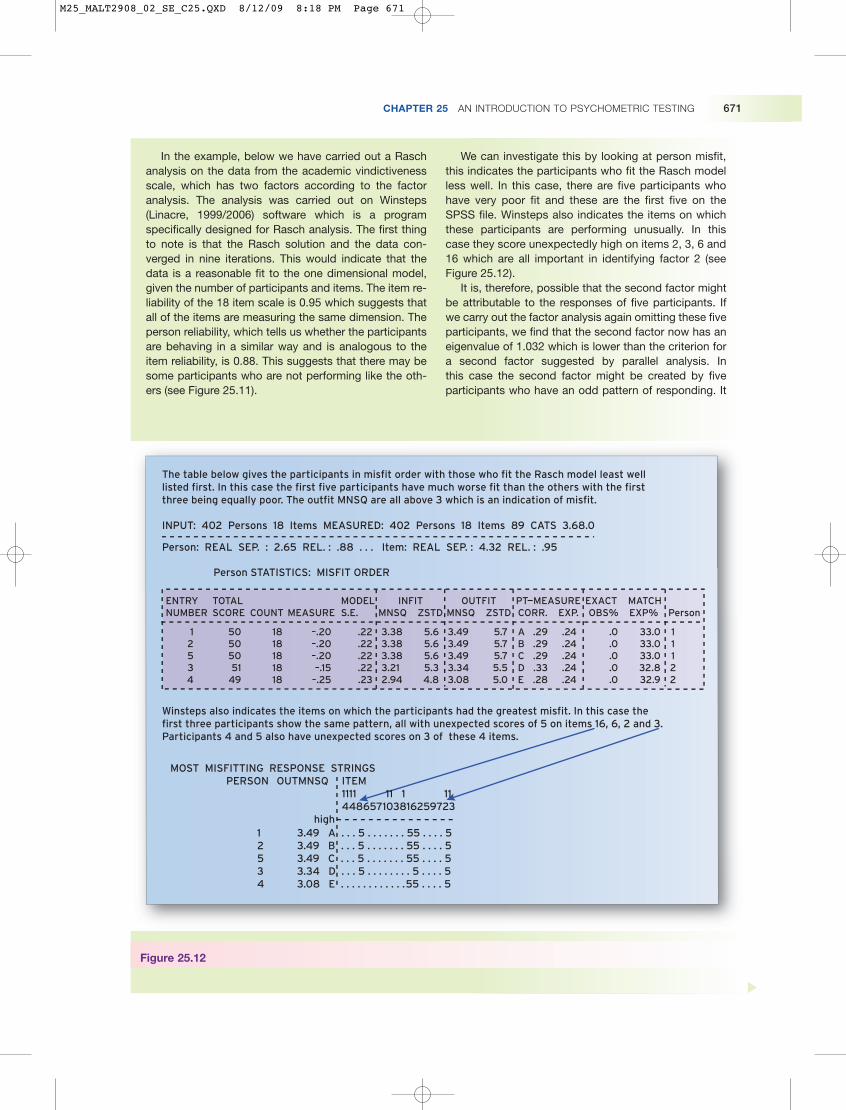
CHAPTER 25 AN INTRODUCTION TO PSYCHOMETRIC TESTING 671
In the example, below we have carried out a Raschanalysis on the data from the academic vindictivenessscale, which has two factors according to the factoranalysis. The analysis was carried out on Winsteps(Linacre, 1999/2006) software which is a programspecifically designed for Rasch analysis. The first thingto note is that the Rasch solution and the data con-verged in nine iterations. This would indicate that thedata is a reasonable fit to the one dimensional model,given the number of participants and items. The item re-liability of the 18 item scale is 0.95 which suggests thatall of the items are measuring the same dimension. Theperson reliability, which tells us whether the participantsare behaving in a similar way and is analogous to theitem reliability, is 0.88. This suggests that there may besome participants who are not performing like the oth-ers (see Figure 25.11).
We can investigate this by looking at person misfit,this indicates the participants who fit the Rasch modelless well. In this case, there are five participants whohave very poor fit and these are the first five on theSPSS file. Winsteps also indicates the items on whichthese participants are performing unusually. In thiscase they score unexpectedly high on items 2, 3, 6 and16 which are all important in identifying factor 2 (seeFigure 25.12).
It is, therefore, possible that the second factor mightbe attributable to the responses of five participants. Ifwe carry out the factor analysis again omitting these fiveparticipants, we find that the second factor now has aneigenvalue of 1.032 which is lower than the criterion fora second factor suggested by parallel analysis. Inthis case the second factor might be created by fiveparticipants who have an odd pattern of responding. It
The table below gives the participants in misfit order with those who fit the Rasch model least welllisted first. In this case the first five participants have much worse fit than the others with the firstthree being equally poor. The outfit MNSQ are all above 3 which is an indication of misfit.
INPUT: 402 Persons 18 Items MEASURED: 402 Persons 18 Items 89 CATS 3.68.0
Person: REAL SEP. : 2.65 REL. : .88 . . . Item: REAL SEP. : 4.32 REL. : .95
Person STATISTICS: MISFIT ORDER
ENTRYNUMBER
TOTALSCORE COUNT MEASURE
MODELS.E.
INFITMNSQ ZSTD
OUTFITMNSQ ZSTD
PT—MEASURECORR. EXP.
EXACT MATCHOBS% EXP% Person
1 50 18 –.20 .22 3.38 5.6 3.49 5.7 A .29 .24 .0 33.0 1 2 50 18 –.20 .22 3.38 5.6 3.49 5.7 B .29 .24 .0 33.0 1 5 50 18 –.20 .22 3.38 5.6 3.49 5.7 C .29 .24 .0 33.0 1 3 51 18 –.15 .22 3.21 5.3 3.34 5.5 D .33 .24 .0 32.8 2 4 49 18 –.25 .23 2.94 4.8 3.08 5.0 E .28 .24 .0 32.9 2
Winsteps also indicates the items on which the participants had the greatest misfit. In this case thefirst three participants show the same pattern, all with unexpected scores of 5 on items 16, 6, 2 and 3.Participants 4 and 5 also have unexpected scores on 3 of these 4 items.
MOST MISFITTING RESPONSE STRINGS PERSON OUTMNSQ ITEM 1111 11 1 11 448657103816259723 high
1 3.49 A . . . 5 . . . . . . . 55 . . . . 52 3.49 B . . . 5 . . . . . . . 55 . . . . 55 3.49 C . . . 5 . . . . . . . 55 . . . . 53 3.34 D . . . 5 . . . . . . . . 5 . . . . 54 3.08 E . . . . . . . . . . . .55 . . . . 5
Figure 25.12
M25_MALT2908_02_SE_C25.QXD 8/12/09 8:18 PM Page 671
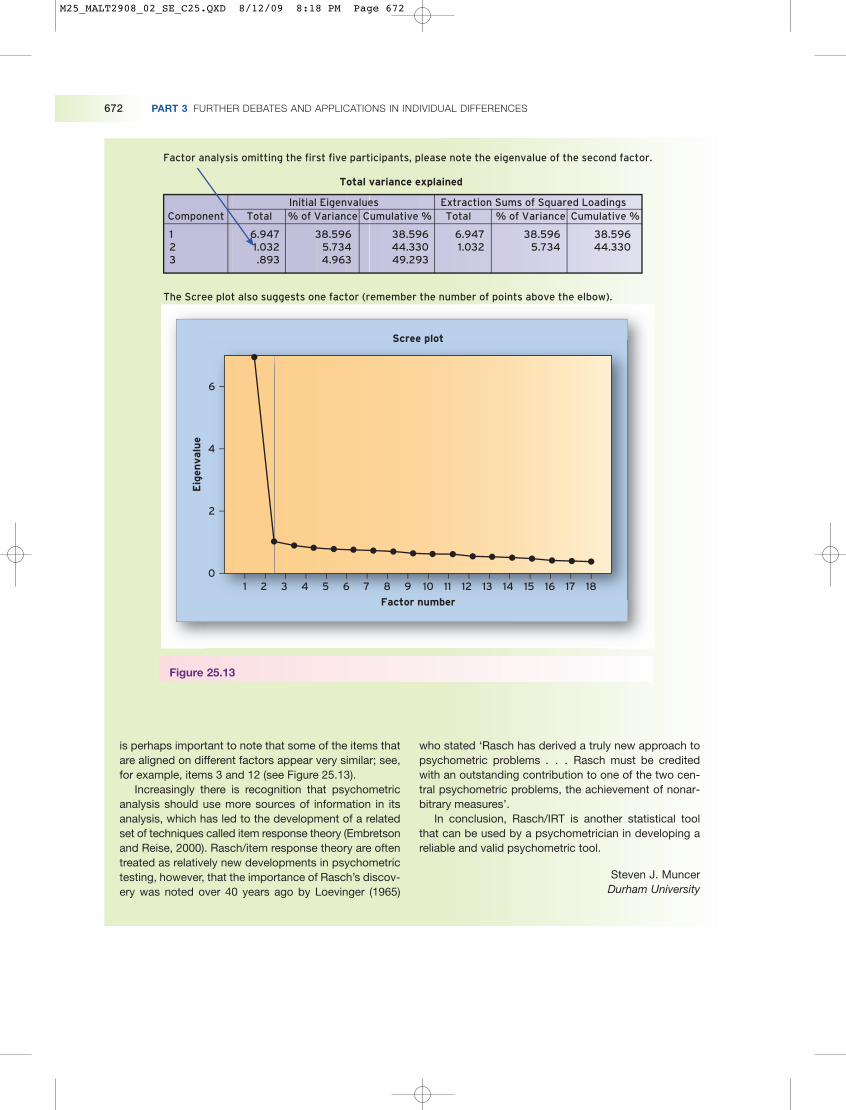
672 PART 3 FURTHER DEBATES AND APPLICATIONS IN INDIVIDUAL DIFFERENCES
is perhaps important to note that some of the items thatare aligned on different factors appear very similar; see,for example, items 3 and 12 (see Figure 25.13).
Increasingly there is recognition that psychometricanalysis should use more sources of information in itsanalysis, which has led to the development of a relatedset of techniques called item response theory (Embretsonand Reise, 2000). Rasch/item response theory are oftentreated as relatively new developments in psychometrictesting, however, that the importance of Rasch’s discov-ery was noted over 40 years ago by Loevinger (1965)
who stated ‘Rasch has derived a truly new approach topsychometric problems . . . Rasch must be creditedwith an outstanding contribution to one of the two cen-tral psychometric problems, the achievement of nonar-bitrary measures’.
In conclusion, Rasch/IRT is another statistical toolthat can be used by a psychometrician in developing areliable and valid psychometric tool.
Steven J. MuncerDurham University
Initial EigenvaluesComponent Total Total% of Variance Cumulative % % of Variance Cumulative %
1 6.947 38.596 38.596 6.947 38.596 38.5962 1.032 5.734 44.330 1.032 5.734 44.3303 .893 4.963 49.293
Extraction Sums of Squared Loadings
Total variance explained
Factor analysis omitting the first five participants, please note the eigenvalue of the second factor.
The Scree plot also suggests one factor (remember the number of points above the elbow).
181716151413121110987654321
Factor number
6
4
2
0
Eig
envalu
e
Scree plot
Figure 25.13
M25_MALT2908_02_SE_C25.QXD 8/12/09 8:18 PM Page 672
on theoretical perspectives, to find out which models repre-sent the best explanation of the data.
There is a lot more to confirmatory factor analysis butwhat we’ve outlined above has given you a brief introduc-tion and provided you with enough information to readsome of the psychometric literature.
The International PersonalityItem Pool and the HigherEducation Academy inPsychology practicals webpage
One final point about psychometric tests is that in manyinstances there is already a measure available to use.We’ve already mentioned the International PersonalityItem Pool that contains main personality and individualdifference measures (http://ipip.ori.org/ipip/). Thereare other test bases online, but a recent one to appear is atthe Higher Education Academy in Psychology practicalswebpage (http://www.psychologypracticals.com/). Thisis a searchable library of over 1,500 psychometric teststhat are in the public domain. Therefore there is no need
to develop new psychometric tests automatically, as thereare already many available and these sites are worthchecking out.
Final comments
As you can see, psychometric tests are useful in a numberof areas of psychology. The main thing to remember aboutpsychometric tests is that it is always important for themshow acceptable levels of reliability and validity. Clearly, ifyou are making decisions about people’s education, theirlivelihood, their treatment for a condition or their illness,you need to be quite confident of your diagnosis.
In this chapter we have introduced you to the main con-cepts of item writing, reliability, validity, exploratory factoranalysis, confirmatory factor analysis and types and usesof psychometric tests. Therefore, you should now under-stand some of the ideas and criteria surrounding psycho-metric testing, know what is meant by reliability inpsychometric testing, be able to explain what is meant byvalidity in psychometric testing, see how factor analysis isused in psychometric testing and the types and uses fordifferent psychometric tests.
CHAPTER 25 AN INTRODUCTION TO PSYCHOMETRIC TESTING 673
Summary
� The main types of tests you will come across in thepersonality, intelligence and individual differences lit-erature are measures of personality, ability, motiva-tion and attitude. Also psychometric tests are used inclinical settings and great care must be taken withtheir use in assessing people.
� The key to a good psychometric test is writing verygood questions. These include making sure theitems are clear, not leading, are not embarrassing,don’t pose hypothetical questions and include re-verse wording items.
� The format of the response scale and instructions arealso key to a good psychometric test.
� In psychometric testing, there are two forms of reliability:internal reliability and reliability over time (test–retestreliability). Internal reliability (or consistency) refers towhether all the aspects of the psychometric testare measuring the same thing. Test–retest reliabilityassesses reliability over time.
� Validity is concerned with whether a test is measur-ing what we claim it is measuring. Convergentvalidity is assessed by the extent to which it showsassociations with measures that it should be relatedto. Concurrent validity is when a test shows accept-able correlations with known and accepted standard
measures of that construct. Discriminate validity iswhen the test is not related to things that it shouldn’tbe related to. Face validity is concerned with whetherthe measure measures what it claims to measure.Predictive validity assesses whether a measure canaccurately predict something in the future.
� Getting other people to rate the individual on theitems of the questionnaire is a good way of poten-tially assessing the validity of the questionnaire be-cause, ideally, the ratings given by the participantsand the other person should be similar.
� Factor analysis is a multivariate (multiple variables)‘data reduction’ statistical technique that allows us tosimplify the correlational relationships between anumber of variables. There are two forms of factoranalysis, exploratory factor analysis and confirma-tory factor analysis.
� There are two procedures in exploratory factor analy-sis; (1) the Extraction of factors which determineshow many factors underlie our data and (2) Rotationof factors to determine which items/variables load oneach of the extracted factors.
� Confirmatory factor analysis is a technique that canbe used to confirm any findings with exploratory fac-tor analysis.
M25_MALT2908_02_SE_C25.QXD 8/12/09 8:18 PM Page 673
674 PART 3 FURTHER DEBATES AND APPLICATIONS IN INDIVIDUAL DIFFERENCES
Connecting up
In this chapter we talked about factor analysis. This tech-nique was used extensively in determining the trait approachof personality, such as the five-factor model (see Chapter 7)and crucial in the debate about the nature of intelligence andwhether it forms a single factor or not (see Chapter 11). Also
throughout the book we discussed different psychometricmeasures of the constructs we are outlining. In almost allcases many of these measures have established reliability andvalidity.
Critical thinking
Discussion questions
You might want to try the following two exercises toexplore some of the issues that surround psychologicaltesting.
� Researchers in America, such as Professor M. Groening,have developed a new measure of personality, theHomer Simpson Personality Questionnaire. Respondentsare presented with five items and asked to indicate theextent to which they disagree or agree with each state-ment on a five-point scale (1 � Disagree strongly, 5 �Agree strongly). Here are the five items of the HomerSimpson Personality Questionnaire:1 ‘It takes two to lie. One to lie and one to listen.’2 ‘Weaselling out of things is important to learn. It’s
what separates us from the animals . . . except theweasel.’
3 ‘If something is too hard, give up. The moral is tonever try anything.’
4 ‘Hmmmm. Donuts. . . . What can’t they do?’5 ‘Just because I don’t care doesn’t mean I don’t
understand.’Consider, does this scale have good face validity? Whatstudies could Professor Groening complete to establishor examine the scale’s concurrent, discriminate, predic-tive and construct validity?
� In 2004 and 2005, BBC News reported a number ofstories that centred on people’s pessimism with theworld. In June 2004, a survey by an internationalpolling agency, GlobeScan, suggested Nigerians andZimbabweans were feeling especially pessimistic abouttheir own countries. In Zimbabwe, just 3 per cent ofthose asked thought life was getting better. In Nigeria, 75 per cent of people asked thought thatthe country was heading in the wrong direction, with66 per cent thinking it was more corrupt than a yearago. In December 2004, Romania’s presidential and
parliamentary elections on Sunday evoked a mood ofpessimism in some of the country’s newspapers. InJanuary 2005, there was reported pessimism in Franceabout public sector strikes. In Spain it was pessimismon peace in the Basque country. Also in January 2005,those in the Arab world were thought to have a senseof foreboding as the elections in Iraq fast approached.Throughout 2008 and 2009, Western economic sys-tems are in crisis, with values of shares in stock mar-kets falling, unemployment rising, industries andcompanies losing money, and most people being ef-fected in some way by the ‘credit crunch’. Given such aprevailing pessimism throughout the world’s differentcontinents, we are proposing the World PessimismTrait Scale that measures individual’s pessimism aboutthe world. The scale contains five items and asks theextent to which respondents disagree or agree with thestatement on a 5-point scale (1 � Disagree strongly,5 � Agree strongly). Here are the five items of the WorldPessimism Scale:
– I often think that things in the world are never goingto get better.
– I am often of the opinion that the human race isdestined towards its own destruction.
– I am certain that, year after year, the world willbecome a harder place for everyone to live in.
– I often wonder what is so wrong with the world thesedays.
– The world has so many problems that cannot besolved.
Consider, does this scale have good face validity? Whatstudies could the researchers do to establish the scale’svalidity?
� Imagine a health construct you might want to measure.How might you measure this construct? How could youestablish reliability and validity (particularly validity) forthis construct?
M25_MALT2908_02_SE_C25.QXD 8/12/09 8:18 PM Page 674
Now imagine a questionnaire isn’t suitable to meas-ure this construct and that you have to choose two othermethods, an interview and an experimental measure.– How could you establish reliability and validity of
the interview measure?– How could you establish reliability and validity of
the experimental measure?Now, think about rival ways of measuring the same
variable that uses different methods. What are the
advantages and disadvantages or each measure, partic-ularly in terms of reliability and validity?
Essay questions� Discuss how a researcher establishes confidence in the
use of a psychometric test.� Outline the main types of reliability and validity.
CHAPTER 25 AN INTRODUCTION TO PSYCHOMETRIC TESTING 675
Going further
Books
Paul Kline has written a series of readable books aboutpsychometrics. The most recent is Kline, P. (2000).Psychometrics Primer. Free Association Books. However,other good books on psychological testing include:Gregory, R.J. (2007), Psychological Testing: History,Principles and Applications (5th edn), Harlow: PearsonEducation; Anastasi, A. (1988), Psychological Testing NewYork: MacMillan Publishing Company; and Rust, J. andGolombok, S. (2009), Modern Psychometric: The Science ofPsychological Assessment (3rd edn), London: Routledge.
Within the psychometric literature you will also seereferences to two other techniques used in psychometrictesting; Rasch Model and Item Response Theory (see Stopand think box on page 000). Item Response Theory is amodern framework for psychometric test construction inwhich the investigator argues there is a single underlyingconstruct under which all the items reply and eachrespondent is assumed to have a certain amount of theconstruct being measured. Rasch Model is a mathematicalframework which uses equations to predict the probabilityof respondents at different levels of skill answering testquestions correctly. Like confirmatory factor analysis both
these techniques (1) use very advanced statistical techniquesand (2) require specialist software to demonstrate theseprocedures. However, two good books that cover thesetopics are Wilson, M. (2005), Constructing Measures; AnItem Response Modeling Approach, New Jersey: LawrenceErlbaum Associates; and Bond, T.G. and Fox, C.M. (2007),Applying the Rasch Model: Fundamental Measurement inthe Human Sciences (2nd edn), New Jersey: LawrenceErlbaum Associates.
Web links
A good library of psychological tests for public domain useare available at the International Personality Item Pool site(http://ipip.ori.org/ipip/) and a searchable database is atthe Higher Education Academy in Psychology practicalswebpage (http://www.psychologypracticals.com/).
If you want to learn more about confirmatory factoranalysis you need a copy of the computer programs AMOS/LISREL. Your department may have these, but they areadvanced statistics programs. However, there are some goodonline guides, for example at http://www.indiana.edu/~statmath/stat/all/cfa/index.html.
Film and literature
There are not many films that are clearly illustrative andaccurately portray psychometric testing. However, The Recruit(2003, directed by Roger Donaldson) a gives a fictionalinsider’s view into the CIA Agency: how trainees are
recruited, how they are prepared for the spy game, andwhat they learn to survive. The film Spy Game (2001,directed by Tony Scott) is in a similar vein.
Explore the website accompanying this text at www.pearsoned.co.uk/maltby for further resources to help you with your studies. These include multiple-choice questions, essay questions, weblinks and ideas for ad-vanced reading.
M25_MALT2908_02_SE_C25.QXD 8/12/09 8:18 PM Page 675
Don’t forget the following additional material can be found on the Website (www.pearsoned.co.uk/maltby)
26 Academic Argument and Thinking 000Key themes 000Learning outcomes 000Introduction 000The structure of arguments: premises and conclusions 000
Deductive versus inductive arguments 000Fallacies in arguments 000
Fallacies of the undistributed middle 000The fallacies of affirming the consequent 000Argument directed at the person (argumentum ad hominem, ‘argument directed at the man’) 000Appealing to ignorance or absence of fact (argumentum ad ignorantiam, ‘argument from ignorance’) 000Appeal to emotion (argumentum ad misericordiam, ‘argument from pity’) 000False dilemma 000Comparing populations 000
Summary 000Connecting up 000Critical thinking 000Going further 000
27 Statistical Terms 000Key themes 000Learning outcomes 000Introduction 000Tests of association 000
Correlation coefficients 000Factor analysis 000Multiple regression 000
Tests of difference 000Tests of difference for two sets of scores 000Tests of difference for more than two sets of scores 000
Meta-analysis 000Effect size 000Summary 000Going further 000
28 Research Ethics 000Key themes 000Learning outcomes 000Introduction 000What do we mean by research ethics? 000
Why do we need ethical codes? 000Basic principles for ethical research 000Research studies have to comply with all legal requirements 000Research participants 000
NHS and social services/social care research 000Ethical principles for conducting research with human participants
(The British Psychological Society) 000Summary 000Going further 000
M25_MALT2908_02_SE_C25.QXD 8/12/09 8:18 PM Page 676

M25_MALT2908_02_SE_C25.QXD 8/12/09 8:18 PM Page 677