Embed Size (px)
Citation preview
M&A in Latin AmericaAmericas regionAmericas Financial Advisory4th Edition - August 2016
© 2016. For information, contact Deloitte Touche Tohmatsu Limited.
Contents
Executive summary 3
2016 M&A snapshot 4
Top deals in 2015-2016 5
Macroeconomic indicators 6
Geographical M&A activity 7-14
M&A activity across industries 15-21
Perspectives 22-23
Leadership contacts 24-26
AppendixSourcesPresentation notes
272829 2
© 2016. For information, contact Deloitte Touche Tohmatsu Limited.
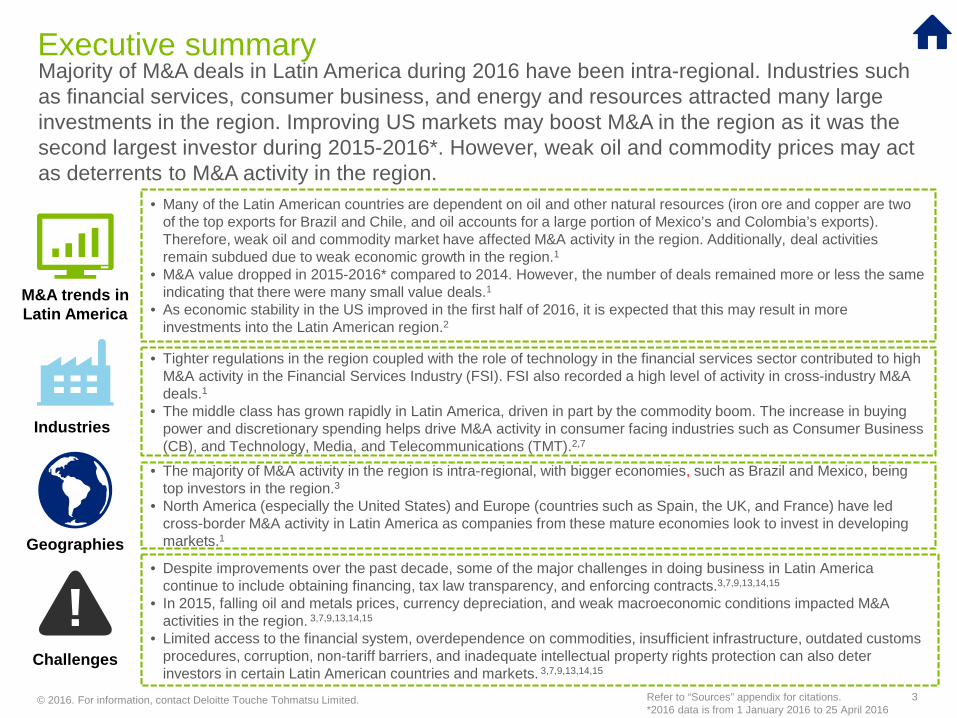
Executive summaryMajority of M&A deals in Latin America during 2016 have been intra-regional. Industries such as financial services, consumer business, and energy and resources attracted many large investments in the region. Improving US markets may boost M&A in the region as it was the second largest investor during 2015-2016*. However, weak oil and commodity prices may act as deterrents to M&A activity in the region.
3
• Many of the Latin American countries are dependent on oil and other natural resources (iron ore and copper are two of the top exports for Brazil and Chile, and oil accounts for a large portion of Mexico’s and Colombia’s exports). Therefore, weak oil and commodity market have affected M&A activity in the region. Additionally, deal activities remain subdued due to weak economic growth in the region.1
• M&A value dropped in 2015-2016* compared to 2014. However, the number of deals remained more or less the same indicating that there were many small value deals.1
• As economic stability in the US improved in the first half of 2016, it is expected that this may result in more investments into the Latin American region.2
• Tighter regulations in the region coupled with the role of technology in the financial services sector contributed to high M&A activity in the Financial Services Industry (FSI). FSI also recorded a high level of activity in cross-industry M&A deals.1
• The middle class has grown rapidly in Latin America, driven in part by the commodity boom. The increase in buying power and discretionary spending helps drive M&A activity in consumer facing industries such as Consumer Business (CB), and Technology, Media, and Telecommunications (TMT).2,7
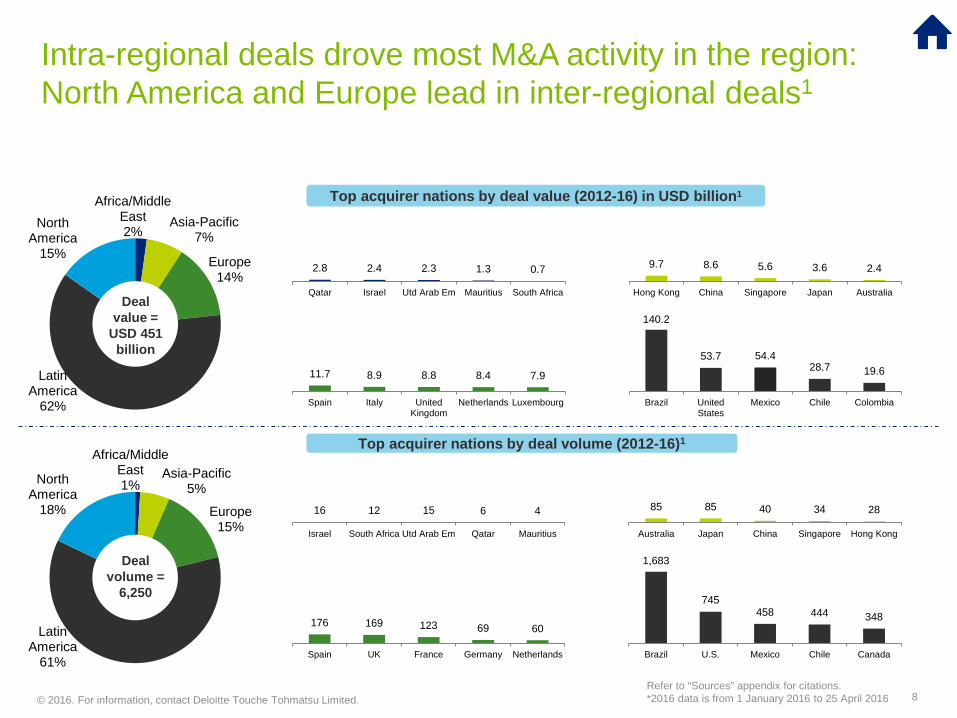
• The majority of M&A activity in the region is intra-regional, with bigger economies, such as Brazil and Mexico, being top investors in the region.3
• North America (especially the United States) and Europe (countries such as Spain, the UK, and France) have led cross-border M&A activity in Latin America as companies from these mature economies look to invest in developing markets.1
• Despite improvements over the past decade, some of the major challenges in doing business in Latin America continue to include obtaining financing, tax law transparency, and enforcing contracts.3,7,9,13,14,15
• In 2015, falling oil and metals prices, currency depreciation, and weak macroeconomic conditions impacted M&A activities in the region. 3,7,9,13,14,15
• Limited access to the financial system, overdependence on commodities, insufficient infrastructure, outdated customs procedures, corruption, non-tariff barriers, and inadequate intellectual property rights protection can also deter investors in certain Latin American countries and markets. 3,7,9,13,14,15
M&A trends in Latin America
Industries
Challenges
Geographies
Refer to “Sources” appendix for citations.*2016 data is from 1 January 2016 to 25 April 2016
© 2016. For information, contact Deloitte Touche Tohmatsu Limited. 4
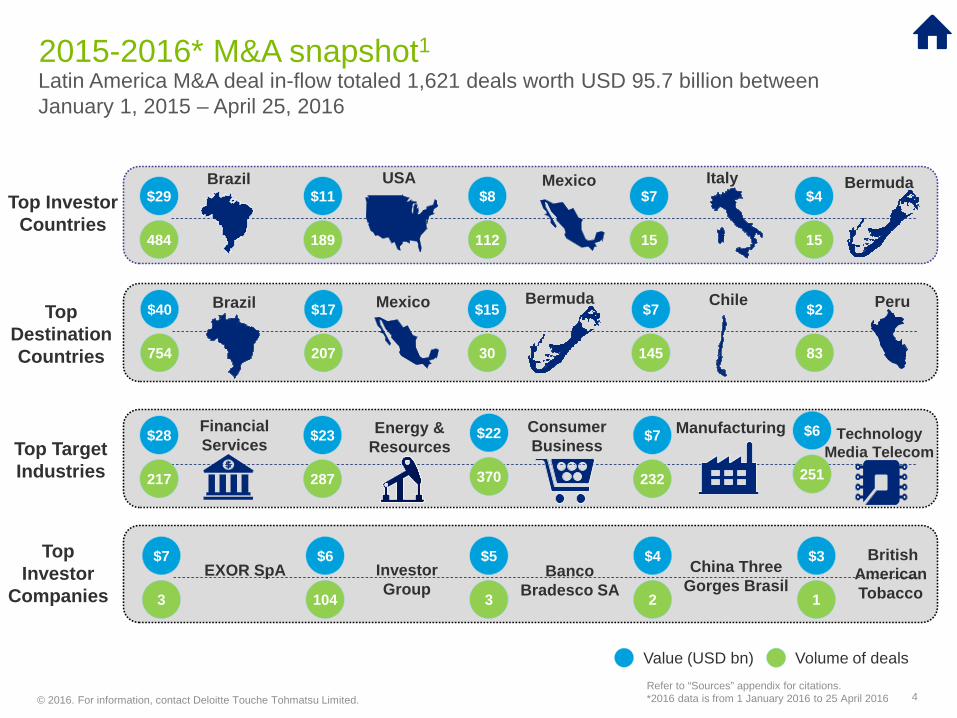
Top Target Industries
Energy & Resources
Financial Services
Manufacturing$28
217
$23
287
$7
232
Top DestinationCountries
Brazil Bermuda$40
754
$17
207
$15
30
$7
145
$2
83
Top InvestorCountries
$29
484
$11
189
$8
112
$4
15
USA
Value (USD bn) Volume of deals
Top Investor
Companies
$7
3
$6
104
$5
3
$4
2
$3
1
Chile
Technology Media Telecom
$6
251
Consumer Business
$22
370
EXOR SpA Investor Group
Banco Bradesco SA
China ThreeGorges Brasil
British American Tobacco
Brazil Mexico Bermuda
Mexico Peru
Italy$7
15
2015-2016* M&A snapshot1Latin America M&A deal in-flow totaled 1,621 deals worth USD 95.7 billion between January 1, 2015 – April 25, 2016
Refer to “Sources” appendix for citations.*2016 data is from 1 January 2016 to 25 April 2016
© 2016. For information, contact Deloitte Touche Tohmatsu Limited.
Target Target industry Acquirer Acquirer industry
Value of transaction
(in USD million)
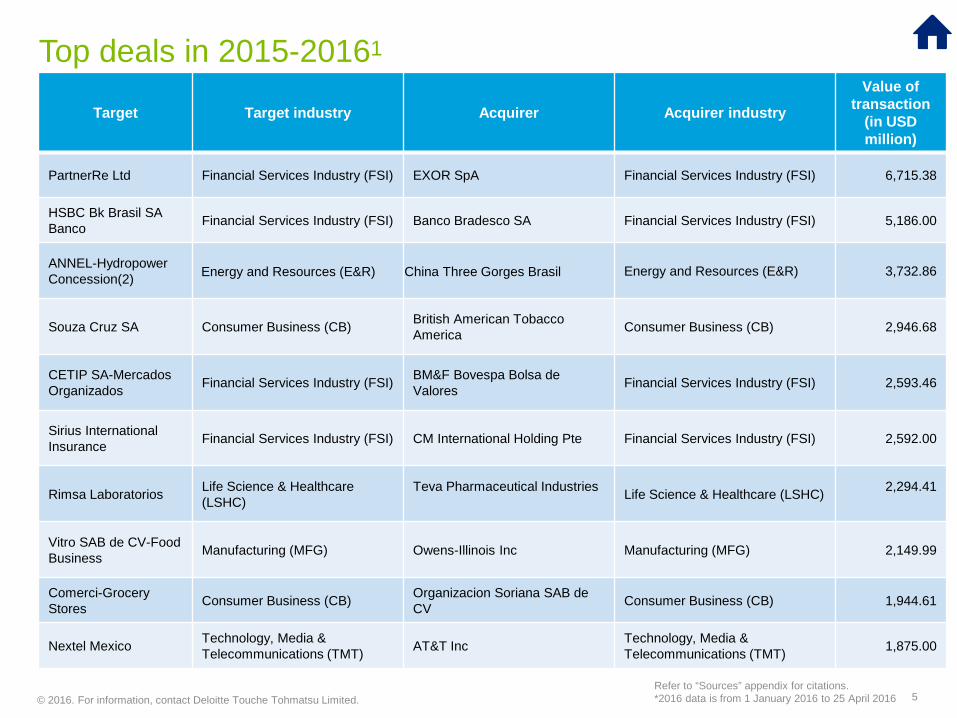
PartnerRe Ltd Financial Services Industry (FSI) EXOR SpA Financial Services Industry (FSI) 6,715.38
HSBC Bk Brasil SA Banco Financial Services Industry (FSI) Banco Bradesco SA Financial Services Industry (FSI) 5,186.00
ANNEL-Hydropower Concession(2) Energy and Resources (E&R) China Three Gorges Brasil Energy and Resources (E&R) 3,732.86
Souza Cruz SA Consumer Business (CB) British American Tobacco America Consumer Business (CB) 2,946.68
CETIP SA-Mercados Organizados Financial Services Industry (FSI) BM&F Bovespa Bolsa de
Valores Financial Services Industry (FSI) 2,593.46
Sirius International Insurance Financial Services Industry (FSI) CM International Holding Pte Financial Services Industry (FSI) 2,592.00
Rimsa Laboratorios Life Science & Healthcare(LSHC)
Teva Pharmaceutical Industries Life Science & Healthcare (LSHC) 2,294.41
Vitro SAB de CV-Food Business Manufacturing (MFG) Owens-Illinois Inc Manufacturing (MFG) 2,149.99
Comerci-Grocery Stores Consumer Business (CB) Organizacion Soriana SAB de
CV Consumer Business (CB) 1,944.61
Nextel Mexico Technology, Media & Telecommunications (TMT) AT&T Inc Technology, Media &
Telecommunications (TMT) 1,875.00
5
Top deals in 2015-20161
Refer to “Sources” appendix for citations.*2016 data is from 1 January 2016 to 25 April 2016
© 2016. For information, contact Deloitte Touche Tohmatsu Limited.
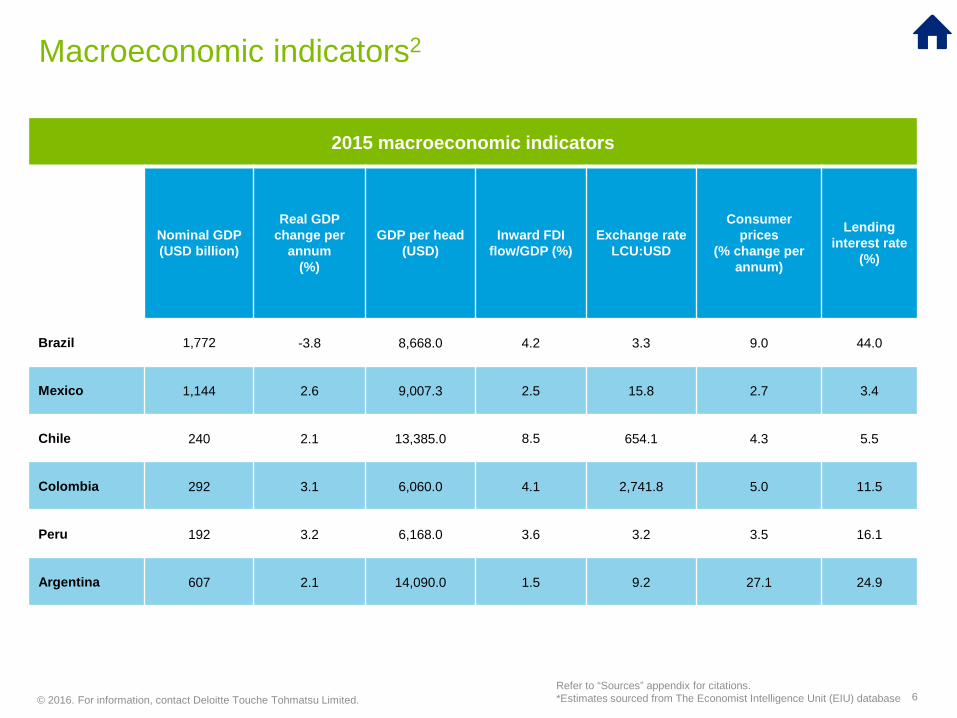
2015 macroeconomic indicators
Nominal GDP (USD billion)
Real GDP change per
annum(%)
GDP per head(USD)
Inward FDI flow/GDP (%)
Exchange rate LCU:USD
Consumerprices
(% change per annum)
Lending interest rate
(%)
Brazil 1,772 -3.8 8,668.0 4.2 3.3 9.0 44.0
Mexico 1,144 2.6 9,007.3 2.5 15.8 2.7 3.4
Chile 240 2.1 13,385.0 8.5 654.1 4.3 5.5
Colombia 292 3.1 6,060.0 4.1 2,741.8 5.0 11.5
Peru 192 3.2 6,168.0 3.6 3.2 3.5 16.1
Argentina 607 2.1 14,090.0 1.5 9.2 27.1 24.9
6
Macroeconomic indicators2
Refer to “Sources” appendix for citations.*Estimates sourced from The Economist Intelligence Unit (EIU) database
© 2016. For information, contact Deloitte Touche Tohmatsu Limited.
Geographical M&A activity
© 2016. For information, contact Deloitte Touche Tohmatsu Limited. 8
Africa/Middle East2%
Asia-Pacific7%
Europe14%
Latin America
62%
North America
15%
Deal value =
USD 451billion
2.8 2.4 2.3 1.3 0.7
Qatar Israel Utd Arab Em Mauritius South Africa
9.7 8.6 5.6 3.6 2.4
Hong Kong China Singapore Japan Australia
11.7 8.9 8.8 8.4 7.9
Spain Italy UnitedKingdom
Netherlands Luxembourg
140.2
53.7 54.428.7 19.6
Brazil UnitedStates
Mexico Chile Colombia
Africa/Middle East1%
Asia-Pacific5%
Europe15%
Latin America
61%
North America
18%
Deal volume =
6,250
16 12 15 6 4
Israel South Africa Utd Arab Em Qatar Mauritius
85 85 40 34 28
Australia Japan China Singapore Hong Kong
176 169 123 69 60
Spain UK France Germany Netherlands
1,683
745458 444 348
Brazil U.S. Mexico Chile Canada
Top acquirer nations by deal value (2012-16) in USD billion1
Top acquirer nations by deal volume (2012-16)1
Intra-regional deals drove most M&A activity in the region: North America and Europe lead in inter-regional deals1
Refer to “Sources” appendix for citations.*2016 data is from 1 January 2016 to 25 April 2016
© 2016. For information, contact Deloitte Touche Tohmatsu Limited. 9
0200400600800
0102030405060
2012 2013 2014 2015 2016*D
eal v
olum
es
Dea
l val
ue in
USD
bi
llion
Value Volume
0500100015002000
0
50
100
150
Brazil US Spain Lux** Canada Dea
l vol
umes
Dea
l val
ue in
USD
bi
llion
Value Volume
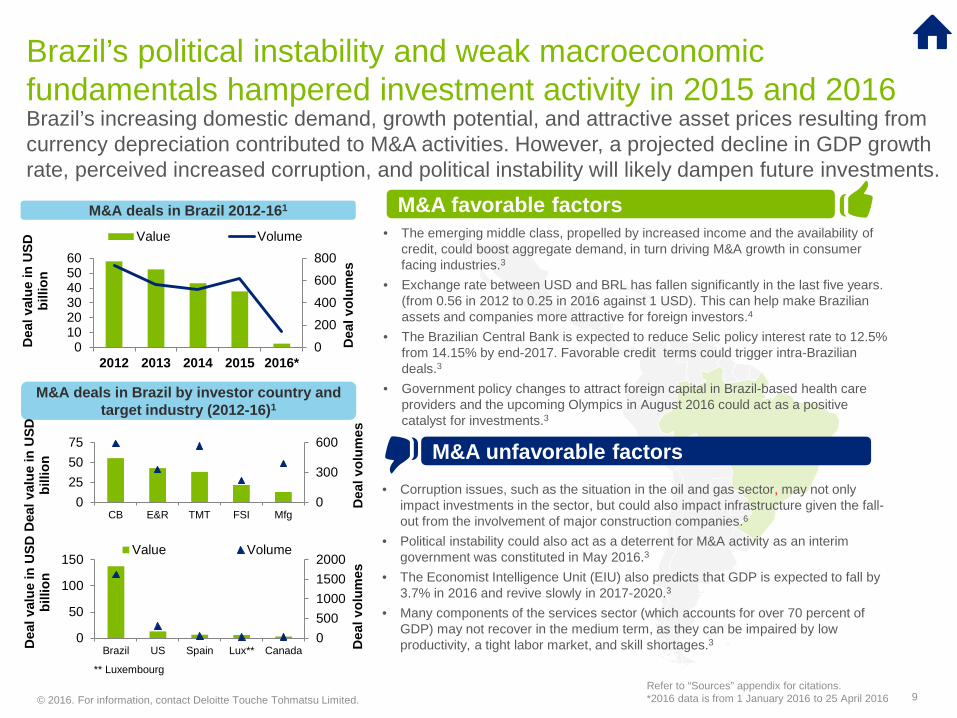
• The emerging middle class, propelled by increased income and the availability of credit, could boost aggregate demand, in turn driving M&A growth in consumer facing industries.3
• Exchange rate between USD and BRL has fallen significantly in the last five years. (from 0.56 in 2012 to 0.25 in 2016 against 1 USD). This can help make Brazilian assets and companies more attractive for foreign investors.4
• The Brazilian Central Bank is expected to reduce Selic policy interest rate to 12.5% from 14.15% by end-2017. Favorable credit terms could trigger intra-Brazilian deals.3
• Government policy changes to attract foreign capital in Brazil-based health care providers and the upcoming Olympics in August 2016 could act as a positive catalyst for investments.3
M&A favorable factors
M&A unfavorable factors
M&A deals in Brazil 2012-161
M&A deals in Brazil by investor country and target industry (2012-16)1
0
300
600
0255075
CB E&R TMT FSI Mfg
Dea
l vol
umes
Dea
l val
ue in
USD
bi
llion
• Corruption issues, such as the situation in the oil and gas sector, may not only impact investments in the sector, but could also impact infrastructure given the fall-out from the involvement of major construction companies.6
• Political instability could also act as a deterrent for M&A activity as an interim government was constituted in May 2016.3
• The Economist Intelligence Unit (EIU) also predicts that GDP is expected to fall by 3.7% in 2016 and revive slowly in 2017-2020.3
• Many components of the services sector (which accounts for over 70 percent of GDP) may not recover in the medium term, as they can be impaired by low productivity, a tight labor market, and skill shortages.3
Brazil’s political instability and weak macroeconomic fundamentals hampered investment activity in 2015 and 2016Brazil’s increasing domestic demand, growth potential, and attractive asset prices resulting from currency depreciation contributed to M&A activities. However, a projected decline in GDP growth rate, perceived increased corruption, and political instability will likely dampen future investments.
** LuxembourgRefer to “Sources” appendix for citations.*2016 data is from 1 January 2016 to 25 April 2016
© 2016. For information, contact Deloitte Touche Tohmatsu Limited. 10
-50
50
150
250
0
10
20
30
2012 2013 2014 2015 2016*D
eal v
olum
es
Dea
l val
ue in
USD
bi
llion
Value Volume
060120180240
0
20
40
CB TMT RealEstate
Mfg E&R
Dea
l vol
umes
Dea
l val
ue in
U
SD b
illio
n
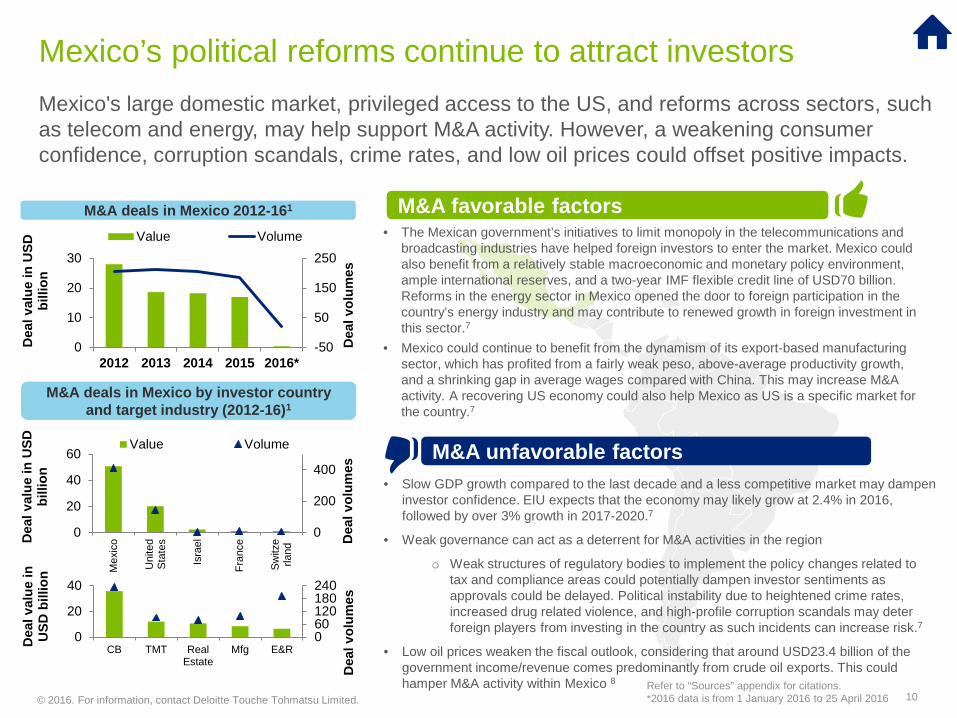
• The Mexican government’s initiatives to limit monopoly in the telecommunications and broadcasting industries have helped foreign investors to enter the market. Mexico could also benefit from a relatively stable macroeconomic and monetary policy environment, ample international reserves, and a two-year IMF flexible credit line of USD70 billion. Reforms in the energy sector in Mexico opened the door to foreign participation in the country’s energy industry and may contribute to renewed growth in foreign investment in this sector.7
• Mexico could continue to benefit from the dynamism of its export-based manufacturing sector, which has profited from a fairly weak peso, above-average productivity growth, and a shrinking gap in average wages compared with China. This may increase M&A activity. A recovering US economy could also help Mexico as US is a specific market for the country.7
• Slow GDP growth compared to the last decade and a less competitive market may dampen investor confidence. EIU expects that the economy may likely grow at 2.4% in 2016, followed by over 3% growth in 2017-2020.7
• Weak governance can act as a deterrent for M&A activities in the region
o Weak structures of regulatory bodies to implement the policy changes related to tax and compliance areas could potentially dampen investor sentiments as approvals could be delayed. Political instability due to heightened crime rates, increased drug related violence, and high-profile corruption scandals may deter foreign players from investing in the country as such incidents can increase risk.7
• Low oil prices weaken the fiscal outlook, considering that around USD23.4 billion of the government income/revenue comes predominantly from crude oil exports. This could hamper M&A activity within Mexico 8
M&A deals in Mexico 2012-161
M&A deals in Mexico by investor country and target industry (2012-16)1
0
200
400
0
20
40
60
Mex
ico
Uni
ted
Stat
es
Isra
el
Fran
ce
Switz
erla
nd
Dea
l vol
umes
Dea
l val
ue in
USD
bi
llion
Value Volume
Mexico’s political reforms continue to attract investors Mexico's large domestic market, privileged access to the US, and reforms across sectors, such as telecom and energy, may help support M&A activity. However, a weakening consumer confidence, corruption scandals, crime rates, and low oil prices could offset positive impacts.
M&A favorable factors
M&A unfavorable factors
Refer to “Sources” appendix for citations.*2016 data is from 1 January 2016 to 25 April 2016
© 2016. For information, contact Deloitte Touche Tohmatsu Limited. 11
050100150200
05
101520
2012 2013 2014 2015 2016*D
eal v
olum
es
Dea
l val
ue in
USD
bi
llion
Value Volume
050100150200
05
1015
E&R CB FSI LSHC Mfg
Dea
l vol
umes
Dea
l val
ue in
USD
bi
llion
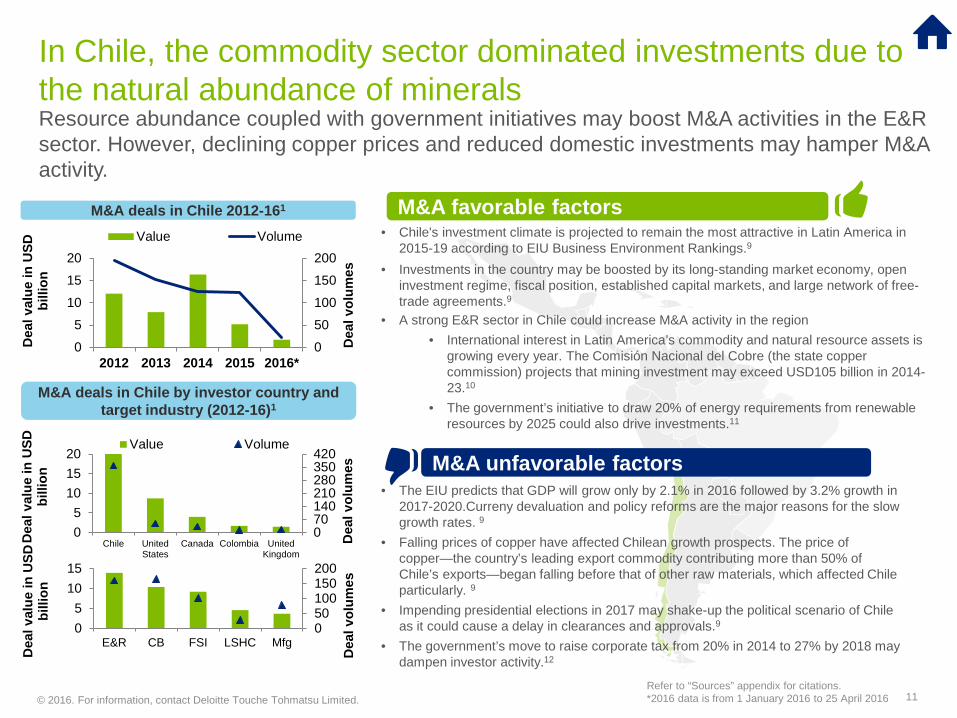
• Chile's investment climate is projected to remain the most attractive in Latin America in 2015-19 according to EIU Business Environment Rankings.9
• Investments in the country may be boosted by its long-standing market economy, open investment regime, fiscal position, established capital markets, and large network of free-trade agreements.9
• A strong E&R sector in Chile could increase M&A activity in the region• International interest in Latin America’s commodity and natural resource assets is
growing every year. The Comisión Nacional del Cobre (the state copper commission) projects that mining investment may exceed USD105 billion in 2014-23.10
• The government’s initiative to draw 20% of energy requirements from renewable resources by 2025 could also drive investments.11
• The EIU predicts that GDP will grow only by 2.1% in 2016 followed by 3.2% growth in 2017-2020.Curreny devaluation and policy reforms are the major reasons for the slow growth rates. 9
• Falling prices of copper have affected Chilean growth prospects. The price of copper—the country’s leading export commodity contributing more than 50% of Chile’s exports—began falling before that of other raw materials, which affected Chile particularly. 9
• Impending presidential elections in 2017 may shake-up the political scenario of Chile as it could cause a delay in clearances and approvals.9
• The government’s move to raise corporate tax from 20% in 2014 to 27% by 2018 may dampen investor activity.12
M&A deals in Chile 2012-161
M&A deals in Chile by investor country and target industry (2012-16)1
070140210280350420
05
101520
Chile UnitedStates
Canada Colombia UnitedKingdom
Dea
l vol
umes
Dea
l val
ue in
USD
bi
llion
Value Volume
In Chile, the commodity sector dominated investments due to the natural abundance of mineralsResource abundance coupled with government initiatives may boost M&A activities in the E&R sector. However, declining copper prices and reduced domestic investments may hamper M&A activity.
M&A favorable factors
M&A unfavorable factors
Refer to “Sources” appendix for citations.*2016 data is from 1 January 2016 to 25 April 2016
© 2016. For information, contact Deloitte Touche Tohmatsu Limited. 12
050100150200
0
4
8
12
2012 2013 2014 2015 2016*D
eal v
olum
es
Dea
l val
ue in
USD
bi
llion
Value Volume
050100150
0
5
10
E&R FSI CB Mfg TMT Dea
l vol
umes
Dea
l val
ue in
USD
bi
llion
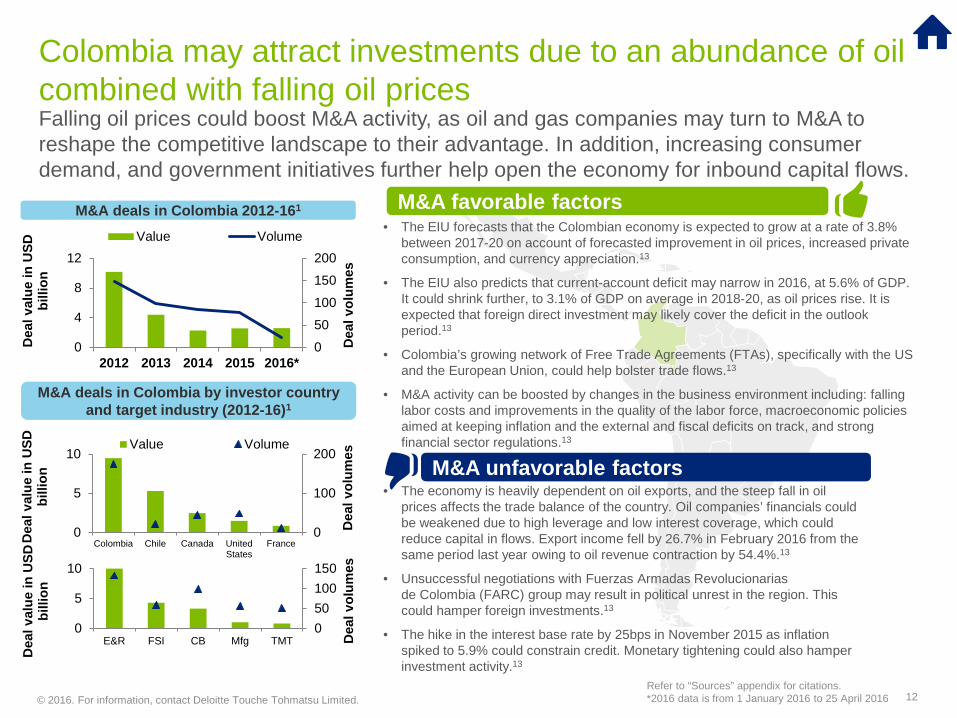
• The EIU forecasts that the Colombian economy is expected to grow at a rate of 3.8% between 2017-20 on account of forecasted improvement in oil prices, increased private consumption, and currency appreciation.13
• The EIU also predicts that current-account deficit may narrow in 2016, at 5.6% of GDP. It could shrink further, to 3.1% of GDP on average in 2018-20, as oil prices rise. It is expected that foreign direct investment may likely cover the deficit in the outlook period.13
• Colombia’s growing network of Free Trade Agreements (FTAs), specifically with the US and the European Union, could help bolster trade flows.13
• M&A activity can be boosted by changes in the business environment including: falling labor costs and improvements in the quality of the labor force, macroeconomic policies aimed at keeping inflation and the external and fiscal deficits on track, and strong financial sector regulations.13
• The economy is heavily dependent on oil exports, and the steep fall in oil prices affects the trade balance of the country. Oil companies’ financials could be weakened due to high leverage and low interest coverage, which could reduce capital in flows. Export income fell by 26.7% in February 2016 from the same period last year owing to oil revenue contraction by 54.4%.13
• Unsuccessful negotiations with Fuerzas Armadas Revolucionarias de Colombia (FARC) group may result in political unrest in the region. This could hamper foreign investments.13
• The hike in the interest base rate by 25bps in November 2015 as inflation spiked to 5.9% could constrain credit. Monetary tightening could also hamper investment activity.13
M&A deals in Colombia 2012-161
M&A deals in Colombia by investor country and target industry (2012-16)1
0
100
200
0
5
10
Colombia Chile Canada UnitedStates
France
Dea
l vol
umes
Dea
l val
ue in
USD
bi
llion
Value Volume
Colombia may attract investments due to an abundance of oil combined with falling oil pricesFalling oil prices could boost M&A activity, as oil and gas companies may turn to M&A to reshape the competitive landscape to their advantage. In addition, increasing consumer demand, and government initiatives further help open the economy for inbound capital flows.
M&A favorable factors
M&A unfavorable factors
Refer to “Sources” appendix for citations.*2016 data is from 1 January 2016 to 25 April 2016
© 2016. For information, contact Deloitte Touche Tohmatsu Limited. 13
0
50
100
150
0
5
10
15
2012 2013 2014 2015 2016*D
eal v
olum
es
Dea
l val
ue in
USD
bi
llion
Value Volume
050100150200
0
10
20
E&R CB FSI Mfg TMT
Dea
l vol
umes
Dea
l val
ue in
USD
bi
llion
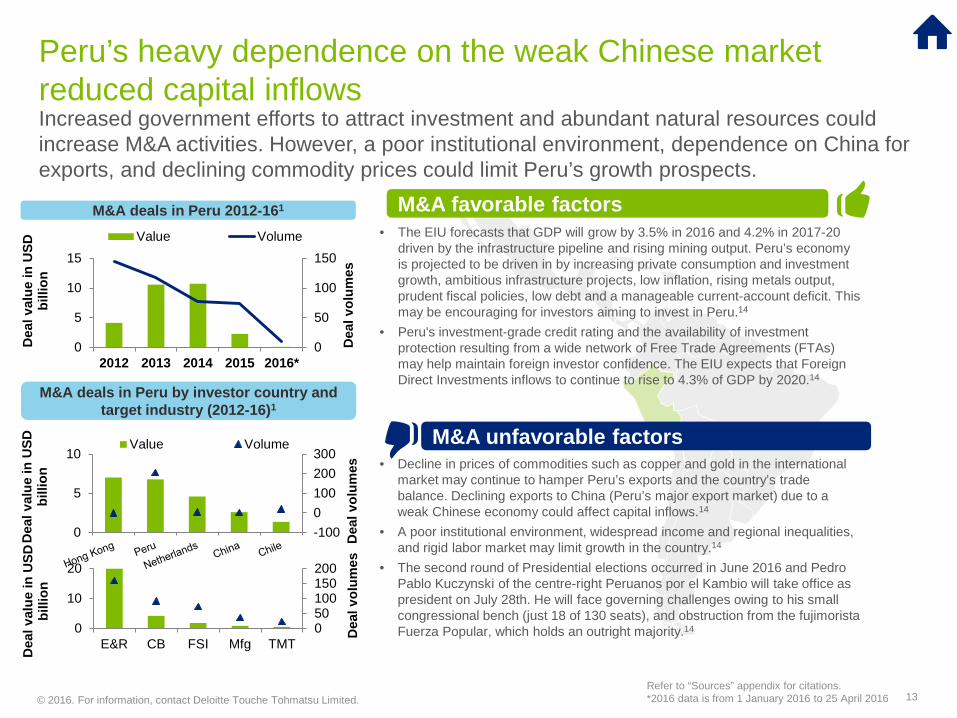
• The EIU forecasts that GDP will grow by 3.5% in 2016 and 4.2% in 2017-20 driven by the infrastructure pipeline and rising mining output. Peru’s economy is projected to be driven in by increasing private consumption and investment growth, ambitious infrastructure projects, low inflation, rising metals output, prudent fiscal policies, low debt and a manageable current-account deficit. This may be encouraging for investors aiming to invest in Peru.14
• Peru's investment-grade credit rating and the availability of investment protection resulting from a wide network of Free Trade Agreements (FTAs) may help maintain foreign investor confidence. The EIU expects that Foreign Direct Investments inflows to continue to rise to 4.3% of GDP by 2020.14
• Decline in prices of commodities such as copper and gold in the international market may continue to hamper Peru’s exports and the country’s trade balance. Declining exports to China (Peru’s major export market) due to a weak Chinese economy could affect capital inflows.14
• A poor institutional environment, widespread income and regional inequalities, and rigid labor market may limit growth in the country.14
• The second round of Presidential elections occurred in June 2016 and Pedro Pablo Kuczynski of the centre-right Peruanos por el Kambio will take office as president on July 28th. He will face governing challenges owing to his small congressional bench (just 18 of 130 seats), and obstruction from the fujimorista Fuerza Popular, which holds an outright majority.14
M&A deals in Peru 2012-161
M&A deals in Peru by investor country and target industry (2012-16)1
-1000100200300
0
5
10
Dea
l vol
umes
Dea
l val
ue in
USD
bi
llion
Value Volume
Peru’s heavy dependence on the weak Chinese market reduced capital inflowsIncreased government efforts to attract investment and abundant natural resources could increase M&A activities. However, a poor institutional environment, dependence on China for exports, and declining commodity prices could limit Peru’s growth prospects.
M&A favorable factors
M&A unfavorable factors
Refer to “Sources” appendix for citations.*2016 data is from 1 January 2016 to 25 April 2016

© 2016. For information, contact Deloitte Touche Tohmatsu Limited.
Argentina’s pro-business government policies could attract large investments Abundant natural resources and optimism in the newly elected government may further increase M&A activities in the country. However, inflationary pressures could decrease the momentum.
14
• Abundant natural resources may act as a positive catalyst in attracting investments:15
• Argentina has vast reserves of natural resources that could contribute to interest in investments in the mining, agriculture, and consumer business sectors.15
• Argentina is among the top five shale oil and gas reserves across the globe making it a top destination for potential energy investments. 15
• The new government was sworn into power in December 2015. The government‘s actions and public communications appear to indicate a pro-business focus which may help increase credibility and optimism among investor circles: 16
• The government lifted certain capital and trade restrictions, such as eliminating export taxes on a range of agricultural products. Further, the new government indicated it may raise the low energy tariffs that made oil production potentially less profitable and hindered investments.17
• The government removed foreign-exchange controls allowing the currency to devalue by around 50 percent in mid-December 2015. This may encourage foreign investors to acquire assets at more favorable rates. 18
• Debt settlement with holdouts have resulted in an improvement of the country’s credit rating. This may positively impact Argentina’s access to credit and boost M&A as well as large infrastructure projects. 18
• Higher inflationary pressures could result in monetary tightening that could potentially lead to limited credit availability resulting in low growth and reduced M&A activity.17
M&A deals In Argentina 2012-161
M&A deals in Argentina by investor country and target industry (2012-16)1
M&A favorable factors
M&A unfavorable factors
*For graph data source refer to “sources” appendix #19
0
50
100
0
5
10
2012 2013 2014 2015 2016D
eal v
olum
es
Dea
l Val
ue in
USD
bi
llion
Value Volume
0
100
200
0
5
10
Dea
l vol
umes
Dea
l val
ue in
USD
bi
llion
value volume
0
50
100
0
5
10
E&R CB FSI TMT MFG Dea
l vol
umes
Dea
l Val
ue in
USD
bi
llion
Refer to “Sources” appendix for citations.*2016 data is from 1 January 2016 to 25 April 2016
© 2016. For information, contact Deloitte Touche Tohmatsu Limited.
M&A activity across industries
© 2016. For information, contact Deloitte Touche Tohmatsu Limited.
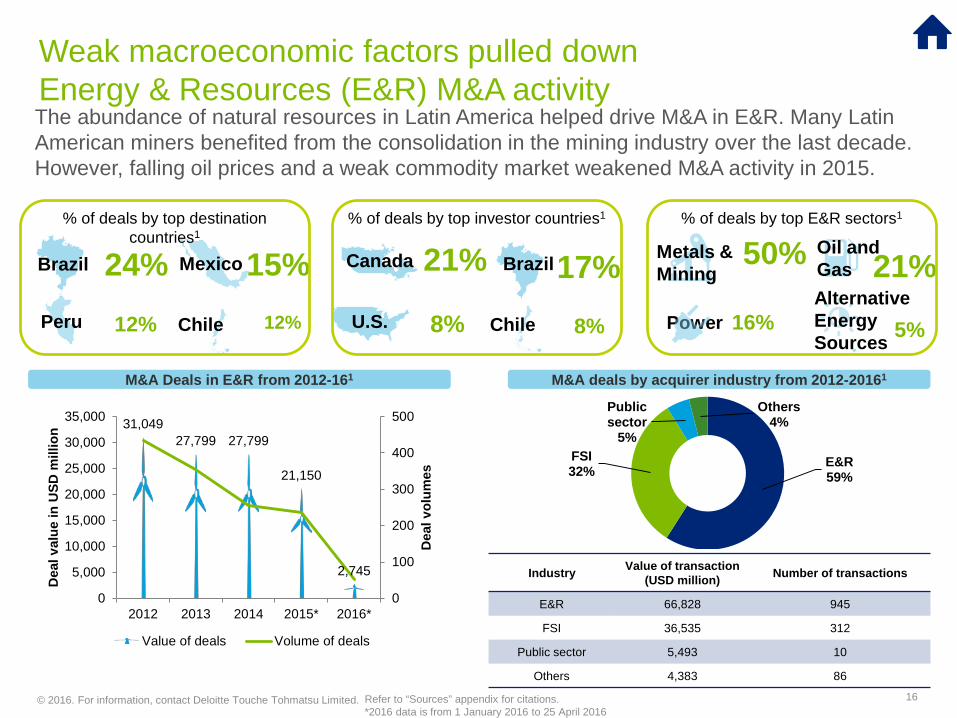
Oil and Gas 21%
Power 16%
Metals & Mining
50%Alternative Energy Sources 5%
% of deals by top E&R sectors1
31,04927,799 27,799
21,150
2,745
0
100
200
300
400
500
0
5,000
10,000
15,000
20,000
25,000
30,000
35,000
2012 2013 2014 2015* 2016*
Dea
l vol
umes
Dea
l val
ue in
USD
mill
ion
Value of deals Volume of deals
The abundance of natural resources in Latin America helped drive M&A in E&R. Many Latin American miners benefited from the consolidation in the mining industry over the last decade. However, falling oil prices and a weak commodity market weakened M&A activity in 2015.
Weak macroeconomic factors pulled down Energy & Resources (E&R) M&A activity
16
Brazil17%U.S. 8%
Canada 21%
Chile 8%
% of deals by top investor countries1
Mexico 15%Peru 12%
Brazil 24%Chile 12%
% of deals by top destination countries1
M&A Deals in E&R from 2012-161
E&R 59%
FSI32%
Public sector
5%
Others4%
M&A deals by acquirer industry from 2012-20161
Industry Value of transaction (USD million) Number of transactions
E&R 66,828 945
FSI 36,535 312
Public sector 5,493 10
Others 4,383 86
Refer to “Sources” appendix for citations.*2016 data is from 1 January 2016 to 25 April 2016
© 2016. For information, contact Deloitte Touche Tohmatsu Limited.
CB 61%
FSI33%
Mfg2%
Others4%51,019
32,145
15,52520,678
1,629050100150200250300350400450500
0
10,000
20,000
30,000
40,000
50,000
60,000
2012 2013 2014 2015 2016*
Dea
l vol
umes
Dea
l val
ue in
USD
mill
ion
Value of deals Volume of deals
1
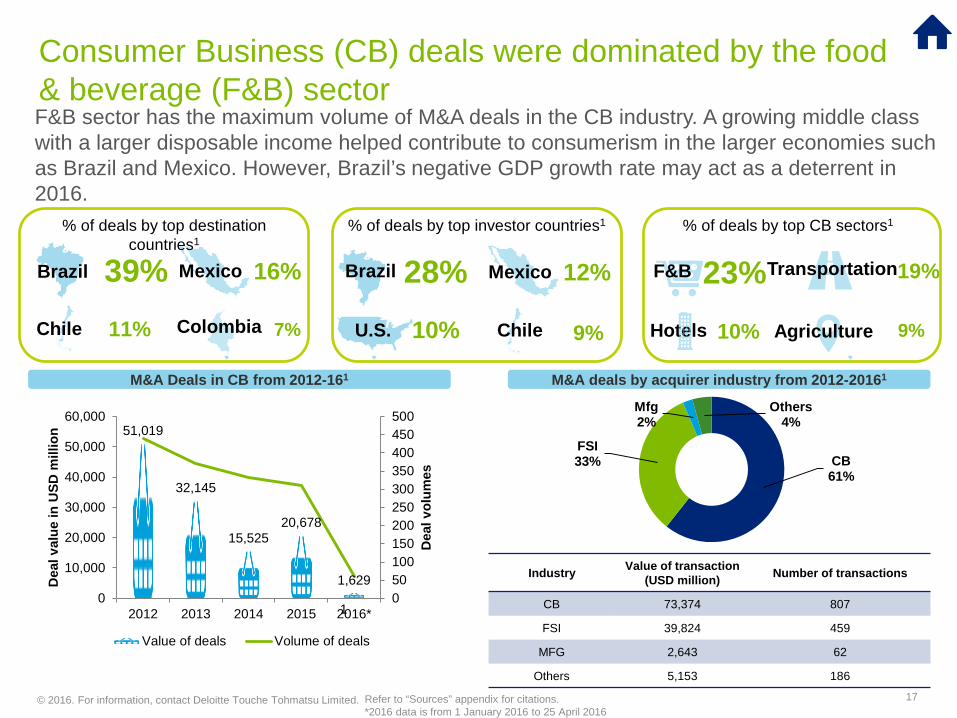
F&B sector has the maximum volume of M&A deals in the CB industry. A growing middle class with a larger disposable income helped contribute to consumerism in the larger economies such as Brazil and Mexico. However, Brazil’s negative GDP growth rate may act as a deterrent in 2016.
Consumer Business (CB) deals were dominated by the food & beverage (F&B) sector
17
Mexico 16%
7%
Brazil 39%11% Colombia
% of deals by top destination countries1
Brazil 28%U.S. 10%
% of deals by top investor countries1
Transportation19%
Agriculture10%
F&B 23%Hotels 9%
% of deals by top CB sectors1
M&A Deals in CB from 2012-161
Mexico 12%
Chile 9%Chile
Industry Value of transaction (USD million) Number of transactions
CB 73,374 807
FSI 39,824 459
MFG 2,643 62
Others 5,153 186
M&A deals by acquirer industry from 2012-20161
Refer to “Sources” appendix for citations.*2016 data is from 1 January 2016 to 25 April 2016
© 2016. For information, contact Deloitte Touche Tohmatsu Limited.
10,957
15,102
27,917
5,794 302
0
50
100
150
200
250
0
5,000
10,000
15,000
20,000
25,000
30,000
2012 2013 2014 2015 2016*
Dea
l vol
umes
Dea
l val
ue in
USD
mill
ion
Volume of deals
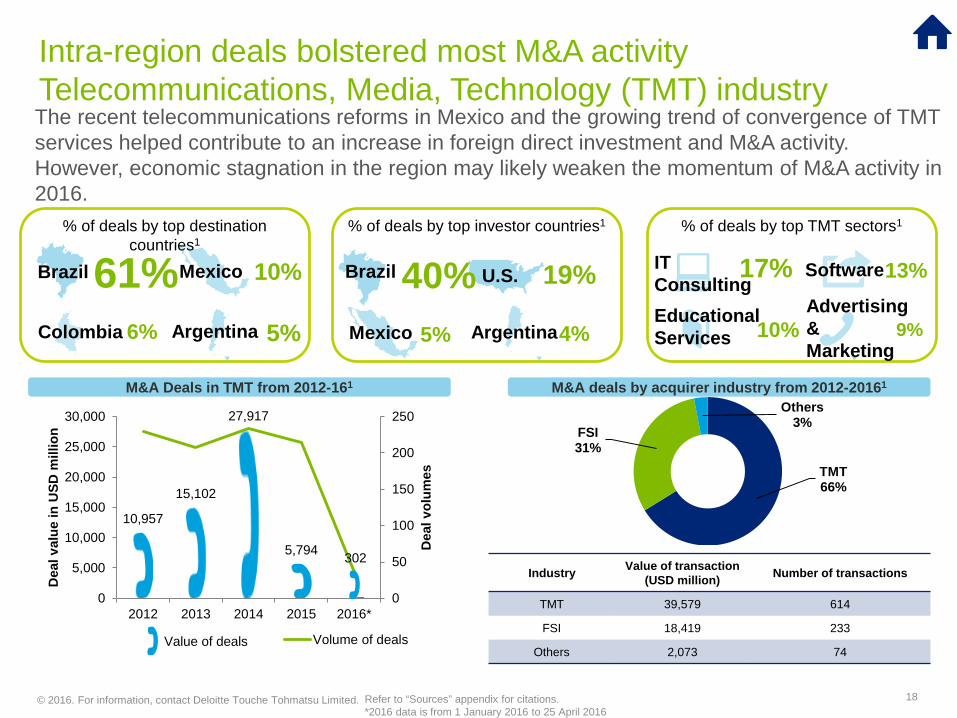
The recent telecommunications reforms in Mexico and the growing trend of convergence of TMT services helped contribute to an increase in foreign direct investment and M&A activity. However, economic stagnation in the region may likely weaken the momentum of M&A activity in 2016.
Intra-region deals bolstered most M&A activity Telecommunications, Media, Technology (TMT) industry
18
Mexico 10%
Argentina 5%
Brazil 61%Colombia 6%
% of deals by top destination countries1
Brazil 40% U.S. 19%
Mexico 5% Argentina4%
% of deals by top investor countries1
IT Consulting
17% Software13%Advertising & Marketing
9%Educational Services 10%
% of deals by top TMT sectors1
TMT66%
FSI31%
Others3%
M&A Deals in TMT from 2012-161
Industry Value of transaction (USD million) Number of transactions
TMT 39,579 614
FSI 18,419 233
Others 2,073 74Value of deals
M&A deals by acquirer industry from 2012-20161
Refer to “Sources” appendix for citations.*2016 data is from 1 January 2016 to 25 April 2016
© 2016. For information, contact Deloitte Touche Tohmatsu Limited.
Insurance26%Other Financials
14%Banks
28%12%
% of deals by top FSI sectors1
16,553 16,131
20,800
27,754
1,116
0
50
100
150
200
250
300
0
5,000
10,000
15,000
20,000
25,000
30,000
2012 2013 2014 2015 2016*
Dea
l vol
umes
Dea
l val
ue in
USD
mill
ion
Volume of deals
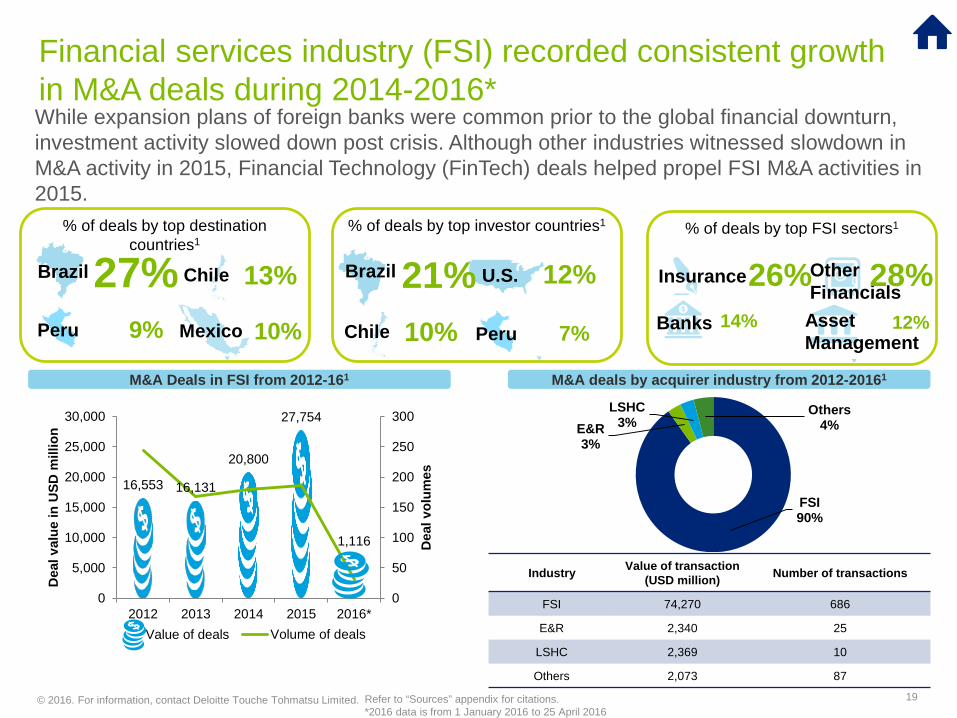
While expansion plans of foreign banks were common prior to the global financial downturn, investment activity slowed down post crisis. Although other industries witnessed slowdown in M&A activity in 2015, Financial Technology (FinTech) deals helped propel FSI M&A activities in 2015.
Financial services industry (FSI) recorded consistent growth in M&A deals during 2014-2016*
19
Mexico 10%Peru 9%
Brazil 27% Chile 13%
% of deals by top destination countries1
Brazil 21% U.S. 12%
Peru 7%
% of deals by top investor countries1
FSI 90%
E&R3%
LSHC3%
Others4%
M&A Deals in FSI from 2012-161
Chile 10% Asset Management
Industry Value of transaction (USD million) Number of transactions
FSI 74,270 686
E&R 2,340 25
LSHC 2,369 10
Others 2,073 87
Value of deals
M&A deals by acquirer industry from 2012-20161
Refer to “Sources” appendix for citations.*2016 data is from 1 January 2016 to 25 April 2016
© 2016. For information, contact Deloitte Touche Tohmatsu Limited.
8,383
4,596
10,209
6,916
747
0
50
100
150
200
250
0
2,000
4,000
6,000
8,000
10,000
12,000
2012 2013 2014 2015 2016*
Dea
l vol
umes
Dea
l val
ue in
USD
mill
ion
Volume of deals
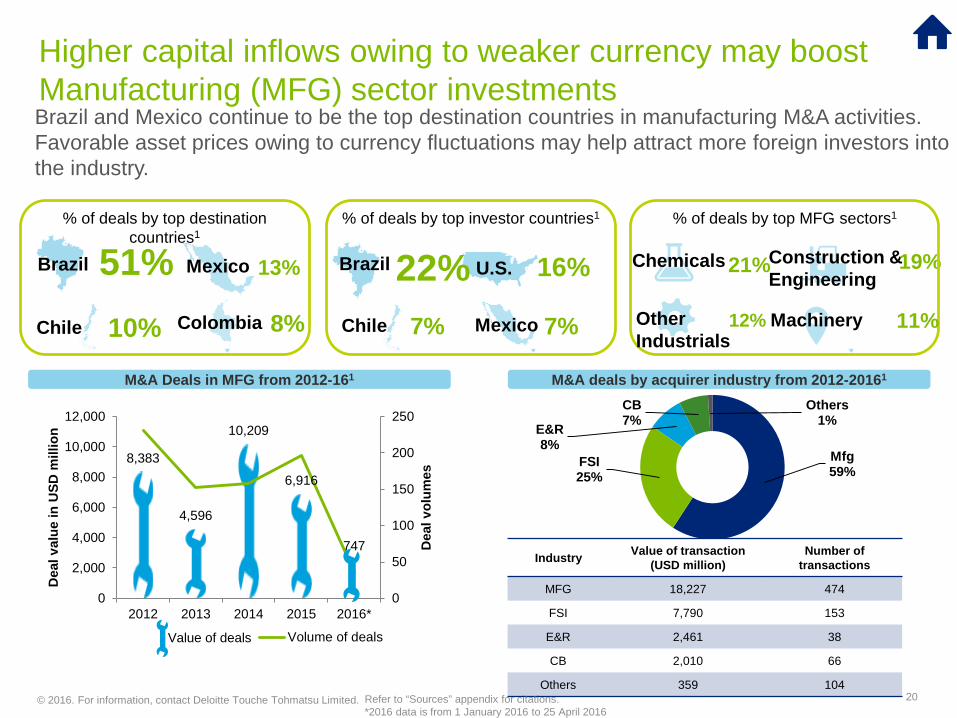
Brazil and Mexico continue to be the top destination countries in manufacturing M&A activities. Favorable asset prices owing to currency fluctuations may help attract more foreign investors into the industry.
Higher capital inflows owing to weaker currency may boost Manufacturing (MFG) sector investments
20
Mexico
10% Colombia 8%
Brazil 51%Chile
13%
% of deals by top destination countries1
Brazil 22% U.S. 16%
Mexico 7%Chile 7%
% of deals by top investor countries1
Construction & Engineering
19%
11%
Chemicals21%
OtherIndustrials
12%
% of deals by top MFG sectors1
Mfg59%
FSI25%
E&R8%
CB7%
Others1%
M&A Deals in MFG from 2012-161
Machinery
Industry Value of transaction (USD million)
Number of transactions
MFG 18,227 474
FSI 7,790 153
E&R 2,461 38
CB 2,010 66
Others 359 104
Value of deals
M&A deals by acquirer industry from 2012-20161
Refer to “Sources” appendix for citations.*2016 data is from 1 January 2016 to 25 April 2016
© 2016. For information, contact Deloitte Touche Tohmatsu Limited.
6,840
2,502
3,886
2,177
201
0
50
100
0
1,000
2,000
3,000
4,000
5,000
6,000
7,000
2012 2013 2014 2015 2016*
Dea
l vol
umes
Dea
l val
ue in
USD
mill
ion
Volume of deals
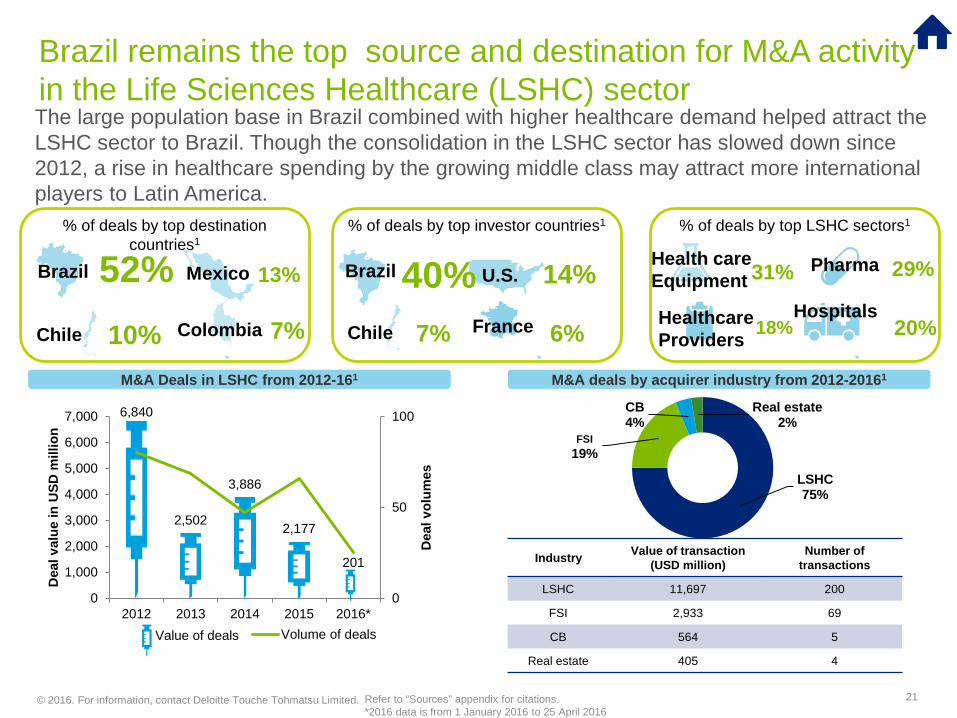
The large population base in Brazil combined with higher healthcare demand helped attract the LSHC sector to Brazil. Though the consolidation in the LSHC sector has slowed down since 2012, a rise in healthcare spending by the growing middle class may attract more international players to Latin America.
Brazil remains the top source and destination for M&A activity in the Life Sciences Healthcare (LSHC) sector
21
Mexico
10% Colombia 7%
Brazil 52%Chile
13%
% of deals by top destination countries1
Brazil 40% U.S. 14%
France 6%Chile 7%
% of deals by top investor countries1
Pharma 29%
20%
Health care Equipment 31%
HealthcareProviders 18%
% of deals by top LSHC sectors1
LSHC75%
FSI19%
CB4%
Real estate2%
M&A Deals in LSHC from 2012-161
Hospitals
Industry Value of transaction (USD million)
Number of transactions
LSHC 11,697 200
FSI 2,933 69
CB 564 5
Real estate 405 4
Value of deals
M&A deals by acquirer industry from 2012-20161
Refer to “Sources” appendix for citations.*2016 data is from 1 January 2016 to 25 April 2016

© 2016. For information, contact Deloitte Touche Tohmatsu Limited.
Perspectives
© 2016. For information, contact Deloitte Touche Tohmatsu Limited.
Deloitte produces original and informative articles drawn from experiences throughout our professional services organization. Listed below are recent pieces which provide insights for businesses about events and trends in the Americas region.
In the wake of the Panama Papers: A guide for multinational corporationsThe Panama Papers have brought business interactions with offshore holding companies to the forefront. Learn how companies are assessing whether any corruption or fraud exists within their operations and how they can implement policies, procedures, and controls to mitigate risk.
M&A trends report 2016 - Is last year's record pace sustainable?Coming off a record year for mergers and acquisitions (M&A), an overwhelming majority of executives at US corporations and private equity firms forecast that deal activity will stay strong or even ramp up. What M&A trends are driving their optimism? What factors could potentially put the brakes on? Our third annual trends report asks M&A leaders for their predictions. We surveyed nearly 2,300 executives at US companies and private equity firms to gauge their expectations, experiences, and plans for mergers and acquisitions in the coming year. While the sentiment and outlook for M&A activity remain favorable, a number of potential obstacles emerged in our third annual M&A trends report.
Wall Street Journal (WSJ) CFO Journal: How to Address FCPA Risks in Emerging Market M&A DealsGain additional insights about how to address FCPA risks in this piece based on the article M&A in emerging markets: A fresh look at successor liability associated with the Foreign Corrupt Practices Act.
Human Capital Considerations in Cross-border Deals Acquiring an overseas company can open up new markets and business opportunities. However, foreign companies may also require a number of unique human capital considerations that can impact deal value. Read more about the impact of these key human capital considerations.
Acquisition Due Diligence Bribery & Corruption RiskBuyers that are considering an acquisition usually encounter a competitive and time-sensitive diligence process focused on assessing the target’s performance key risks. Learn more about how a buyer’s failure to adequately consider bribery and corruption risk may lead to the purchase of an overvalued company and serious collateral consequences.
Market Consolidation Outlook – Investment strategies and merger & acquisition activityDeloitte Brazil presents the results of its survey that tackles its challenging local M&A market. The survey, led by Deloitte Brazil’s Corporate Finance Advisory practice, presents the opinions of top executives from 221 companies operating in several industry segments. Read more about how M&As have become an alternative to organic growth in Brazil, the expectations for the M&A market in the next two years, and experiences and challenges for closing deals in Brazil.
Perspectives
23

© 2016. For information, contact Deloitte Touche Tohmatsu Limited.
Leadership contacts
© 2016. For information, contact Deloitte Touche Tohmatsu Limited. 25
Americas Region Leadership – M&A Transaction Services
Americas region Argentina Brazil Canada
Hernan [email protected]
Jose [email protected]
Daniel [email protected]
Ronaldo Xavier [email protected]
Mark [email protected]
Chile Colombia Mexico Peru United States
Christopher [email protected]
Javier [email protected]
Guillermo [email protected]
Juan [email protected]
Russell [email protected]
© 2016. For information, contact Deloitte Touche Tohmatsu Limited. 26
Americas Region Leadership – Corporate Finance
Americas region Argentina Brazil Canada
Will [email protected]
Marcos [email protected]
Reinaldo [email protected]
Robert [email protected]
Chile Colombia/Peru Mexico United States
Jaime [email protected]
Juan [email protected]
Mauricio [email protected]
Phil Colaco [email protected]
© 2016. For information, contact Deloitte Touche Tohmatsu Limited.
Appendix
© 2016. For information, contact Deloitte Touche Tohmatsu Limited.
1. Thomson Reuters. (2016). M&A Overview. http://mergers.thomsonib.com/NASApp/DealSearch/MAOverview.htm?ExpressCode=DELOITTEDEALSRetrieved May 20, 2016, from Thomson ONE database.
2. The Economist Intelligence Unit Limited. (2006, May). Market indicators and forecasts. http://data.eiu.com/EIUTableView.aspx?initial=true&pubtype_id=1303181315 Retrieved May 3, 2016, from Economist Intelligence Unit database.
3. The Economist Intelligence Unit Limited. (2006, May). Brazil country report. http://country.eiu.com/brazil Retrieved May 9, 2016, from Economist Intelligence Unit database.
4. “Brazilian Real Drops to Record Low Against U.S. Dollar,” September 22, 2015 http://www.bloomberg.com/news/articles/2015-09-22/brazil-s-currency-tumbles-to-record-on-pessimism-over-budget. Accessed May 3, 2016.
5. “Overview of the M&A market in Brazil and trends for 2014,” May 2014 http://www.financierworldwide.com/overview-of-the-ma-market-in-brazil-and-trends-for-2014/#.V1V2Mof2Y2x. Accessed May 3, 2016.
6. “Market cap of Brazil's Petrobras down 85.55 pct. from record high in 2008,” January 20, 2016 http://www.efe.com/efe/english/business/market-cap-of-brazil-s-petrobras-down-85-55-pct-from-record-high-in-2008/50000265-2815427 . Accessed May 3, 2016.
7. The Economist Intelligence Unit Limited. (2006, May). Mexico country report.. http://country.eiu.com/Mexico Retrieved May 9, 2016, from Economist Intelligence Unit database.
8. “Mexico Got More Money from Remittances Than from Oil Revenues in 2015,” February 3, 2016 http://www.nbcnews.com/news/latino/mexico-got-more-money-remittances-oil-revenues-2015-n510346. Accessed May 3, 2016.
9. The Economist Intelligence Unit Limited. (2006, May). Chile country report. http://country.eiu.com/Chile Retrieved May 10, 2016, from Economist Intelligence Unit database.
10. “Chile sees $105bn mining investment in next decade,” September 25, 2014 http://www.mining.com/chile-sees-105bn-mining-investment-in-next-decade-35191/. Accessed May 3, 2016.
11. “Chile: expansion of renewable energy,” November 28, 2014 https://www.gov.uk/government/publications/chile-expansion-of-renewable-energy/chile-expansion-of-renewable-energy. Accessed May 10, 2016.
12. “Chile to Raise Taxes in 2015,” September 30, 2014. http://taxfoundation.org/blog/chile-raise-taxes-2015 . Accessed May 10, 2016. 13. The Economist Intelligence Unit Limited. (2006, May). Colombia country report.. http://country.eiu.com/Colombia Retrieved May 11, 2016, from
Economist Intelligence Unit database.14. The Economist Intelligence Unit Limited. (2006, May). Peru country report.. http://country.eiu.com/Peru Retrieved May 13, 2016, from Economist
Intelligence Unit database.15. The Economist Intelligence Unit Limited. (2006, May). Argentina country report.. http://country.eiu.com/Argentina Retrieved May 13, 2016, from
Economist Intelligence Unit database.16. “Argentina: Get Ready To Invest (And Travel!),” January 6, 2016 http://www.forbes.com/sites/sarazervos/2016/01/06/argentina-get-ready-to-invest-and-
travel/#772424de15de. Accessed May 13, 2016. 17. “Argentina’s capital reports highest inflation in 14 years,” May 12, 2016 http://abcnews.go.com/International/wireStory/argentinas-capital-reports-highest-
inflation-14-years-39076760. Accessed May 13, 2016. 18. “Argentina Eyes $20 Billion in Investment in 2016, Macri Says,” January 22, 2016 http://www.bloomberg.com/news/articles/2016-01-22/argentina-may-
lure-20-billion-in-investment-in-2016-macri-says. Accessed May 13, 2016. 19. Merge and markets (2016), http://www.mergermarket.com/Common/Mergermarket/Deals/Default.aspx?npid=500& Retrieved April 4, 2016, from
Mergemarket database. 28
Sources
© 2016. For information, contact Deloitte Touche Tohmatsu Limited.
For purposes of this presentation:
• Latin America includes countries in South America, Central America, and the Caribbean Islands.
• Latin American target companies have been classified based on the dominant geography of the target company in Latin America.
• The region and country of the acquirer have been determined from the location of the ultimate parent.
• “Cross-border inbound M&A” refers to M&A deals where the acquirer is from non-Latin American countries and the dominant geography of the target company is Latin America.
• Completed, intended, and pending deals have been considered in the data presented. Abandoned deals have not been considered.
Presentation Notes
29
Deloitte refers to one or more of Deloitte Touche Tohmatsu Limited, a UK private company limited by guarantee (“DTTL”), its network of member firms, and their related entities. DTTL and each of its member firms are legally separate and independent entities. DTTL (also referred to as “Deloitte Global”) does not provide services to clients. Please see www.deloitte.com/about to learn more about our global network of member firms.
Deloitte provides audit, consulting, financial advisory, risk management, tax and related services to public and private clients spanning multiple industries. Deloitte serves four out of five Fortune Global 500® companies through a globally connected network of member firms in more than 150 countries bringing world-class capabilities, insights, and high-quality service to address clients’ most complex business challenges. To learn more about how Deloitte’s approximately 225,000 professionals make an impact that matters, please connect with us on Facebook, LinkedIn, or Twitter.
This communication contains general information only, and none of Deloitte Touche Tohmatsu Limited, its member firms, or their related entities (collectively, the “Deloitte Network”) is, by means of this communication, rendering professional advice or services. Before making any decision or taking any action that may affect your finances or your business, you should consult a qualified professional adviser. No entity in the Deloitte Network shall be responsible for any loss whatsoever sustained by any person who relies on this communication.
© 2016. For information, contact Deloitte Touche Tohmatsu Limited.