Embed Size (px)
Citation preview

8/3/2019 M.a Sahin Et.al 2001,A Machine Vision Systems for Grading Lentils
http://slidepdf.com/reader/full/ma-sahin-etal-2001a-machine-vision-systems-for-grading-lentils 1/8
Volume 43 2001 CANADIAN BIOSYSTEMS ENGINEERING 7.7
A machine vision system for grading lentilsM.A. Shahin and S.J. Symons
Canadian Grain Commission, Grain Research Laboratory, 1404-303 Main Street, Winnipeg, Manitoba, Canada R3C 3G8.
Publication Number GRL# 809.
Shahin, M.A. and Symons, S.J. 2001. A machine vision system forgrading lentils. Canadian Biosystems Engineering/Le génie desbiosystèmes au Canada 43:7.7-7.14. Color and appearance of lentilsare important grading factors. A machine vision system for colorgrading of lentils was developed using a flatbed scanner as the image-gathering device. Grain samples belonging to different grades of largegreen lentils were scanned and analyzed over a two-crop season period.Image color, color distribution, and textural features were found to begood indicators of lentil grade. Linear discriminant analysis, k-nearestneighbors, and neural network based classifiers performed equally wellin predicting sample grade. An online classification system wasdeveloped with a neural classifier that achieved an overall accuracy
(agreement with the grain inspectors) of more than 90%. Keywords:lentils, grading, inspection, machine vision, color, image analysis,image classification, flatbed scanner.
La couleur et l’apparence sont deux facteurs importants declassement des lentilles. Un système de vision artificielle, pour lequell’acquisition d’images se faisait à l’aide d’un lecteur optique plat, futdéveloppé pour classer les lentilles selon la couleur. Au cours d’unesaison de deux récoltes, des échantillons de lentilles vertes decatégories différentes furent examinés. Il semble que la couleur del’image, la distribution des couleurs et les paramètres texturaux soientde bons indicateurs de la catégorie des lentilles. Les facteurs declassement dérivés d’une analyse discriminante linéaire, de la méthodedu plus proche voisin et d’un réseau de neurones ont prédit de manièreéquivalente la catégorie des échantillons de lentilles. Un système declassement en temps réel fut développé avec un facteur de classementneuronal dont la précision globale (accord avec le travail des
inspecteurs des grains) dépassait 90%. Mots clés: lentilles, classement,inspection, vision artificielle, couleur, analyse des images,classification d’images, lecteur optique plat.
INTRODUCTION
Lentils have emerged as a specialty crop in the prairies due totheir high value. Consequently, the area under lentil productionhas increased many fold over the last few years. Canada nowexports about 2.7 million tonnes of lentils annually (Personalcommunication: Gordon Bacon, President, Pulse Canada,Winnipeg, MB).Visual appeal directly influences consumeracceptance and hence value of the lentil product. The mainvisual factor is the color of the grain, which is directly related toits market value. Errors in color assessment can lead to incorrectgrade assignments, especially close to the grade boundaries,causing a further perception that visual grading is incorrect. Asgrade is related to value, growers may not be paid what theircrop is actually worth.
At present, lentils are graded through visual inspection bytrained inspectors according to the guidelines set by theCanadian Grain Commission (Anonymous 1998). Human visualinspection, by nature, is a highly subjective process due tocomplexity involved in human color perception. Experienced
inspectors are usually very consistent in their own assessment of grade. Disagreements among inspectors, however, occurbecause of vague boundary cut-offs between grades anddifferent personal experiences and color acuity. To increaseconsistency at grade boundaries, several inspectors often concurto reach a consensus for such samples. This slows down theinspection process, as there is no definitive description of theacceptable color ranges in each grade. The measurement of color using a machine vision system offers a potential solutionto placing color evaluation on an objective basis.
Machine vision is a well-established inspection tool in the
automotive industry. Its use in the field of agriculture has beenthe area of active research in the last decade. Several systemshave been reported in the literature for inspecting a variety of products ranging from fruits (Kodaira et al. 1991; Singh et al.1993; Al-Janobi and Kranzler 1994; Shahin and Tollner 1998)and vegetables (Marchant et al. 1990; Shearer and Payne 1990;Shahin et al. 1999) to grains (Hehn and Sokhansanj 1990; Zayaset al. 1990; Reid et al. 1991), eggs (Patel et al. 1996), and fish(Strachan 1993). For grading or sorting lentils, two systemshave been reported: one developed at the University of Saskatchewan (Winter 1997) and the other developed by a seedsorting company in Rocanville, Saskatchewan (Personalcommunication: Lavern Affleck, Owner, Agrivision ProcessingCo., Rocanville, SK). Both of these systems, however, generally
rely upon expensive mechanical hardware or difficult tomaintain color camera technology, which limits theiraffordability, portability, consistency, and reproducibilitybetween systems and the ability to handle small samples. Arobust, cost effective, and portable system capable of predictingcolor and grade in real-world applications would be very usefulto both the lentil growers and inspectors. Traditionally, in amachine vision system, images for analysis are gathered usinga video camera. While this is effective, the informationcontained within the image can be influenced by changes in thecamera configuration and by slight changes to the way in whichthe sample is illuminated. This is a complex problem for colorimaging, where any slight change in the image gathering systemcan cause dramatic changes in the color information contained
in the image. Video camera input devices also are expensive topurchase and maintain. An imaging device that is less sensitiveto ambient lighting conditions as well as less costly than a videocamera would lead to a robust and cost effective grading system.
Flatbed (document) scanners are image gathering devicesthat incorporate a fixed relationship between the illuminantsource (lamp) and the solid state sensors of the scanning head.Due to their increasing popularity, the cost of these devices isdropping rapidly. These characteristics may turn the flatbedscanners into the image acquisition system of choice.

8/3/2019 M.a Sahin Et.al 2001,A Machine Vision Systems for Grading Lentils
http://slidepdf.com/reader/full/ma-sahin-etal-2001a-machine-vision-systems-for-grading-lentils 2/8
LE GÉNIE DES BIOSYSTÈMES AU CANADA SHAHIN and SYMONS7.8
Table 1. Number of samples for different color grades scanned
each year.
Color Description Grade Number of samples
1998 1999
GNCLRRGCLRF2PCLR
Good natural colorReasonably good colorFair-to-poor color
123
11414670
5877824
Total samples 330 689
Preliminary investigations showed that a flatbed scanner couldbe used as an alternative imaging device (Shahin and Symons1999).
The overall objective of this research was to develop arobust, cost effective and practical machine vision system forcolor grading of lentils using a flatbed scanner. Specificobjectives were to:
1. Verify the suitability of a flatbed scanner as a quantitativeimaging device for detecting color variations associated with
color grades of large green lentils.2. Extract image features indicative of the color grade of large
green lentils and evaluate selected image features usingstatistical and neural network classifiers.
3. Develop an online classification system for grading lentilsamples into their appropriate color grades based on selectedimage features.
MATERIALS and METHODS
Samples of large green seeded (Laird) lentils were collectedover two years from the 1998 and 1999 crops. Images of thesesamples were acquired using a flatbed scanner. Data from the
1998 crop were utilized for development and validation of theclassification (grading) system. Data from the 1999 crop wereused for verification of the system performance.
Lentil samples
For the crop year 1998, 260 samples were received from theIndustry Service Division, Canadian Grain Commission (CGC)offices in Saskatchewan. These samples were from storage andat least 120 days old. When a grade did not appear to match thevisual appearance of the sample, senior inspectors in Winnipegre-inspected the samples and assigned a grade. Samples wereabout 800 g in size. About 70 samples were also obtained fromthe 1998 New Crop Survey carried out by the Grain ResearchLaboratory (GRL). These samples represented individualproducer samples. Again, the CGC Industry Services Divisiongraded these samples. A total of 330 samples of Laird lentilsreceived from 1998 crop were scanned.
For the 1999 crop, 689 samples of Laird lentils werereceived. These samples were scanned immediately after visualinspection at the Industry Service Division, CGC office inSaskatoon, Saskatchewan. Image features extracted from thesesamples were exclusively used for performance verification of the system developed with data from the 1998 crop. Table 1shows the number of samples representing different color gradesfor each year.
According to CGC guidelines, lentils arecategorized into four color-classes: ‘Good NaturalColor (GNCLR)’, ‘Reasonably Good Color(RGCLR)’, ‘Fair Color (FRCLR)’ and ‘Poor Color(PRCLR)’. Due to fewer number of samplesrepresenting FRCLR and PRCLR color gradesavailable during the 1998-99 period, these two colorgrades were collectively graded as “Fair-to-PoorColor” (F2PCLR; grade 3).
Hardware and software
The vision system’s hardware consisted of a flatbedscanner (ScanMaker III, Microtek, Denver, CO), apersonal computer with Pentium CPU (200 MHz),
scanner interface card, and a color monitor for online imagedisplay. The software consisted of a TWAIN-compliant scannercontroller (ScanWizard version 2.52, Microtek, Denver, CO) forimage acquisition and an image processing software (KS-400version 3.0, Carl Zeiss Vision, Germany) for image analyses.The imaging software offered a multitude of built-inmeasurement parameters from which to choose.
Image acquisition
Several different approaches of presenting the sample to thescanner bed were evaluated. The method selected incorporateda sample holder machined in a clear plastic. The sample holder(200 mm by 200 mm by 20mm) covered the width of thescanner bed. A non-reflecting black sheet covered the remainderof the scanner bed. For imaging, a thoroughly mixed sample waspoured into the middle of the sample holder. A gentledownward push at the top of the seed heap caused the grains tocover the entire bottom surface of the sample holder with mostgrains laying flat. Images were captured in a variety of scenariosincluding room lighting, room lights off and the exclusion of room light from the scanner. Limiting or removing the effects of room lighting had no effect on the image features. The imagecapture system was therefore used on a bench with ambient
room light. This contrasted dramatically with the configurationthat would have been required if a color camera had beenselected. With a camera, ambient illumination is very critical forreproducible imaging.
For each of the samples, a 512 by 512 pixel image wascaptured at 100 dpi (dots per inch) from the center of the fieldof view for later analyses. The size of the window and spatialresolution were determined on the basis of preliminaryexperiments as discussed later under results. A macro written inthe imaging software controlled the scanner through a TWAINinterface.
Image analysis and feature selection
In grading lentils, color is evaluated after the removal of stained,damaged, and peeled or split seeds. Therefore, image areascorresponding to damaged and split seeds were segmentedbefore measuring image features indicative of the color grade.Damaged lentils could be distinctly green or dark brown in colorthat would stand out in the red-green-blue (RGB) color domain.Due to the wide range of color characteristics of damagedlentils, histogram-based dynamic threshold in the RGB domainwas used to segregate highly contrasting seeds in the image.Morphological opening was used to ‘clean up’ the binary image.Split seeds (yellow) were segregated using fixed threshold

8/3/2019 M.a Sahin Et.al 2001,A Machine Vision Systems for Grading Lentils
http://slidepdf.com/reader/full/ma-sahin-etal-2001a-machine-vision-systems-for-grading-lentils 3/8
Volume 43 2001 CANADIAN BIOSYSTEMS ENGINEERING 7.9
values in the hue-light-saturation (HLS) domain. Image areascorresponding to damaged and split seeds were subtracted fromthe original image before measuring the features of interest.
Color and uniformity of color were considered the keydeterminants of the color grade. Hence, the basic statistics(mean, minimum, maximum, and variance) for the RGB andHLS channels were recorded as the measures of the base colorof the sample. Color histograms (R and G channels) and imagetexture parameters (Haralick et al. 1973) were measured as the
measures of color uniformity and overall appearance of thesample. Also, image areas proportional to green and pink seedswere measured to represent good and oxidized seeds in thesample, respectively. Approximately 100 image features wereextracted from each sample image based on experience andcommon sense.
For the 1998 crop year, features extracted from images of all330 samples were stored in a data set along with the respectivevisual color grades assigned by CGC inspectors. The entire dataset was used for selecting significant features based on theircontribution towards the desired classification. The SASprocedure STEPDISC was used for feature selection (SAS1997). The Wilk’s lambda and the average-squared-canonical-
correlation (ASCC) were used as the criteria of significance.The data set was then reduced to contain only 25 features(picked by the selection procedure) along with the assignedcolor grades. This reduced data set from the 1998 crop wassubdivided into a training set and a test set through randomassignments. The training set (consisting of 60 samples of GNCLR, 70 samples of RGCLR and 33 samples of F2PCLR)was used to develop the color models (classifiers). Whereas, thetest set (consisting of 54 samples of GNCLR, 76 samples of RGCLR, and 37 samples of F2PCLR) was used to evaluate theperformance of the classifier models. The data from the 1999crop samples was used for cross validation of the classifiermodel developed with the data from the 1998 crop samples.
ClassificationThe selected image features were evaluated for their ability topredict lentil grade by color. Three different color classifierswere built (trained) using the training set. The lineardiscriminant analysis (LDA) and non-parametric (NPAR)classifiers were trained using the SAS procedure DISCRIM(SAS 1997) while a multilayer neural network (MNN) wastrained by using a dedicated neural network software package(Propagator, ARD, Columbia, MD).
For the LDA model, equal prior probability for all the colorgrades was assumed to avoid classification bias. The NPARmodels were developed using k-nearest neighbors where k wasvaried from 3 to 10. For the MNN models, 3-layered, single-output fully connected architecture was used. The input layerconsisted of 25 neurons (equal to the number of input variables)with a linear transfer function. Five neurons were used in thehidden layer based on trial-and-error. The sigmoid (logistic)transfer function was used for the hidden and output layers. The25-5-1 neural network was trained using the error-back-propagation method with the patterns in the training setpresented in a random fashion. The weights were adjusted usingthe generalized delta rule and training was stopped when theweights were not updated for 1000 epochs. Using a learning rate
of 0.3 and momentum of 0.5, it took approximately 2 minutes totrain on a Pentiun II processor.
After training, all three classifiers were evaluated using thetest data set that was independent of the training data. In eachcase, the classifier’s outcome was compared with the knownvisual grade, and performance of the classifier was judged basedon accuracy of prediction. The best of the three classifiers waspicked for the online system.
Online grading systemThe classifier with the highest correct classification on the testset was implemented by writing a macro-language subroutinewithin the imaging software. This program scanned the sample,measured 25 image features as determined by the selectionprocedure, assigned a color grade, and displayed the results asan integrated application. The classification accuracy of thisonline system was evaluated by scanning 689 samples drawnfrom the 1999 crop. Also, the average time required to gradeindividual samples was determined from ten time-measurements.
RESULTS and DISCUSSION
Scanner evaluationImages in Fig. 1 (a-c) represent color scans of characteristiclentil samples of different grades. The visual color andappearance of these images are distinctly different from oneanother, however, in reality samples have appearances that spanthe continuum. Seeds with different colors – green, pink, yellow,and brown – are obviously identifiable. This visually confirmsthe ability of the flatbed scanner to detect color variationsamong lentil samples of different grades.
The scanner’s consistency and repeatability was tested bycomparing values of individual color channels measured fromimages of the same lentil sample acquired over a number of days. The sample poured at day one was kept undisturbed
throughout the length of the experiment to ensure that theimages compared were consistent. Standard color charts werenot used because relatively small color drifts within the narrowcolor band of lentils might not be clearly seen due to the broadcolor band of the color charts. For a fifteen-day period, thevalues of the R, G, and B components were consistent (Fig. 2).Any drifts in values were within acceptable instrument variationand less than the drift recorded for color camera systems inother projects in the same laboratory. This confirms that theflatbed scanner being used generates repeatable colorinformation and may be a good alternative to video cameras forquantitative imaging.
The time taken to scan an image is directly related to bothsize and spatial resolution within the image. The objective for
rapid image processing is to gather sufficient information toallow the classifier to produce accurate predictions. Excessiveamounts of information that do not improve the classifier slowthe imaging process due to data volume. Size and resolution of the image control data volume that in turn affects the processingtime.
When the color information contained in images of differentsize (512 x 512, 700 x 700, and 780 x 780 pixels) wascompared at a single resolution of 100 dpi, image size was

8/3/2019 M.a Sahin Et.al 2001,A Machine Vision Systems for Grading Lentils
http://slidepdf.com/reader/full/ma-sahin-etal-2001a-machine-vision-systems-for-grading-lentils 4/8
LE GÉNIE DES BIOSYSTÈMES AU CANADA SHAHIN and SYMONS7.10
(a) Good natural color
(b) Reasonably good color
(c) Fair-to-poor color
Fig. 1. Images of lentil samples with different color
grades: (a) grade 1, (b) grade 2, and (c) grade3.
Fig. 3. Effect of image size on image color features.
0
50
100
150
512x512 700x700 780x780
Image size (pixel)
G r a y v a l u
MeanR MeanG MeanB
Fig. 2. Scanner repeatability: variation in color features
over time.
0
50
100
150
1 2 3 4 5 6 7 8 9 10 11 12 13 14 15
Observation day
G r a y v a l u e
MeanR MeanG MeanB
found not to affect the color information (Fig. 3). The smallestsize of 512 x 512 pixels image was selected for furtherevaluation. Images smaller than 512 x 512 pixels were not
considered suitable because the sample area captured by smallerimages would not be representative of the sample. Also, thenumber of pixels per seed for smaller seeded varieties would notprovide sufficient accuracy for planned size measurements.
Similarly, when color information in 512 x 512 pixel imageswas compared at resolutions of 100, 200, and 300 dpi, nosignificant difference between image resolution was found(Fig. 4). For the fastest image processing the lowest resolutionof 100 dpi was selected. Scanning at a resolution lower than 100dpi was not supported with the scanner used. More importantly,imaging at lower than 100 dpi might not capture stain damagewhere a part of the seed is discolored.
Image analysis and feature selection
In visual color grading of lentils, damaged and peeled seeds arephysically removed out of samples prior to color assessment of the remaining sample. This segregation was accomplishedthrough image processing rather than physical separation priorto color analysis (Fig. 5). Histogram based color segmentationfollowed by morphological opening successfully segregated thedamaged seeds. Both the dark tan and distinctly green seedswere identified in one operation that would otherwise require atleast two threshold operations. However, partially occluded

8/3/2019 M.a Sahin Et.al 2001,A Machine Vision Systems for Grading Lentils
http://slidepdf.com/reader/full/ma-sahin-etal-2001a-machine-vision-systems-for-grading-lentils 5/8
Volume 43 2001 CANADIAN BIOSYSTEMS ENGINEERING 7.11
Fig. 4. Effect of image resolution on image color features.
0
50
100
150
100 200 300
Resolution (dpi)
G r a y v a l u e
MeanR MeanG MeanB
(a) Original image (c) Splits or peeled (yellow) seeds
(b) Damaged (dark brown) seeds (d) Original minus splits and damaged
Fig. 5. Separation of damaged and peeled seeds by color segmentation.
seeds (green or tan) in some images were also picked asdamaged seeds due to shadowing effect. It was not possible toavoid these darker areas from being recognized as damage.Even the fixed thresholds failed to discriminate among damagedand occluded seeds. Removal of these darker areas from theimage may be considered positive as far as color assessment isconcerned, however, it could affect the overall grade based on
excessive damage. A little care in pouring the sample in the
sample holder can minimize “voids” in the image. Incomparison, difference can be found between inspectors in theirassessment of these characteristics. Overall, there was a verygood agreement between visual and machine vision detection.The histogram based approach was chosen since there is noexplicit definition of desired color. This varies according tovariety and seed size. The apparent uniformity in appearance is,however, critical and the ‘non-desirable’ seeds are relative to thesound color base of each sample.
Segmentation using fixed threshold values in the HLSdomain was successful in segregating splits or peeled seeds.Approximately all of the peeled seeds were segregated – onlythe occluded peeled seeds were missed; but, some discoloredseeds (seeds with a yellowish tint or yellow-green to light browncolor in some samples) were also picked as yellow ones due tooverlapping spectral boundaries. Overall, the segmentationprocess removed more than 95% of the damaged and peeledseeds as compared to the CGC inspectors. However, removal of discolored seeds as peeled may lead to misclassification of somesamples of lower quality where these factors predominate.Separation of damaged and peeled seeds was a big step towardtrue color assessment of samples. This would allow forupgrading of samples having good color downgraded due toother factors such as damaged, diseased, or peeled seeds.
The imaging software in which theapplication was developed has amultitude of measurement parameters.For each new set of measurementfeatures, a statistical discriminantmodel was developed and thepredicted outcomes of the training dataevaluated. The features consideredincluded proportional areas of thesegmented image corresponding togreen and oxidized seeds, overallimage color (RGB and hue statistics),
color histograms (reduced to 32 graylevels), and texture features (Haralickcoefficients). The selection procedurefound 25 image features (out of 100tested) as significant contributorstowards the desired classificationbased on decrease in the Wilk’slambda and increase in the ASCC.Selection and ranking of these featureswould depend on a number of factors:1) make and model of the scannerused, 2) scanner settings, 3) imaginglibrary used for image analysis, 4) whograded the samples, and so on. Whilethe selected features may varydepending upon the image gatheringand image analysis circumstances, theprocedure outlined here providessufficient details for any one familiarwith image analysis and statisticaltechniques to select appropriatefeatures for a given application.

8/3/2019 M.a Sahin Et.al 2001,A Machine Vision Systems for Grading Lentils
http://slidepdf.com/reader/full/ma-sahin-etal-2001a-machine-vision-systems-for-grading-lentils 6/8
LE GÉNIE DES BIOSYSTÈMES AU CANADA SHAHIN and SYMONS7.12
Table 2. Classification results using the Linear Discriminant Analysis (LDA)
model on the test data set (number of samples predicted into color).
Into color Total(actual)
Accuracy(%)
False alarm(%)
From color GNCLR RGCLR F2PCLR
GNCLRRGCLRF2PCLR
5080
4683
00
34
547637
938992
1490
Total (P) 58 75 34 167 91 9
GNCLR - Good natural colorRGCLR - Reasonably good colorF2PCLR - Fair-to-poor colorActual - By visual inspectionP - Predicted
Table 3. Classification results using the Non-Parametric Analysis (NPAR)
model on the test data set (number of samples predicted into color).
Into color Total
(actual)
Accuracy
(%)
False alarm
(%)From color GNCLR RGCLR F2PCLR
GNCLRRGCLRF2PCLR
52150
2613
00
34
547637
968092
2280
Total (P) 67 66 34 167 88 12
GNCLR - Good natural colorRGCLR - Reasonably good colorF2PCLR - Fair-to-poor colorActual - By visual inspectionP - Predicted
Table 4. Classification results using the Multilayered Neural Network (MNN)model on the test data set (percent classified into color).
Into color Total(actual)
Accuracy(%)
False alarm(%)
From color GNCLR RGCLR F2PCLR
GNCLRRGCLRF2PCLR
5180
3652
03
35
547637
948695
1478
Total (P) 59 70 38 167 90 10
GNCLR - Good natural color
RGCLR - Reasonably good colorF2PCLR - Fair-to-poor colorActual - By visual inspectionP - Predicted
Classification
Three different kinds of classification model (LDA, NPAR, andMNN) were developed and tested for predicting color grades of lentils. The model that performed best was picked fordeveloping the online grading system.
The best results for the LDAclassifier are given in Table 2. The LDAclassifier correctly classified 152 out of 167 samples in the test set. Hence, anoverall prediction accuracy of 91% wasachieved on the test set (93% on thetraining set). In every case of misclassification, the color gradepredicted was consistently biased
towards one of the adjacent colorgrades. Overall, 2.4% of the samples (4out of 167) were downgraded while6.6% of the samples (11 out of 167)were upgraded. Grade-by-gradeaccuracy of 93, 89, and 92% wasobserved for GNCLR, RGCLR, andF2PCLR, respectively. Purity of thepredicted classes was determined by thefalse alarm. For example, 8 of the 58samples (14% false alarms) predicted asGNCLR were actually RGCLR. ForRGCLR, 9% of the samples were falselyclassified into this color class. When
comparing the classification modelsdeveloped and their respective accuracy,it has to be considered in comparison tothe reference method. While thereference method is the best availableand represents accepted tradingcharacteristics, it is subject to error. Thevisual reference method through variouslegislated appeal processes typicallyneeds to re-inspect a substantial numberof samples every crop season. Duringre-inspection, the grades on a number of samples may change. Data on theappealed samples were not accessiblefor comparison with the machine visionsystem.
Discriminant models can also bedeveloped using non-parametric(NPAR) statistics. Non-parametricstatistics offer a method to evaluate datawhen the contributions of the measuredfeatures to the discriminant model arenot linear. For the NPAR classifier,overall accuracy of 88% was found onthe test set (96% on the training set)(Table 3). This classifier gave noadvantages over the LDA classifier.
Overall, 1.2% of the samples (2 out of 167) were downgraded while 10.8% of the samples (18 out of 167) wereupgraded. Grade-by-grade accuracy of 96, 80, and 92% was observed for
GNCLR, RGCLR and F2PCLR, respectively. False alarms forGNCLR and RGCLR were 22 and 8%, respectively.
Neural networks offer a fast alternative to discriminantmodels. They can be developed using both linear and non-linearcharacteristics within a single model. The multilayer neural
8/3/2019 M.a Sahin Et.al 2001,A Machine Vision Systems for Grading Lentils
http://slidepdf.com/reader/full/ma-sahin-etal-2001a-machine-vision-systems-for-grading-lentils 7/8
Volume 43 2001 CANADIAN BIOSYSTEMS ENGINEERING 7.13
Fig. 6. Comparison of classification results using linear
discriminant analysis (LDA), non-parametric
(NPAR), and neural network (MNN) classifier
models.
9193
8992
88
96
80
9290
94
86
95
50
60
70
80
90
100
OVERALL GNCLR RGCLR F2PCLR
Color grade
A c c u r a c y ( % )
LDA NPAR MNN
Table 5. Classification results for the online grading system with MNN classifier
on the 1999 crop (number of samples predicted into color).
Into color Total(actual)
Accuracy(%)
False alarm(%)
From color GNCLR RGCLR F2PCLR
GNCLR
RGCLRF2PCLR
567
310
20
472
0
022
587
7824
97
6092
5
320
Total (P) 598 69 22 689 92 8
GNCLR - Good natural colorRGCLR - Reasonably good colorF2PCLR - Fair-to-poor colorActual - By visual inspectionP - Predicted
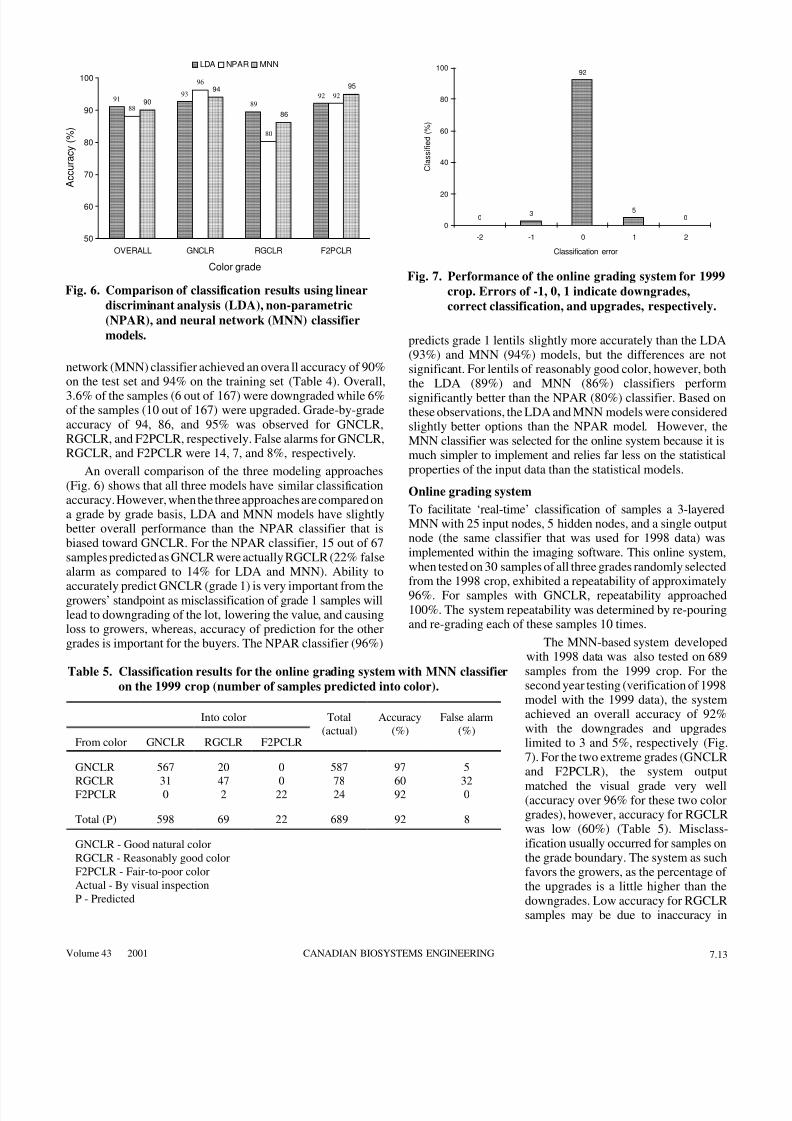
Fig. 7. Performance of the online grading system for 1999
crop. Errors of -1, 0, 1 indicate downgrades,
correct classification, and upgrades, respectively.
network (MNN) classifier achieved an overall accuracy of 90%on the test set and 94% on the training set (Table 4). Overall,
3.6% of the samples (6 out of 167) were downgraded while 6%of the samples (10 out of 167) were upgraded. Grade-by-gradeaccuracy of 94, 86, and 95% was observed for GNCLR,RGCLR, and F2PCLR, respectively. False alarms for GNCLR,RGCLR, and F2PCLR were 14, 7, and 8%, respectively.
An overall comparison of the three modeling approaches(Fig. 6) shows that all three models have similar classificationaccuracy. However, when the three approaches are compared ona grade by grade basis, LDA and MNN models have slightlybetter overall performance than the NPAR classifier that isbiased toward GNCLR. For the NPAR classifier, 15 out of 67samples predicted as GNCLR were actually RGCLR (22% falsealarm as compared to 14% for LDA and MNN). Ability to
accurately predict GNCLR (grade 1) is very important from thegrowers’ standpoint as misclassification of grade 1 samples willlead to downgrading of the lot, lowering the value, and causingloss to growers, whereas, accuracy of prediction for the othergrades is important for the buyers. The NPAR classifier (96%)
03
92
50
0
20
40
60
80
100
-2 -1 0 1 2
Classification error
C l a s s i f i e d ( % )
predicts grade 1 lentils slightly more accurately than the LDA(93%) and MNN (94%) models, but the differences are notsignificant. For lentils of reasonably good color, however, boththe LDA (89%) and MNN (86%) classifiers performsignificantly better than the NPAR (80%) classifier. Based onthese observations, the LDA and MNN models were consideredslightly better options than the NPAR model. However, theMNN classifier was selected for the online system because it ismuch simpler to implement and relies far less on the statisticalproperties of the input data than the statistical models.
Online grading system
To facilitate ‘real-time’ classification of samples a 3-layeredMNN with 25 input nodes, 5 hidden nodes, and a single outputnode (the same classifier that was used for 1998 data) wasimplemented within the imaging software. This online system,when tested on 30 samples of all three grades randomly selectedfrom the 1998 crop, exhibited a repeatability of approximately96%. For samples with GNCLR, repeatability approached100%. The system repeatability was determined by re-pouringand re-grading each of these samples 10 times.
The MNN-based system developedwith 1998 data was also tested on 689samples from the 1999 crop. For thesecond year testing (verification of 1998model with the 1999 data), the systemachieved an overall accuracy of 92%with the downgrades and upgradeslimited to 3 and 5%, respectively (Fig.7). For the two extreme grades (GNCLRand F2PCLR), the system output
matched the visual grade very well(accuracy over 96% for these two colorgrades), however, accuracy f or RGCLRwas low (60%) (Table 5). Misclass-ification usually occurred for samples onthe grade boundary. The system as suchfavors the growers, as the percentage of the upgrades is a little higher than thedowngrades. Low accuracy for RGCLRsamples may be due to inaccuracy in

8/3/2019 M.a Sahin Et.al 2001,A Machine Vision Systems for Grading Lentils
http://slidepdf.com/reader/full/ma-sahin-etal-2001a-machine-vision-systems-for-grading-lentils 8/8
LE GÉNIE DES BIOSYSTÈMES AU CANADA SHAHIN and SYMONS7.14
detecting peeled (yellow) seeds as discussed earlier. Exclusionof yellowish green or light brown seeds from the image wouldessentially make the borderline RGCLR samples appear asGNCLR. It is expected that improvements in accuracy of detecting peeled seeds would enhance the system performance.
Overall, the online system performed very well on samplesfrom both crop years. The MNN classifier developed with the1998 samples also worked well for the 1999 samples without re-training. This demonstrates the robustness and universality of
the machine vision system developed. This system takes about23 seconds, on the average, to grade one sample. The most timeconsuming part is scanning that takes about 20 seconds. Imageprocessing and decision making only takes 3 seconds (withimage displays) which could possibly be reduced to less than 1second without displaying intermediate steps.
These results show a very strong potential for predictinglentil color and grade using an inexpensive and portablemachine vision system. The machine vision software andclassifier can be implemented on a laptop computer. Althoughdifferent makes and models of scanners exhibit huge variationsin terms of color distribution of the scanner-generated images,scanner matching is possible (Shahin and Symons 2000). Thus,
the currently used large and high quality scanner could bereplaced by a smaller and less expensive model providing onlythe level of information required for lentil classification. Thiswould allow a cost-effective solution to be provided to a widevariety of users, ranging from producers through grain elevatorsto the Canadian Grain Commission. The consistency andrepeatability of this approach to grain grading, eliminating thepersonal bias between buyer and seller, would put grain tradingon an even platform. While the grade provided mayoccasionally be in error, the machine vision system will give aconsistent response. This alone is advantageous to the grower.
CONCLUSIONS
This research has demonstrated that a flatbed scanner basedmachine vision system can be used for grading lentils by color.Based on the results of this study, the following conclusions canbe drawn:
1. A flatbed scanner may be used as an alternative imagingsystem to detect color variations associated with differentgrades of lentils.
2. Image analyses techniques provided useful image featuresrelated to sample grade. Color and texture features weregood predictors of the color grade.
3. Statistical and neural classification approaches achievedcomparable results. The online grading system with a neuralclassifier achieved over 90% prediction accuracy.
ACKNOWLEDGMENTS
The authors thank the Saskatchewan Pulse Growers and PulseCanada for funding this research. The Industry Service Divisionof Canadian Grain Commission is thanked for providing lentilsamples. Special thanks to Mr. Jamison Lorne for his help in re-inspection of the samples.
REFERENCES
Al-Janobi, A.A. and G. Kranzler. 1994. Machine visioninspection of date fruits. ASAE Paper No. 94-3575. St.Joseph, MI: ASAE.
Anonymous. 1998. Official Grain Grading Guide. Winnipeg,MB: Canadian Grain Commission.
Haralick, R.M., R. Shanmugan and I. Dinstein.1973.Texturalfeatures for image classification. IEEE Transactions of
Systems, Man and Cybernetics SMC-3(6): 610-621.Hehn, J.L. and S. Sokhansanj. 1990. Canola and mustard seed
identification using Macintosh based imaging system. ASAEPaper No. 90-3534. St. Joseph, MI: ASAE.
Kodaira, K., H. Nakata and M. Takamura. 1991. An applesorting system using neural network-based imageprocessing. 2nd Neural Network Society Meeting, Center forNeural Nets Society, Kink’s College, London, England.
Marchant, J., C. Onyango and M. Street. 1990. Computer visionfor potato inspection without singulation. Computers and Electronics in Agriculture 4(3): 235-244.
Patel, V.C., R.W. McClendon and J.W. Goodrum. 1996.Detection of cracks in eggs using color computer vision and
artificial neural networks. AI Applications 10(3): 19-28.Reid, T.F., C. Kim and M.R. Paulsen.1991. Computer vision
sensing of stress cracks in corn kernels. Transactions of theASAE 34(5): 2236-2244.
SAS. 1997. Multivariate Statistical Methods: Practical Applications. Cary, NC: SAS Institute Inc.
Shahin, M.A. and S.J. Symons. 1999. A machine vision systemfor color classification of lentils. ASAE Paper No. 99-3202.St. Joseph, MI: ASAE.
Shahin, M.A. and S.J. Symons. 2000. Comparison of scannersfor grain grading by image analysis. ASAE Paper No. 00-3096. St. Joseph, MI: ASAE.
Shahin, M.A. and E.W. Tollner. 1998. A computer vision
system for sorting apples. ASAE Paper No. 98-3025. St.Joseph, MI: ASAE.
Shahin, M.A., E.W. Tollner, R. Gitaitis, D. Sumner and B.Maw. 1999. Classification of onions based on internaldefects using image processing and neural networktechniques. ASAE Paper No. 99-3165. St. Joseph, MI:ASAE.
Shearer, S.A. and F.A. Payne. 1990. Color and defect sorting of bell peppers using machine vision. Transactions of theASAE 33(6): 2045-2050.
Singh, N., M.J. Delwiche and R.S. Johnson. 1993. Machinevision algorithms for defect grading of stonefruit. ASAEPaper No. 93-3005, St. Joseph, MI: ASAE.
Strachan, N.J.C. 1993. Length measurement of fish by computervision. Computers and Electronics in Agriculture 8(2): 93-104.
Winter, P.W. 1997. Pattern recognition of lentil seeds usingmachine vision and neural networks. Unpublished M.Sc.thesis. Saskatoon, SK: University of Saskatchewan.
Zayas, I., H. Converse and J. Steel. 1990. Discrimination of whole from broken corn kernels with image analysis.Transactions of the ASAE 33: 1642-1646.