Embed Size (px)
Citation preview

1694 Technical Gazette 26, 6(2019), 1694-1699
ISSN 1330-3651 (Print), ISSN 1848-6339 (Online) https://doi.org/10.17559/TV-20190528192618 Original scientific paper
Machine Learning Classification of Cervical Tissue Liquid Based Cytology Smear Images by Optomagnetic Imaging Spectroscopy
Igor HUT, Branislava JEFTIC, Lidija MATIJA, Zarko COJBASIC, Djuro KORUGA
Abstract: Semi-automated system for classification of cervical smear images based on Optomagnetic Imaging Spectroscopy (OMIS) and machine learning is proposed. Optomagnetic Imaging Spectroscopy has been applied to screen 700 cervical samples prepared according to Liquid Based Cytology (LBC) principles and to record spectra of the samples. Peak intensities and peak shift frequencies from the spectra have been used as features in classification models. Several machine learning algorithms have been tested and results of classification have been compared. Results suggest that the presented approach can be used to improve standard LBC screening tests for cervical cancer detection. Developed system enables detection of pre-cancerous and cancerous states with sensitivity of 79% and specificity of 83% along with AUC (ROC) of 88% and could be used as an improved alternative procedure for cervical cancer screening. Moreover, this can be achieved via portable apparatus and with immediately available results. Keywords: cervical cancer; classification; LBC; machine learning; OMIS; screening
1 INTRODUCTION
Cervical cancer is the fourth most common cancer in women worldwide with 528,000 new cases and the second most common cancer in less developed regions (445,000 cases). Approximately 87% of estimated 266 000 cervical cancer deaths in 2012 occurred in less developed countries [1]. With regular appointments and access to the accurate screening tests, precancerous lesions can be detected beforehand and treated successfully. First cytology-based test that was implemented in national screening programs in developed countries was Papanicolaou test. Despite low sensitivity, Papanicolaou test succeeded in reduction of cervical cancer incidence and mortality over the past 50 years. In the meantime, persistent HPV infection was recognized as necessary cause of cervical cancer, thus FDA (Food and Drug Administration) acknowledged Human Papillomavirus (HPV) DNA test as primary screening test. However, HPV DNA test cannot decide if the infection is persistent or transient and could lead to overtreatment in women younger than 30 years. This is the reason why HPV DNA test is recommended to be used in co-testing with cytology [2, 3]. Since 2006, HPV vaccine has been introduced as part of the national health immunization programs in many countries, mostly in high and upper-middle income settings. Still, developing countries which would have the most interest in HPV vaccination programs, do not have access to HPV vaccines [4]. Over the past decades, there were many attempts to develop automated screening systems that would lower the cost and improve the accuracy of existing screening tests for cervical cancer detection [5-10]. These systems are mainly based on automated inspection of the cytology samples and classification of cervical smear images into the healthy/abnormal group. Problems associated with proper segmentation of the sample image and extraction of the highly significant features such as cytoplasm and nucleus size, shape, nucleus/cytoplasm ratio, color and texture are still subjected to consideration in many scientific studies [11-14]. The approach of automated cancer detection is aimed to reduce the workload of pathologist and to exclude human error in diagnosis that arises from the labor-intensive task of manual screening. In this study, cervical
sample analysis by spectroscopy and machine learning classification methods have been combined in order to classify cervical samples in semiautomatic manner. Sample spectra have been obtained by Optomagnetic Imaging Spectroscopy (OMIS), which is easy to use, fast and inexpensive [15]. Previous studies reported high accuracy of OMIS in detection of abnormal cervical samples prepared according to conventional Papanicolaou procedure, as well as in detecting colon cancer [16-19]. Here, classification results for LBC samples, obtained by selected supervised learning algorithms have been compared, in order to investigate whether improved sample preparation method, i.e. LBC affects the accuracy of cervical cancer detection by OMIS. 2 MATERIALS AND METHODS 2.1 Materials
In cooperation with Tumour Trace Ltd, UK, and
Tumour Trace d.o.o, Serbia, a total of 700 LBC smears were collected in two separate studies. First study "Classification of cervical samples" was conducted at Southend University Hospital, UK, in October 2015, while the second study "Testing three different devices on cervical samples" was conducted at Oncquest Laboratories in New Delhi, India, in February 2016. Liquid Based Cytology procedure instructs that both samples from endocervix and exocervix are collected and placed into the vial with the preserving liquid, transported to the laboratory where the sample is processed, placed on the microscopic slide and stained. All samples are examined by standard histopathology procedure and classified in five categories: negative, moderate, high grade squamous intraepithelial lesion (HSIL), dysplasia and cancer. LBC samples were subjected to analysis with OMIS and optomagnetic spectra were obtained for every sample. For the purpose of resolving the binary classification problem considered in this paper LBC samples were divided into two groups: first group consisted of 354 cases (Negative cases) and second group consisted of 346 cases (202 moderate dysplasia (MD) cases, 54 HSIL cases, 63 severe dysplasia (SD) cases and 27 cancer cases).

Igor HUT et al.: Machine Learning Classification of Cervical Tissue Liquid Based Cytology Smear Images by Optomagnetic Imaging Spectroscopy
Tehnički vjesnik 26, 6(2019), 1694-1699 1695
2.2 Optomagnetic Imaging Spectroscopy Optomagnetic Imaging Spectroscopy (OMIS) is a
technique used to observe differences in the tissue properties based on unpaired and paired electrons and hydrogen bonds. Based on light-matter interaction between diffuse visible and reflected polarized light and sample, OMIS identifies average energy state of valence electrons and hydrogen bonds within the sample material. The fact that the magnetic force of matter is four orders of magnitude closer to quantum state of matter than the electrical force, used as starting point in this approach, detection of the conformational states and changes in the matter at nanoscale level is enabled [15]. The process of scanning the sample with OMIS involves shining white diffuse light on the sample, which interacts with the valence electrons to produce a measure of the molecules’ electrical and magnetic forces. The sample is first exposed to white diffuse light perpendicular to the sample and then to the white diffuse light under the Brewster angle (Fig 1). The white diffuse light interacts with the valence electrons and by capturing and analyzing digital images of the sample in these two modes, changes in spectral fingerprint of the sample can be detected.
Figure 1 Scanning of an LBC smear sample via OMIS: a) Image of the sample under white diffuse light, b) Image of the sample alighted with diffuse white light under the Brewster angle, c) Cropped image a) used for analysis, d) Cropped
image b) used for analysis.
2.3 Classification
We have made a comparison of results obtained by several, sophisticated, machine learning algorithms implemented in R, a free programming language and environment for statistical computing and graphics [20], by the following packages: "glmnet" (i.e. generalized linear model fitted via penalized maximum likelihood), "rf" (Random Forests), "gbm" (gradient boosting machines), "adaboost" (adaptive boosting), "svm" (support vector machines), "xgboost" (extreme gradient boosting). This was done through utilization of R’s "caret" (short for _C_lassification_A_nd_RE_gression_T_raining) package, which acts as a unification framework for more than 200 algorithms, implemented in different R packages [21]. Such framework allows easy construction of plethora of models, simplified tuning of their parameters, and consistent testing and comparison of their performance. A
brief, general overview of utilized algorithms and libraries is presented.
"Glmnet" is a package authored by Jerome Friedman, Trevor Hastie, Rob Tibshirani and Noah Simon, while the R package itself is maintained by Trevor Hastie [22]. It fits a generalized linear model via penalized maximum likelihood. "Glmnet" exploits, the so called, elastic net models which utilize both ridge and lasso regression. In essence "glmnet" solves the following problem:
( )T01, 0
22
1
1min ,
(1 )2
Ni i ii w l y x
Nβ ββ β
βλ α α β
=+ +
+ − +
∑ (1)
where 𝜆𝜆 is a tuning parameter which takes values over a grid covering the entire range and controls the overall strength of the penalty. The argument 𝛼𝛼 determines what type of model is fit. If α = 0 a ridge regression model is fit, and vice versa if α = 1 a lasso model is fit, in other word the elastic-net penalty is controlled by α, and variation of α bridges the gap between ridge and lasso. The "glmnet" implementation is extremely fast, partially because it cleverly exploits sparsity, if present, in the input matrix x. Support vector machine (SVM) is a well-known and established supervised learning approach primarily used for classification developed in early 1990s [23, 24]. SVM is a generalization of a relatively simple classifier known as maximal margin classifier. Maximal margin classifier can be used only for the cases where classes are separable by a linear boundary. By the utilization of the, so called, kernel trick (implicitly mapping its inputs into high-dimensional feature space), SVM also enables successful classification in the case of non-linear class boundaries. It can be noticed that several ensemble methods have been applied, that are based on building a large number of "weak" learners, i.e. decision trees, in conjuncture with bagging (bootstrap aggregating) or boosting techniques, namely Random Forests, gradient boosting machine, AdaBoost and XGBoost. Random Forests exploit bagging, while the rest, as it is implied by their names, utilize boosting. In a nutshell both bagging and boosting enable a large set of weak learners to be combined such that a strong learner is obtained with better performance than a single one. Main sources of error in machine learning are noise, bias and variance. Ensemble techniques help in minimizing the influence of such determinants, especially variance. They improve stability and accuracy of base learning algorithms [25, 26]. All above mentioned algorithms were used for binary classification of the cervical smear samples, with one class marked as "Negative", indicating negative test result, i.e. absence of abnormal cells, and the other as "Positive", indicating the positive test result, i.e. presence of abnormal cells in the smear. Further, two datasets have been used for model training. One comprised all features in the OMIS diagram, i.e. 256 intensity values across all samples, and the other contained manually engineered feature set for all samples. Based on multiple trials and our previous experience regarding classification of OMIS diagrams, 7 engineered features have been chosen, namely: (1)

Igor HUT et al.: Machine Learning Classification of Cervical Tissue Liquid Based Cytology Smear Images by Optomagnetic Imaging Spectroscopy
1696 Technical Gazette 26, 6(2019), 1694-1699
maximum intensity value, (2) position of the maximum (i.e. its abscissa on the OMIS diagram), (3) minimum intensity value, (4) position of the minimum, (5) AUC (area under the curve) for positive values of the OMIS diagram, (6) AUC for negative values of the OMIS diagram and (7) the ratio of these two AUC values. In order to provide comparability of results and overall reproducibility of the analysis the number of parameters has been fixed for all models, i.e. number of cross-validation folds, the resampling method and performance summaries. Evaluation of models was performed by 10-fold cross-validation repeated 10 times, utilizing bootstrap resampling scheme. Performance scores that were used as basis for model evaluation and selection as well as inter model comparison are area under the ROC (receiver operating characteristic) curve (AUC), sensitivity and specificity. Further, an attempt has been made to improve performance of classification by making explicit use of ensembles. Based on results of several trials with different combinations of before mentioned algorithms, simple ensemble of gbm and Random Forest models have been selected, using linear greedy optimization on AUC. For this purpose, "caretEnsamble" R package was used [27]. To speed up the training process parallel processing has been enabled by utilization or R’s "doParallel" package, more precisely we used 6 "workers" on a MacBook Pro with 2,2 GHz Intel Core i7 and 16 GB 1600 MHz DDR3. 3 RESULTS Cervical cytological samples were first screened with Optomagnetic Imaging spectroscopy and as a result, optomagnetic spectra were gathered for all considered cervical samples. Following values from the spectra were used as feature sets in classification problems: maximum peak intensity values, wavelengths where maximum peaks occur, minimum peak intensity values, wavelengths where minimum peaks occur, area under the positive peaks, area under the negative peaks and AUC ratio of positive and negative peaks. Spectra obtained for LBC sample groups: HSIL, MD and SD, differ in terms of the positive and negative peak intensities, as well as in the terms of the wavelength differences where peaks occur (Fig. 2). If positive peaks in the spectra are observed, a significant shift in the case of positive peak occurrence can be detected (positive peaks are detected on 111,117 nm, 113,614 nm and 115,341 nm in the spectra obtained for HSIL, MD and SD respectively). Spectra of the normal and cancer samples differ in the terms of the maximum positive and negative peak intensities: absolute values of the maximum positive and negative peaks are lower, in the spectra of the cancer sample compared to the normal cell spectra (peak for maximum positive for normal is 14,48 at 114,38 nm and peak for cancer is 11,84 at 114,38 nm, while peak for negative values for normal is −9,75 at 117,99 nm and for cancer is −4,42 at the 117,52 nm). Also, spectra of the cancer have characteristic local minimum of intensity 4,52 at 112,46 nm (Fig. 3).
Figure 2 Typical optomagnetic spectra obtained for LBC sample groups: HSIL,
MD and SD.
Figure 3 Typical optomagnetic spectra obtained for LBC sample groups: normal
and cancer. Performance of six classification models was estimated by calculating sensitivity, specificity and Receiver Operating Characteristic Curve (ROC) i.e. area under the ROC curve (AUC). Sensitivities shown in Fig. 4 are high for all six models and range from mean values of 0,70 to 0,79, i.e. median values of 0,72 to 0,79, with Random Forest model being the model with the highest sensitivity (0,79).
Figure 4 Sensitivity obtained for all considered binary classification models
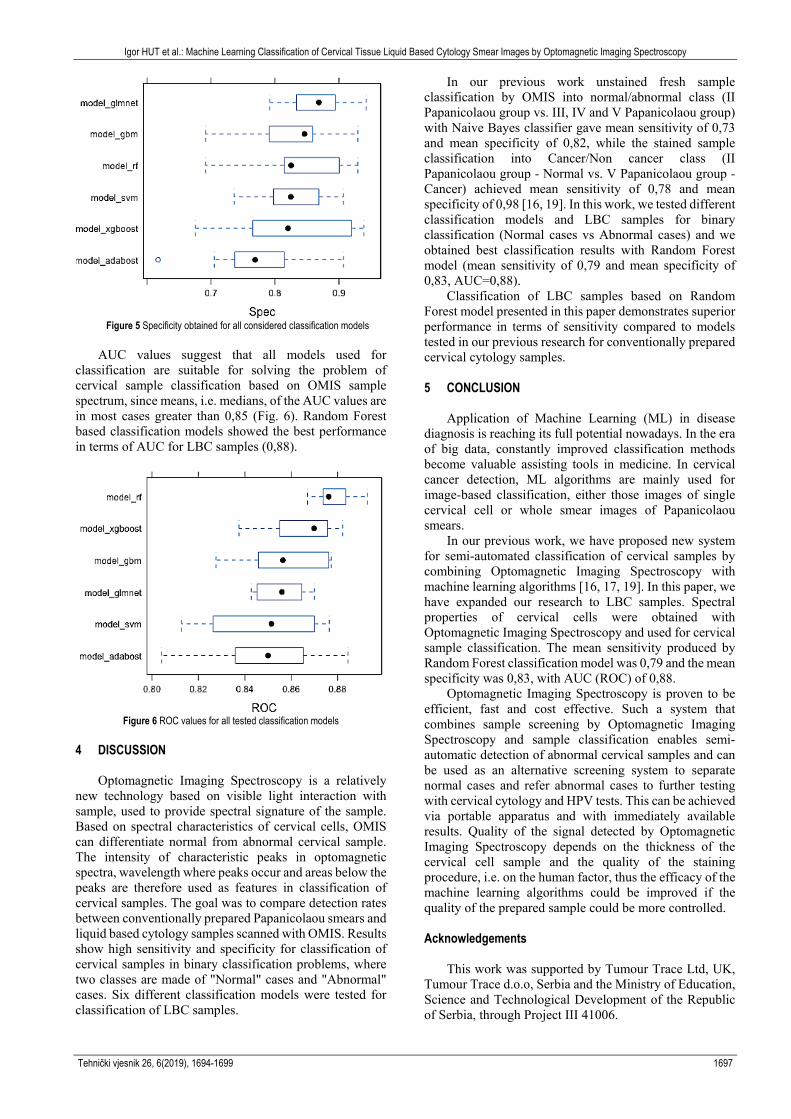
Specificity is somewhat higher than sensitivity for LBC sample classification (Fig. 5). It ranges from mean (median) value of 0,77 in the case of adaboost model to 0,87 in the case of "glmnet" model.
Igor HUT et al.: Machine Learning Classification of Cervical Tissue Liquid Based Cytology Smear Images by Optomagnetic Imaging Spectroscopy
Tehnički vjesnik 26, 6(2019), 1694-1699 1697
Figure 5 Specificity obtained for all considered classification models
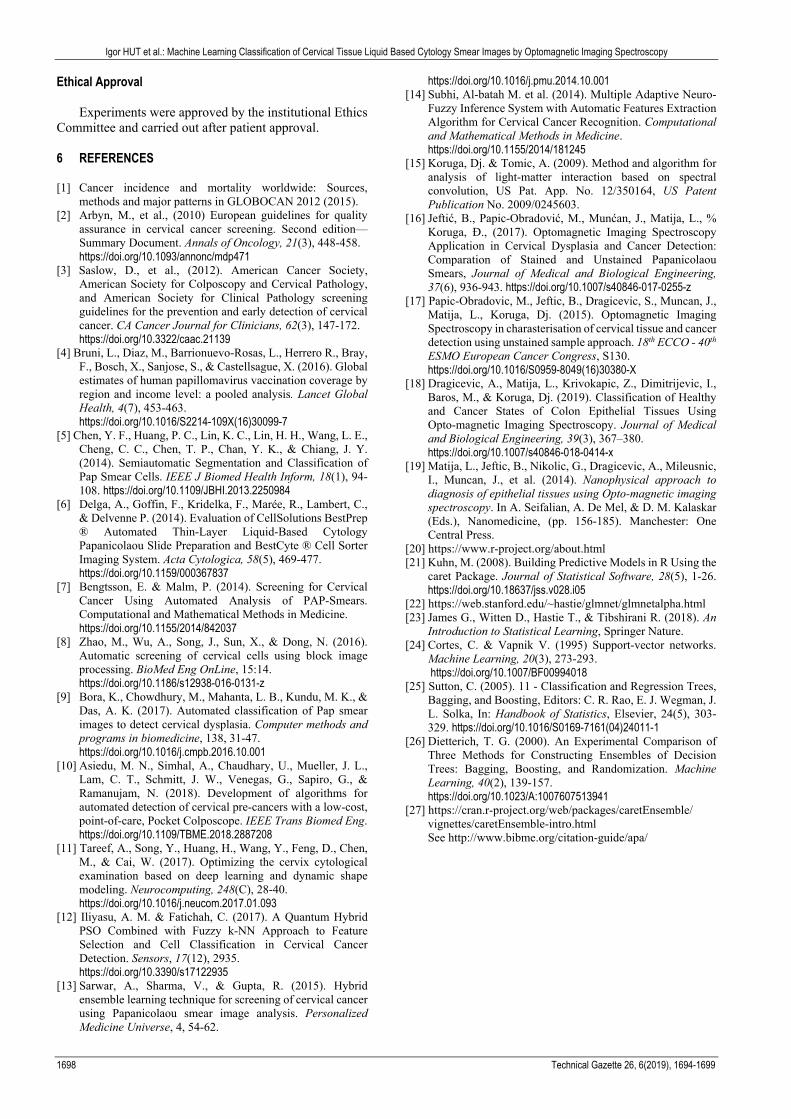
AUC values suggest that all models used for classification are suitable for solving the problem of cervical sample classification based on OMIS sample spectrum, since means, i.e. medians, of the AUC values are in most cases greater than 0,85 (Fig. 6). Random Forest based classification models showed the best performance in terms of AUC for LBC samples (0,88).
Figure 6 ROC values for all tested classification models
4 DISCUSSION Optomagnetic Imaging Spectroscopy is a relatively new technology based on visible light interaction with sample, used to provide spectral signature of the sample. Based on spectral characteristics of cervical cells, OMIS can differentiate normal from abnormal cervical sample. The intensity of characteristic peaks in optomagnetic spectra, wavelength where peaks occur and areas below the peaks are therefore used as features in classification of cervical samples. The goal was to compare detection rates between conventionally prepared Papanicolaou smears and liquid based cytology samples scanned with OMIS. Results show high sensitivity and specificity for classification of cervical samples in binary classification problems, where two classes are made of "Normal" cases and "Abnormal" cases. Six different classification models were tested for classification of LBC samples.
In our previous work unstained fresh sample classification by OMIS into normal/abnormal class (II Papanicolaou group vs. III, IV and V Papanicolaou group) with Naive Bayes classifier gave mean sensitivity of 0,73 and mean specificity of 0,82, while the stained sample classification into Cancer/Non cancer class (II Papanicolaou group - Normal vs. V Papanicolaou group - Cancer) achieved mean sensitivity of 0,78 and mean specificity of 0,98 [16, 19]. In this work, we tested different classification models and LBC samples for binary classification (Normal cases vs Abnormal cases) and we obtained best classification results with Random Forest model (mean sensitivity of 0,79 and mean specificity of 0,83, AUC=0,88). Classification of LBC samples based on Random Forest model presented in this paper demonstrates superior performance in terms of sensitivity compared to models tested in our previous research for conventionally prepared cervical cytology samples. 5 CONCLUSION Application of Machine Learning (ML) in disease diagnosis is reaching its full potential nowadays. In the era of big data, constantly improved classification methods become valuable assisting tools in medicine. In cervical cancer detection, ML algorithms are mainly used for image-based classification, either those images of single cervical cell or whole smear images of Papanicolaou smears. In our previous work, we have proposed new system for semi-automated classification of cervical samples by combining Optomagnetic Imaging Spectroscopy with machine learning algorithms [16, 17, 19]. In this paper, we have expanded our research to LBC samples. Spectral properties of cervical cells were obtained with Optomagnetic Imaging Spectroscopy and used for cervical sample classification. The mean sensitivity produced by Random Forest classification model was 0,79 and the mean specificity was 0,83, with AUC (ROC) of 0,88. Optomagnetic Imaging Spectroscopy is proven to be efficient, fast and cost effective. Such a system that combines sample screening by Optomagnetic Imaging Spectroscopy and sample classification enables semi-automatic detection of abnormal cervical samples and can be used as an alternative screening system to separate normal cases and refer abnormal cases to further testing with cervical cytology and HPV tests. This can be achieved via portable apparatus and with immediately available results. Quality of the signal detected by Optomagnetic Imaging Spectroscopy depends on the thickness of the cervical cell sample and the quality of the staining procedure, i.e. on the human factor, thus the efficacy of the machine learning algorithms could be improved if the quality of the prepared sample could be more controlled. Acknowledgements This work was supported by Tumour Trace Ltd, UK, Tumour Trace d.o.o, Serbia and the Ministry of Education, Science and Technological Development of the Republic of Serbia, through Project III 41006.
Igor HUT et al.: Machine Learning Classification of Cervical Tissue Liquid Based Cytology Smear Images by Optomagnetic Imaging Spectroscopy
1698 Technical Gazette 26, 6(2019), 1694-1699
Ethical Approval Experiments were approved by the institutional Ethics Committee and carried out after patient approval. 6 REFERENCES [1] Cancer incidence and mortality worldwide: Sources,
methods and major patterns in GLOBOCAN 2012 (2015). [2] Arbyn, M., et al., (2010) European guidelines for quality
assurance in cervical cancer screening. Second edition—Summary Document. Annals of Oncology, 21(3), 448-458.
https://doi.org/10.1093/annonc/mdp471 [3] Saslow, D., et al., (2012). American Cancer Society,
American Society for Colposcopy and Cervical Pathology, and American Society for Clinical Pathology screening guidelines for the prevention and early detection of cervical cancer. CA Cancer Journal for Clinicians, 62(3), 147-172.
https://doi.org/10.3322/caac.21139 [4] Bruni, L., Diaz, M., Barrionuevo-Rosas, L., Herrero R., Bray,
F., Bosch, X., Sanjose, S., & Castellsague, X. (2016). Global estimates of human papillomavirus vaccination coverage by region and income level: a pooled analysis. Lancet Global Health, 4(7), 453-463.
https://doi.org/10.1016/S2214-109X(16)30099-7 [5] Chen, Y. F., Huang, P. C., Lin, K. C., Lin, H. H., Wang, L. E.,
Cheng, C. C., Chen, T. P., Chan, Y. K., & Chiang, J. Y. (2014). Semiautomatic Segmentation and Classification of Pap Smear Cells. IEEE J Biomed Health Inform, 18(1), 94-108. https://doi.org/10.1109/JBHI.2013.2250984
[6] Delga, A., Goffin, F., Kridelka, F., Marée, R., Lambert, C., & Delvenne P. (2014). Evaluation of CellSolutions BestPrep ® Automated Thin-Layer Liquid-Based Cytology Papanicolaou Slide Preparation and BestCyte ® Cell Sorter Imaging System. Acta Cytologica, 58(5), 469-477.
https://doi.org/10.1159/000367837 [7] Bengtsson, E. & Malm, P. (2014). Screening for Cervical
Cancer Using Automated Analysis of PAP-Smears. Computational and Mathematical Methods in Medicine.
https://doi.org/10.1155/2014/842037 [8] Zhao, M., Wu, A., Song, J., Sun, X., & Dong, N. (2016).
Automatic screening of cervical cells using block image processing. BioMed Eng OnLine, 15:14.
https://doi.org/10.1186/s12938-016-0131-z [9] Bora, K., Chowdhury, M., Mahanta, L. B., Kundu, M. K., &
Das, A. K. (2017). Automated classification of Pap smear images to detect cervical dysplasia. Computer methods and programs in biomedicine, 138, 31-47.
https://doi.org/10.1016/j.cmpb.2016.10.001 [10] Asiedu, M. N., Simhal, A., Chaudhary, U., Mueller, J. L.,
Lam, C. T., Schmitt, J. W., Venegas, G., Sapiro, G., & Ramanujam, N. (2018). Development of algorithms for automated detection of cervical pre-cancers with a low-cost, point-of-care, Pocket Colposcope. IEEE Trans Biomed Eng. https://doi.org/10.1109/TBME.2018.2887208
[11] Tareef, A., Song, Y., Huang, H., Wang, Y., Feng, D., Chen, M., & Cai, W. (2017). Optimizing the cervix cytological examination based on deep learning and dynamic shape modeling. Neurocomputing, 248(C), 28-40.
https://doi.org/10.1016/j.neucom.2017.01.093 [12] Iliyasu, A. M. & Fatichah, C. (2017). A Quantum Hybrid
PSO Combined with Fuzzy k-NN Approach to Feature Selection and Cell Classification in Cervical Cancer Detection. Sensors, 17(12), 2935.
https://doi.org/10.3390/s17122935 [13] Sarwar, A., Sharma, V., & Gupta, R. (2015). Hybrid
ensemble learning technique for screening of cervical cancer using Papanicolaou smear image analysis. Personalized Medicine Universe, 4, 54-62.
https://doi.org/10.1016/j.pmu.2014.10.001 [14] Subhi, Al-batah M. et al. (2014). Multiple Adaptive Neuro-
Fuzzy Inference System with Automatic Features Extraction Algorithm for Cervical Cancer Recognition. Computational and Mathematical Methods in Medicine.
https://doi.org/10.1155/2014/181245 [15] Koruga, Dj. & Tomic, A. (2009). Method and algorithm for
analysis of light-matter interaction based on spectral convolution, US Pat. App. No. 12/350164, US Patent Publication No. 2009/0245603.
[16] Jeftić, B., Papic-Obradović, M., Munćan, J., Matija, L., % Koruga, Đ., (2017). Optomagnetic Imaging Spectroscopy Application in Cervical Dysplasia and Cancer Detection: Comparation of Stained and Unstained Papanicolaou Smears, Journal of Medical and Biological Engineering, 37(6), 936-943. https://doi.org/10.1007/s40846-017-0255-z
[17] Papic-Obradovic, M., Jeftic, B., Dragicevic, S., Muncan, J., Matija, L., Koruga, Dj. (2015). Optomagnetic Imaging Spectroscopy in charasterisation of cervical tissue and cancer detection using unstained sample approach. 18th ECCO - 40th ESMO European Cancer Congress, S130.
https://doi.org/10.1016/S0959-8049(16)30380-X [18] Dragicevic, A., Matija, L., Krivokapic, Z., Dimitrijevic, I.,
Baros, M., & Koruga, Dj. (2019). Classification of Healthy and Cancer States of Colon Epithelial Tissues Using Opto‑magnetic Imaging Spectroscopy. Journal of Medical and Biological Engineering, 39(3), 367–380.
https://doi.org/10.1007/s40846-018-0414-x [19] Matija, L., Jeftic, B., Nikolic, G., Dragicevic, A., Mileusnic,
I., Muncan, J., et al. (2014). Nanophysical approach to diagnosis of epithelial tissues using Opto-magnetic imaging spectroscopy. In A. Seifalian, A. De Mel, & D. M. Kalaskar (Eds.), Nanomedicine, (pp. 156-185). Manchester: One Central Press.
[20] https://www.r-project.org/about.html [21] Kuhn, M. (2008). Building Predictive Models in R Using the
caret Package. Journal of Statistical Software, 28(5), 1-26. https://doi.org/10.18637/jss.v028.i05
[22] https://web.stanford.edu/~hastie/glmnet/glmnetalpha.html [23] James G., Witten D., Hastie T., & Tibshirani R. (2018). An
Introduction to Statistical Learning, Springer Nature. [24] Cortes, C. & Vapnik V. (1995) Support-vector networks.
Machine Learning, 20(3), 273-293. https://doi.org/10.1007/BF00994018 [25] Sutton, C. (2005). 11 - Classification and Regression Trees,
Bagging, and Boosting, Editors: C. R. Rao, E. J. Wegman, J. L. Solka, In: Handbook of Statistics, Elsevier, 24(5), 303-329. https://doi.org/10.1016/S0169-7161(04)24011-1
[26] Dietterich, T. G. (2000). An Experimental Comparison of Three Methods for Constructing Ensembles of Decision Trees: Bagging, Boosting, and Randomization. Machine Learning, 40(2), 139-157.
https://doi.org/10.1023/A:1007607513941 [27] https://cran.r-project.org/web/packages/caretEnsemble/ vignettes/caretEnsemble-intro.html
See http://www.bibme.org/citation-guide/apa/

Igor HUT et al.: Machine Learning Classification of Cervical Tissue Liquid Based Cytology Smear Images by Optomagnetic Imaging Spectroscopy
Tehnički vjesnik 26, 6(2019), 1694-1699 1699
Contact information: Igor HUT, PhD student (Corresponding author) University of Belgrade, Faculty of Mechanical Engineering, Department of Biomedical Engineering, Kraljice Marije 16, 11120 Belgrade 35, Serbia [email protected], [email protected] Branislava JEFTIC, PhD University of Belgrade, Faculty of Mechanical Engineering, Department of Biomedical Engineering, Kraljice Marije 16, 11120 Belgrade 35, Serbia [email protected] Lidija MATIJA, Professor Dr. University of Belgrade, Faculty of Mechanical Engineering, Department of Biomedical Engineering, Kraljice Marije 16, 11120 Belgrade 35, Serbia [email protected] Zarko COJBASIC, Professor Dr. University of Nis, Faculty of Mechanical Engineering, Department for Mechatronics and Control, Aleksandra Medvedeva 14, 18106 Nis, Serbia [email protected] Djuro KORUGA, Professor Dr. TFT NANO CENTER LTD., Vojislava Ilica 88, 11010 Belgrade 48, Serbia [email protected]