Embed Size (px)
Citation preview
This is an electronic reprint of the original article.This reprint may differ from the original in pagination and typographic detail.
Powered by TCPDF (www.tcpdf.org)
This material is protected by copyright and other intellectual property rights, and duplication or sale of all or part of any of the repository collections is not permitted, except that material may be duplicated by you for your research use or educational purposes in electronic or print form. You must obtain permission for any other use. Electronic or print copies may not be offered, whether for sale or otherwise to anyone who is not an authorised user.
Jaskari, Joel; Myllarinen, Janne; Leskinen, Markus; Rad, Ali Bahrami; Hollmén, Jaakko;Andersson, Sture; Sarkka, SimoMachine Learning Methods for Neonatal Mortality and Morbidity Classification
Published in:IEEE Access
DOI:10.1109/ACCESS.2020.3006710
Published: 02/07/2020
Document VersionPublisher's PDF, also known as Version of record
Published under the following license:CC BY
Please cite the original version:Jaskari, J., Myllarinen, J., Leskinen, M., Rad, A. B., Hollmén, J., Andersson, S., & Sarkka, S. (2020). MachineLearning Methods for Neonatal Mortality and Morbidity Classification. IEEE Access, 8, 123347-123358.[9131772]. https://doi.org/10.1109/ACCESS.2020.3006710
Received June 10, 2020, accepted June 20, 2020, date of publication July 2, 2020, date of current version July 17, 2020.
Digital Object Identifier 10.1109/ACCESS.2020.3006710
Machine Learning Methods for NeonatalMortality and Morbidity ClassificationJOEL JASKARI 1, JANNE MYLLÄRINEN2, MARKUS LESKINEN3,ALI BAHRAMI RAD2,4, (Member, IEEE), JAAKKO HOLLMÉN1,5, (Senior Member, IEEE),STURE ANDERSSON3, AND SIMO SÄRKKÄ 2, (Senior Member, IEEE)1Department of Computer Science, Aalto University, 00076 Aalto, Finland2Department of Electrical Engineering and Automation, Aalto University, 00076 Aalto, Finland3Pediatric Research Center, Children’s Hospital, University of Helsinki, Helsinki University Hospital, 00029 Helsinki, Finland4Department of Biomedical Informatics, Emory University, Atlanta, GA 30322, USA5Department of Computer and Systems Sciences, Stockholm University, 16407 Stockholm, Sweden
Corresponding author: Simo Särkkä ([email protected])
The work of Sture Andersson was supported by the Foundation for Pediatric Research in Finland, and a Special Governmental Subsidy forClinical Research.
ABSTRACT Preterm birth is the leading cause of mortality in children under the age of five. In particular,low birth weight and low gestational age are associated with an increased risk of mortality. Preterm birthalso increases the risks of several complications, which can increase the risk of death, or cause long-termmorbidities with both individual and societal impacts. In this work, we use machine learning for prediction ofneonatal mortality as well as neonatal morbidities of bronchopulmonary dysplasia, necrotizing enterocolitis,and retinopathy of prematurity, among very low birth weight infants. Our predictors include time series dataand clinical variables collected at the neonatal intensive care unit of Children’s Hospital, Helsinki UniversityHospital. We examine 9 different classifiers and present our main results in AUROC, similar to our previousstudies, and in F1-score, which we propose for classifier selection in this study. We also investigate howthe predictive performance of the classifiers evolves as the length of time series is increased, and examinethe relative importance of different features using the random forest classifier, which we found to generallyperform the best in all tasks. Our systematic study also involves different data preprocessing methods whichcan be used to improve classifier sensitivities. Our best classifier AUROC is 0.922 in the prediction ofmortality, 0.899 in the prediction of bronchopulmonary dysplasia, 0.806 in the prediction of necrotizingenterocolitis, and 0.846 in the prediction of retinopathy of prematurity. Our best classifier F1-score is 0.493 inthe prediction of mortality, 0.704 in the prediction of bronchopulmonary dysplasia, 0.215 in the predictionof necrotizing enterocolitis, and 0.368 in the prediction of retinopathy of prematurity.
INDEX TERMS Bronchopulmonary dysplasia, classification, machine learning, necrotizing enterocolitis,neonatal intensive care unit, neonatal mortality, neonatology, NICU, retinopathy of prematurity.
I. INTRODUCTIONOver 15 million babies are born preterm every year, andwhile their mortality and morbidity rates have been decreas-ing in recent decades, preterm birth is still the worldwideleading cause of childhoodmortality under the age of five [1].Increased risk of mortality and morbidity among neonates isassociated with low birth weight and low gestational age [2].Very low birth weight (VLBW) infants, that is, those withbirth weight under 1500 g, which are treated in neonatalintensive care units (NICUs) in the Western Europe and inthe USA, have a mortality rate around 11% [3]. Furthermore,
The associate editor coordinating the review of this manuscript and
approving it for publication was Gang Li .
many of the survivors develop severe complications such asneonatal sepsis [4], bronchopulmonary dysplasia (BPD) [5],or necrotizing enterocolitis (NEC) [6]. These and other com-plications can also inflict long-term or permanent morbidi-ties such as persistent pulmonary dysfunction in the case ofBPD [5], gastrointestinal and neurodevelopmental problemsin the case of NEC [6], or blindness in the case of retinopathyof prematurity (ROP) [7]. Early detection of neonatal mor-bidities is of paramount importance to halt the progression ofthe disease, and for preventing further complications or evendeath [8].
In order to better assess the risk of mortality and neona-tal illness, several scores have been proposed, such as theApgar [9], SNAP [10], and SNAPPE [11] scores, and more
VOLUME 8, 2020 This work is licensed under a Creative Commons Attribution 4.0 License. For more information, see https://creativecommons.org/licenses/by/4.0/ 123347
J. Jaskari et al.: Machine Learning Methods for Neonatal Mortality and Morbidity Classification
recently the SNAP-II and SNAPPE-II [12] scores. ModernNICUs monitor the vital signs of neonates in an automatedfashion, which allows for the collection of time series dataof the physiological measurements. In our preliminary work,we observed that machine learning methods can enhance theperformance of traditional SNAP-II and SNAPPE-II scoresby leveraging time series data. The methodology leads toimproved prediction of neonatal mortality [13] and neona-tal morbidities of BPD, NEC, and ROP [14]. In this study,we continue the mentioned preliminary work by presentinga comprehensive comparison of machine learning methodsfor prediction of mortality, BPD, NEC, and ROP in VLBWneonates.
The contributions of this article are i) to present a system-atic study of machine learning methods for the predictionof neonatal mortality, BPD, NEC, and ROP, ii) to proposeand analyze F1-score as an evaluation measure to AUROCin order to improve the sensitivity of the classifiers, iii) toanalyze the methods using various lengths of time series data,and iv) to analyze the relative importance of different featuresusing the random forest classifier, which we found to havegenerally the best performance in the classification tasks.This study was approved by the Ethics Committee of HelsinkiUniversity Hospital 115/13/03/00/14, dated April 8, 2014.
II. BACKGROUNDBronchopulmonary dysplasia (BPD) is a severe chronic lungcomplication among the preterm infants resulting from theimmaturity of the developing preterm lung and injuries asso-ciated with external effects, such as maternal intra-amnioticinfection, mechanical ventilation, and excessive oxygen [15].The initial injury is often caused by respiratory distress syn-drome (RDS) [15] or acute respiratory distress [5]. However,oxygen and positive-pressure ventilation system used fortreating these conditions worsens the injury and initiates thedevelopment of BPD [15].
Necrotizing enterocolitis (NEC) is a serious disease of thedeveloping gastrointestinal tract. Early diagnosis of NEC isimportant in order to prevent the inflammation to progress tobowel necrosis and perforation, and eventually to death [8].There is also an economic aspect, as it has been estimated thatthe annual costs of the disease are between $500 million and$1 billion in the USA [16].
Retinopathy of prematurity (ROP) is a retinal disease asso-ciated with the combination of underdeveloped retinal ves-sels of preterm neonates and supplementary oxygen given tothem [17]. In addition, low gestational age and birth weightare known risk factors. Currently, the screening for ROP isperformed by eye examinations and treated with laser [7] orwith anti-vascular endothelial growth factor treatment [18].
SNAP-II and SNAPPE-II [12] are scores for predictingneonatal mortality and they are based on a simple logisticregression model. SNAP-II uses features extracted from thephysiological measurements and laboratory results, such asmean blood pressure and lowest serum pH, during a 12 hourrecording period. SNAPPE-II score additionally uses the
birth weight, the gestational age, and the Apgar score. TheApgar score is reported at 1 minute and 5 minutes afterbirth for all infants, and at 5-minute intervals thereafter until20 minutes for infants with a score less than 7, to assess thestatus of the infant and the response to resuscitation if needed.The Apgar score is a sum of five indices measuring the heartrate, respiratory effort, muscle tone, reflex irritability, andcolor of the infant [19].
Using machine learning for neonatal morbidity and mor-tality prediction has been previously explored in literature.Saria et al. [20] presented a model for predicting binary labelof low/high morbidity where, high morbidity was definedas any of the following complications: sepsis, pulmonaryhemorrhage, pulmonary hypertension, acute hemodynamicinstability, moderate or severe BPD, ROP, NEC, intraventric-ular hemorrhage, or death. Their model utilized aggregatednonlinear Bayesian models and logistic regression, and theirselected features included mean values, baseline variances,and residual variances of 3 hours of recorded heart rate, respi-ratory rate, and oxygen saturation. In addition, the gestationalage and birth weight were used as inputs to the model. Ourselected features are similar, as we use the mean and standarddeviation of the heart rate and oxygen saturation, the gesta-tional age, and the birth weight. However, our selected signalsdiffer in that we do not use respiratory rate and we use addi-tional features including systolic, diastolic, and mean bloodpressure, as well as the SNAP-II and SNAPPE-II scores.We also consider a larger variety of popular classifiers fortabular data. Saria et al. [20] also considered the importanceof physiological features. However, we analyze the featuresfrom the perspective of random forest feature importance,while in Saria et al. the importance was estimated using abla-tion analysis. We have also chosen to predict mortality anddifferent morbidities separately as opposed to the combinedhigh morbidity label used in the article.
In a more recent work, Podda et al. [21] presented multiplemachine learning methods for predicting neonatal mortalityin the terms of the probability of survival: logistic regres-sion, k-nearest neighbor, random forest, gradient boostingmachine, support vector machine, and neural network. Ourwork also considers logistic regression, k-nearest neighbor,random forest, and support vector machine, but we also usefive additional classifiers and evaluate our classifiers in pre-dicting different morbidities. In addition, our features differfrom the ones used in Podda et al. [21]. The models presentedin Podda et al. [21] do not use physiological time series, butinstead, they use the following data collected up to 5 min-utes after birth: gestational age, birth weight, Apgar scores1 minute and 5 minutes after the birth, sex, multiple gesta-tion, mode of delivery, prenatal care, intra-amniotic infec-tion, maternal hypertension, ethnicity, and antenatal steroids.Our dataset includes data up to 72 hours, from which weuse multiple subsets in order to examine how the predictiveperformance of the models vary with the time series length.
Our work is a continuation of Rinta-Koski et al. [14] andRinta-Koski et al. [13]. These works presented preliminary
123348 VOLUME 8, 2020

J. Jaskari et al.: Machine Learning Methods for Neonatal Mortality and Morbidity Classification
TABLE 1. Descriptive statistics of the set of included patients.
results obtained for a small number of classifiers for mortal-ity, BPD, NEC, and ROP prediction on a dataset collected inthe NICU of Children’s Hospital of Helsinki University Hos-pital. In Rinta-Koski et al. [14], Gaussian process classifierswere trained to predict BPD, NEC, and ROP, and the resultswere compared to the standard medical scores SNAP-II andSNAPPE-II. In Rinta-Koski et al. [13], neonatal mortalityprediction was considered. The classifiers compared in thestudy were Gaussian process classifier, with three differ-ent kernels, support vector machine classifier, linear probitmodel, SNAP-II, and SNAPPE-II.
III. DATAOur dataset consists of pseudonymized temporal and staticdata collected in the NICU of Children’s Hospital, HelsinkiUniversity Hospital between years 1999 and 2013. Thisdataset is partially the same dataset used in [14] and [13].However, in this study, we have access to additional patients.We included all the infants admitted to NICU with birthweights under 1500 g (VLBW) in this study. Patients whodied or were discharged before the age of 72 hours wereexcluded in order to prevent the explicit vital sign decay toaffect the predictions. Also, patients with less than 50 mea-surements of any of the time series predictors were excluded.Patients with severe congenital anomalies were not excluded,as we wanted an inclusive sample and birth defects are animportant cause of neonatal morbidity and mortality amongthe VLBW infants. The study included 977 patients, whofulfilled the inclusion criteria. Descriptive statistics of the setof included patients are presented in Table 1.
Temporal data includes physiological variables, such asheart rate and blood pressure, in the form of time series. Staticdata includes clinical information, such as gestational ageand birth weight, medical scores SNAP-II and SNAPPE-II,diagnoses of the patients for BPD, NEC, and ROP, as well asinformation on the survival. There are up to 111 different sen-sor measurements, however, many, or even all measurementswere missing for a large portion of the patients, and thus onlya subset of the features was selected. The predictors werechosen to be the same as in [13]: systolic, diastolic and meanblood pressure, oxygen saturation and heart rate for temporalvariables, and for static variables SNAP-II, SNAPPE-II, birthweight, and gestational age at birth.
We use these predictors because our preliminary workshows that the best result can be obtained when all these
predictors are used in the classification. It is to be noted,that there is slight overlap in variables, as SNAP-II andSNAPPE-II scores also include information about the meanblood pressure, oxygen saturation, and birth weight. Rela-tionship between SNAP-II and SNAPPE-II is also very close.However, the information in SNAP-II and SNAPPE-II isnonlinear in nature, due to the thresholding of the scores, andthus it is not redundant to include the constituent features.Using SNAP-II and SNAPPE-II is in a sense inclusion ofprior medical knowledge on how the constituent variablesshould be processed. Analysing the individual constituentsof SNAP-II and SNAPPE-II would be beneficial, as thesescores might not be computed in every hospital, making theapproach more general. This analysis is, however, left forfuture work.
The temporal variables were collected using sensor mea-surements throughout the stay of the patient in the NICU.The gestational age was expressed as completed days frommother’s last menstrual period to delivery. In our clinicalpractice, voluntary early ultrasonographic examination isoffered to all mothers, which is used for estimating theexpected gestational age. If the difference between the gesta-tional age, calculated from last menstruation period, and theexpected gestational age is more than five days, gestationalage is adjusted.
The sampling of the temporal variables is irregular inthe hospital environment, meaning that the sampling of thesensor measurements is not synchronized. Our dataset alsohas a large number of missing values. We applied multiplepreprocessing steps in order to standardize the data into aformat suitable for machine learning methods, and also toexamine the behavior of these algorithms in various cir-cumstances. The non-synchronous data was transformed intoanother set, by splitting the time into 2-minute intervals andby filling missing data with the closest observation beforethe start of the interval, thus creating a synthetic synchronousdataset.
VLBW infants undergo an adaptation period after birthwhen their physiological recordings differ from the steadystate attained later. We hypothesized that these initial adap-tation period recordings might affect the classifier perfor-mance. As the age, when VLBW infants were admitted toNICU varied, we created two new sets from both the non-synchronous and synchronous datasets with the first 6 hoursof measurements excluded, in order to examine if the more
VOLUME 8, 2020 123349
J. Jaskari et al.: Machine Learning Methods for Neonatal Mortality and Morbidity Classification
stable post-adaptation period recordings improve the perfor-mance of the classifiers.
At the end, we created multiple subsets from the previous4 sets, by dividing the time series into 12, 18, 24, 36, 48, and72 hours of data. Further exclusion of patients was conductedon the basis of observed sensormeasurements.Measurementsout of range of plausible values, defined by medical experts,were removed, and, again, at least 50 valid measurements pertemporal variable were required to include the patient into thedataset. This minimum 50-valid-measurements rule causesdifferent sets to have a different number of patients.
Detailed descriptions of the datasets produced by the dif-ferent preprocessing steps are presented in the Supplementarymaterial in Table 1a for mortality, Table 1b for BPD, Table 1cfor NEC, and Table 1d for ROP. From the patients in ourdataset, approximately 6-7% died, 28-29% had BPD, 3%NEC, and 8% ROP.
We also experimented with undersampling of the major-ity class during the training of the classifiers to overcomethe class imbalance problem. This procedure is explained inthe next section. Lastly, our preprocessing pipeline includesfeature extraction and data standardization. Similarly to [13]and [14], we chose to use the means and standard deviationsas our extracted features from the time series. We also nor-malized the data to have zero mean and unit variance, foreach variable independently, using the mean and the standarddeviation of the training set of each fold in order to preventleakage between the sets.
IV. CLASSIFIER METHODSOur selected methods include logistic regression, linear dis-criminant analysis, quadratic discriminant analysis, k-nearestneighbor, support vector machine, three different Gaussianprocesses, and random forest classifier.
In logistic regression (LR), a linearmodel is combinedwithlogistic sigmoid function to model the posterior probabilitiesof each class [22]. The resulting model is nonlinear and thereis no closed-form solution, hence iterative optimizationmeth-ods like Newton-Raphson [23] or gradient descent [24] haveto be used. The probabilities of the classes can be defined for abinary classification task as is presented in Equation (1) [23],bias term included in w for clarity:
p(y = 1 | x,w) =1
1+ exp (−wT x),
p(y = 0 | x,w) = 1− p(y = 1 | x,w). (1)
Linear discriminant analysis (LDA) classifier [25] is basedon the assumption that the class-conditional densities p(x |y = 1) and p(x | y = 0) are Gaussian. In addition, LDAfurther assumes that the density functions share a commoncovariance matrix. Under these assumptions, the classifica-tion problem can be formulated as finding the optimal 1Dprojection for the data, governed by the class-conditionalmeans and common covariance matrix, and finding the opti-mal classification threshold on this line. The equations for theoptimal projection vector and the classification threshold on
the projection, given uniform class priors, are presented inEquations (2) and (3), respectively, for binary case [25]:
w = 6−1(µ1 − µ0), (2)
4 =12(µ1 − µ0)T6−1(µ1 − µ0). (3)
In these equations, µn denotes the mean of the samples fromclass n, and 6 is the common covariance matrix.Quadratic discriminant analysis (QDA) classifier [25] is a
generalization of the LDA classifier, where the requirementof the common covariancematrix is relaxed into class specificcovariance matrices. This relaxation also causes the decisionboundaries between classes to have a quadratic form. Theposterior probabilities of classes can be computed as in Equa-tion (4), for uniform priors again for clarity [25]:
p(y = c | x)
=|6c|
−12 exp {− 1
2 (x− µc)T6−1c (x− µc)}∑
i∈C |6i|−
12 exp {− 1
2 (x− µi)T6−1i (x− µi)}
. (4)
In this equation, i denotes the index of the class, c of whichis the predicted class, and µi and 6i are the mean vector andcovariance matrix of the class i, respectively.k-nearest neighbor (KNN) classification algorithm is a
machine learning method, using a distance metric, such asEuclidean distance, to find the closest examples in the train-ing set to a query point, and then classifying points based onthese neighboring points [22]. The posterior probability of aquery point belonging to a specific class can be estimated asthe proportion of neighbors belonging to that class. The classassociated with the highest posterior probability can then beused as the prediction of the model [23].
Support vector machine (SVM) [22] is based on findinga hyperplane that separates the samples between the classeswithmaximal margin. If the classes are not linearly separable,so-called slack variables are needed for each data point, suchthat some may fall on the wrong side of the separating hyper-plane. The slack variables are constrained to be non-negative,and the separating hyperplane is selected such that the sum ofthe slack variables is minimized. So-called kernel trick can beused to lift the problem into a higher-dimensional space [22].However, we do not consider the kernel SVMs in this work.
Gaussian processes (GP) [26] are Bayesian non-parametricmachine learning methods, which can be used in classifica-tion and regression tasks. Gaussian process defines a Gaus-sian distribution over functions and it is parametrized by amean function and a covariance function. In our experimentswe use zero mean, and thus the covariance function definesour GP model.
In this work, three covariance functions have been utilized,each consisting of a sum of constant kernel, linear kernel, andone of the following: squared exponential kernel (kRBF(·, ·)),Matérn kernel with ν = 3/2 (kMatérn32(·, ·)), or Matérn kernelwith ν = 5/2 (kMatérn52(·, ·)). The three latter kernels arepresented in Equations (5)-(7) with parameter ν substituted
123350 VOLUME 8, 2020
J. Jaskari et al.: Machine Learning Methods for Neonatal Mortality and Morbidity Classification
with the relevant value:
kRBF(x, x′) = exp(−12(x− x′)2), (5)
kMatérn32(x, x′) = (1+
√3|x− x′|l
)
· exp(−
√3|x− x′|l
), (6)
kMatérn52(x, x′) = (1+
√5|x− x′|l
+5|x− x′|2
3l2)
· exp(−
√5|x− x′|l
). (7)
Bootstrap aggregation of multiple decision trees gives ariseto a model called random forest (RF) [22]. In RF, each treeis given a random bootstrap sample of the training dataset forwhich splitting rules are learned. RF algorithm also includesrandom sampling of the features at each split, in order toreduce the correlation between the trained trees. The pre-dictions of RF are obtained by aggregating all the tree-predictions together by averaging them [22].
V. EVALUATION CRITERIAWe evaluate our models by using two primary evalua-tion measures: the area under the receiver operating char-acteristics curve (AUROC) and the F1-score, also calledthe Sørensen-Dice coefficient and the similarity coefficient.AUROC [27] is a common measure used in machine learningmethod evaluation within the medical field, see for exam-ple [13], [14], [28], [29], and is therefore selected for eval-uation. However, our dataset has a high class imbalance, andthus in this study, we propose the F1-score as an alternativeevaluationmeasure to better reflect the classifier performancein detecting the positive class, that is, the minority class inour case.
As an example of using the AUROC measure for classifierselection with high class imbalance, the best classifier in thedetection of mortality in our previous study [13] had a highAUROC of 0.948, however, the sensitivity was 0.463. Thismeans that nearly 54% of the deaths are undetected by theclassifier. Similarly in the detection of ROP in our previousstudy [14], the best classifier had a moderately high AUROCof 0.84 and a very low sensitivity of 0.05, which resultsin 95% of the ROP cases to be left undetected. We will show(see Section VI), when we have a class imbalance problem,selecting the best classifier based on the highest F1-scorewill significantly improve the sensitivity with possibly onlya slight decrease in the AUROC value. The F1-score iscomputed as the harmonic mean of positive predictive value(PPV/precision) and sensitivity (recall) on a single operatingpoint.
We also present results on the mean F1-score, defined asthe mean of F1-score calculated for detection of positiveclass and for the detection of negative class, PPV, sensitivity,specificity, and accuracy. The equations for calculating theevaluation measures and their relevant intermediate results,
other than AUROC, are the following Equations (8)-(15):
Sensitivity =TP
TP+ FN, (8)
PPV =TP
TP+ FP, (9)
Specificity =TN
TN+ FP, (10)
NPV =TN
TN+ FN, (11)
F1 = 2PPV× SensitivityPPV+ Sensitivity
=2TP
2TP+ FP+ FN, (12)
F1− = 2NPV× SpecificityNPV+ Specificity
=2TN
2TN+ FP+ FN, (13)
Mean F1 =F1+ F1−
2, (14)
Accuracy =TP+ TN
TP+ TN+ FP+ FN. (15)
Here TP, TN, FP, and FN denote true positives, true neg-atives, false positives, and false negatives, respectively. NPVis abbreviation for negative predictive value.
Due to the small number of samples in our dataset,cross-validation was used. We used 8-fold cross-validation,repeated 8 times, similarly as in our preliminary work [13].Stratification was also used in the cross-validation, whichensures that a similar proportion of positive and negativesamples are selected into each fold. Due to the high classimbalance present in our dataset, we performed additionalexperiments with class sub-sampling in our experiments.In this setting, we modified the training set of each cross-validation fold to have the same amount of negative andpositive examples by sampling the majority class withoutreplacement. Predictions were performed on the entire testfold.
Parameter selection was conducted using a nested cross-validation procedure, where the standard cross-validationtraining set was used in another inner cross-validation loop.The validation set of this inner loop was then used to estimatethe generalization performance with the selected parameters.With this procedure we searched for the best parameters forRF and KNN. For RF these parameters were the number ofrandomly selected variables for each split, number of treeswithin the forest, and minimum number of observations foreach leaf node. For KNN, the parameter was the number ofneighbors. These parameters are presented in Table 2.
We used MATLAB’s inbuilt functions to implement ourexperiments, except for the Gaussian process classifier, forwhich we used the GPstuff MATLAB toolbox [30]. Evalu-ation measures were calculated utilizing Python frameworkScikit-learn [31] for each model.
VOLUME 8, 2020 123351
J. Jaskari et al.: Machine Learning Methods for Neonatal Mortality and Morbidity Classification
TABLE 2. Selected parameters for random forest and KNN (k-nearestneighbor) for each classification task. PPS denotes predictors per splitand OPL observations per leaf.
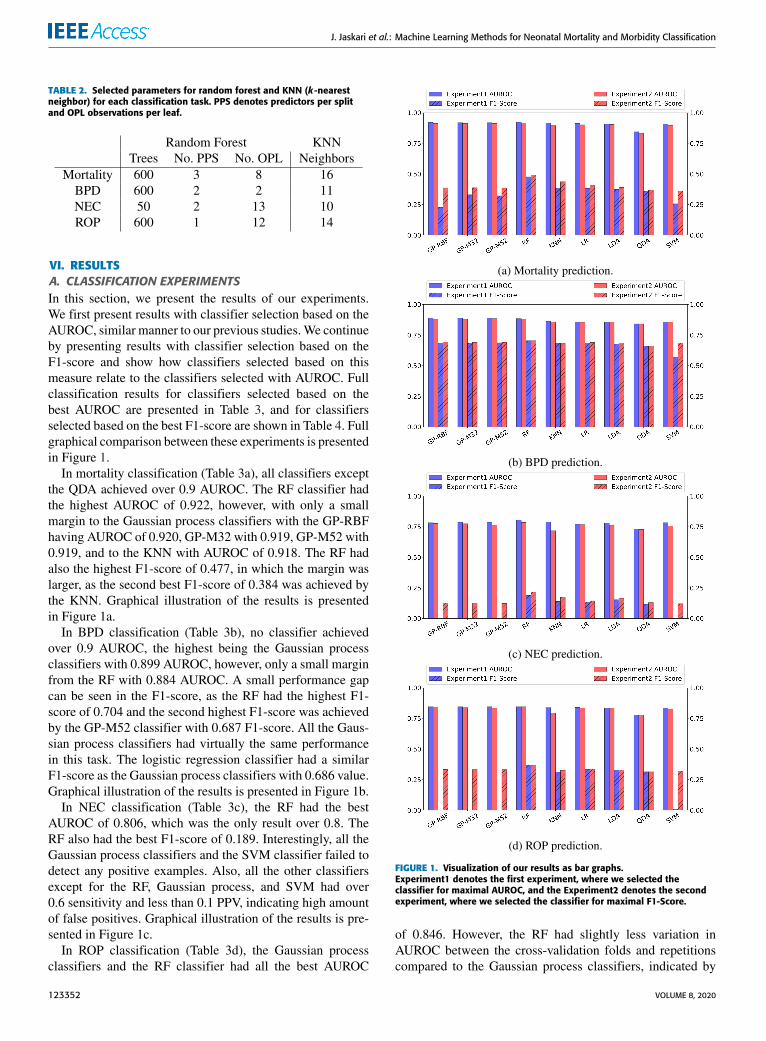
VI. RESULTSA. CLASSIFICATION EXPERIMENTSIn this section, we present the results of our experiments.We first present results with classifier selection based on theAUROC, similar manner to our previous studies.We continueby presenting results with classifier selection based on theF1-score and show how classifiers selected based on thismeasure relate to the classifiers selected with AUROC. Fullclassification results for classifiers selected based on thebest AUROC are presented in Table 3, and for classifiersselected based on the best F1-score are shown in Table 4. Fullgraphical comparison between these experiments is presentedin Figure 1.In mortality classification (Table 3a), all classifiers except
the QDA achieved over 0.9 AUROC. The RF classifier hadthe highest AUROC of 0.922, however, with only a smallmargin to the Gaussian process classifiers with the GP-RBFhaving AUROC of 0.920, GP-M32 with 0.919, GP-M52 with0.919, and to the KNN with AUROC of 0.918. The RF hadalso the highest F1-score of 0.477, in which the margin waslarger, as the second best F1-score of 0.384 was achieved bythe KNN. Graphical illustration of the results is presentedin Figure 1a.
In BPD classification (Table 3b), no classifier achievedover 0.9 AUROC, the highest being the Gaussian processclassifiers with 0.899 AUROC, however, only a small marginfrom the RF with 0.884 AUROC. A small performance gapcan be seen in the F1-score, as the RF had the highest F1-score of 0.704 and the second highest F1-score was achievedby the GP-M52 classifier with 0.687 F1-score. All the Gaus-sian process classifiers had virtually the same performancein this task. The logistic regression classifier had a similarF1-score as the Gaussian process classifiers with 0.686 value.Graphical illustration of the results is presented in Figure 1b.
In NEC classification (Table 3c), the RF had the bestAUROC of 0.806, which was the only result over 0.8. TheRF also had the best F1-score of 0.189. Interestingly, all theGaussian process classifiers and the SVM classifier failed todetect any positive examples. Also, all the other classifiersexcept for the RF, Gaussian process, and SVM had over0.6 sensitivity and less than 0.1 PPV, indicating high amountof false positives. Graphical illustration of the results is pre-sented in Figure 1c.
In ROP classification (Table 3d), the Gaussian processclassifiers and the RF classifier had all the best AUROC
FIGURE 1. Visualization of our results as bar graphs.Experiment1 denotes the first experiment, where we selected theclassifier for maximal AUROC, and the Experiment2 denotes the secondexperiment, where we selected the classifier for maximal F1-Score.
of 0.846. However, the RF had slightly less variation inAUROC between the cross-validation folds and repetitionscompared to the Gaussian process classifiers, indicated by
123352 VOLUME 8, 2020
J. Jaskari et al.: Machine Learning Methods for Neonatal Mortality and Morbidity Classification
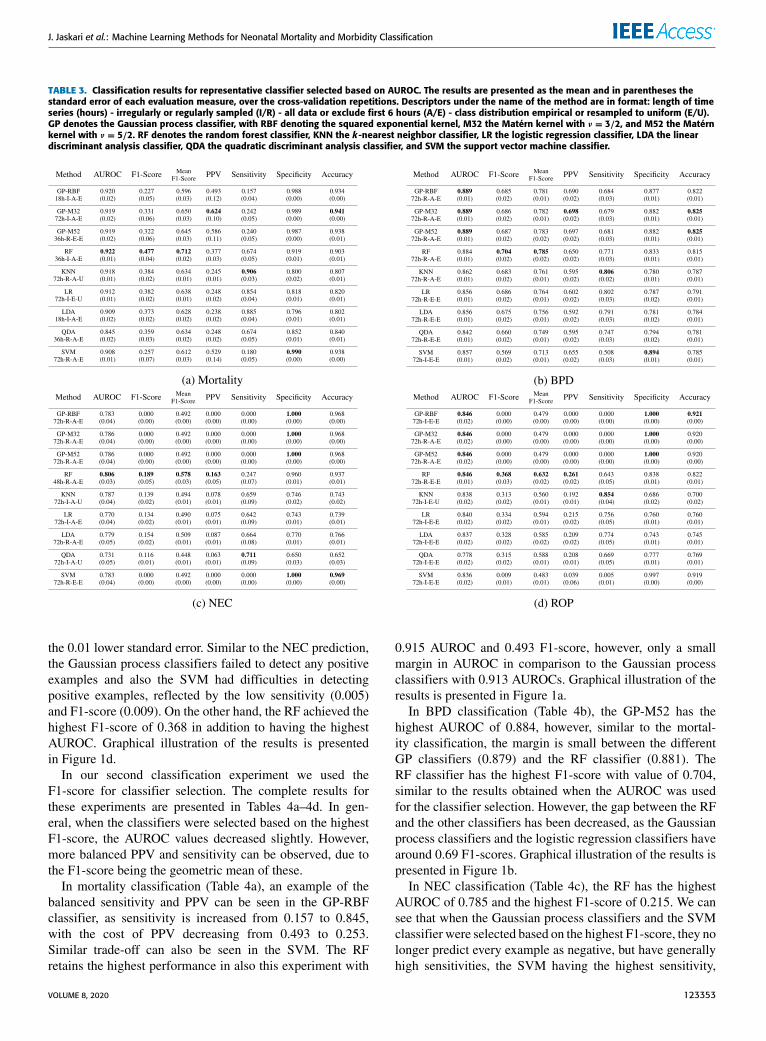
TABLE 3. Classification results for representative classifier selected based on AUROC. The results are presented as the mean and in parentheses thestandard error of each evaluation measure, over the cross-validation repetitions. Descriptors under the name of the method are in format: length of timeseries (hours) - irregularly or regularly sampled (I/R) - all data or exclude first 6 hours (A/E) - class distribution empirical or resampled to uniform (E/U).GP denotes the Gaussian process classifier, with RBF denoting the squared exponential kernel, M32 the Matérn kernel with ν = 3/2, and M52 the Matérnkernel with ν = 5/2. RF denotes the random forest classifier, KNN the k-nearest neighbor classifier, LR the logistic regression classifier, LDA the lineardiscriminant analysis classifier, QDA the quadratic discriminant analysis classifier, and SVM the support vector machine classifier.
the 0.01 lower standard error. Similar to the NEC prediction,the Gaussian process classifiers failed to detect any positiveexamples and also the SVM had difficulties in detectingpositive examples, reflected by the low sensitivity (0.005)and F1-score (0.009). On the other hand, the RF achieved thehighest F1-score of 0.368 in addition to having the highestAUROC. Graphical illustration of the results is presentedin Figure 1d.
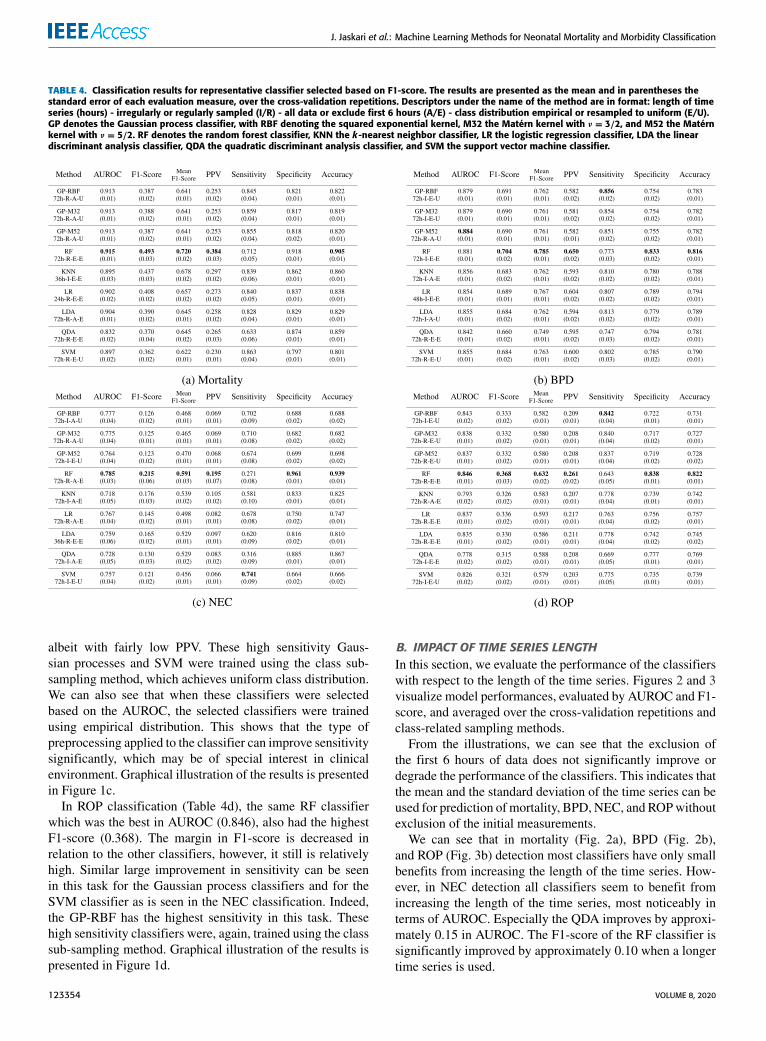
In our second classification experiment we used theF1-score for classifier selection. The complete results forthese experiments are presented in Tables 4a–4d. In gen-eral, when the classifiers were selected based on the highestF1-score, the AUROC values decreased slightly. However,more balanced PPV and sensitivity can be observed, due tothe F1-score being the geometric mean of these.
In mortality classification (Table 4a), an example of thebalanced sensitivity and PPV can be seen in the GP-RBFclassifier, as sensitivity is increased from 0.157 to 0.845,with the cost of PPV decreasing from 0.493 to 0.253.Similar trade-off can also be seen in the SVM. The RFretains the highest performance in also this experiment with
0.915 AUROC and 0.493 F1-score, however, only a smallmargin in AUROC in comparison to the Gaussian processclassifiers with 0.913 AUROCs. Graphical illustration of theresults is presented in Figure 1a.
In BPD classification (Table 4b), the GP-M52 has thehighest AUROC of 0.884, however, similar to the mortal-ity classification, the margin is small between the differentGP classifiers (0.879) and the RF classifier (0.881). TheRF classifier has the highest F1-score with value of 0.704,similar to the results obtained when the AUROC was usedfor the classifier selection. However, the gap between the RFand the other classifiers has been decreased, as the Gaussianprocess classifiers and the logistic regression classifiers havearound 0.69 F1-scores. Graphical illustration of the results ispresented in Figure 1b.
In NEC classification (Table 4c), the RF has the highestAUROC of 0.785 and the highest F1-score of 0.215. We cansee that when the Gaussian process classifiers and the SVMclassifier were selected based on the highest F1-score, they nolonger predict every example as negative, but have generallyhigh sensitivities, the SVM having the highest sensitivity,
VOLUME 8, 2020 123353
J. Jaskari et al.: Machine Learning Methods for Neonatal Mortality and Morbidity Classification
TABLE 4. Classification results for representative classifier selected based on F1-score. The results are presented as the mean and in parentheses thestandard error of each evaluation measure, over the cross-validation repetitions. Descriptors under the name of the method are in format: length of timeseries (hours) - irregularly or regularly sampled (I/R) - all data or exclude first 6 hours (A/E) - class distribution empirical or resampled to uniform (E/U).GP denotes the Gaussian process classifier, with RBF denoting the squared exponential kernel, M32 the Matérn kernel with ν = 3/2, and M52 the Matérnkernel with ν = 5/2. RF denotes the random forest classifier, KNN the k-nearest neighbor classifier, LR the logistic regression classifier, LDA the lineardiscriminant analysis classifier, QDA the quadratic discriminant analysis classifier, and SVM the support vector machine classifier.
albeit with fairly low PPV. These high sensitivity Gaus-sian processes and SVM were trained using the class sub-sampling method, which achieves uniform class distribution.We can also see that when these classifiers were selectedbased on the AUROC, the selected classifiers were trainedusing empirical distribution. This shows that the type ofpreprocessing applied to the classifier can improve sensitivitysignificantly, which may be of special interest in clinicalenvironment. Graphical illustration of the results is presentedin Figure 1c.
In ROP classification (Table 4d), the same RF classifierwhich was the best in AUROC (0.846), also had the highestF1-score (0.368). The margin in F1-score is decreased inrelation to the other classifiers, however, it still is relativelyhigh. Similar large improvement in sensitivity can be seenin this task for the Gaussian process classifiers and for theSVM classifier as is seen in the NEC classification. Indeed,the GP-RBF has the highest sensitivity in this task. Thesehigh sensitivity classifiers were, again, trained using the classsub-sampling method. Graphical illustration of the results ispresented in Figure 1d.
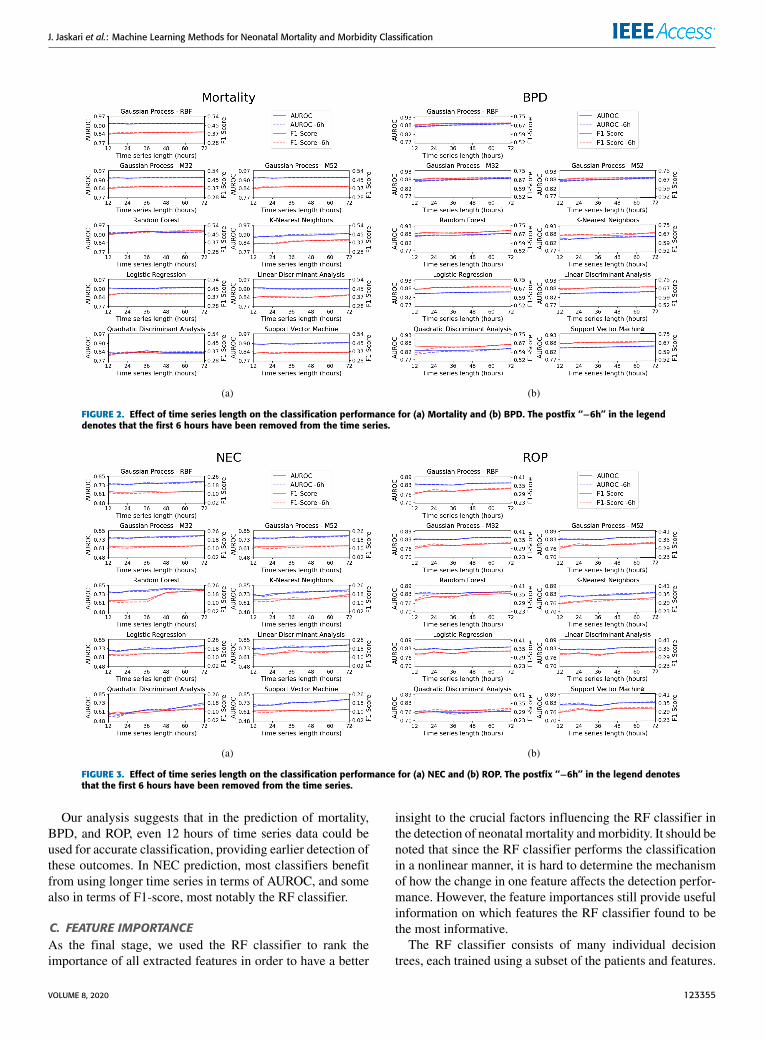
B. IMPACT OF TIME SERIES LENGTHIn this section, we evaluate the performance of the classifierswith respect to the length of the time series. Figures 2 and 3visualize model performances, evaluated by AUROC and F1-score, and averaged over the cross-validation repetitions andclass-related sampling methods.
From the illustrations, we can see that the exclusion ofthe first 6 hours of data does not significantly improve ordegrade the performance of the classifiers. This indicates thatthe mean and the standard deviation of the time series can beused for prediction of mortality, BPD, NEC, and ROPwithoutexclusion of the initial measurements.
We can see that in mortality (Fig. 2a), BPD (Fig. 2b),and ROP (Fig. 3b) detection most classifiers have only smallbenefits from increasing the length of the time series. How-ever, in NEC detection all classifiers seem to benefit fromincreasing the length of the time series, most noticeably interms of AUROC. Especially the QDA improves by approxi-mately 0.15 in AUROC. The F1-score of the RF classifier issignificantly improved by approximately 0.10 when a longertime series is used.
123354 VOLUME 8, 2020
J. Jaskari et al.: Machine Learning Methods for Neonatal Mortality and Morbidity Classification
FIGURE 2. Effect of time series length on the classification performance for (a) Mortality and (b) BPD. The postfix ‘‘−6h’’ in the legenddenotes that the first 6 hours have been removed from the time series.
FIGURE 3. Effect of time series length on the classification performance for (a) NEC and (b) ROP. The postfix ‘‘−6h’’ in the legend denotesthat the first 6 hours have been removed from the time series.
Our analysis suggests that in the prediction of mortality,BPD, and ROP, even 12 hours of time series data could beused for accurate classification, providing earlier detection ofthese outcomes. In NEC prediction, most classifiers benefitfrom using longer time series in terms of AUROC, and somealso in terms of F1-score, most notably the RF classifier.
C. FEATURE IMPORTANCEAs the final stage, we used the RF classifier to rank theimportance of all extracted features in order to have a better
insight to the crucial factors influencing the RF classifier inthe detection of neonatal mortality andmorbidity. It should benoted that since the RF classifier performs the classificationin a nonlinear manner, it is hard to determine the mechanismof how the change in one feature affects the detection perfor-mance. However, the feature importances still provide usefulinformation on which features the RF classifier found to bethe most informative.
The RF classifier consists of many individual decisiontrees, each trained using a subset of the patients and features.
VOLUME 8, 2020 123355
J. Jaskari et al.: Machine Learning Methods for Neonatal Mortality and Morbidity Classification
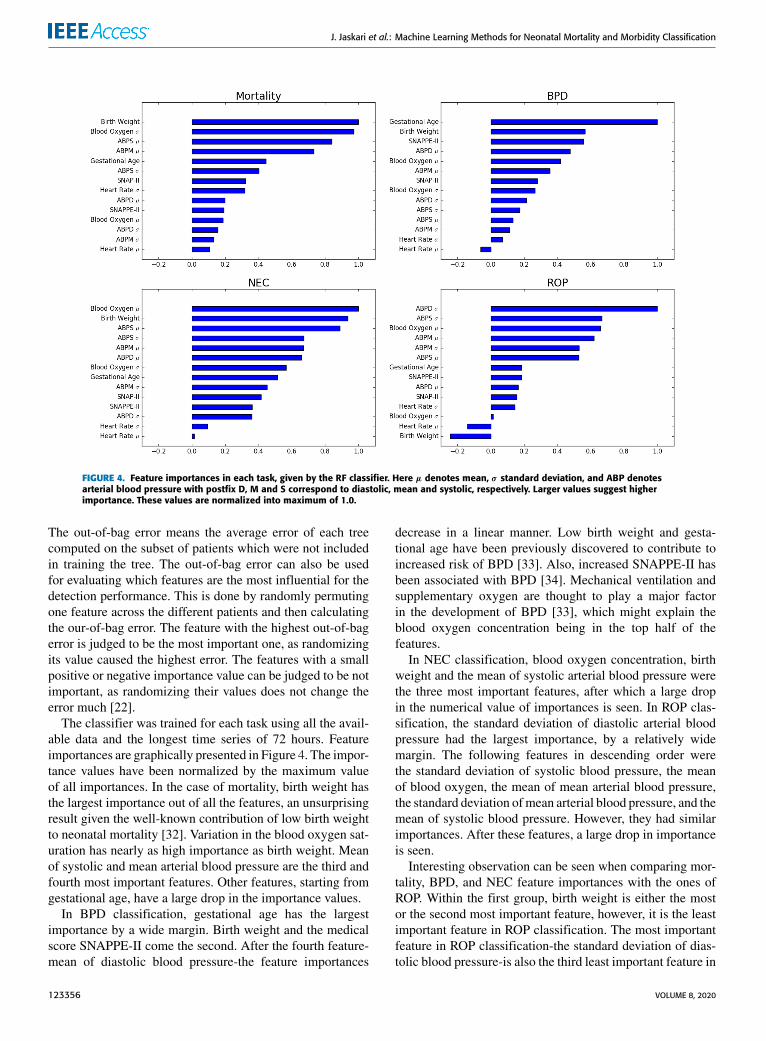
FIGURE 4. Feature importances in each task, given by the RF classifier. Here µ denotes mean, σ standard deviation, and ABP denotesarterial blood pressure with postfix D, M and S correspond to diastolic, mean and systolic, respectively. Larger values suggest higherimportance. These values are normalized into maximum of 1.0.
The out-of-bag error means the average error of each treecomputed on the subset of patients which were not includedin training the tree. The out-of-bag error can also be usedfor evaluating which features are the most influential for thedetection performance. This is done by randomly permutingone feature across the different patients and then calculatingthe our-of-bag error. The feature with the highest out-of-bagerror is judged to be the most important one, as randomizingits value caused the highest error. The features with a smallpositive or negative importance value can be judged to be notimportant, as randomizing their values does not change theerror much [22].
The classifier was trained for each task using all the avail-able data and the longest time series of 72 hours. Featureimportances are graphically presented in Figure 4. The impor-tance values have been normalized by the maximum valueof all importances. In the case of mortality, birth weight hasthe largest importance out of all the features, an unsurprisingresult given the well-known contribution of low birth weightto neonatal mortality [32]. Variation in the blood oxygen sat-uration has nearly as high importance as birth weight. Meanof systolic and mean arterial blood pressure are the third andfourth most important features. Other features, starting fromgestational age, have a large drop in the importance values.
In BPD classification, gestational age has the largestimportance by a wide margin. Birth weight and the medicalscore SNAPPE-II come the second. After the fourth feature-mean of diastolic blood pressure-the feature importances
decrease in a linear manner. Low birth weight and gesta-tional age have been previously discovered to contribute toincreased risk of BPD [33]. Also, increased SNAPPE-II hasbeen associated with BPD [34]. Mechanical ventilation andsupplementary oxygen are thought to play a major factorin the development of BPD [33], which might explain theblood oxygen concentration being in the top half of thefeatures.
In NEC classification, blood oxygen concentration, birthweight and the mean of systolic arterial blood pressure werethe three most important features, after which a large dropin the numerical value of importances is seen. In ROP clas-sification, the standard deviation of diastolic arterial bloodpressure had the largest importance, by a relatively widemargin. The following features in descending order werethe standard deviation of systolic blood pressure, the meanof blood oxygen, the mean of mean arterial blood pressure,the standard deviation ofmean arterial blood pressure, and themean of systolic blood pressure. However, they had similarimportances. After these features, a large drop in importanceis seen.
Interesting observation can be seen when comparing mor-tality, BPD, and NEC feature importances with the ones ofROP. Within the first group, birth weight is either the mostor the second most important feature, however, it is the leastimportant feature in ROP classification. The most importantfeature in ROP classification-the standard deviation of dias-tolic blood pressure-is also the third least important feature in
123356 VOLUME 8, 2020
J. Jaskari et al.: Machine Learning Methods for Neonatal Mortality and Morbidity Classification
mortality and NEC classification, and the sixth least impor-tant feature in BPD classification.
VII. CONCLUSIONSIn this article, we have presented a systematic analysisof 9 different classifiers in the tasks of neonatal mortality,BPD, NEC, and ROP detection, using an NICU dataset.Our preprocessed datasets included irregular and regular-ized time series, time series of different lengths, and timeseries with initial 6 hours of observations excluded. Ourexperiments also included majority class sub-sampling foruniform class distribution. In our experiments the RF clas-sifier had generally the best performance, when evaluatedusing our primary evaluation measures of AUROC andF1-score.
Our results show that the features proposed in the prelim-inary work [13], [14] are robust to the choice of classifiersin AUROC and F1-score measures, when the training datahas been preprocessed in an optimal fashion. Our findingsalso show that the performance of the classifiers is unaffectedby the exclusion of the first 6 hours of data. This findingindicates that the possible heteroscedasticity present in theneonatal adaptation period measurements does not degradethe performance of the classifiers.
In comparison to our preliminary work, presented in [14]and [13], we have shown that our preprocessing methodsand the proposed F1-score for classifier selection improvethe sensitivity of the same classifiers in the task of neonatalmortality prediction, albeit this methodology decreased theAUROC values slightly. In the task of BPD, NEC, and ROPclassification, we have shown that the RF classifier can reachthe best or the second best results in AUROC, and the bestresults in F1-score in each task. However, other classifiersalso reach competitive F1-scores when the preprocessingscheme is tuned to maximize F1-score.
Our results suggest that in a clinical setting, where thesensitivity can have a high priority, the AUROC evaluationmeasure might not provide a good standard for compari-son. Instead, the F1-score could provide a useful measurefor comparison. The overall results also show that whensensitivity is important, sub-sampling the majority class canlead to increased sensitivity. In majority of the cases and inmajority of the classifiers, the best results were obtained ineach primary evaluation measure when the longest 72 hourperiod of data was used. This suggests that the long termmean and standard deviation of the time series provide bet-ter discriminative features than the short term counterparts.However, this effect was not very significant in other tasksthan NEC classification.
Lastly, we acknowledge some limitations of this study,namely i) the dataset was collected in the same hospi-tal, possibly introducing challenges to generalization toother hospital settings with different devices for phys-iological signal measurements, and ii) our algorithm isdesigned in a retrospective manner after the measurementsfor a certain time period are taken. This requires some
adaptations for real-time applications, which possibly leadsto a drop in the performance.
REFERENCES[1] M. S. Harrison and R. L. Goldenberg, ‘‘Global burden of prematurity,’’
Seminars Fetal Neonatal Med., vol. 21, no. 2, pp. 74–79, Apr. 2016.[2] R. J. Baer, E. E. Rogers, J. C. Partridge, J. G. Anderson,M.Morris,M.Kup-
permann, L. S. Franck, L. Rand, and L. L. Jelliffe-Pawlowski, ‘‘Population-based risks of mortality and preterm morbidity by gestational age and birthweight,’’ J. Perinatol., vol. 36, no. 11, pp. 1008–1013, Nov. 2016.
[3] J. D. Horbar, E. M. Edwards, L. T. Greenberg, K. A. Morrow, R. F. Soll,M. E. Buus-Frank, and J. S. Buzas, ‘‘Variation in performance of neonatalintensive care units in the united states,’’ JAMA Pediatrics, vol. 171, no. 3,Mar. 2017, Art. no. e164396.
[4] Levels & Trends in Child Mortality: Report 2018, Estimates Developedby the United Nations Inter-Agency Group for Child Mortality Estimation,United Nations Childrenà Fund, New York, NY, USA, 2018.
[5] L. Davidson and S. Berkelhamer, ‘‘Bronchopulmonary dysplasia: Chroniclung disease of infancy and long-term pulmonary outcomes,’’ J. Clin. Med.,vol. 6, no. 1, p. 4, Jan. 2017.
[6] A. M. Thompson and M. J. Bizzarro, ‘‘Necrotizing enterocolitis in new-borns,’’ Drugs, vol. 68, no. 9, pp. 1227–1238, 2008.
[7] A. Hellström, L. E. Smith, and O. Dammann, ‘‘Retinopathy of prematu-rity,’’ Lancet, vol. 382, pp. 1445–1457, Oct. 2013.
[8] M. A. Isani, P. T. Delaplain, A. Grishin, and H. R. Ford, ‘‘Evolvingunderstanding of neonatal necrotizing enterocolitis,’’ Current OpinionPediatrics, vol. 30, no. 3, pp. 417–423, Jun. 2018.
[9] V. Apgar, ‘‘A proposal for a new method of evaluation of the newbornInfant.,’’ Anesthesia Analgesia, vol. 32, no. 1, pp. 260–267, Jan. 1953.
[10] D. K. Richardson, J. E. Gray, M. C. McCormick, K. Workman, andD. A. Goldmann, ‘‘Score for neonatal acute physiology: A physiologicseverity index for neonatal intensive care,’’ Pediatrics, vol. 91, no. 3,pp. 617–623, 1993.
[11] D. K. Richardson, C. S. Phibbs, J. E. Gray, M. C. McCormick,K. Workman-Daniels, and D. A. Goldmann, ‘‘Birth weight and illnessseverity: Independent predictors of neonatal mortality,’’ Pediatrics, vol. 91,no. 5, pp. 969–975, 1993.
[12] D. K. Richardson, J. D. Corcoran, G. J. Escobar, and S. K. Lee, ‘‘SNAP-II and SNAPPE-II: Simplified newborn illness severity and mortality riskscores,’’ J. Pediatrics, vol. 138, no. 1, pp. 92–100, Jan. 2001.
[13] O.-P. Rinta-Koski, S. Särkkä, J. Hollmén, M. Leskinen, and S. Andersson,‘‘,’’ Gaussian process classification for prediction of in-hospital mor-tality among preterm infants,’’ Neurocomputing, vol. 298, pp. 134–141,Jul. 2018.
[14] O.-P. Rinta-Koski, S. Sarkka, J. Hollmen, M. Leskinen, K. Rantakari,and S. Andersson, ‘‘Prediction of major complications affecting very lowbirth weight infants,’’ in Proc. IEEE Life Sci. Conf. (LSC), Dec. 2017,pp. 186–189.
[15] E. Baraldi andM. Filippone, ‘‘Chronic lung disease after premature birth,’’New England J. Med., vol. 357, no. 19, pp. 1946–1955, Nov. 2007.
[16] J. Neu and W. A. Walker, ‘‘Necrotizing enterocolitis,’’ New EnglandJ. Med., vol. 364, no. 3, pp. 255–264, 2011.
[17] B. W. Fleck and N. McIntosh, ‘‘Pathogenesis of retinopathy of prematurityand possible preventive strategies,’’ Early Human Develop., vol. 84, no. 2,pp. 83–88, Feb. 2008.
[18] H. A. Mintz-Hittner, K. A. Kennedy, and A. Z. Chuang, ‘‘Efficacy ofintravitreal bevacizumab for stage 3+ retinopathy of prematurity,’’ NewEngland J. Med., vol. 364, no. 7, pp. 603–615, Feb. 2011.
[19] B. M. Casey, D. D. McIntire, and K. J. Leveno, ‘‘The continuing valueof the apgar score for the assessment of newborn infants,’’ New EnglandJ. Med., vol. 344, no. 7, pp. 467–471, Feb. 2001.
[20] S. Saria, A. K. Rajani, J. Gould, D. Koller, and A. A. Penn, ‘‘Integrationof early physiological responses predicts later illness severity in preterminfants,’’ Sci. Transl. Med., vol. 2, no. 48, p. 48ra65–48ra65, 2010.
[21] M. Podda, D. Bacciu, A. Micheli, R. Bellá, G. Placidi, and L. Gagliardi,‘‘A machine learning approach to estimating preterm infants survival:Development of the preterm infants survival assessment (PISA) predictor,’’Sci. Rep., vol. 8, no. 1, Dec. 2018, Art. no. 13743.
[22] T. Hastie, R. Tibshirani, and J. Friedman, The Elements Stat. Learn-ing: Data Mining, Inference, Prediction, 2nd Ed. New York, NY, USA:Springer, 2009.
[23] C. M. Bishop, Pattern Recognition and Machine Learning. Berlin,Germany: Springer-Verlag, 2006.
VOLUME 8, 2020 123357

J. Jaskari et al.: Machine Learning Methods for Neonatal Mortality and Morbidity Classification
[24] I. Goodfellow, Y. Bengio, and A. Courville, Deep Learning. Cambridge,MA, USA: MIT Press, 2016.
[25] K. P. Murphy,Machine Learning: A Probabilistic Perspective. Cambridge,MA, USA: MIT Press, 2012.
[26] C. K. I. Williams and C. E. Rasmussen, Gaussian Processes for MachineLearning. Cambridge, MA, USA: MIT Press, 2006.
[27] A. P. Bradley, ‘‘The use of the area under the ROC curve in the evalu-ation of machine learning algorithms,’’ Pattern Recognit., vol. 30, no. 7,pp. 1145–1159, Jul. 1997.
[28] V. Gulshan, ‘‘Development and validation of a deep learning algorithm fordetection of diabetic retinopathy in retinal fundus photographs,’’ J. Amer.Med. Assoc., vol. 316, no. 22, pp. 2402–2410, 2016.
[29] D. S. W. Ting, ‘‘Development and validation of a deep learning systemfor diabetic retinopathy and related eye diseases using retinal imagesfrom multiethnic populations with diabetes,’’ JAMA, vol. 318, no. 22,pp. 2211–2223, 2017.
[30] J. Vanhatalo, J. Riihimäki, J. Hartikainen, P. Jylänki, V. Tolvanen, andA. Vehtari, ‘‘GPstuff: Bayesian modeling with Gaussian processes,’’J. Mach. Learn. Res., vol. 14, no. Apr, pp. 1175–1179, 2013.
[31] F. Pedregosa, ‘‘Scikit-learn: Machine learning in Python,’’ J. Mach. Learn.Res., vol. 12, pp. 2825–2830, Oct. 2011.
[32] M. C. McCormick, ‘‘The contribution of low birth weight to infant mor-tality and childhood morbidity,’’ New England J. Med., vol. 312, no. 2,pp. 82–90, Jan. 1985.
[33] E. Bancalari, N. Claure, and I. R. S. Sosenko, ‘‘Bronchopulmonary dys-plasia: Changes in pathogenesis, epidemiology and definition,’’ SeminarsNeonatol., vol. 8, no. 1, pp. 63–71, Feb. 2003.
[34] B. Özcan, A. S. Kavurt, O. Aydemir, Z. Gençtürk, A. Y. Baş, andN. Demirel, ‘‘SNAPPE-II and risk of neonatal morbidities in very low birthweight preterm infants,’’ The Turkish J., vol. 59, no. 2, pp. 105–112, 2017.
JOEL JASKARI received the B.Sc. (Tech.) andM.Sc. (Tech.) degrees from Aalto University,Finland, in 2013 and 2017, respectively, wherehe is currently pursuing the D.Sc. degree withthe Department of Computer Science, School ofScience. His research interests include machinelearning, especially deep learning and Bayesianmethods, and the application of machine learningin healthcare.
JANNE MYLLÄRINEN received the B.Sc. (Econ.)and M.Sc. (Tech.) degrees from Aalto University,Finland, in 2016 and 2019, respectively. His mainresearch interests include emerging data sciencerelated technologies, such as artificial intelligenceand machine learning, and their applications inhealth, energy, and finance.
MARKUS LESKINEN is currently a Neonatol-ogy Consultant with the Childrens’ Hospital,Helsinki, which was one of the early adapters ofelectronic patient Information systems in NICUwith comprehensive electronic archives runningback to 1999. His current research interestsinclude machine learning in neonatology anddata driven quality improvement in collaborationwith the School of Science, Aalto University.He has authored or coauthored 15 peer-reviewedscientific articles.
ALI BAHRAMI RAD (Member, IEEE) receivedthe B.Sc. degree in electrical engineering fromImam Hossein University, Tehran, Iran, in 2003,the M.Sc. degree in biomedical engineering fromthe Tampere University of Technology, Tampere,Finland, in 2011, and the Ph.D. degree in com-puter engineering-information technology fromthe University of Stavanger, Stavanger, Norway,in 2017. He completed his Postdoctoral Researchwith the Department of Electrical Engineering and
Automation, Aalto University, Espoo, Finland. He is currently a VisitingAssistant Professor with the Department of Biomedical Informatics, EmoryUniversity, Atlanta, USA. His current research interests include machinelearning, neural systems, and biomedical/electrophysiological signal analy-sis with applications to resuscitation, defibrillation, seizure detection, andstem-cell technology. He was a recipient of multiple international prizesin biosignal analysis and machine learning contests, including the Phys-ioNet/Computing in Cardiology Challenge 2017 (tied for the 1st place),the PhysioNet/Computing in Cardiology Challenge 2016 (2nd place), andthe Brain-Computer Interface Challenge at IEEE EMBS Neural EngineeringConference 2015 (3rd place).
JAAKKO HOLLMÉN (Senior Member, IEEE)received the D.Sc. (Tech.) degree from theHelsinki University of Technology, in 2000.He has held various positions at the HelsinkiUniversity of Technology and Aalto University,Finland, since then. In 2019, he joined the DataScience Research Group, Stockholm University.He is currently an Associate Professor with theDepartment of Computer and Systems Sciences,Stockholm University, Sweden. His research inter-
ests include machine learning and data mining, with applications in healthand medicine as well as environmental applications in the analysis of data inbuilt and natural environments. He has published over 140 scientific publica-tions in these fields. He has organized and ledmany international conferencesin these fields. He is an Editor of the Intelligent Data Analysis journal and amember of the Editorial Board of Data Mining and Knowledge Discovery.
STURE ANDERSSON received the M.D. andPh.D. degrees. He is currently an Emeritus Pro-fessor of neonatology, and one of the pioneers inusing big data in neonatology. He has authoredor coauthored over 300 peer-reviewed scientificarticles.
SIMO SÄRKKÄ (Senior Member, IEEE) iscurrently an Associate Professor with Aalto Uni-versity. He has authored or coauthored over100 peer-reviewed scientific articles and threebooks. His research interests include multi-sensordata processing systems and machine learningmethods with applications in medical and healthtechnology, target tracking, inverse problems, andlocation sensing. He is a member of the IEEEMachine Learning for Signal Processing Technical
Committee. He has been serving as an Associate Editor for the IEEE SIGNAL
PROCESSING LETTERS.
123358 VOLUME 8, 2020