Embed Size (px)
Citation preview

Machining and Related Characteristics of United States Hardwoods
\
Teclmicai IÍMIM^IíU íI>.
Forest Service

Machining and
Related Characteristics
of United States Hardwoods
By E. M. DAVIS, Wood Technologist, Forest Products Laboratory
(Maintained at Madison, Wis., in cooperation with the University of Wisconsin)
Technical Bulletin No. 1267
U.S. DEPARTMENT OF AGRICULTURE • FOREST SERVICE
Washington, D.C. August 1962
For sale by the Superintendent of Documents, U.S. Government Printing Office Washington 25, D.C. - Price 35 cents

CONTENTS Page
Introduction 1 Machining properties 3
Planing 3 Shaping 20 Turning 23 Boring 26 Mortising 31 Sanding 35
Related properties 39 Steam bending 39 Nail splitting 43 Screw splitting 45 Variation in specific gravity 49 Number of annual rings per inch 53 Cross grain 53 Shrinkage 56 Warp 56 Minor imperfections of hardwoods 59 Change of color in hardwoods 63
Summary 64
This bulletin supersedes Technical Bulletin No. 824, Machining and Related Characteristics of Southern Hardwoods.
HI

INTRODUCTION
Machining properties relate to the behavior of wood when planed, shaped, turned, or put through any other standard woodworking operation. Wood in general is easy to cut, shape, and fasten. For some purposes the difference between woods in machinability is negli- gible ; for other uses, however, as in furniture and fixtures, the smooth- ness and facility with which woods can be worked may be the most important of all properties. Unless a wood machines fairly well and with moderate ease, it is not economically suitable for such uses re- gardless of its other virtues. Thus, along with specific gravity and tendency to split and warp, machinability is of first importance to the woodworker.
unlike the physical, chemical, and mechanical properties, machin- ing properties of wood have had little systematic study, and there are few publications in this field. Some of the everyday working qualities and machining characteristics of American hardwoods have, however, been under systematic study at the Forest Products Labora- tory during recent years. This bulletin records in part the results of this study and is written primarily for cabinetmakers, furniture manufacturers, and other woodworkers.
A number of minor hardwoods find relatively little use in the woodworking industries. Lack of information concerning their ma- chining properties has been an obstacle to wider use. A primary object of this study, therefore, was to measure the machining prop- erties of these little-used woods so that they might be accurately compared with the established woods as to machinability. With such a yardstick available, the hardwood user can undertake with assur- ance the use of new woods.
The study also included, as far as practical, the influence of some of the factors within the wood and in the various machines that affect machining results. Since such factors can be combined in literally hundreds of ways, it was impracticable to explore the possibilities of all combinations; instead, one or more sets of fairly representative working conditions were selected for each operation and applied uniformly to all woods. These, of course, could not be the optimum for all woods, but the results show rather what actually happens under the specified conditions.
Close contact was maintained with the woodworking trade during both the planning of the study and the actual testing. Engineers in woodworking industries and manufacturers of woodworking ma- chinery and various hardwood products were frequently consulted.
Shipments of any given wood from different mills may vary sig- nificantly in weight, texture, and workability because of differences in forest and growth conditions. To get a fair cross section of such variations, the test samples were largely collected at 34 different saw- mills scattered in selected areas from western Virginia to eastern Texas, the region that yields about two-thirds of the yearly cut of hardwoods.

To make the study truly national in scope, samples of eight com- mercial hardwoods from the area north of the Ohio Eiver and east of the Mississippi River were collected from several representative sources. Although supplies of West Coast hardwoods are relatively small, these species have local importance, and six were included in the tests. One foreign wood. Central American mahogany, was in- cluded for purely comparative purposes, because it is so widely and favorably known among woodworkers.
The lumber was commercial flat grain and clear. A normal range in character was desired, because that is the way lumber is sold on the market and used in the fabricating plant. Material that approached the freakish in any respect was rejected. Tests were based on 50 samples of a species. The test samples measured 1 by 6 inches by 4 feet. In addition to machining properties, data were obtained on spe- cific gravity, number of rings per inch, and shrinkage. For these properties, several hundred samples of each species were tested as a rule.
In the United States, smoothness of surface is more important than power requirement as a criterion of workability, and results were accordingly judged on smoothness characteristics. A method of visual inspection was developed and used here. In each operation, each test sample was examined for machining defects and graded on a numerical scale. -A grade of 1 was considered excellent, 2 good, 3 fair, 4 poor, and 5 a reject. The words excellent, good, and fair, as used in the tables in this publication, refer to these numerical grades. This method of grading shows both the frequency with which a given defect occurs and its degree when present, as applied to the strictly machining properties of planing, shaping, turning, boring, mortising, and sanding. In the related properties of steam bending, nail splitting, and screw splitting, the occurrence of breaks or splits w as made the basis of comparison.
The desirability of holding tool sharpness at a high and relatively uniform level was obvious. This was accomplished by frequent light sharpenings in accord with the best commercial practice.
Botanists recognize only one species each of yellow-poplar, beech, and sweetgum. But in each of the other major woods studied at least two species are recognized, and in oak, maple, ash, hickory, and some other hardwoods there are more than 20 species each. These species are not available separately on the market, and even if one species is specified by a consumer there is often no adequate test of compliance. This study is, therefore, based on commercial lumber just as the con- sumer buys it and not on botanical species. Consequently, where certain woods of several species are commonly separated by the lum- ber trade into two or more classes, the standard commercial designa- tions shown below are used.
Oentis Commercial separations Acer hard maple, soft maple, bigleaf maple. Carya {=Hicoria) hickory, pecan. Nyssa black^m, túpelo. Populus cottonwood, aspen. Querem red oak, white-oak. Ulmus soft elm, rock elm.
Different species of basswood are commercially lumped together without any attempt at separation and the same is true of hackberry, magnolia, sycamore, and willow.
2

MACHINING PROPERTIES
PLANING
The great bulk of hardwood lumber goes to some woodworking plant where it is made into furniture, flooring, cabinets, or other fac- tory products. As compared with most construction, these are exact- ing uses that require higher standards of machine work. Next to sawing, which is not dealt with.in this report, planing is by far the most important machining operation. Other operations may or may not be performed depending upon the end use. Nearly every hard- wood board, however, is planed at some stage of its fabrication into a finished product.
Machines Used
The Planer.—Most of the tests described here were made with a 30-inch wedge-bed cabinet planer equipped with one 4-knife cutter- head having a 5-inch cutting circle. This type of planer is designed for precise work rather than for fast production.
Without attempting to go into detail concerning the adjustment and operation of the planer, it is still desirable to outline some of the more essential parts of a planer and their functions. Nearly all the parts (fig. 1) are adjustable, and the successful operation of the ma- chine depends to a large degree upon the proper adjustment of the parts.
When a board enters the planer, it first passes between the tw^o infeed rolls. The top of the lower roll should extend from 0.003 inch to 0.008 inch above the level of the table, depending upon the char- acter of the job. The upper inf eed roll is adjusted to a point where it holds the wood firmly enough to feed it through the machine, without leaving visible corrugation marks on the finished work.
PRESSURE BAR CHIP BREAKER
OUTFEED ROLL IN FEED ROLL
FIGURE 1.—How a planer operates.

Moving pictures of cutterheads in motion have shown that the knife action includes splitting as well as cutting. As the knife approaches the end of its cut, the direction of cut becomes slightly upward and fine splits often develop just ahead of the knife edge. The function of the chip breaker is to minimize the length of these splits, and thus reduce the occurrence of chipped grain on the planed surface. With this objective, the chip breaker is set as close to the cutterhead as practical and adjusted to hold the board firmly against the platen without any vibration.
More will be said about the cutterhead elsewhere. The pressure bar is on the exit side of the cutterhead. Its function
is to prevent any spring-up as either end of the board leaves the cutter- head. This is accomplished by adjusting the pressure bar to hold the board firmly on the table until it reaches the outfeed rolls.
The lower roll at the outf eed end must be set slightly above table level as was done with the lower infeed roll. The upper outfeed roll is then set so that the lumber can pass between these two rolls snugly and without any play.
The Molder.—At a later date additional tests were made using a 6-inch electric molder that offered two advantages : (1) A wider range of feed rates and cutterhead speeds, and (2) greater facility in chang- ing knives and/or cutterheads to get a range in cutting angles. The cutting circle was 6 inches. The molder is primarily designed for machining all four sides of moldings or patterned lumber at one pass. Only one cutterhead, the upper one, was used in these tests however, and that was fitted with straight knives.
Because of the similarity of the cutting action in planers and molders, their results are believed to be closely parallel. Where data are presented, the machine used in developing them is always specified.
Test Procedure
Although limited tests were made with carbide-tipped knives, high- speed steel knives were used for most of the planing.
The test samples, 50 for each species, measured 1 by 4 inches by 3 feet or 1 board foot. Several cuts were made from each sample under different conditions. Before the actual machining all test material was conditioned to the desired moisture content.
All samples for a given species were machined consecutively, the order of species being random and the depth of cut uniform. Most samples of the size used have at least a little cross grain at some point. This was allowed for by feeding the samples so that the knives cut with the grain in one half of the samples and against the grain in the other half.
Planing Defects
Raised Grain,—Kaised grain is a roughened condition of the sur- face of lumber in which part of the annual ring is raised above the general surface, but not torn loose from it (fig. 2), Five numbers are used in grading raised grain and the other machining defects. No. 1, being defect-free, is not shown. Nos. 2, 3, and 4 may be con- sidered slight, medium, and advanced degrees respectively. No. 5, a quality so poor as to be rare in any of the woods tested, is not shown.

mm „„..,.V««r-««i'Vy'"
t:r^^^^
^-^^n'rciv ■^x
M-116452
FIGURE 2.—^Different degrees of raised grain illustrated by soft elm.
Çonsid.erable pressure is exerted by rollers and other parts as lumber passes through a planer. Diffuse-porous woods are relatively homo- geneous. In ring-porous woods like the oaks and elms, however, the wood is not uniformly dense throughout the annual ring. The softer parts compress more in planing and expand when the pressure is removed. This tends to raise the more dense parts above the general level of the surface.
Among the factors that contribute to development of raised grain are dull knives, too much joint on knives, and too high a moisture content in the lumber. In general, for prevention of raised grain, any moisture content from 6 to 12 percent is about equally suitable and much better than 20 percent.
Other things being equal, cottonwood, soft elm, hackberry, and willow, which are mostly minor species, were especially prone to raised grain. Among species that developed the least raised grain were ash, birch, hickory, and hard maple.
634933—82-

M-116453
FIGURE 3.—Different degrees of fuzzy grain illustrated by willow.
Fuzzy Grain.—Fuzzy grain consists of small particles or groups of small particles or groups of fibers that do not sever cleanly in machining, but stand up above the general level of the surface (fig. 3). To a large degree, fuzzy grain is due to the presence of abnormal wood called gelatinous fibers.
Trouble from fuzzy grain can be minimized by keeping knives sharp ; if practical, a grinding bevel of 30° instead of the customary 40° should be used. The moisture content should be kept low, not above 12 percent.
Fuzzy grain was found to be most common in basswood, cotton wood, willow, and sycamore. It was negligible in the heavier and harder species, such as ash, oak, hickory, and hard maple.
Chipped Grain.—Chipped grain is a chipped surface where very short particles are broken out below the line of cut (fig. 4). Torn grain is similar but more pronounced in degree. Typically, chipped

'W:
M-93420—P
FiGUBE 4.—Different degrees of chipped grain in hard maple.
grain is associated with cross-grained lumber and occurs at spots where the knives are cutting against the grain. Where the slope of grain is wholly in one direction, chipped grain may be avoided by "graining" the board—that is, feeding it so that the knives cut with the grain. But this takes more time than is usually available in production plants. Many boards, of course, have grain dips and swirls of such a nature that chipping is likely to occur regardless of which end enters the planer first. The same is true of quartered boards that have interlocked grain.

M-93419-P
FIGURE 5.—^Different degrees of chip marks In yellow-poplar.
The most important single factor in preventing chipped grain is the number of knife cuts per inch. Woods that give poor results with only 8 knife cuts will often show a vast improvement if feed rate and cutterhead speed can be so adjusted as to give 16 to 20 cuts. Chipped grain was most prevalent in the birches, maples, and hickory, and least prevalent in soft, light woods like basswood, willow, and yellow-poplar.
Since chipped grain consists of depressions below the general sur- face, more sanding is required to remove it than to remove raised or fuzzy grains, which are small elevations.
Chip Marks.—Chip marks (fig. 5) are shallow dents in the surface caused by shavings that have clung to the knives instead of passing off in the exhaust as intended. Doubts as to whether a given defect con- sists of chipped grain or chip marks can be easily resolved by applying
8

a few drops of water and waiting a few minutes. Chipped grain (which consists of broken-out particles) will not be affected. Chip marks (which consist of dents where the wood is somewhat com- pressed) will swell as they absorb water and become less conspicuous.
Chip marks may result from an inadequate blower system or from too much air leakage. Too fast a feed may result in a bigger volume of chips than the blower system can handle properly. The exhaust pipe should join the blower pipe at an oblique angle. Keeping exhaust pipes closed on any machines that are not in actual use may be helpful.
The species in which chip marks were most common were the birches and maples, although the marks on willow and hickory were only a little less prevalent. The oaks had the fewest.
Evaluation of Results
Promptly after machining, the test samples (50 per species) were examined visually, one by one, for any of the machining defects previously described. The results were recorded on prepared forms that showed (1) what defects were present, if any, and (2) whether such defects occurred in a slight, medium, or advanced degree. Com- parisons are based upon the percent of defect-free pieces in different species. In most species a majority of the test samples were defect- free, and most of the defective samples were only slightly so, as will be shown later.
Comparative Planing Properties
Planing quality was determined in most tests from a series of six runs for each wood at cutting angles of 15°, 20°, and 25°, combined first with a cutterhead speed of 3,600 revolutions per minute and a feed of 36 feet per minute and then with a cutterhead speed of 5,400 revolutions per minute and a feed of 54 feet per minute. The three cutting angles include the optimum, and they cover the most com- monly used cutting angles for hardwoods. Averaging the three gives a deserved advantage to those woods that plane well over a fairly wide range of conditions. Moisture content of the woods was 6 per- cent and depth of cut was %6 inch. In a few tests, mostly with little- used species, the molder was used as indicated by footnote 1 in table 1. The best four woods yielded about four times as many defect-free pieces as did the two poorest woods (table 1 ).
Degree of Planing Defects
As previously stated, the quality comparisons in this report are based on percentages of defect-free pieces. In some instances, the percentages of defect-free pieces may seem unduly low. But it is necessary to keep in mind that most of the defective pieces are only slightly defective. A slight degree of chipped grain covering only a square inch, for instance, is enough to place a sample in the defective category. Table 2 illustrates how this works out with five common hardwoods. In every instance, 63 percent or more of the samples are defect-free, and the slightly defective pieces outnumber the more seriously defective ones, usually by a wide margin. In several in- stances, the latter are almost negligible. Although the actual figures would change more or less under different operating conditions from
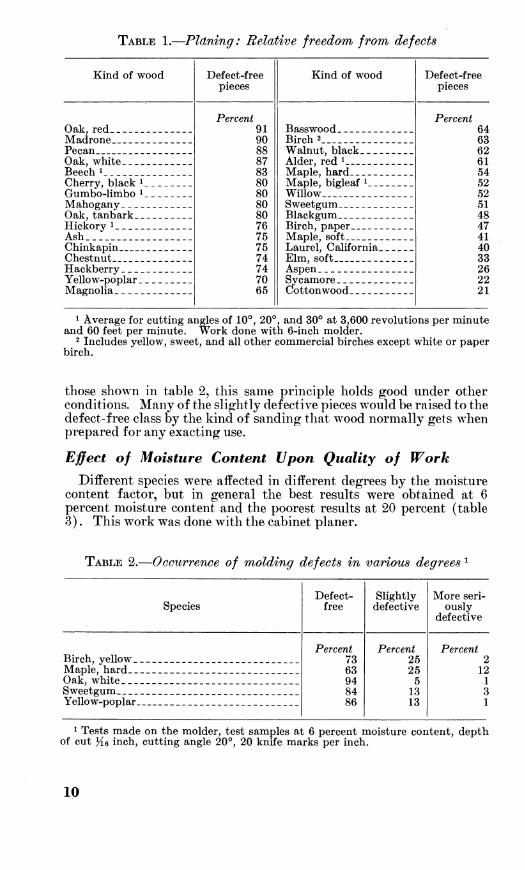
TABLE 1.—Planing: Relative freedom from defects
Kind of wood Defect-free pieces
Kind of wood Defect-free pieces
Oak, red __ _ Percent
91 90 88 87 83 80 80 80 80 76 75 75 74 74 70 65
Basswood _ Percent
64 Madrone _ Birch 2 _ _ 63 Pecan Walnut, black 62 Oak, white Alder, red ^ 61 Beech i _ _ _ Maple, hard __ _ _ 54 Cherry, black i Gumbo-Hmbo ^_
Maple, bigleaf ^ Willow ___
52 52
Mahogany Oak, tanbark __
Sweetgum _ _ _ _ 51 Blackgum _ 48
Hickory i_ __ Birch, paper Maple, soft Laurel, California Elm, soft
47 Ash Chinkapin
41 40
Chestnut _ 33 Hackberry Yellow-poplar
Aspen Sycamore _ _ _ _
26 22
Magnolia _ Cottonwood 21
1 Average for cutting angles of 10°, 20°, and 30° at 3,600 revolutions per minute and 60 feet per minute. Work done with 6-inch molder.
2 Includes yellow, sweet, and all other commercial birches except white or paper birch.
those shown in table 2, this same principle holds good under other conditions. Many of the slightly defective pieces would be raised to the defect-free class by the kind of sanding that w^ood normally gets when prepared for any exacting use.
Effect of Moisture Content Upon Quality of Work
Different species were affected in different degrees by the moisture content factor, but in general the best results were obtained at 6 percent moisture content and the poorest results at 20 percent (table 3). This work was done with the cabinet planer.
TABLE 2.—Occurrence of molding defects in various degrees ^
Species Defect-
free Slightly
defective More seri-
ously defective
Birch, yellow. Maple, hard_- Oak, white Sweetgum Yellow-poplar
Percent 73 63 94 84 86
Percent 25 25
5 13 13
Percent 2
12 1 3 1
1 Tests made on the molder, test samples at 6 percent moisture content, depth of cut He inch, cutting angle 20°, 20 knife marks per inch.
10

TABLE 3.—Planing: Effect of moisture content on quality of worh'^
Kind of wood
Defect-free pieces at moisture content of—
6 percent 12 percent 20 percent
Ash Basswood Beech Birch Chestnut Cottonwood-- Elm Blackgum Sweetgum Hackberry Hickory Magnolia Maple, hard__ Maple, soft___ Oak, chestnut. Oak, red Oak, white Pecan Yellow-poplar Sycamore Willow. ______
Percent 53 65 40 10 34 29 18 36 46 20 35 61 17 17 64 65 37 56 47 18 10
Percent 39 44 30
5 29 14
5 40 38 8
27 61 17 12 52 54 37 28 37 18 13
Percent 35 2
22 15 52 14 6
30 36 7
16 53 15 15 43 48 26 21 20 12 19
1 Based on 30° knife angle only and feeds of 36 feet per minute at 3,600 revolu- tions per minute, and 54 feet per niinute at 5,400 revolutions per minute.
Effect of Moisture Content Upon Specific Defects
With chipped grain, fuzzy grain, and raised grain, results at 6 percent or 12 percent moisture content differed little, either one being much better than 20 percent. Chip marks, on the other hand, were much less prevalent at 20 percent than at any lower moisture content (table 4).
Effect of Cutting Angles
The cutting angle is the angle between the face of the knife and a radial line (fig. 6). With planer-type machines, such as molders equipped with slip-on heads, it is often practical to change cutting angles by using two or more heads with knife slots at different angles. This applies to knives with only one bevel, such as knife 1 in figure 6. With large planers the same results can be obtained by using different sets of knives with different cutting bevels, such as knife 2.
The importance of cutting angles as a factor in the quality of planing varies greatly among species. The oaks, for example, are not much affected and plane well through a wide range of angles. Hackberry and willow, on the other hand, may yield three or four times as many defect-free samples at the optimum cutting angle as at the poorest one (table 5).
11

TABLE 4.—Effect of moisture content upon spécifie defects} of defect-free samples^ all species
Percent
Planing defect
Freedom from defect at moisture content of—
6 percent 12 percent 20 percent
Chipped grain Chip marks.__ Fuzzy grain.. Raised grain..
Percent Percent 89 90 59 53 83 73 91 90
Percent 73 82 53 64
1 Based on 30° knife angle only, 36-ft. feed at 3,600 r.p.m., and 54-ft. feed at 5,400 r.p.m. This work done with the cabinet planer.
The plant that specializes in one product, such as oak flooring, has only one wood to consider and can adapt its practices to the peculiar- ities of that wood. The general planing mill or the custom woodwork plant often handles a wide variety of species. Since it is not practical to change knife angles every few hours with a change of species, a cutting angle is adopted that experience and observation have shown
FIGURE 6.—Terms used in connection with planer knives: a, Cutting angle; ö, cutting bevel ; c, clearance bevel ; á, cutting circle ; 1 and 2, planer knives.
12

TABLE 5.—Planing: Effect of cutting angles on quality of work
Kind of wood Defect-free pieces at cutting angles of- -
5° 10° 15° 20° 25° 30° 40°
Alder red ^ Percent Percent
84 70 14
Percent
"'72' 18 52
""n" 35 47
"'si' 25 48 75
"'40' 85 78 76
"'56' 57 95 90 95 76 54 26 64 50
Percent 68 73 22 65 91 63 52 53 85 76 27 33 93 81 60 95 56 77 36 56 33 92 80 93 92 51 23 73 59
Percent
"'79' 32 68
'"65' 53 43
""65' 12 19 54
""20' 90 62 87
""51' 34 87 70 74 95 49 18 50 46 67
Percent 32 53 32 65 91
Percent 0
Ash - _-- -- -- - 69 12 Aspen
Rasswood Beech ^ 67 69 57 T^irr*Vi 2
Blackgum 42 52 58
37 96 34 31 18 20 74
5 75 61
Cherrv black ^ 35 Ohpstniit Cottonwood 4Q
24 37
37 24 47 74 15 75 78 88 79
Elm, soft Hackberry - - - Hickory ^ _ _ _ _ 65 Laurel, California _ _ _ 10
55 87 77
Madrone Magnolia _ - - -
IVIflnlp biffleaf ^ 40 17 18 65 30 37 57 44 18
20 Mfl.nle hard Maple, soft 43
66 80 74 78 35 25
61 96 70 98 82 66 39
Oak. red - - Oak, tanbark Oak, white Pecan Sweetguni Sycamore _ _ - Wolnnf hlnplr Willow _- - 32
66 46 75
10 48 Yellow-poplar__ _ _ __ 75 67
1
1 Work done on molder at 3,600 revolutions per minute and 60 feet per minute with >i6-inch depth of cut.
2 Includes yellow^ sweet, and all other commercial birches except white or paper birch.
to be best suited to a given set of needs. As a rule, this is 20° if the species are hardwoods or largely so, and 30° if softwoods are the chief raw material. Although angles smaller than 20° give good results m some species, they are little used because the power required is high and the dulling rate rapid. Except as indicated by footnote 1 m table 5, all work was done with the cabinet planer at 36 feet per minute and 3,600 revolutions per minute and at 54 feet per minute and 5,400 revolutions per minute at 6 percent moisture content.
Effect of Feed Rate^ Cutterhead Speed on Quality of Finish
In tests to determine the relation of feed rate and cutterhead speed to quality of finish, 5 different feed rates were combined with 5 different cutterhead speeds to give 20 knife marks per inch in each test. Eims made at each of these combinations with the two most commonly used cutting angles, 20° and 30°, are averaged in table 6.
I« 634933—62 3 ^
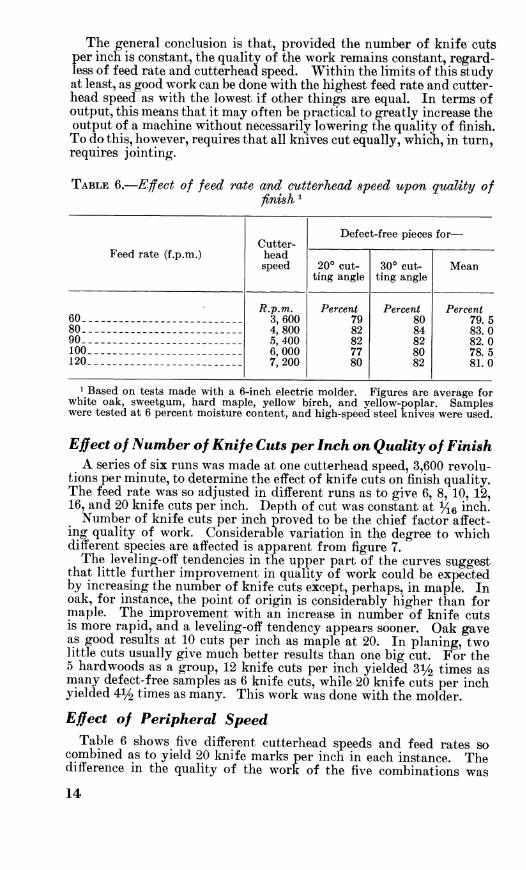
The general conclusion is that, provided the number of knife cuts per inch is constant, the quality of the work remains constant, regard- less of feed rate and cutterhead speed. Within the limits of this study at least, as good work can be done with the highest feed rate and cutter- head speed as with the lowest if other things are equal. In terms of output, this means that it may often be practical to greatly increase the output of a machine without necessarily lowering the quality of finish. To do this, however, requires that all knives cut equally, which, in turn, requires jointing.
TABLE 6.—Effect of feed rate and cutterhead speed upon quality of finish ^
Cutter- head speed
Defect-free pieces for—
Feed rate (f.p.m.) 20° cut-
ting angle 30° cut-
ting angle Mean
60 R.p.m.
3,600 4,800 5,400 6,000 7,200
Percent 79 82 82 77 80
Percent 80 84 82 80 82
Percent 79 5
80 83 0 90 82 0 100 78 5 120 81 0
1 Based on tests made with a 6-inch electric molder. Figures are average for white oak, sweetgum, hard maple, yellow birch, and yellow-poplar. Samples were tested at 6 percent moisture content, and high-speed steel knives were used.
Effect of Number of Knife Cuts per Inch on Quality of Finish
A series of six runs was made at one cutterhead speed, 3,600 revolu- tions per minute, to determine the effect of knife cuts on finish quality. The feed rate was so adjusted in different runs as to give 6, 8, 10, 12, 16, and 20 knife cuts per inch. Depth of cut was constant at %Q inch.
Number of knife cuts per inch proved to be the chief factor affect- ing quality of work. Considerable variation in the degree to which different species are affected is apparent from figure 7.
The leveling-off tendencies in the upper part of the curves suggest that little further improvement in quality of work could be expected by increasing the number of knife cuts except, perhaps, in maple. In oak, for instance, the point of origin is considerably higher than for maple. The improvement with an increase in number of knife cuts is more rapid, and a leveling-off tendency appears sooner. Oak gave as good results at 10 cuts per inch as maple at 20. In planing, two little cuts usually give much better results than one big cut. For the 5 hardwoods as a group, 12 knife cuts per inch yielded 31/2 times as many defect-free samples as 6 knife cuts, while 20 knife cuts per inch yielded 4% times as many. This work was done with the molder.
Effect of Peripheral Speed
Table 6 shows five different cutterhead speeds and feed rates so combined as to yield 20 knife marks per inch in each instance. The difference m the quality of the work of the five combinations was
14

10 12 14 16
KNIFE CUTS PER INCH (NUMBER ';
M-117352
FIGURE 7.—Effect of number of knife marks per inch upon quality of finish.
negligible. The fastest combination (7,200 revolutions per minute at 120 feet per minute) gave twice the output of the slowest (3,600 revolutions per minute at 60 feet per minute). The cutterhead in the fastest combination also had twice the peripheral speed of the slowest, in round figures, 10,000 feet per minute compared with 5,000 feet per minute. Within the above range and with a constant number of knife cuts per inch, the data show no connection between peripheral speed and quality of work.
15

The number of revolutions per minute of a cutting tool may be misleading unless the diameter of the tool is taken into account and the peripheral speed is computed. A half-inch router bit, for ex- ample, turning at 14,000 revolutions per minute has a peripheral sp^.ed of only 1,833 feet per minute, whereas an 8-inch circular saw at 3,600 revolutions per minute has a peripheral speed of 7,524 feet per minute.
Figure 7 shows that, with constant cutterhead speed (3,600 revolu- tions per minute in this test), the slower the feed rate the more knife marks per inch and the higher the percentage of defect-free pieces. Possibly the improved results that are sometimes attributed to higher peripheral speeds are actually due to more knife marks per inch.
Effect of Depth of Cut
A series of tests was made with four depths of cut: %29 %29 %29 and %2 inch. The shallowest cut gave much the best results with progressively poorer work as deeper cuts were made (table 7). The difference between cuts at %2 and those at %2 inch was much greater than between any other two successive cuts. " As usual, the different woods behaved in different ways. For example, beech and hickory were much more affected by depth of cut than elm and willow. At times the operator has little choice as to depth of cut, but where a preliminary roughing cut is practical, results can often be substan- tially improved by taking this factor into account. The cabinet planer was used for this test.
TABLE 7.—Planing: Effect of depth of cut on quality of worh^
Kind of wood
Ash Beech Cottonwood__ Elm Blackgum Sweetgum Hackberry Hickory Magnolia Maple, soft _ _ Oak, red Oak, white J__ Pecan Yellow-poplar Sycamore Willow
Defect-free pieces at depth of cut of—
yz2 inch
Percent 58 76 38 6
62 36 28 46 78 40 74 58 50 64 22 30
%2 inch
Percent 38 40 12i 4
38 22 10 6
50 28 56 34 28 36
8 16
%2 inch
Percent 32 34 20
0 40 14
6 14 52 30 36 22 26 44
2 20
^2 inch
Percent 26 24
6 0
34 16 4 6
48 14 28 24 30 34
4 20
1 Based on 30° knife angle only, 36-foot feed per minute at 3,600 revolutions per minute, and 6 percent moisture content.
16

Eßect of Knife Jointing Upon Quality of Finish and Volume
of Output
Modern planers, except for the smallest sizes, are usually equipped with attachments for grinding the knives without removing them from the cutterhead. Typically, this equipment consists of a small abrasive wheel with its motor. These are attached to a grinding and jointing bar above the cutterhead and traversed back and forth along the knife edges. Knives are ground one by one while the cutterhead is stationary. The bevel that is ground in this way is not a straight line, but conforms to the circumference of the grinding wheel (fig. 8, A), But even with careful work, all knives usually project unequally and consequently do not cut equally. With a four-knife cutterhead, for instance, one knife that projects a trine too far may wipe out the marks of the other three knives. This is called one-knife work and would leave one wide knife mark per revolution (fig. 9, J-), instead of four narrow ones (fig. 9,5).
/^AZ/FE EDGE (ENLARGED)
JOINTING STONE
\ CUTTING CIRCLE
FIGURE 8.-
B
M-117350
-Procedure for A, grinding, and B, jointing planer knives.
The object of the next step, jointing, is to equalize the projection of the knives so that all will cut equally and give good work and good volume at the same time. In jointing, a carrier holding an abrasive stone is attached to the grinding and jointing bar, and the cutterhead is then set in motion. The stone is lowered until it barely touches a knife edge and is then traversed along the edge of the knives. This is continued until examination shows a fine line, called a joint or land, for the full length of the edge of each knife. Projection is now equalized.
As the knives gradually dull, jointing may be repeated several times as a sharpening process. Eepeated jointing, however, finally results in a pronounced heel (upper left, fig. 8, B), The jointed portion of the bevel is part of the cutting circle and therefore has no clearance. The wider it becomes beyond certain limits, the more pounding and rubbing take place and the poorer the work. A common recommenda- tion calls for regrinding as soon as the joint reaches a width of about
inch. 1/32
17

M-34182-F
FiGUEE 9.—A, One knife,mark per revolution before jointing of planer knives; B, four knife marks per revolution after jointing.
Jointing is especially applicable to long runs of stock items and therefore has its limitations. In custom woodwork, on the other hand, the work often consists largely of numerous short runs. Not infre- quently the time spent in changing setups greatly exceeds actual running time, thereby reducing feed rate to second importance. Un- der those circumstances, one-knife work is common with the feed rate slowed down far enough to yield a satisfactory number of knife cuteper inch.
Where each knife in the cutterhead is doing its share of the work, the number of knife cuts per inch will agree with the following formula :
r.p.m. of cutterhead X number of knives In head feed rate In f.p.m. X12
: number of knife cuts per Inch.
Where the theoretical number of knife cuts, as determined by the formula, does not agree with the actual number, as determined by careful visual inspection, the jointing operation is at fault.
Power Requirement in Planing
Power requirement tests involved five of our principal native hard- woods : white oak, hard maple, yellow birch, yellow-poplar, and sweet- gum. The tests were made with a 6-inch molder, using straight knives and taking cuts y^g inch deep. The moisture content of the test material was 6 percent.
18

Power requirement, as the term is used here, refers to net power requirement; that is, total power requirement when the machine is cutting, minus idling power. Within a given species, power require- ment varies directly as the width of the lumber and as the depth of cut, and increases rapidly as knives and cutters become dull.
In general, the power required to plane different woods is roughly proportional to their specific gravity. Hard maple, for instance, required about l^/^ times as much power as sweetgum (table 8).
TABLE 8.—Specifvc gravity in relation to power requirement
Species Specific
gravity of test sam-
ples 1
Power required
Yellow-poplar Sweetgum Birch, yellow. Oak, white Maple, hard..
Kilowatts 3.2 2.8 3.3 3.5 4.2
1 Based on weight and volume at test.
Feed Rate^ Cutterhead Speedy and Power Requirement
It will be recalled that the combinations of feed rate and cutterhead speed used in this study had no significant effect on quality of finish. Power requirements, however, increased steadily with increases in feed rate and cutterhead speed. Increasing these rates from 60 feet per minute and 3,600 revolutions per minute to 120 feet per minute and 7,200 revolutions per minute, for instance, increased the power requirements about 2i/^ times (table 9).
Cutting Angle and Power Requirement
As has already been shown, the better machining results were ob- tained with the smaller cutting angles. These better results were paid for, to some extent, by greater power requirement. Table 10 shows that power requirements steadily decreased with increase in the cutting angle. The 0° cutting angle required nearly three times as much power as the 40° angle.
High'Speed Steel Knives and Carbide-Tipped Knives
The work done with the molder makes possible certain comparisons between high-speed steel knives and carbide-tipped knives. Carbide- tipped knives took one-third more power than high-speed steel knives, but with this exception, both knife types gave results that were closely parallel. Under the conditions of this test, with the five chief hardwoods at 6 percent moisture content, the difference in the quality of the work was negligible. For all practical purposes the study may be considered as based on freshly sharpened tools of both materials. But carbide-tipped knives have a much longer sharpness life than high-speed steel ones, and results with these two materials would not necessarily be the same after a few hours' running time.
19

TABLE 9.—Feed rates^ cutterhead speeds^ and power requirements in machining wood at 6 percent moisture content
Power requirement at feed and speed of—
Type of knife and cutting angle (degrees) 60
f.p.m., 3,600 r.p.m.
80 f.p.m., 4,800 r.p.m.
90 f.p.m., 5,400 r.p.m.
100 f.p.m., 6,000 r.p.m.
120 f.p.m., 7,200 r.p.m.
Average
High-speed steel: 20
Kilowatts 2.6 1.7 2. 15
3.2 2, 1 2.65
Kilowatts 3.0 2.8 2.9
4.9 3.0 3.95
Kilowatts 3.3 3.3 3.3
5.5 4. 1 4.8
Kilowatts 4.2 3.5 3.85
6.4 3.7 5.05
Kilowatts 4.6 5.3 4.95
7.1 5.8 6.45
Kilowatts 3. 5
30 3. 3 Average
Carbide : 20
3.4
5. 4 30 3,7
Average 4.55
TABLE 10.—Gutting angles amd power requirement with high-speed steel knife^ wood at 6 percent moisture content
Species Power requirement at cutting angle of—
10° 20° 30° 40° Average
Maple, hard__ Oak, white Birch, yellow _ Yellow-poplar Sweetgum
Kilo- watts
8. 1 7.4 7. 1 7.0 6.3
Kilo- watts
5.8 5.0 5.0 4.9 4.5
Kilo- watts
4.4 3.5 3.5 3.3 3.0
Kilo- watts
4. 1 3.5 3.2 3. 1 2.7
Kilo- watts
3.2 2.6 2.6 2.4 2. 1
Kilo- watts
5.3 4. 4 4.3 4, 1 3. 7
SHAPING
The shaper finds its chief use in the furniture industry. Although it can be used for straightline cuts as in moldings, its distinctive use is to cut a pattern on some curved edge like that of a round table top.
There are pov^er-feed automatic shapers, but by far the most com- mon type is the spindle shaper. This machine may have either one or two vertical spindles on which one-piece cutters or knives held in collars are mounted. Spindle shapers are typically hand-feed ma- chines, although power-feed attachments are available on the market.
A one-spindle shaper using small diameter cutterheads for light to medium work may weigh 1,200 pounds and run at speeds of 15,000 to 20,000 revolutions per minute. Under those conditions, satisfac- tory cuts either with or against the grain may usually be obtained.
The machine used in these tests was a two-spindle hand-feed ma- chine weighing 2,500 pounds and running at 7,200 revolutions per minute. When two spindles are employed, they rotate in opposite directions, so that one or the other can always cut with the grain.
20

From the standpoint of quality of work, the peripheral speed, which is dependent on both the revolutions per minute and the size of the cutting tool, is more significant than the number of revolutions per minute. Peripheral speed at 3,600 revolutions per minute, for in- stance, will vary from 470 feet per minute for a i^-inch router bit up to 9,400 feet per minute for a 10-inch circular saw. Even at 20,000 revolutions per minute, the i^-inch router bit would have a peripheral speed of only 2,600 feet per minute.
The primary object of the work was to compare and measure the shaping qualities of the various hardwoods under conditions that were uniform and fairly typical. Some additional data were obtained on certain factors, but these were merely incidental.
Test Procedure Before the actual shaping operation, the test samples were band-
sawed to a curved outline (fig. 10, A). Woodworking machines, like handtools, differ in the way that they cut wood at different angles to the grain, and the outline chosen required cuts varying from right angles to parallel to the grain. The actual shaj)ing was done by an experienced operator (fig. 10, B), the samples being fastened to a jig and fed past the knives by hand.
^HK^ I^H^H')^ ^Dij^H^^^^^^^^^^^^^^^^^^^^^^^^^^^^^^^^^^^^^^^^^^^^^^^^^^^^^^^^^^^^^^^^^^^^^^ll
^'^^^^^ pn láÍÍÜÍuñ 1 àà^^ ñü.* yáu
■■■^^I^I^^BB
FiGXTBB 10.—Type of sample used for shaping : A, the blank ; B, finished sample ; C, end-grain cut on bigleaf maple ; D, end-grain cut on red alder.
Two separate runs were'made (after a preliminary roughing cut), one with the samples at 6 percent moisture content and the other after conditioning the samples to 12 percent.
Following each run the samples were graded on the basis of such defects as raised, fuzzy, chipped, and torn grain. For all practical purposes the most defective place on a shaping determines its grade ; that is, the worst place indicates the amount of sanding that will be jiecessary to make it commercially acceptable.
634933—62- 21
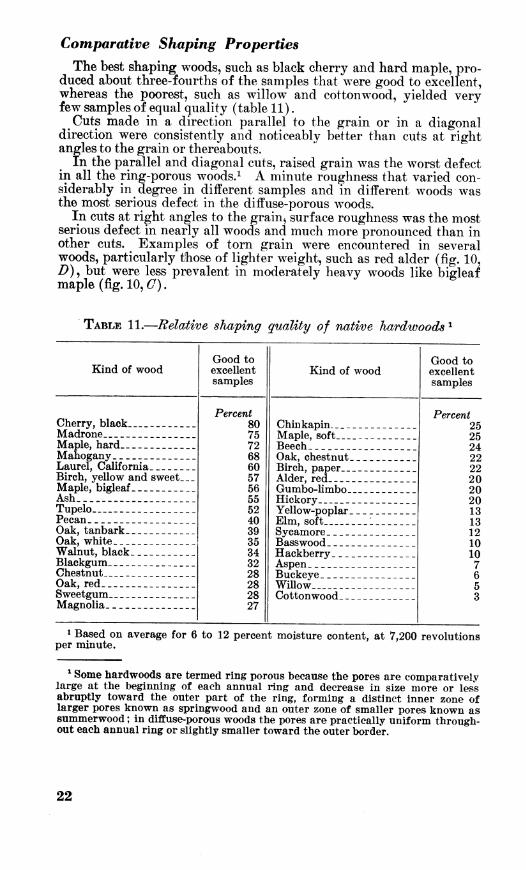
Comparative Shaping Properties
The best shaping woods, such as black cherry and hard maple, pro- duced about three-fourths of the samples that were good to excellent, whereas the poorest, such as willow and cottonw^ood, yielded very few samples of equal quality (table 11).
Cuts made in a direction parallel to the grain or in a diagonal direction were consistently and noticeably better than cuts at right angles to the grain or thereabouts.
In the parallel and diagonal cuts, raised grain was the worst defect in all the ring-porous woods.^ A minute roughness that varied con- siderably in degree in different samples and in different woods was the most serious defect in the diffuse-porous woods.
In cuts at right angles to the grain^ surface roughness was the most serious defect in nearly all woods and much more pronounced than in other cuts. Examples of torn grain were encountered in several woods, particularly those of lighter weight, such as red alder (fig. 10, Z?), but were less prevalent in moderately heavy woods like bisrleaf maple (fig. 10, Í7). ^
TABLE 11.—Relative shaping quality of native hardwoods '■
Kind of wood
Cherry, black Madrone Maple, hard Mahogany Laurel, California Birch, yellow and sweet Maple, bigleaf Ash Tupelo Pecan Oak, tanbark Oak, white Walnut, black Blackgum Chestnut Oak, red Sweetgum Magnolia
Good to excellent samples
Percent 80 75 72 68 60 57 56 55 52 40 39 35 34 32 28 28 28 27
Kind of wood
Chinkapin Maple, soft___ Beech Oak, chestnut Birch, paper__ Alder, red Gumbo-limbo. Hickory Yellow-poplar Elm, soft Sycamore Bass wood Hackberry Aspen Buckeye Willow Cotton wood _-
Good to excellent samples
Percent 25 25 24 22 22 20 20 20 13 13 12 10 10 7 6 5 3
1 Based on average for 6 to 12 percent moisture content, at 7,200 revolutions per minute.
* Some hardwoods are termed ring porous because the pores are comparatively large at the beginning of each annual ring and decrease in size more or less abruptly toward the outer part of the ring, forming a distinct inner zone of larger pores known as springwood and an outer zone of smaller pores known as summerwood ; in diffuse-porous woods the pores are practically uniform through- out each annual ring or slightly smaller toward the outer border.
22

Factors Affecting Results
Moisture Content.—Moisture content did not appear to be an im- portant factor in shaping, at least as between pieces at 6 and 12 per- cent. In most woods, results differed little at these two moisture content levels; with some, 6 percent gave the better results; with others, 12 percent. For these reasons, table 11 is based upon an average for both moisture content levels.
Pore Arrangement.—The very best shaping woods were all diffuse porous, but so were the very poorest. The ring-porous and diffuse- porous woods were mixed in the middle of the list in table 11, failing to show any consistent relationship between pore arrangement and shaping properties.
Specific Gravity.—As far as side-grain cuts in (Jifferent species are concerned, specific gravity seemed to have relatively little influence on the quality of the work. With cuts across the end grain, however, the heavier species were consistently better than the light ones, which tended to crush and tear instead of cutting smoothly. To a large degree the order of the species in table 11 reflects difference in the quality of the end-grain cuts. Where there was any considerable dif- ference in the specific gravity of different pieces of the same wood, the heavier pieces gave better results.
Other Factors.—Any complete study of shaping would include other factors, such as speed of the cutterhead and feed rates. Limited tests indicate that cutterhead speed has little influence between 3,600 to 7,200 revolutions per minute. If trade opinion is right, however, it would be significant between 7,200 and 15,000 revolutions per minute. Eate of feed affects the number of knife marks per inch, and it seems almost certain that this would be important in shaping, as it has proved to be in planing.
TURNING
The lathe is probably the oldest type of woodworking machine. A wide variety of turned products is made, including tool and implement handles, spools and bobbins, certain types of woodenware, and sport- ing goods, chair, furniture, and toy parts. Lathes are made in sev- eral distinct types that range from specialized automatic machines capable of making several hundred turnings per hour to the familiar manual training hand lathe. Although turnings are not one of the larger wood uses, they are chiefly high-quality products with a value out of proportion to the volume.
Test Procedure
A milled-to-pattem knife was designed that produced small turn- ings with considerable detail. The knife was held in a compound rest of the type used for metal turning, enabling the operator to make several hundred identical turnings in the course of a day. The equip- ment embodied the back-knife principle, with modifications to adapt it to a small hand lathe. The turnings (fig. 11) contained a bead, cove, and fillet together with cuts at several different angles with the grain, in fact, most of the common features of turning. They were 5 inches long and % inch in smallest diameter when finished. Turn- ings were made at three moisture content levels, 6, 12, and 20 percent,
23

M-117462
FIGURE 11.—^Test samples used in turning show range in quality of work.
and at 3,300 revolutions per minute. Commercial wood turners with whom the problem was discussed expressed the opinion that this was a more severe test than when turnings are subjected to ordinary manu- facture, and that it was a good means of comparing thé turning qual- ity of diflferent woods and ascertaining the effect of certain factors upon turning.
Each turning was carefully examined and graded, taking into account sharpness of detail and smoothness of surface. The poorest point in a turning was the controlling factor, because that point governs the amount of sanding necessary to make it commercially acceptable. Grading was done on a numerical scale of 5, in which 1 represented a perfect turning and 5 a reject (fig. 11).
Comparative Turning Properties Turning quality of 34 hardwoods was evaluated (table 12). Al-
though the spread in quality from best to poorest was not nearly so wide as for most machining properties, the poorest woods yielded several times as many inferior turnings as the best. Consecutive species were seldom more than 1 or 2 percent apart.
24

Factors Affecting Results
Specific Gravity,—Six of the seven poorest turning woods—aspen, gumbo-limbo, cottonwood, basswood, willow, and buckeye—were the lightest woods tested. Aside from this, no consistent relationship between the average specific gravity of a wood and its turning qualities could be traced. Woods of light, medium, and heavy average weight were found in nearly all parts of the list in table 12, which suggests that structure outweighs specific gravity in importance. In general, however, the heavy pieces of a given wood tended to turn better than the light pieces, although the difference was not very pronounced.
Moisture Content.—In general, the woods tested turned about equally well at 6 and 12 percent moisture content, and decidedly better than at 20 percent (table 13).
The turning quality of the woods was affected by moisture content in varying degree. Elm^ hackberry, pecan, and mahogany were rela- tively little affected. At the other extreme was a group of the lightest and softest woods, including basswood, cottonwood, yellow-poplar, and willow, all of which gave much poorer results at 20 percent.
TABLE 12.—Relative turning qualifies of hardwoods
Kind of wood
Walnut, black Beech Oak, chestnut Mahogany Pecan Alder, red Cherry, black Madrone Chestnut Laurel, California. Sweetgum Oak, white Sycamore Hickory Oak, red Maple, hard Oak, tanbark
Fair to excel- lent turn- ings
Percent 91 90 90 89 89 88 88 88 87 86 86 85 85 84 84 82 81
Basis of com- parison ^
Kind of wood
Yellow-poplar _ Birch Maple, bigleaf- Ash Magnolia Tupelo Chinkapin Hackberry Maple, soft — Blackgum Cottonwood--_ Basswood Aspen Elm, soft Gumbo-limbo _ Buckeye Willow
Fair to excel- lent
turn- ings
Percent 81 80 80 79 79 79 77 77 76 75 70 68 65 65 60 58 58
Basis of com- parison 1
1 Basis No. 1: Average for 3 moisture content levels, 6, 12, and 20 percent. Basis No. 2: Tested at 6 percent moisture content only.
Breakage of turnings was negligible or lacking at 6 and 12 percent moisture content, but appreciable in the poorer woods at 20 percent. This breakage occurred largely because only one knife did all the work at one pass. In commercial back-knife lathes, two knives are used—one for a roughing cut and one for a finishing cut.
25

TABLE IS,—Turning : Influence of moisture content on work
Kind of wood
Ash Basswood Beech Birch ""I" Buckeye ~~ Chestnut II'11 Cottonwood Elm lllV.V. Blackgum ~~ Sweetgum Hackberry I Hickory I" Magnolia HI" Mahogany ~ Maple, hard I~ Maple, soft HH Oak, chestnut ~ Oak, red I_V Oak, white ~_~_ Pecan V.V.. Yellow-poplar 11II! Sycatnore Tupelo IIIIIIIII! Walnut Willow
Fair to excellent turnings at moisture content of—
6 percent 12 percent
Percent 93 88 99 93
100 100 92 60 80 95 78 99 69 89 95 96
100 90 93 92 98 97 88 96 79
Percent 98 76 92 82 52 99 75 70 86 92 87 88 98 91 87 82 95 95 92 93 98 98 94 88 51
20 percent
Percent 45 35 78 62 21 63 52 61 72 77 78 83 89 87 63 54 84 75 78 94 49 67 67 90 39
1 Based on a laithe speed of 3,300 revolutions per minute.
Speed of the Lathe,~The best lathe speed depends upon the diam- eter of the turning regardless of species. Tests made at four speeds ranging from 950 to 3,300 revolutions per minute showed that, with t^est pieces 0.75 inch square, the higher the speed the better the results Subsequent tests were made at the highest available speed, 3,300 revolutions per minute. t^ ^ ^ ^
Number of Rings per InckSe^rch was made for a possible relation- ship between number of annual growth rings per inch and turning quality, but without result. The number of rings in itself offered little it any, indication of turning qualities, either as between fast-growing and slow-growing woods or as between fast-growing and slow-lrowini pieces m the same wood. ^ ^ ë ^ ^^^^
BORING
Boring is commonly done wherever dowels, spindles, rungs, and
?roXctr '"' '^^^'''^ '^^''^'' furniture, and other hardwood
Some of the wood boring bits of today are not greatly changed llT !ilT'u ^fg^^^/fother's day. The carpenter still has h's brace and bits, but m industrial woodworking electric power has re-
Pif^p .ÎÎÎt?P'''^-^'^^i ^^""^ "f 'rP^^ ^' ^^y stationary boring machine IS the smgle-spmdle, hand-feed type. At the other extreme are auto-
26

matic multiple-spindle machines that bore several holes of pre- determined depth and angle at the same time.
Although it is not one of the most important woodworkmg opera- tions, the quality of the boring either adds to or detracts from the general utility of any species. A smoothly cut, accurately sized hole is necessary for the best glue joint. The woods that were tested differed very noticeably not only in both the above respects, but also in the power consumed and in the rate of dulling of the tool.
There are many types of bits, wood drills, and bormg machines, often highly specialized for a particular job on a mass production basis. In these tests the equipment used was a general purpose type, such as might be found in nearly any small woodshop.
Test Procedure
A small motor-driven boring machine operating at 2,400 revolutions per minute was used. Mechanical means of feeding the bit into the wood at a uniform rate would have been desirable, but the machine permitted only hand feed. The rate, however, was kept uniform by means of a stopwatch. The bit itself was the 1-inch size, smgle-twist, solid-center, brad-point type, kept in first-class cutting condition by polishing the flutes and by frequent light sharpenings of the cutting edsres.
The test samples were commercial flat-grain material, three-fourths of an inch thick, at 6 percent moisture content. They were bored with two 1-inch holes each, making from 100 to 200 holes for each wood. The work was firmly held during boring, and the holes were bored through into a softwood backing to prevent splintering on the exit side.
Comparative Boring Properties
Smoothness of Out.—One criterion of good boring is a clean, smooth cut with a minimum of crushing or fiber tearout on the cut surface. The holes were examined and graded for smoothness of cut, and the different woods were graded according to the percent of holes m each that were good to excellent in this respect (table 14). Eesults of bor- ing are illustrated in figure 12 by a smooth-boring wood, pecan, and a rough-boring wood, willow. The upper half of each sample shows side grain and the lower half, end grain. The wood at each side of the holes has been sanded to show the grain more plainly, but the in- side of the holes is just as left by the bit. In pecan, the effect of the pressure and the cutting action of the bit produced no distortion of grain. In the willow, however, crushing and tearout of the grain are pronounced. . .
The woods did not differ so widely in boring as they did m many other machining properties. Although the contrast between the best and poorest was fairly great, most of the woods tested were about on a par, with 90 percent or more of the holes good to excellent.
Accuracy of Size.—The holes were measured with a plug gage so designed as to permit measurement to the nearest 0.0015 inch. Meas- urements were taken both parallel to the grain and across it immedi- ately after the holes were bored. The difference in average measure- ments in the two directions was measurable, and the holes were con- sistently larger across the grain than parallel to it.
27

FIGURE 12.—Difference in smoothness of boring cuts produced in different woods : upper, pecan, a smootli-boring wood ; loiver, willow, a rough-boring wood.
The bored holes differed from the actual size of the bit by amounts ranging up to about 0.0025 inch (table 15). These figures are aver- ages for 100 to 200 holes for each Avood. Some individual pieces were found to be as much as 0.006 inch off size.
In several woods, chiefly the harder ones, the holes averaged slightly smaller than the bit. Apparently this was due to recovery of fibers that had been flattened, bent, or compressed during boring and then partially recovered their original position. Oversize holes, however, were much more common than those undersize.
Off-size holes, or different-sized holes in different woods bored with the same bit, help to explain why some woods split considerably more than others when doweled. In contrast, holes in some pieces of beech were 0.002 inch undersize and in some pieces of magnolia as much
28

TABLE 14t.—Boring: Relative smoothness of cut in hardwoods
Kind of wood
Laurel, California. Cherry, black Hickory Madrone Mahogany Maple, bigleaf Oak, chestnut Pecan Oak, tanbark Walnut, black Beech Hackberry Maple, hard Oak, red Sycamore Birch Oak, white
Good to excellent
holes
Percent 100 100 100 100 100 100 loa 100 100 100 99 99 99 99 98 97 95
Kind of wood
Ash Elm Sweetgum Chestnut Chinkapin Yellow-poplar. Blackgum Maple, soft Aspen Basswood Buckeye Willow Magnolia Cottonwood-- Alder, red Tupelo Gumbo-limbo-
Good to excellent
holes
Percent 94 94 92 91 90 87 82 80 78 76 75 71 71 70 64 62 60
as 0 006 inch oversize, which is enough to make the difference between a drive fit and a loose fit with an accurately sized dowel. The com- bination of a dry dowel of a high-shrinkage wood and thm liquid glue might make trouble with one wood and not with another m such instances. ., ^ x i. ^ i, ^^o
The size of a given hole is not necessarily constant, but changes with changes in moisture content. The tests indicated that holes bored in dry lumber increase in size as the moisture content increases, in- crease across the grain was more marked than increase parallel to
TABLE 15,—Boring: Variation from size of hored holes in hardwoods ^
Kind of wood
Pecan Oak, red Hickory Birch Elm Ash Mahogany Sweetgum Willow Oak, white Oak, chestnut- Maple, hard--. Hackberry
Amount off size
Inch 0. 0001 .0002 . 0003 . 0004 .0004 .0005 .0005 .0005 .0005 .0006 .0006 .0006 .0006
Kind of wood Amount off size
Cherry, black-. Walnut, black- Chestnut Sycamore Beech Blackgum Yellow-poplar- Tupelo Basswood Buckeye Maple, soft— Cottonwood-- Magnolia
Inch 0. 0007 .0009 .0009 .0009 .0010 .0010 .0011 .0015 .0020 .0022 . 0022 . 0024 . 0025
1 Figures represent off size either across the grain or parallel to it, whichever is greatest.
29 634933—62 5

the grain because of the difference in swelling and shrinkage rates in the two directions.
Power Required in Boring
The woodworker quickly notices a difference in the effort required to cut different woods with hand-feed machines of any type. This difference is reflected both in the volume of work accomplished and m the amount of power required. During the day's work a man will bore fewer holes in hard maple or hickory, for instance, than in bass- wood, and more power will be required in the process (table 16). Even where the feed is mechanical, thus maintainmg the daily output, the power requirement factor still remains. Ease of cutting, then, di- rectly affects the all-important matter of costs in wood fabricating and this m turn affects the utility. In testing these woods for the average power required in boring a 1-inch hole, hickory took more than three times as much power as basswood.
The heavier the wood, as a rule, the more power required (fig. 13). Several of the heavier woods, however, including white oak, chestnut oak, and birch, took less power than might be expected from weight alone. Another point of interest is that power requirement increased much faster than specific gravity; for instance, ash is about li/o times as heavy as basswood, but it used about 21/2 times as much power in
0.8
0.7
0.6
^ 0.5
a ^0,4 3 S Ö: 0.3
O 0.
0.2
0.1
COTTONWOOD
-•SYCAMORE-
SOFT MAPLE^^BLACKGUM
MAGNOLIA • ' *^^^
HACKBERRY
TUPELO •SWEETGUM
i YELLOW-POPLAR
• WILLOW
i'BASSWOOD
•CHESTNUT
•BUCKEYE
BEECH • PECAN
• HARD MAPLE
•BIRCH
iREDOAK I m CHESTNUT OAK • WHITE OAK
0.30 0.35 0.40 0.45 0.50 SPECIFIC GRAVITY
0.55 0.60 0.65
M-38695-F
FIGURE 13.—Relationship of specific gravity to power requirement for 23 hardwoods.
30

TABLE 16.—Boring: Power required in boring a 1-inch hole in wood at 6 percent moisture content
Kind of wood
Basswood Willow Chestnut Cottonwood-- Yellow-poplar Sweetgum Tupelo Hackberry— Oak, white Magnolia Oak, chestnut
Power required
Watts 220 270 280 290 315 380 390 400 430 440 440
Kind of wood
Elm Maple, soft- Blackgum_- Oak, red Birch Sycamore __ Maple, hard Pecan Ash Beech Hickory
Power required
Watts 450 460 460 465 500 500 520 540 555 560 740
In plotting similar data for 100 or more holes in a given wood, it was found that the heavy pieces consistently used more power than did the light ones, which parallels the trend shown in figure 13. Power requirement has received serious consideration as one measure of workability. It is, of course, only one of several considerations.
The group of woods that yielded 90 percent or more of good to excellent holes, based on smoothness of cut, was composed of medium to heavy woods. The poorer group consisted of light- to medmm- weight woods. Mahogany, black walnut, and hackberry were among the medium woods that gave excellent results. On the other hand, magnolia and túpelo represent medium-weight woods that gave poor
• results. As a general rule, however, the heavier woods yield more smoothly cut holes than do the light woods. i v i.
The heavy woods as a class bored more accurately than the light ones, although there were occasional exceptions. Willow, one of the very lightest, was among the best. Other exceptions were soft maple and magnolia, both of which are moderately heavy but among the poorest woods in boring accuracy.
MORTISING
The mortise and tenon joint has been used from time immemorial to fasten together the members of wood products and structures. Today furniture is the commonest hardwood product in which the mortise and tenon are used extensively. In the hewn timbers of old colonial buildings, handtools offered the only means of making mortises, but the modern furniture factory has machines for making them much more quickly and precisely. Although it is a less important operation than planing or sanding, mortising is still one of the factors to be considered in appraising the workability of any wood. The tenoning operation is performed on an entirely different machine and is not discussed here
Mortising machines include the chain, reciprocating-bit, and hollow- chisel types, each of which has its characteristic use. The hollow-chisel type was used for the research reported here. These vary from
31

!^
FJldtz:'Èm. km JêÊ'
M-28268-F
FIGURE 14.—Contrast in smoothness of cut in mortising different woods : 1, 2, and 5, soft maple ; 3, 4, and 6, red oak ; 1 and 3, side grain ; 2 and 4, end grain. Arrows indicate direction of cut in samples 1 to 4.
32

light, hand-feed, single-spindle machines up to multiple-spindle, power-feed madhines that can be adjusted for depth of stroke and number of strokes per minute.
In these tests a hand-feed, single-spindle mortiser was used. With this device, which is well known to all woodworkers, the mortise is produced by the action of two separate cutting tools. The specially designed bit revolving inside the hollow chisel of square cross section comes first. The bit bores a hole slightly in advance of the four edges of the chisel, which cut out the corners of the square as they follow the bit. By making several cuts, a mortise several times as large as the chisel itself can be produced.
Test Procedure
The test samples were % inch thick and had 6 percent moisture content. Mortises l^ inch square were made in each piece. One set of standard conditions was applied uniformly to all woods. Although the machine used was hand fed, a relatively uniform rate of feed was obtained by the use of a stopwatch. Both the bit and the chisel were sharpened at frequent intervals to prevent progressive dulling of the tool. Spindle speed was 2,400 revolutions per minute.
The finished mortises were examined and graded for smoothness of cut and measured with a steel gage for trueness to size. In these characteristics, as in other machining properties, the different woods varied widely. Although the mortise is largely concealed m the fin- ished product, a smoothly cut, accurately sized mortise obviously makes the best joint.
Comparative Mortising Properties
Smoothness of Cut—Two of the four sides of each mortise ran across the grain and two parallel to the grain. Cuts parallel to the grain were passably smooth in all woods. Across the gram, however, the woods varied widely, some of them showing considerable crushing and tearing. The position of the different woods in table 17 is deter- mined largely by smoothness of cut across the grain. The figures in- dicate the percentage of mortises in different woods that were fair to excellent in smoothness of cut, the best woods yielding four or five times as many mortises of that quality range as did the poorest ones.
A wide contrast in smoothness of cut in different woods is illustrated in figure 14. Samples 1, 2, and 5 are soft maple from one board and samples 3, 4, and 6 are red oak from one board. Samples 1, 2, 3, and 4 are sawed through so that the character of the inside of the mortises can be plainly seen. Samples 1 and 3 show side grain and samples 2 and 4 end grain. The arrows on samples 1 to 4, inclusive, indicate the direction of cut of the hollow chisel. , ,
Soft maple is one of the poorest woods for hollow-chisel mortising. Some evidence of crushing, tearing, compression, and general rough- ness appears on the side grain, but the end grain is much worse. The great bulk of the grain distortion and damage occurs in the corners where the cutting is done wholly by the chisel as is shown by sample 1 and more plainly by sample 2. In the red oak samples, the cuts are relatively smooth* with negligible distortion of grain. The mark of the bit shows plainly on the red oak, occupying about the central third of the cut.
33

TABLE Vï,—Mortising: Relative smoothness of cut in hardwoods
Kind of wood
Laurel, California Cherry, black Mahogany. Oak, tanbark Oak, white Hickory Pecan Walnut, black Birch Oak, chestnut Sycamore Oak, red Madrone Maple, hard Beech Chinkapin Maple, bigleaf
Fair to excellent mortises
Percent 100 100 100 100 99 98 98 98 97 96 96 95 95 95 92 90 80
Kind of wood
Elm, soft Hackberry Chestnut Yellow-poplar Aspen Ash Sweetgum Alder, red Cotton wood __ Bass wood Gumbo-limbo _ Maple, soft___ Tupelo Magnolia Blackgum Willow Buckeye
Fair to excellent mortises
Percent 75 72 70 63 60 58 58 52 52 51 50 34 33 32 24 24 18
Samples 5 and 6 of figure 14 were planed down to half their original thickness to disclose the extent of damage to the wood fiber by the chisel corners. The soft maple, sample 5, shows the damage to be much more than superficial, for particles often break out in planing to a depth of one-eighth inch or more back of the chisel cut. A series of successive planer cuts in the soft maple showed the same result; as fast as one defect was planed out, another appeared. The red oak sample 6, shows no more than slight traces of this sort of damage. A mortise m red oak, therefore, offers a sounder base for gluing the tenon than does a mortise in soft maple. The typical mortise is usually three or four times longer than wide, hence consists more largely of side gram than end grain.
Accuracy of /S'^^ö.—Measurements were taken with a steel gage graduated m thousandths of an inch. In most of the hardwoods tested the mortises were off size or varied from the actual size of the hollow chisel by amounts up to 0.006 inch parallel to the grain and 0.002 inch across the gram. In addition, the mortises tended to taper slightly being larger on the side where the tool entered the wood. The taper was usually about 0.003 inch parallel to the grain and less than 0 001 oAA ^^J*.ight angles. The foregoing figures are averages for 100 to 2U0 mortises m each wood; many individual pieces would necessarilv show considerably more off size and taper. In view of the rather liberal tolerances allowed in machining wood, however, the data on 00 size and taper m mortises are not very significant except as a measure of the ability of different woods to machine to close limits
fetrange as it may seem, the off-size holes were nearly always smaller than the actual size of the hollow chisel, owing in all probability to recovery of the wood fibers from compression. The woods were measured where off size is most pronounced; that is, parallel to the gram and on the side of the sample from which the chisel emerges 1 heir ranking is given m table 18. ^
34

Factors Affecting Results
Specific gravity was the principal contributing factor. The heavier woods in general produced more smoothly cut mortises and were less off size than the lighter woods, but as usual there were exceptions to the rule. Mahogany and black walnut gave better results than their weight alone would indicate, whereas magnolia and blackgum gave poorer results. Among the 50 samples of each wood, it was usually noticeable that the heavy pieces were better than the light ones.
Pore arrangement had little influence on the results. It is appar- ently immaterial whether a wood is ring porous or diffuse porous. Some of the woods in each class were excellent, others not so good. Fast-growing woods and slow-growing woods did not differ consist- ently in mortising qualities.
Other factors affecting mortising were chiefly those from operation of the tool itself, such as the speed of the bit in revolutions per minute and the rate at which the chisel is fed into the wood. Study of such factors would no doubt reveal means of improving the performance of the poorest woods.
TABLE 18.—Mortising: Relative degree of off sisie in ha/rdwoods ^
Kind of wood Off size Kind of wood Off size
Walnut, black Inch
0. 0008 . 0014 .0021 .0025 .0026 .0028 .0030 .0031 .0034 .0035 .0036 .0036 .0039
Blackgum Inch
0. 0039 Mahoffanv Ash. - . 0041 Manie, hard Magnolia .0042 Pecan Tupelo- .0043 Hickorv Beech . 0044 Birch __ _ _ Sycamore .0044 H ackberr V Willow . 0045 Ohestnut Yellow-poplar _ .0046 Oak red Maple, soft .0046 Cherrv. black Sweetgum_ .0049 Oak. white Bass wood .0055 Oak chestnut Cottonwood . 0059 Elm Buckeye .0075
1 Wood at a moisture content of 6 percent.
SANDING
The oldest and best-known coated abrasive is the familiar "sand- paper," in which the mineral is quartz. In industrial woodworking, at least, quartz has now been very largely replaced by garnet and aluminum oxide. In spite of this change, "sanding" remains the accepted term for the use of coated abrasives in finishing w^ood, and the machines that do the job are termed "sanders."
Sanding is sometimes done to remedy a slight mismatch where different parts of a finished product join, such as the vertical and horizontal members in a solid door or the sides and front of a drawer. This study, however, was concerned with sanding as one step in the finishing of a piece of furniture or other fabricated product. In such sanding, the object is to remove knife marks and minor machining
35

defects and thus prepare the surface for the application of paint, lacquer, or other finish.
Sanding is one of the more important woodworking operations. Furniture, fixtures, cabinets, millwork, and many minor hardwood products are sanded in the course of their manufacture. Several types of sanding machines are available, some of which are highly special- ized for turnings, moldings, contours, and edges. The great bulk of sanding, however, is the so-called "flatwork." The chief machines used for this are the drum sander and the belt sander, both of which were used in this test.
Several different abrasives are used in sanding wood. Some, like garnet, occur in nature; others, like aluminum oxide, are electric furnace products. All are of crystalline structure and smooth the wood by the cutting action of their innumerable sharp corners and edges. Under the microscope, the sander dust produced by machine sanding is seen to consist largely of relatively long narrow shreds (figure 15,^) rather than of sawdustlike granules. The abrasives, termed "grits" in the woodworking trade, come in a wide variety of sizes, and it is general practice with a given wood to use the coarsest grit that will not make scrat<îhes visible to the eye. Some woods of fine texture require grits two sizes finer than that required for oak. The scratching effect of three different sizes of grit on hard maple test samples cut from the same board is shown in figure 15, 5, These sizes are chosen for illustrative purposes only; not all were used in the sanding experiments.
Test Procedure
Samples were first conditioned to 6 percent moisture content, then sanded on one side by a drum sander and on the other by a belt sander, the two principal types. The three drums carried grits of sizes 1/2, 1/0, and 2/0 and turned at 1,700,1,200, and 1,200 revolutions per min- ute respectively. This condition would be suitable either for prelim- inary sanding "in the white" to be followed by belt sanding with a finer grit, or for final sanding for some less exacting use. In belt sand- ing the speed was 4,200 feet per minute. For purposes of comparison, the grit was the same as that used on the last drum ; that is, 2/0. In commercial practice, of course, a finer grit would ordinarily be used in the final sanding. The grit itself was garnet, a natural abrasive, and about as common in woodworking as any. New abrasive paper was put in both machines at the outset of the work, and the amount of material tested was not enough for wear to become a factor.
Following the sanding, the samples were inspected visually for both fuzz and scratches and were graded on a scale of 5, as an indication of the seriousness of any defects that were present.
Comparative Sanding Properties
Scratching Tendencies,—The drums of a drum sander oscillate slightly in addition to rotating, so that any scratches that may result are wavy, making "snake tracks." With a belt sander, however, the scratches are straight lines. Any wood can be sanded without visible scratches provided a grit sufficiently fine is used. In this test the grit size was 2/0, which is about the coarsest that can be used satisfactorily for any wood. Table 19 shows how the woods compare in their ten-
36

GRIT
GT^IT>b
GRIT f^
00
M-29137—P, M—29138-F
FiGUEB 15.—A, Sander dust made by No. 1% grit (enlarged 18 diameters). B, Scratching tendencies of three different sizes of grit on hard maple.

dency to show scratches under these conditions. A wide range in results may be noted, from soft elm with 70 percent of scratch-free pieces to hard maple with none. The first seven woods are all ring- porous woods of rather coarse texture, which tends to obscure fine scratches. The last seven are diffuse-porous woods that are moder- ately hard to hard and fine textured. The intermediate group consists of woods that are either soft or of intermediate texture. The finer the pores, the finer the abrasive that must be used to avoid obvious scratches.
The belt sander gave better results with 12 woods, the drum sander with 6, and the results were the same with 2 woods. In only a few instances was the difference in results by the two types of sander sub- stantial, and table 19 is based on an average for both.
TABLE 1^,—Machine sanding: Relative resistance to scratching of hardwoods ^
Kind of wood Scratch-free pieces
Kind of wood Scratch-free pieces
Elm Percent
70 67 66 66 52 50 34 25 20 15
Birch, sweet Percent
15 Hickory _ Yellow-poplar 15 Oak, red Cottonwood 14 Oak, white _ Beech 13 Ash Tupelo 10 Oak, chestnut Sweetgum S Chestnut Maple, soft fi Willow Magnolia 4 Sycamore Blackgum 4 Basswood Maple, hard 0
1 Wood at 6 percent moisture content. Drum sanding and belt sanding aver- aged; 2/0 grit used.
Fuzzing Tendencies,—By fuzz in sanding is meant short bits of wood fiber that are attached to the board at one end and are free at the other. Several woods were practically free from this trouble, while others had more or less fuzz on most of the pieces. Depending on the amount, fuzz may be a serious drawback that can be overcome only through considerable extra work in getting a good finish. Table 20 lists woods according to fuzzing tendencies. Except elm, the ring- porous woods tested were relatively free from fuzz. The first six woods are ring porous. All other woods listed except elm are diffuse porous. The diffuse-porous woods cause the most trouble with fuzzing and include the softest woods, as well as some that are moderately hard. Eesults from belt sanding and drum sanding were about the same for most of the woods, but belt sanding was appreciably better for túpelo, birch, sweetgum, blackgum, cottonwood, and yellow-poplar, all of which are at the end of the list showing most fuzz.
Factors Affecting Results
As a broad generality, coarse-textured woods show scratches less than fine-textured woods when sanded under the same conditions, and hard species fuzz less than soft ones.
38

Effects of moisture content on sanding were not investigated, but in commercial experience best results are obtained on wood with low moisture content.
TABLE 20.—Machine sanding: Relative freedom from fuzzing in hardwoods ^
Kind of wood Fuzz-free pieces
Kind of wood Fuzz-free pieces
Oak, chestnut Percent
100 99 98 95 94 92 85 76 70 66
Elm_ _ Percent
62 Oak,white _ _ _ _ Tupelo - _-- - -_ 57 Ash Birch, sweet
Blackgum _ __ _ 53
Oak, red 38 Chestnut Sweetgum 37 Hickory Cotton wood 25 Beech- Willow --- 23 Maple, hard Magnolia
Yellow-poplar 23 Sycamore 22
Maple, soft Basswood _ 18
1 Wood at 6 percent moisture content, averaged; 2/0 grit used.
Drum sanding and belt sanding
Garnet, aluminum oxide, and silicon carbide have their peculiarities of crystal form and fracture, so that identical results may not be obtained under similar conditions. Belts of each of these will give somewhat different results as wear progresses. The type of sander and operating conditions, such as speed and pressure, are other factors. Unfavorable combinations of the above factors sometimes result in a glazed surface that is not as good as it may appear. The applica- tion of water to such a surface will produce raised grain, whereas a properly sanded surface is scarcely affected.
RELATED PROPERTIES
STEAM BENDING
Steam bending, is employed to some extent in several hardwood- using industries. Bentwood chairs and tennis rackets are common examples of rather extreme bends in the furniture and sporting goods fields. Products with slight curves, like the back post of a dining room chair, may be either sawed or bent. In such products bent parts have the advantages of being more economical of material and of being stronger because of less cross grain.
Many variables are involved in steam bending, such as the size of the material, its moisture content, the amount of steaming, radius of the bend, and, of course, all the numerous details connected with the type of equipment used. The test described here was devised as a means of comparing the inherent bending qualities of hardwoods under one uniform set of conditions and the behavior of the run of the species without special selection.
39

Bending Method
The experimental bending material consisted of squares % by % by 30 inches long, conditioned to 12 percent moisture content. The squares were clear and sound, but were not selected for rings per inch, density, straightness, or angle of grain.
After a preliminary steaming for 45 minutes at atmospheric pres- sure, the squares were bent by hand to a 21-inch radius on the form shown in figure 16 and given time to set. Preliminary experiments showed that even the best bending woods produced a few breaks at this radius and that nearly all pieces in the poorer bending woods broke under the same conditions. Because no end pressure was em- ployed and no metal bending straps were used on the outer surface of the piece, the test was severe in spite of the fact that the radius was not especially short.
Results
The 25 woods tested varied widely in bending qualities from hack- berry with 94 percent of unbroken pieces to basswood with 2 percent (table 21). Oak, ash, hickory, elm, and beech are reported to be good bending woods. None but ash has yielded less than 74 percent of unbroken pieces. Excellent results w^ere obtained with hackberry and magnolia, which are relatively little used for bending.
TABLE 21.—Steam hending: Relative bending qualities of hardwoods ^
Kind of wood Pieces unbroken
Kind of wood Pieces unbroken
Hackberry Percent
94 91 86 85 85 78 78 76 75 74 73 72 67
Sweetgum Percent
67 Oak, white Maple, soft 59 Oak, red_ _ _ Yellow-poplar 58 Oak, chestnut Maple, hard 57 Magnolia Chestnut-_ 56 Pecan Tupelo
Cottonwood 46
Walnut, black 44 Hickory. Blackgum_ 42 Beech _ _ _ Mahogany 41 Elm Sycamore 29 Willow _ _ -_ Buckeye 9 Birch__ Basswood» 2 Ash
1 Wood at 12 percent moisture content.
Eing-porous woods as a class gave better results than did diffuse- porous. The best 4 woods are all ring-porous, and 8 of the 10 ring- porous woods were among the best 12 woods.
Factors Affecting Results
Four general causes of failure were observed in this test: Brash- ness, localized compression, splintering tension, and cross-grain ten- sion. The relative importance of these types varies greatly in different woods (table 22).
40

BAGUEE 16.—Form used In steam bending test.
Brashness.—Some brash material was found in nearly all tlie woods, but only in mahogany and sycamore did it amount to more than 5 percent of the pieces tested. Very short breaks characterized brash- ness failures.
Localized Compression.—Compression failures were most common in basswood, buckeye, and chestnut, while the heavy woods had few, if any, of them. This type of failure showed localized wrinkling or buckling on the concave side of the bend.
Splintering Tension.—Splintering-tension failures were not only the most common type of failure but occurred in all the woods. They weie evidenced by splintering on the convex side of the bend. Such
41

failures could be greatly reduced by the use of the customary metal straps that give support to the outside of the bend.
TABLE 22.—Steam bending: Comparison of causes of failure^ in per- cent of pieces broken ^
Kind of wood
Ash Basswood Beech . Birch Buckeye Chestnut Cotton wood Elm Sweetgum Blackgum and túpelo Hackberry Magnolia Mahogany Maple, hard Maple, soft Oak, chestnut Oak, red Oak, white Pecan Yellow-poplar Sycamore Walnut, black Willow
Brash tension
Percent 2 4' 0 4 0 4 5 4 0 1 4 2
10 1 3 2 5 4 0 2
10 1 2
Localized compres-
Percent 0
53 0 0
45 34 12
1 1 1 0 5 8 0 2 0 0 0 0
15 2 0 9
Splinter- ing ten-
sion
Percent 23 32 18 18 23
3 33 20 17 19
2 7
27 25 27
7 7 4
15 20 21
6 8
Cross- grain
tension
Percent 8 9 7 6
23 3 6 1
16 35
0 1
14 17 9 6 2 1 7 5
38 15
6
1 Wood at 12 percent moisture content.
Cross-Grain Tension,—No attempt was made to exclude cross grain from the samples, although its effect on breakage was recognized. The object of the test was to obtain a comparison of bending qualities in different woods, using samples that were selected only on the basis of being clear and sound.
Current specifications for bending oak allow cross grain with a slope of not more than 1 inch in 15 inches. Such a limitation would exclude some of the lumber tested in most of the woods, and in woods with interlocked grain, a substantial proportion of the pieces would be excluded. Naturally, the frequent occurrence of cross grain in a pronounced degree is a decided drawback to the use of any wood for steam bending. Irrespective of other considerations, this means that more material must be rejected at the outset in order to keep breakage within economic limits. Cross-grain breaks were few or lacking in elm, hackberry, magnolia, red oak, and white oak. This was prob- ably due more to some peculiarity of structure than to lack of cross grain. At the other extreme, more than one-third of the pieces in blackgum and sycamore broke, and many of these breaks were ob- viously due to interlocked grain. Cross-grain breaks, unlike those resulting from compression and tension, were frequently complete or nearly so.
42

Other Factors.—The average straightness of grain of the different woods gave no reliable indication of their bending qualities, except that woods having a considerable amount of extreme interlocked grain, like túpelo and sycamore, were subject to considerable breakage under the conditions of the test.
Specific gravity influenced bending, in that the heavy woods bent better than the light woods. In table 21, for instance, all the heavy Avoods (those with a specific gravity of 0.50 or over) except hard maple are in the upper half, whereas all the light woods (those with a specific gravity of less than 0.40) except willow are in the lower or the poor half. No consistent differences were noted in breakage be- tween light and heavy pieces of the same wood.
Number of rings per inch was found to have no effect on bending properties in different pieces of the same wood. Neither was any relation evident between bending properties and average rate of growth in different species ; woods of slow, medium, and fast growth are found all along the quality scale.
NAIL SPLITTING
Nail-splitting tendencies of hardwoods are of interest because large volumes of both high-grade and low-grade hardwoods are customarily nailed in manufacture. The weakening effect of splits is often greatly overestimated. It is best to avoid or at least minimize splits,, how- ever, because they are unsightly, tend to increase in size with moisture changes, and create an unfavorable impression. This can be done by boring holes in high-quality products or by using blunt-pointed or smaller nails. Heavy, strong woods split more readily during nailing than do relatively light, weak woods, but they have much greater withdrawal resistance. By using a smaller nail for the heavy woods, however, it is possible to reduce the wood's tendency to split and still retain its withdrawal resistance. The different woods vary widely in their splitting tendencies when nailed under identical con- ditions, as in this test. Good nailing practice takes this into account, and greater holding power is a compensating factor in the woods that split most readily when nailed.
In any given test sample, nail splitting is affected by many different factors, including the kind of wood used, its moisture content, its specific gravity, its thickness, the size of the nails, the form of the nail point, the distance that they are positioned from an end or edge of the piece, the method of driving, and so on. Because it was im- practical to make tests with, different combinations of these factors, one set of reasonable conditions was applied uniformly to all 24 hard- woods. It is believed that the conditions dhosen give a good measure of the splitting tendencies of the woods tested.
Method
The nails used were sevenpenny, smooth box nails, 20 to each test sample or from 1,000 to 2,000 for each wood. They were driven by hand through the test pieces, which were of commercial flat-stock grain three-eighths inch thick and at 15 percent moisture content, into a back of soft pine. A guide (fig. 17, B) was used to locate the nails at a uniform distance from each other and from the end of the board. The number and character of any splits that developed were noted.
43

FIGURE 17.—A, Different degrees of splits: (1) barely preceptible, (2) inter- inedlate, (3) complete; B, guide used in driving nails.
Splits vary greatly in size and in the damage they do to either the nail-withdrawal resistance or appearance of a piece. The results presented here are based on complete splits only ; that is, splits that extend completely through the board from the end back beyond the nail, such as the one shown in the upper left corner in figure 17, A.
Nails were first driven y^, inch from the end ; then, after the split ends were sawed off, at a distance % inch from the end. These dis- tances are about right for box shook % inch thick, considering the probable thickness of box ends or cleats to which the sides, tops, and bottoms would be nailed. As would be expected, splits are more
44

numerous—about one-third more—at % inch from the end than ut 1/^ inch. Aside from this, results obtained at these two distances did not differ significantly, and it seemed best to average the results. This was done. In hand work, different men often get somewhat different results. To allow for this human factor, the above work was dupli- cated by a second operator working independently. The figures given here are averages for the two w^orkmen.
Results
In the nail-splitting tests under identical nailing conditions (table 23), the woods ranged from willow, which had the fewest splits, to hard maple, which had the most. In connection with table 23, the two important considerations already discussed must be borne in mind: (1) that the woods most susceptible to splitting generally have much greater withdrawal resistance than those least susceptible; and (2) that, in commercial practice, splitting may be greatly reduced in the woods toward the bottom of the list by the use of smaller nails.
TABLE 23.—Nail splitting: Relative freedom of hardwoods ^
Kind of wood Samples
free from complete
splits
Kind of wood Samples
free from complete
splits
Willow Percent
89 82 80 79 79 77 73 69 69 68 66 66
Ash Percent
65 Cotton wood- _ - Blackgum 65 Elm Tupelo 64 Sycamore _ _ _ Hackberry 63 Bass wood- _ - Maple, soft
Walnut, black 58
Yellow-poplar _- _ _ _ 50 Magnolia _ - Oak, chestnut 49 Sweetgum _ _ Pecan 47 Oak, white-- ^ Beech 42 Mahogany - _ _ _ Hickory 35 Chestnut _ _ _ Birch - 32 Oak, red MaDle. hard 27
^ Wood at 15 percent moisture content.
The Specific Gravity Factor
Specific gravity is an important factor in the splitting of wood with nails. As might be expected (fig. 18), the heavy species split more than the light ones, and yet the splitting in different woods is not di- rectly proportional to their specific gravity. Sycamore, soft elm, red oak, and white oak sustain appreciably fewer splits than might be expected on the basis of specific gravity alone. On the other hand, chestnut, hard maple, and birch split more than might be expected. Just as heavy woods split more than light ones, so heavy pieces of white oak split more than light pieces of the same wood.
SCREW SPLITTING
In large woodworking plants, screws are usually driven by power tools into bored holes, and the screw heads are countersunk. Best re-
45

80
70
g 50
40
iy 30 S
Uj 20
10
•HARD MAPLE
• BEECH
BLACK WALNUT
• SOFT MAPLE
HACKBERRY I • J-UPELO
• BLACK6UM ^ASH •CHESTNUT
i) BASSWOOD
% MAHOGANY -^SWEETGUM-
• COTTON WOOD
• MAGNOLIA
^YELLOW-POPLAR • SYCAMORE •ELM
• PECAN _• CHESTNUT OAK _
ÍRED OAK
• WHITE OAK
0.30 0.35 0.40 0.45 0.50 SPECIFIC GRAVITY
0.55 0.60 0.65
M-38694-F
FIGURE 18.—Relation of specific gravity to percentage of complete splits for 24 hardwoods.
suits are obtained with a hole that fits the shank of the screw snugly. This shank is the unthreaded part of the screw just below the head. A smaller hole should be used for the threaded part of the screw. For most woods, this should be slightly less than the core diameter, which is the diameter at the base of the screw threads. Among the variables that may cause splitting of wood by screws are thickness, density, and moisture content of the wood, ratio of lead-hole diameter to screw diameter, the distance the screw is from the end or edge of the piece, and the method used to drive the screws.
Method
There is no standard method for testing wood-splitting by screws. About all that can be done in any short-time study aimed at evaluating splitting tendencies of different woods is to adopt reasonable working conditions and apply them uniformly to all woods.
The wood used in these experiments was % inch thick and at 15 percent moisture content. Since the object was to evaluate screw- splitting tendencies and not to minimize splitting, a y^e-inch lead hole was used with all woods and all screws. The lead holes were bored by machine to insure straightness, after which the screws were driven through and into a soft pine backing, using a screwdriver bit in a hand
46

»ff îî llp w ^
FiGüBE 19.—Different degrees of splitting caused by screws of different sizes. Prom left, screw sizes used were Nos. 10, 9, 8, 7, and 6.
brace. The depth of penetration was uniform, with the top of the thread flush with the top of the board.
Five %-inch screws, one each of Nos. 6, 7, 8, 9, and 10, were posi- tioned 0.5 inch from one end of each board and driven. After sawing off any splits that developed, three more screws (Nos. 8, 9, and 10) were driven at a distance of 0.75 inch from the end. Screws Ños. 6 and 7 were not used because they were so small in diameter that they pro- duced very few splits in any wood, and none in many of them.
As with nails, the screw splits varied greatly in size, and precise evaluation of the damage caused by screws of different sizes was im- practical. The comparisons made here are therefore based on com-
Êlete splits or splits extending through the end of the board and back eyond the screw (fig. 19). Because of operating differences, the fig-
ures given here average the results obtained by two different operators working independently.
Results
In the screw-splitting test of 24 hardwoods, birch, the poorest wood in this respect, has nearly 2i^ times as many complete splits as does red oak. The amount of splitting here shown would, of course, be prohibitive in any commercial operation. The lead holes were delib- erately made too small in order to produce comparative splits. Some of the woods that made the poorest showing in this test are among the strongest and would give the best service if the screws were prop- erly inserted. These tests emphasize the need for proper use of screws, especially for a proper ratio of lead-hole diameter to screw diameter.
47

Factors Affecting Results
Under the conditions of this test, no relationship was revealed between the average specific gravity of the different w^oods and their screw-splitting tendencies. Table 24 shows considerable mixing of heavy and light woods in all parts of the list. Other tests at the Forest Products Laboratory show that dense woods require larger lead holes for maximum efficiency than do light woods, and that large screws require larger lead holes in proportion to their diameter than do small screws.
TABLE 24.—Screw splitting : Relative freedom of hard/woods ^
Kind of wood Samples free
from complete splits
Kind of wood Samples free
from complete splits
Oak; red Percent
78 78 78 76 74 74 74 71 70 69 69 68
Yellow-poplar _ _ Percent
67 Cottonwood- _ _- - Hickory ^-_
Blackgum_ _ 63
Mahogany _ 63 Magnolia Tupelo—- - - 63 Elm _- - Hackberry__ _ 63 Oak, white Willow
Maple, soft 62
Sycamore 61 Ash Chestnut
Walnut, black 60
Oak, chestnut 59 Sweetgum. _ Beech__ 58 Pecan Maple, hard _ _ _ 52 Basswood Birch _ _ _ _ 48
Wood at 15 percent moisture content.
The percentage of splits increases rapidly with screw size. For example, the No. 7, 8, 9, and 10 screws produced, respectively, 1.9, 3.4, 4.5, and 7.3 times as many complete splits as did the No. 6 screws when lead holes of the same size were used. This illustrates the neces- sity for using larger lead holes with larger screws if splits are to be minimized. These figures are an average for all species, and some woods, of course, vary considerably from the averages.
Judging from the sparse data afforded by the two series of screws driven at the %-inch and 14-inch distances from the end of the test pieces, the chances of producing splits are greatly increased as the screws are placed nearer to the end of the board. The No. 8, 9, and 10 sizes produced on the average twice as many splits at the i^-inch as at the %-inch end distance.
Under the typical variations found in the different woods, cross grain had little, if any, influence on screw splitting. Extreme cross grain in individual pieces would perhaps be a factor.
As there is a distinct difference in the action of screws and nails, a given wood will not necessarily behave alike in both screw splitting and nail splitting. In these tests, however, half the woods fall in about the same part of the list for both nail splitting and screw split- ting. The remaining woods may be good in one characteristic and fair in the other, or fair in one and poor in the other. No wood was found to be good in one and poor in the other.
48
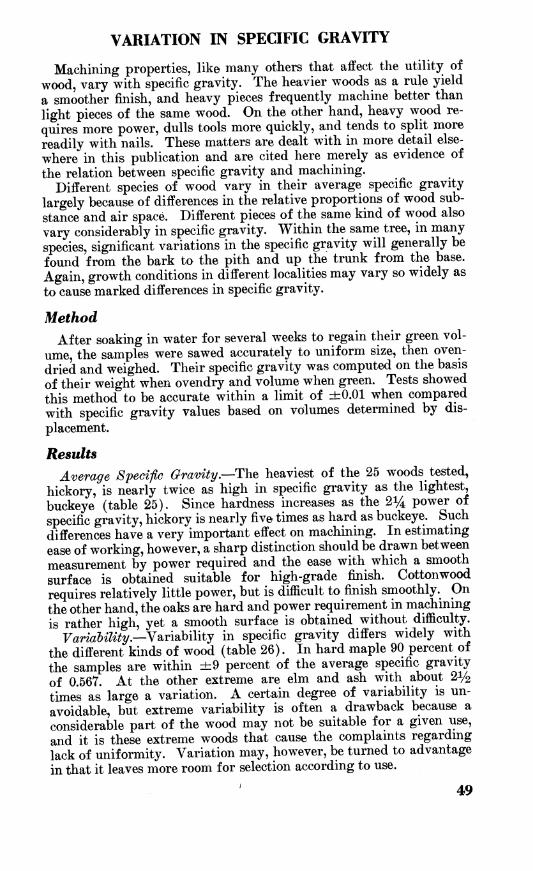
VARIATION IN SPECIFIC GRAVITY
Machining properties, like many others that affect the utility of wood, vary with specific gravity. The heavier woods as a rule yield a smoother finish, and heavy pieces frequently machine better than light pieces of the same wood. On the other hand, heavy wood re- quires more power, dulls tools more quickly, and tends to split more readily with nails. These matters are dealt with in more detail else- where in this publication and are cited here merely as evidence of the relation between specific gravity and machining.
Different species of wood vary in their average specific gravity largely because of differences in the relative proportions of wood sub- stance and air space. Different pieces of the same kind of wood also vary considerably in specific gravity. Within the same tree, in many species, significant variations in the specific gravity will generally be found from the bark to the pith and up the trunk from the base. Again, growth conditions in different localities may vary so widely as to cause marked differences in specific gravity.
Method After soaking in water for several weeks to regain their green vol-
ume, the samples were sawed accurately to uniform size, then oven- dried and weighed. Their specific gravity was computed on the basis of their weight when ovendry and volume when green. Tests showed this method to be accurate within a limit of ±0.01 when compared with specific gravity values based on volumes determined by dis- placement.
Results Average Speciftc Gravity—Th.^ heaviest of the 25 woods tested,
hickory, is nearly twice as high in specific gravity as the lightest, buckeye (table 25). Since hardness increases as the 214 power of specific gravity, hickory is nearly five times as hard as buckeye. Such differences have a very important effect on machining. In estimating ease of working, however, a sharp distinction should be drawn between measurement by power required and the ease with which a smooth surface is obtained suitable for high-grade finish. Cottonwood requires relatively little power, but is difficult to finish smoothly. On the other hand, the oaks are hard and power requirement in machining is rather high, yet a smooth surface is obtained without difficulty.
Fa/•m&^7^ïy.—Variability in specific gravity differs widely with the different kinds of wood (table 26). In hard maple 90 percent of the samples are within ±9 percent of the average specific gravity of 0.567. At the other extreme are elm and ash with about 21/2 times as large a variation. A certain degree of variability is un- avoidable, but extreme variability is often a drawback because a considerable part of the wood may not be suitable for a given use, and it is these extreme woods that cause the complaints regarding lack of uniformity. Variation may, however, be turned to advantage in that it leaves more room for selection according to use.
49

TABLE 25.—Average specifk gravity of hardwoods 1
Kind of wood States or region of origin Average specific gravity
Buckeye Appalachian 0.340 .345 .349 .382 .388 .415
Willow Mississippi Delta Basswood Chiefly Appalachian Cottonwood Southern _ Chestnut Appalachian Yellow-poplar Southern and Aooalachian Hackberry Southern __ Magnolia do .442
. 445
. 446
.451
Tupelo do Maple, soft Southern and Appalachian Blackgum Southern Mahogany Central America. Sweetgum Southern .463
.475
.482
.500
.512
.546
Sycamore do Elm do Ash Southern and Annalaphian Walnut, black Central,_ __ Beech ___ Southern and Anoalachian Oak, red do ______ Oak, chestnut Appalachian .560 Oak, white Southern and Aooalachian Maple, hard__ Appalachian and Lake .
Southern .567 .576 .577
Pecan Birch Appalachian and Lake Hickory Southern _ _
1 Based on weight when ovendry and volume when green.
ITiese various specific gravity relationships are shown graphically m figure 20. The woods are arranged in order from lightest to heaviest based on averages. Differences in variability, like that between willow and túpelo, stand out plainly. Overlapping in range of specific gravity of light and heavy woods is also evident; the heaviest pieces of cottonwood, for instance, are heavier than the light- est pieces of hickory.
The greater variability in ash and túpelo is due in part to the fact that certain of these trees grow in.low ground covered from time to time by floodwaters, and develop therefrom an extreme taper at the base which lumbermen call "swell butt." The wood from the base of these swell-butted trees is abnormally light and tends to give the wood a wide range from minimum to maximum specific gravity. In elm, variability probably results largely from the fact that the com- mercial elm contains several botanical species, some of which run consistently heavier than others.
Data from collections at 20 mills in the South Atlantic and Gulf States show that the same kind of wood may vary enough in weight to make an appreciable difference in its ease of machining. White oak at the mill, for instance, varied from an average specific gravity of 0.54 for the lightest timber to 0.64 for the heaviest. The light oak, however, was not all concentrated in one part of the area of growth and the heavy oak in another; light and heavy oak were intermingled throughout the area. Similar conditions prevailed with other woods.
50

TABLE 26.—T Variability in speciftc gravity of hardwoods ^ arranged order of increasing variation from the average
Kind of wood Range in specific gravity ^
Minimum Average Maximum
Variation from
average ^
Maple, hard__. Birch Beech Hackberry Walnut, black Sweetgum Sycamore Willow Cottonwood__ Mahogany Oak, red Oak, chestnut Hickory Magnolia Oak, white Pecan Chestnut Basswood Yellow-poplar Tupelo Maple, soft-- Blackgum Elm Ash
49 50 45 36 44 37 39
,28 .31 ,38 ,42 .48 .45 .34 .43 .45 .27 .28 .31 .27 .35 .33 .34 .33
0.567 .577 .546 .426 .512 .463 .475 .345 .382 .460 .553 .560 .607 . 442 .562 .576 .388 .349 . 415 .445 .446 .451 .482 .500
0.66 . 68 . 64 .50 .58 .56 .58 ,42 .48 . 56 .66 . 66 .72 .54 .70 .70 .50 .44 .54 .56 .58 .58 .64 . 63
Percent 9
10 11 12 12 13 13 14 14 15 15 15 15 16 17 17 19 19 19 19 19 20 23 23
1 Based on weight of the ovendry wood and volume when green. 2 Range within which 98 percent of the samples fell; 1 percent at each extreme
excluded. 3 Range within which 90 percent of the samples fell; 5 percent at each extreme
excluded.
It is evident that growth conditions resulting in light or heavy timber may be quite different at points only a few miles apart, or they may be similar at points that are distant from each other. State lines or river drainages cannot be used as indicators of light and heavy timber. The buyer who wishes one type of timber or the other must know his mills.
An exception may be noted, however, with respect to elevation of source. When the collection area is extended to include nine addi- tional mills in the mountain sections of Tennessee, Virginia, and West Virginia, it appears that Appalachian oak averages somewhat lighter than southern oak, and Appalachian ash averages slightly heavier than southern ash.
Among samples collected from the Appalachians, white oak aver- aged 0.53 in specific gravity, as did red oak and ash ; among samples of these same woods collected from the deep South, white oak averaged 0.58, red oak, 0.56, and a^h, 0.50.
Even this difference is not entirely consistent, however. Some of the southern mills produce on the average lighter white oak than some Appalachian mills, and there is, of course, a much wider range
51

withm each region than between the two regional averages. Actually such an exception only reemphasizes the need for the buyer to know his mills rather than to depend on geographical divisions.
BASSWOOD
COTTONWOOD
CHESTNUT
YELLOW-POPLAR
HACKBERRY
MAGNOLIA
TUPELO
MAPLE, SOFT
BLACKGUM
MAHOGANY
S WE ETC UM
SYCAMORE
ELM
ASH
WALNUT, BLACK
BEECH
OAK, RED
OAK, CHESTNUT
OAK, WHITE
MAPLE, HARD
PECAN
BIRCH
HICKORY
0,20 0,30 0.40 0,50 0,60
SPECIFIC GRAVITY
0.70 0,80
M:-38693-F
FIGURE 20.---Range of specific gravity of hardwoods. The shortest line indicates the specific gravity range within which 50 percent of the observed samples tall ; the intermediate-size line the range within which the middle 90 percent fall; and the longest line the range within which the middle 98 percent faU The yertical line marks the average.
52
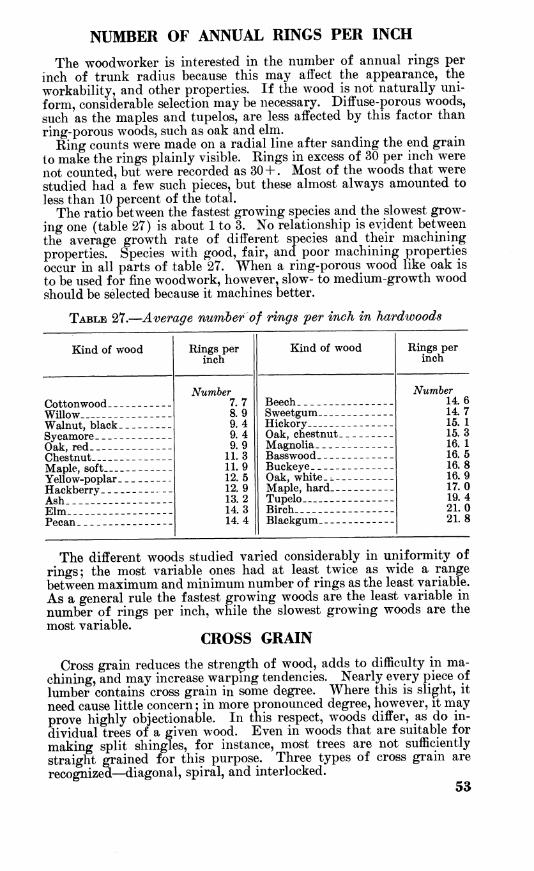
NUMBER OF ANNUAL RINGS PER INCH
The woodworker is interested in the number of annual rings per inch of trunk radius because this may affect the appearance, the workability, and other properties. If the wood is not naturally uni- form, considerable selection may be necessary. Diffuse-porous woods, such as the maples and túpelos, are less affected by this factor than ring-porous woods, such as oak and elm.
Ring counts were made on a radial line after sanding the end grain to make the rings plainly visible. Rings in excess of 30 per inch were not counted, but were recorded as 30 + . Most of the woods that were studied had a few such pieces, but these almost always amounted to less than 10 percent of the total.
The ratio between the fastest growing species and the slowest grow- ing one (table 27) is about 1 to 3. No relationship is evident between the average growth rate of different species and their machining properties. Species with good, fair, and poor machining properties occur in all parts of table 27. When a ring-porous wood like oak is to be used for fine woodwork, however, slow- to medium-growth wood should be selected because it machines better.
TABLE 27.—Average number of rings per inch in hardwoods
Kind of wood Rings per inch
Kind of wood Rings per inch
r^ott.onwood Number
7.7 8.9 9.4 9.4 9.9
11.3 11.9 12.5 12.9 13.2 14.3 14. 4
Beech-_ _ Number
14.6 Willow Sweetgum 14.7 Walnut black Hickory 15. 1 Ä VOÍÍ m nrp Oak, chestnut 15.3 Oftk rpd Magnolia 16. 1 f^hpstniit Basswood- 16.5 IVÍnnlp soft Buckeye 16.8 Ypllow-noDlar Oak, white-■..- 16.9 Hackberry Ash
Maule, hard _ _ _ 17.0 Tupelo 19.4
Elm Birch- --- - 21.0 PGCB/II Blackgum. 21.8
The different woods studied varied considerably in uniformity of rings; the most variable ones had at least twice as wide a range between maximum and minimum number of rings as the least variable. As a general rule the fastest growing woods are the least variable in number of rings per inch, while the slowest growing woods are the most variable.
CROSS GRAIN
Cross grain reduces the strength of wood, adds to difficulty in ma- chining, and may increase warping tendencies. Nearly every piece of lumber contains cross grain in some degree. Where this is slight, it need cause little concern; in more pronounced degree, however, it may prove highly objectionable. In this respect, woods differ, as do in- dividual trees of a given wood. Even in woods that are suitable for making split shingles, for instance, most trees are not sufficiently straight grained for this purpose. Three types of cross grain are recognized—-diagonal, spiral, and interlocked.
53
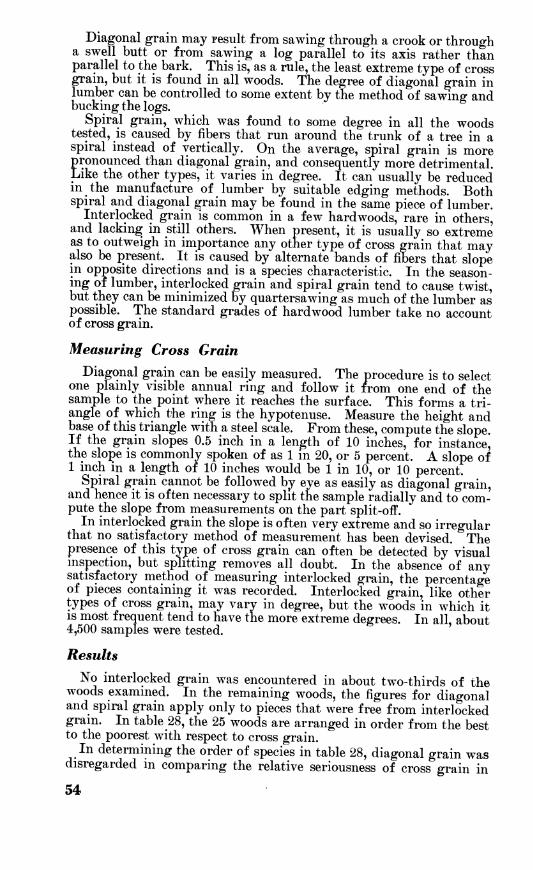
Diagonal grain may result from sawing through a crook or through a swell butt or from sawing a log parallel to its axis rather than parallel to the bark. This is, as a rule, the least extreme type of cross grain, but it is found in all woods. The degree of diagonal grain in lumber can be controlled to some extent by the method of sawing and bucking the logs.
Spiral grain, which was found to some degree in all the woods tested, is caused by fibers that run around the trunk of a tree in a spiral instead of vertically. On the average, spiral grain is more pronounced than diagonal grain, and consequently more detrimental. Like the other types, it varies in degree. It can usually be reduced in the manufacture of lumber by suitable edging methods. Both spiral and diagonal grain may be found in the same piece of lumber.
Interlocked grain is common in a few hardwoods, rare in others, and lacking in still others. When present, it is usually so extreme as to outweigh in importance any other type of cross grain that may also be i)resent. It is caused by alternate bands of fibers that slope in opposite directions and is a species characteristic. In the season- ing of lumber, interlocked grain and spiral grain tend to cause twist, but they can be minimized by quartersawing as much of the lumber as possible. The standard grades of hardwood lumber take no account of cross grain.
Measuring Cross Grain
Diagonal grain can be easily measured. The procedure is to select one plamly visible annual ring and follow it from one end of the sample to the point where it reaches the surface. This forms a tri- angle of which the ring is the hypotenuse. Measure the height and base of this triangle with a steel scale. From these, compute the slope. If the grain slopes 0.5 inch in a length of 10 inches, for instance, the slope is commonly spoken of as 1 in 20, or 5 percent. A slope of 1 inch in a length of 10 inches would be 1 in 10, or 10 percent.
Spiral grain cannot be followed by eye as easily as diagonal grain, and hence it is often necessary to split the sample radially and to com- pute the slope from measurements on the part split-off.
In interlocked grain the slope is often very extreme and so irregular that no satisfactory method of measurement has been devised. The presence of this type of cross grain can often be detected by visual inspection, but splitting removes all doubt. In the absence of any satisfactory method of measuring interlocked grain, the percentage of pieces containing it was recorded. Interlocked grain, like other types of cross grain, may vary in degree, but the woods in which it IS most frequent tend to have the more extreme degrees. In all, about 4,500 samples were tested.
Results
No interlocked grain was encountered in about two-thirds of the woods examined. In the remaining woods, the figures for diagonal and spiral grain apply only to pieces that were free from interlocked grain. In table 28, the 25 woods are arranged in order from the best to the poorest with respect to cross grain.
In determining the order of species in table 28, diagonal grain was disregarded m comparing the relative seriousness of cross grain in
54

the different woods, because spiral grain had a greater slope—fre- quently two or three times greater—in every species. These are species averages, so some individual pieces would be exceptions. Ex- cept for cottonwood and elm, the woods having interlocked grain are among those having the more pronounced degrees of spiral grain.
TABLE 28.—Cross grain in hardwoods^ arranged in order from the best to the poorest
Kind of wood Average slope of grain
Diagonal Spiral
Percent Percent 2.3 3. 1 3.2 4.3 2.3 4.3 2. 4 4.4 2.7 5. 1 1.9 5.2 2.3 5.3 3.0 5.5 2.7 5.5 3.5 5.6 4. 1 5.7 2.6 6.2 2.5 6.5 2.2 6.9 2.5 7.2 2.8 7.7 2.6 7.9 2.8 6.2 4.4 6.7 2. 1 4.9 1.9 4.3 2.8 7.7 2.3 8.2 2.5 7.5 2.4 8.9
Pieces showing
interlocked grain
Hickory Pecan Bass wood Oak, red Magnolia Yellow-poplar. Oak, white Hackberry Birch Ash Walnut, black Chestnut Maple, soft___ Beech Oak, chestnut. Willow Maple, hard__ Mahogany Buckeye Elm Cottonwood __ Sycamore Sweetgum Blackgum Tupelo
Percent 0 0 0 0 0 0 0 0 0 0 0 0 0 0 0 0 0
10 10 19 24 45 48 53 68
Interlocked grain, when present, probably has a much greater effect on utility than the other types. In steam bending, for example, the four woods with the highest percentage of cross-grain breakage were the four with the most interlocked grain. In planing a board hav- ing interlocked grain, the knives necessarily revolve against the grain in some part of the board, and this often causes chipping. Twist is the most pronounced form of warp, and the four woods in which interlocked grain is most common are the woods that twist most in drying. For these reasons, other types of cross grain may be dis- regarded in woods where interlocked grain is frequent.
The small size of the test samples (% by % by 10 inches) may per- haps have resulted in underestimates of the occurrence of interlocked grain. For example, interlocked grain may occur in some part of a board and yet be absent in a small sample. The figures given for this type of cross grain should therefore be considered minimum.
55

SHRINKAGE
Since wood swells when it picks up moisture and shrinks when it loses moisture, there is a slight "come and go" or change of dimension with change in moisture content during use that may cause unsatisfac- tory results in machining. This may be minimized either by drying the wood in advance to the approximate moisture content that it will have in use, or by selecting woods of low shrinkage as far as is prac- tical. The amount of "come and go" is also influenced by the angle between the annual rings and the surface. Shrinkage averages about twice as much parallel to the rings as at right angles to them. Thus, quartersawed hardwood lumber shrinks about half as much in width as the more common flat-grained material.
The test samples were small cross sections cut from the ends of 4/4 commercial lumber. The rings were therefore at all angles with the surface. Since many boards were 8 to 10 inches wide, there was often considerable variation in ring angle in different parts of the same test sample. Such samples are believed to represent more accurately the shrinkage that may be expected in typical lumber shipments than will the usual type of shrinkage samples, which are relatively narrow and either flat grained or edge grained.
Test samples were measured with a gage to the nearest 0.01 inch when green, at 12 percent moisture content, and at 6 percent. Shrink- age is usually computed from the green to the ovendry condition, but 6 percent is about as low as wood goes in actual use. Although this is only from 75 to 80 percent of the shrinkage to the ovendry condition, it approximates the maximum that would occur from the tree to any ordinary conditions of use.
The samples were of flat-grained material only, which constituted from 70 to 90 percent of the total volume in different woods. They ex- hibited (table 29) a wide range from lowest to highest shrinkage. Shrinkage from green to 12 percent moisture content averages more than twice that from 12 to 6 percent. Assuming that hardwood lum- ber is fabricated into a finished product at 12 percent moisture con- tent and that the finished product comes to equilibrium at 6 percent, then the manufacturer and user are concerned chiefly with the rela- tively small amounts of shrinkage shown in column 4 of table 29. This represents a ratio of more than 2 to 1 between the highest and lowest shrinkage, but the highest figure is less than 3 percent.
WARP
Warp in lumber has been defined in American lumber standards as "any variation from a true or plane surface." It is one of the char- acteristics of wood of first importance to the user, because it increases labor and waste in manufacture and often causes trouble subsequently.
Warp includes bow, crook, cup, and twist (fig. 21). The last two are the most serious and the ones to which this discussion is limited. Cup is defined as "a curve across the width of a piece" and twist as "the turning or winding of the edge of a piece so that the four corners of any face are no longer in the same plane." Although some woods naturally warp more than others, proper drying methods will mini- mize this trouble. The use of badly warped lumber usually involves making it into cuttings that are short or narrow or both.
56

TABLE 29.—Tangential shrinkage of hardwoods^ arranged in order of shrinkage
Kind of wood
(1)
Green to 6 percent moisture content
(2)
Green to 12 percent moisture content
(3)
12 percent to 6 percent
moisture content
(4)
Mahogany Buckeye Ash Magnolia Maple, soft___ Tupelo Yellow-poplar. Willow Hackberry Chestnut Blackgum Pecan Walnut, black Cottonwood-- Sycamore Basswood Birch Elm Maple, hard__ Hickory Sweetgum Oak, white Beech Oak, red Oak, chestnut.
Percent 3.4 5.4 5.7 5.9 6. 1 6. 1 6.2 6.2 6.5 6.6 6.6 6.6 6.7 6.7 6.9 7.2 7.5 7.5 7.8 7.9 8.4 8.8 8.9 9.0 9.5
Percent 2. 1
Percent
3.6 3.9 4.0 4.2 4.3 4.4 4.4 4.7 4.3 4.4 5.0 4.7 4.6 5.8 5.3 5. 1 5. 5 5.2 6.0 6.4 6. 1 6.5 7.4
1.3 1.7 2. 1 2.0 2. 1 1.9 1.9 1.8 2. 1 1.9 2.3 2. 2 1.7 2.0 2.3 1.4 2.2 2. 4 2.3 2.7 2. 4 2.4 2.8 2.5 2. 1
•^ Flat-grained material only, amounting to 70-90 percent of all woods.
One cause of warp is the unequal shrinkage of wood in different directions with reference to the grain. Cup is the most common result. Cross grain is another factor^ and the hardwoods that twist most in dryiug are those in which interlocked grain is most common. Unless restrained, wood begins to warp when shrinkage begins ; that is, after the green wood has dried down to 30 percent moisture content. From this point on, shrinkage and warp continue until the equilibrium moisture content is reached. The lower the final moisture content, the more shrinkage and warp will take place.
Four-foot lengths of air-dried lumber from 6 to 10 inches wide were piled on end and dried to room equilibrium at 7 to 8 percent moisture content. This method permitted the test samples to warp without restraint, resulting, it is believed, in an accurate measure of the natural warping tendencies of the different woods. When dry, the boards were placed on a plane surface and measured for warp at each end with a long wedge so tapered and so calibrated that each small division on the hypotenuse represents a vertical distance of 0.01 inch from the adjacent divisions (fig. 22). The amount of warp was then read di- rectly in hundredths of an inch, and the larger of the two measure- ments was recorded, because the maximum cup in any piece determines
57

TWIST
M-31734-P
FIGURE 21.—Types of warp.
58

M-23997-P
FiGTJBE 22.—Method of using calibrated wedge to measure (Aip warp.
the amount of waste in jointing and planning. "Warp of 0.02 inch or less was ignored as not significant. Both cup and twist were measured in this manner.
Based on 7-inch widths, twice as much cup and six times as much twist were found in the worst species as in the best (table 30). In comparing warping tendencies, the twist figures are much more sig- nificant because they are nearly two or three times as high as the cup figures in most instances. To some extent, however, twist and cup go together, for the woods having the most twist also tend to have the most cup. Data were obtained on bow, but these proved to be insig- nificant as compared with cup and twist. Bow, therefore, is ignored here.
TABLE 30.—Unrestrained twist and cup in air-dried hardwoods,^ arranged in order of twist from best to worst
Kind of wood Twist Cup Kind of wood Twist Cup
Ash Inch 0. 107
Inch 0.052 .081 .077 .069 .086
."Ö75
.054
.074
.088
Cotton wood Maple, soft Masnolia
Inch 0. 224 .246 .248 . 281 .303 .465 .534 .647 .723
Inch 0 083
Oak, white Oak, red- ._
113 119 123 131 150 168 187 193 218
.075 068
Willow Elm 079 Hackberry Beech- . 074 Buckeye Sweetgum
Sycamore 095
Basswood __ 089 Pecan- _. Tupelo 115 Hickory _ _ Blackgum 102 Yellow-poplar
' Based on 1- by 7-inch by 4-foot boards.
MINOR IMPERFECTIONS OF HARDWOODS
Hardwood lumber frequently displays various minor irregularities of grain and other minor imperfections. In grading, their seriousness depends largely upon their size, number, and soundness. Frequently they are barred from clear-face cuttings, one side of which must be free of all imperfections and the other side sound, and are admitted in sound cuttings, which must be free from rot, heart center, shake, wane, or other defects that materially impair the strength of the cutting. Minor irregularities and imperfections are among the characteristics of wood that should be taken into account because they affect appear- ance always and utility frequently.
59

Samples of 23 hardwoods, 4 inches wide by 3 feet long, were carefully examined, and the occurrence of five of the more common imperfec- tions was recorded (table 31). The term "minor" is used because the samples were selected to exclude anything of a more serious character. On these 1-square-foot samples, imperfections would necessarily occur much less frequently than in full-sized boards, but the cuttings never- theless afforded a good yardstick for obtaining comparable data.
Certain special provisions in grading rules for leniently treating some of these imperfections in woods where they are common are pointed out in the following paragraphs.
TABLE 31.—Occurrence of minor imperfections in hardwood samples
Kind of wood Bird pecks
Burls Pith flecks
Streaks Worm- holes
Ash --- --- --- Percent
7 11 5 0
11 0 6
26 17 25 11 16
4 7 8 8
73 3
13 16 0
10 7
Percent 12 18 10 20
4 6
11 7 0 8
13 32 21 11 2 3 0
29 22 17 40 25 31
Percent 0 8 0 0 0 0 0 0 0 0 0 6
12 0 0 0 0 0 0 0 0 0 0
Percent 4 8 2 0 0 0 0
14 7
10 0 6
21 2
12 11 0 0 2 1 0 0 5
Percent 4
Bass wood _ _ _ 0 Beech __ - 4 Birch _ _-- 0 Blackgum 0 Chestnut 34 Cottonwood - - - 0 Elm __ __. 1 Hackberry 0 Hickory 0 MagnoUa. 1 Maple, soft 13 Maple, hard __ 1 Oak, chestnut _ 14 Oak, red 3 Oak, white 8 Pecan 5 Sweetgum _ 0 Sycamore 7 Tupelo___ 1 Walnut, black 5 Willow _ 0 Yellow-poplar 0
A bird peck is a small hole or patch of distorted grain that results when birds peck through the growing cells of a tree. It usually resembles in shape a carpet tack with the point toward the bark, and it is ordinarily accompanied by a distortion extending along the grain and to a smaller extent around the layers of growth. Figure 23, A^ illustrates bird peck in soft elm. Nearly three-fourths of the pecan samples contained bird pecks ; elm and hickory were next, with about one-fourth of the pieces affected. At the other extreme, sweetgum, hard maple, birch, chestnut, and black walnut had few or none. Within reasonable limits, bird pecks are allowable in sound cuttings but are not allowed in clear-face cuttings. The grading rules make special allowances for some of the woods most subject to bird peck. In hickory, pecan, and soft elm, for example, bird pecks not over % of an inch in average diameter are admitted in the cuttings in Firsts ^nd Seconds and No. 1 Common grades of the National Hard- wood Lumber Association. When the aggregate area of these bird pecks exceeds one-twelfth of the total area of the required cuttings, the piece is reduced one grade.
60

9^^"'''
-^^■«y
4
M-118912
FiGUBE 23.—A, Bird pecks in elm ; B, sound and unsound burls in soft maple.
A burl is an area of distorted grain surrounding the piths of several buds that did not develop (fig. 23, B). Sound burls, which contain no knots or unsound centers, are often considered to give a more attrac- tive appearance to the lumber by introducing a variation from the normal straight grain. From 25 to 40 percent of the samples of sweetgum, soft maple, yellow-poplar, willow, and black walnut ex- amined contained burls. White oak, red oak, pecan, and hackberry had few if any. The grading rules of the National Hardwood Lum- ber Association provide that sound burls shall be admitted in the cuttings.
A pith fleck is a narrow streak resembling pith on the surface of a piece. Usually brownish and up to several inches in length, the fleck
61

results from burrowing of larvae in the growing tissue of the tree (fig. 24:, A). Pith flecks were found only in the maples and basswood, up to 12 percent of the samples of which were affected. Badly affected pieces would be allowed only in sound cuttings.
Streaks in hardwoods may be of several distinct kindSj such as gum streaks, decay streaks, mineral streaks, deep discolorations, or stain streaks associated with wormholes. In the samples examined, all but those associated with wormholes and those consisting of deep discol- orations were negligible.
In hard maple, 21 percent of the samples had streak of the blackish mineral-streak type. Mineral streaks in maple, if dark and large.
FiGUBE 24.—A, Pith flecks in basswood; B, two streaks of different degree in white oak.
62

often develop checks in drying and constitute a serious defect. In elm, red oak, white oak,, and hickory, from 10 to 14 percent of the samples had streaks (fig. 24, 5). Over half the woods, on the other hand, had few if any streaks.
In red oak and white oak, the National Hardwood Lumber Associa- tion's grading rules provide that mineral streaks, spots and streaks, and spots of similar nature exceeding in aggregate area one-twelfth of the total area of the required cuttings will reduce a piece one grade only. This prevents the grader from dealing with them too severely.
From 13 to 34 percent of the samples in chestnut, chestnut oak, and soft maple had wormholes, while several other woods had occasional occurrences accompanied by dark discolored streaks usually several inches long. "Sound wormy" grades are made in chestnut and the oaks that are characterized by numerous small wormholes but are otherwise sound. The wormholes in the samples were all small, scat- tered, and of a type that would be admitted in sound cuttings.
CHANGE OF COLOR IN HARDWOODS The color of freshly planed wood is subject to change. This change
may occur in a very few days of exposure to outdoor sunlight, even if the wood is well dried and protected from the weather. Sunlight streaming through windows will accomplish the same thing. Such color changes are not, however, due wholly to direct sunlight, for sheathing boards from old buildings are also considerably darkened. Light-colored woods tend to turn yellow or brown, and dark woods sometimes bleach noticeably. These changes are only superficial, but they may produce less attractive shades, and in furniture, for example, they sometimes give rise to complaints after the products have been in use for a time.
Method
Color change experiments were made by exposing 21 different woods outdoors in panels containing 50 pieces each. These were examined at intervals. The panels were laid flat and covered at night and during rainy weather to prevent discoloration by moisture. Eemoval of a óhip from, the surface of each sample with a small gouge permitted close comparison between a fresh surface and the exposed surface.
The proportion of heartwood and sapwood in the different woods tested varied widely. In woods such as hard maple, which are largely sapwood, the test samples were sapwood ; and in such woods as willow, which are largely heartwood, the test samples were heartwood. Heartwood and sapwood are more evenly balanced in some woods, and in four of these both heartwood and sapwood samples were used (table 32).
Results Sixteen of the 21 freshly planed woods tested showed noticeable
color changes after only 16 hours' exposure to summer sunlight, or about the interval between sunrise and sunset in June in the latitude of Madison, Wis. Earlier examination might have revealed changes sooner in some of them. Woods in which color change appeared doubtful after 16 hours were basswood, white oak, willow, mahogany, and sweetgum. After 32 hours, changes could be detected in all woods.
63

TABLE 32.—Degree of change of color of hardwoods in approximately 160 hours of sunlight
Kind of wood Heart- wood
Sap- wood
Degree of color change
Basswood-. Beech Birch Hackberry. Sweetgum.. Sycamore ..
Blackgum Maple, hard- Maple, soft__ Oak, white _ _
Cottonwood.-. Elm Hickory Walnut, black- Willow
Ash Chestnut Magnolia Mahogany Oak, red Yellow-poplar.
X X
X X
X
X X X
X
X X X
X
X X
X X X
X X X
X
X
X X
^Slight.
[Slight to medium.
►Medium.
►Medium to large.
After exposure to 160 hours of sun, the 21 woods were classified as to change in color (table 32), affording evidence of relative suscepti- bility over a short period.
In black walnut and willow heartwood, the change consisted of a slight bleaching of the exposed surface. The walnut, for instance, became a dull brown color of a lighter and much less attractive shade than the original. The other 19 woods yellowed or browned in vary- ing degrees. Light-colored woods did not necessarily discolor more than darker ones. Basswood, one of the whitest woods, changed color much less than did chestnut, which had a decided brownish tint at the start. In the same wood, light-colored or sapwood samples gen- erally showed a more decided color change after exposure than darker or heartwood samples.
The printed words on the piece in figure 25, A, were produced by a stencil tacked on sap yellow-poplar, which let the sunlight darken the area of the letters. The light-colored rectangle shown in figure 25, 5, was protected from the sunlight while the surrounding wood was exposed. Yellow-poplar showed as pronounced a color change as any wood upon exposure to sunlight. These changes occurred in 20 days.
SUMMARY
Among the important classes of properties that affect the general utility of any wood are its machining properties, which embrace all woodworking operations. In these, as in other classes of properties, different woods vary widely and a specific wood may give good results
64

trAlî(ï«TlTII»¥-
■%p»i»HW^ iiiiw*-agiT>«>.ii]nii'»Blii»»w»ëaW<l
B
FiGUEE 25.—Effect of sunlight on sap yellow-poplar: A, Printing produced by sunlight through a stencil ; B, color contrast between protected area (small rec- tangle) and unprotected area.
in some operations, fair in others, and poor in still others. The "workability" of any wood therefore cannot be judged by one opera- tion, but depends rather upon the summation of all of them. In any operation there are several factors, both in the wood itself and in the machine, that affect the results, and these results may be good or bad depending upon the conditions under which the work was done. The usability of certain native woods that are somewhat refractory or not familiar to consumers may depend on searching out the optimum machining conditions. Some woods machine well under a relatively wide range of conditions while others need exacting techniques if good results are to be obtained.
Table 33 sums up the results of all the machining tests discussed in this publication. In its columns the behavior of the different woods included in all machining experiments discussed in this publication can be found. By reading across the columns, the performance of any given wood in the whole series of experiments can be studied to get a bird's-eye view of its general workability. Table 34 similarly sums up certain additional data on hardwood characteristics that affect either the machining or the general utility of the different woods.
6S

^
TABLE 33. —Some m acMning and related properties of hardwoods
Kind of wood Planing—
perfect pieces
Shaping— good to excellent
pieces
Turning— fair to
excellent pieces
Boring— good to excellent
pieces
Mortis- ing— fair to
excellent pieces
Sanding— good to excellent
pieces
Steam bending— unbroken
pieces
Nail splitting— pieces free
from complete
splits
Screw splitting— pieces free
from complete
splits
Alder, red Percent
61 75 26 64 83
63 47 48
Percent 20 55
7 10 24
57 22 32
6 80
28 25
3 13 20
10 20 60 75 27
Percent 88 79 65 68 90
80
Percent 64 94 78 76 99
97
Percent 52 58 60 51 92
97
Percent Percent Percent Percent
Ash Aspen
75 67 65 71
Basswood _ _ _ __ 17 49
34
2 75
72
79 42
32
68 Beech _ 58
Birch 1 ______ 48 Birch, paper» _ _ Blackgum 75
58 88
87 77 70 65 60
77 84 86 88 79
82 75
100
91 90 70 94 60
99 100 100 100
71
24 18
100
70 90 52 75 50
72 98
100 95 32
21 42 9
65 63 Buckeye _ _ _ _ Cherry, black _ _ __ _ 80
74 75 21 33 80
74 76 40 90 65
Chestnut 64 56 66 60 Chinkapin _ _ Cottonwood _ _ 19
66 44 74
82 80
78 Elm, soft__ 74 Gumbo-limbo _ _
Hackberry 94 76
63 35
63 Hickory _ 80 63 Laurel. California Madrone Magnolia 37 85 73 76

Mahocanv 80 52 54 41
91 80 87 88 51
22 55 62 52 70
68 66 72 25
28 39 35 40 28
12 52 34
5 13
89 80 82 76
84 81 85 89 86
85 79 91 58 81
100 100 99 80
99 100 95
100 92
98 62
100 71 87
100 80 95 34
95 100 99 98 58
96 33 98 24 63
41 68 78 Manie, bierleaf Maple, hard __ 38
37
81
57 59
86
27 58
66
52 Maple, soft ______ 61
Oak, red __ - 78 Oak tanbark Oak, white 2 83 91
78 67
29 46 78 73 58
69 47 69
79 64 50 89 77
74 Pecan 69 Sweetgum 23
21 34
69
Sycamore 74 Tupelo - 63 Walnut, black 59 Willow— 24
19 62
Yellow-poplar 67
1 Includes yellow, sweet, and all other commercial birches except white or paper birch. 2 Includes chestnut oak and other commercial white oaks.

TABLE 34.—Certain characteristics of hardwoods that affect machining
Kind of wood Specific gravity average
Rings per inch average
Cross grain
Slope— spiral grain
Inter- locked— pieces
Shrinkage (tangential) in moisture content re-
duction
Green to 6 per- cent
12 to 6 per- cent
Warp (per
7-inch widths)-
twist
Ash Basswood Beech Birch Blackgum Buckeye Chestnut Cotton wood Elm Hackberry Hickory Magnolia Mahogany Maple, hard Maple, soft Oak, chestnut Oak, red Oak, white Pecan Sweetgum Sycamore Tupelo Walnut, black Willow Yellow-poplar
0. 50 .35 .55 .58 .45 .34 .39 .38 .48 .43 .61 .44 .46 .57 .45 .56 .55 .56 .58 .46 .47 .44 .51 .34 .41
Number 13 16 15 21 22 17 11 8
14 13 15 16
17 12 15 10 17 14 15 9
19 9 9
12
Percent 5.6 4.3 6.9 5.5 7.5 6.7 6.2 4.3 4.9 5.5 3. 1 5. 1 6.2 7.9 6.5 7.2 44 5.3 4.3 8.2 7.7 8.9 5.7 7.7 5.2
Percent 0 0 0 0
53 10 0
24 19 0 0 0 10 0 0 0 0 0 0 48 45 68 0 0 0
5.7 7.2 8.9 7.5 6.6 5.4 6.6 6.7 7.5 6.5 7.9 5.9 3.4 7.8 6. 1 9.5 9.0 8.8 6.6 8.4 6.9 6. 1 6.7 6.2 6.2
2. 1 1.4 2.8 2.2 2.3 1.7 1.9 2.0 2.4 2. 1 2.7 2.0 1.3 2.3 2. 1
2.4 2.2 2.4 2.3 1.9 1.7 1.8 1.9
Inch 0. 107
. 168
.303
723 150
224 281 131 193 248
.246
. 119
. 113
. 187
.465
.534
.647
'.'Í23 .218
68 U.S. GOVERNMENT PRINT ING OFFICE : 1962 O—634933


![Effect of Coolant Temperature on Machining Characteristics ... · machining. Machining with coolant will help to reduce wear, corrosion and creep of the materials [28-30]. Although,](https://img.pdfslide.net/doc/110x75/5e94a747103e90191c2608ba/effect-of-coolant-temperature-on-machining-characteristics-machining-machining.jpg)