Embed Size (px)
Citation preview

Macquarie Australia Conference 2018 Commentary and Presentation
Sydney, 2 May 2018: Fairfax Media Limited [ASX:FXJ] (“Fairfax” or “Company”) Chief
Executive Greg Hywood will today deliver a presentation at the Macquarie Australia Conference in Sydney.
Presentation commentary and accompanying slides are attached.
As is our usual practice, the presentation contains a trading update, the details of which have been extracted below:
Trading Update
Trading in the first 17 weeks of FY18 H2 (25 December 2017 to 22 April 2018) saw overall Group revenues around 1% below last year.
Revenue across our reporting segments:
− Domain’s digital revenue growth is 21% and total revenue growth is 13%;
− Australian Metro Media is down around 2%;
− Australian Community Media is down around 9%;
− Stuff (New Zealand Media) is down around 8% including currency impact;
− Macquarie Media is up around 4% (up 6% excluding disposals).
Across the Fairfax Group, we continue to implement cost savings measures.
Ends
Contact:
Brad Hatch Director of Communications +61 2 9282 2168 [email protected]
For
per
sona
l use
onl
y
Macquarie Australia Conference 2018 Presentation Commentary
Fairfax Media CEO & Managing Director, Greg Hywood:
Slide 1
Good afternoon everyone. Thank you for making the time to be with us today.
It’s great to be here at the Macquarie Conference.
Chief Financial Officer David Housego is with me today and will join us for Q&A at the end of the presentation.
In the past five years at this conference we have presented a deep dive into our strategy. In particular we have focused on the transformation of Fairfax – from a traditional media model with a large fixed cost base – to a modern, diversified portfolio of multimedia and digital assets with a flexible, lower cost base.
Transformation is one of those words that gets thrown about. In our case the changes have quite literally been transformational.
Today’s presentation outlines our growth and value creation agenda for our portfolio of leading information brands, marketplaces and entertainment – assets that connect with 70% of Australians and 90% of New Zealanders.
We have hit a new phase in the development of the business. We have taken big decisions around cost. We have taken big decisions to create businesses such as Domain and Stan. Our continued focus is on organic value creation opportunities – going for growth – maximising our existing core assets.
Slide 2
Fairfax Media is now a modern portfolio of Domain, Publishing and Investments. Each is explicitly focused on driving growth and building value by leveraging our competitive strengths of quality content, premium brands, data and insights and large audiences.
If you think back to 2012, it is fair to say that there was some scepticism when we laid out our plan for tackling structural change for newspapers and the media.
Slide 3
Between 2012 and 2018, newspaper industry advertising revenue as a percentage of the total Australian advertising pie, went from 23% to just 8%. To date, that’s been a $300 million average annual reduction in revenue across the industry.
In the face of that profound industry disruption, setting ourselves on the path of originating commercially-viable new media has proven correct.
We are achieving our goal of sustaining independent journalism’s public good, while at the same time delivering shareholder value creation. In the past six years we have built around $1.6 billion of value. We are focused on accelerating value creation.
For
per
sona
l use
onl
y

Page 2
Slide 4
Our achievements to date, and opportunities ahead, are underpinned by three strategic priorities:
Growing by building on core strengths and maximising opportunities;
Transforming through cost efficiency and business model innovation; and
Building Value through strategic decision-making and portfolio management.
Today we will detail the implementation of this strategy across our three business groups – Domain, Publishing and Investments.
Slide 5
First to our Domain real estate media and services business – a leading platform at the centre of the Australian property ecosystem, delivering a compelling consumer and agent experience.
A year ago we discussed at this forum our strategic intent to separate Domain into a new ASX-listed entity. We achieved that milestone in November 2017. Our 60% shareholding remains a key strategic asset with strong fundamentals.
Highlights of Domain’s contribution to the delivery of Fairfax’s strategy include:
Growing relative market share of listings penetration from 66% to more than 95% since 2014;
Transforming into a digitally-driven business with digital as a percentage of EBITDA increasing from 71% to 84% since 2014; and
Building value through the separation into a standalone ASX-listed company, with a market valuation of $1.8 billion.
Slide 6
At the core of Domain are strong agent relationships; large and highly-engaged multiplatform audiences; and a motivated and talented team led by Nick Falloon as Executive Chairman.
That core is delivering the performance across Domain’s five business groups, reflected in digital revenue growth increasing 189% and digital EBITDA expanding 161% since FY14.
These results are the product of the successful delivery of key strategic initiatives.
Agent and listings coverage has been successfully expanded, with relative market shares of more than 90% and 95% respectively.
Early adoption of mobile in product development has created a highly-popular mobile-centric platform. Over the past four years, monthly average app users have increased by more than 100%.
Growth in active users and quality enquiries is underpinned by the more than doubling of mobile app downloads.
For
per
sona
l use
onl
y
Page 3
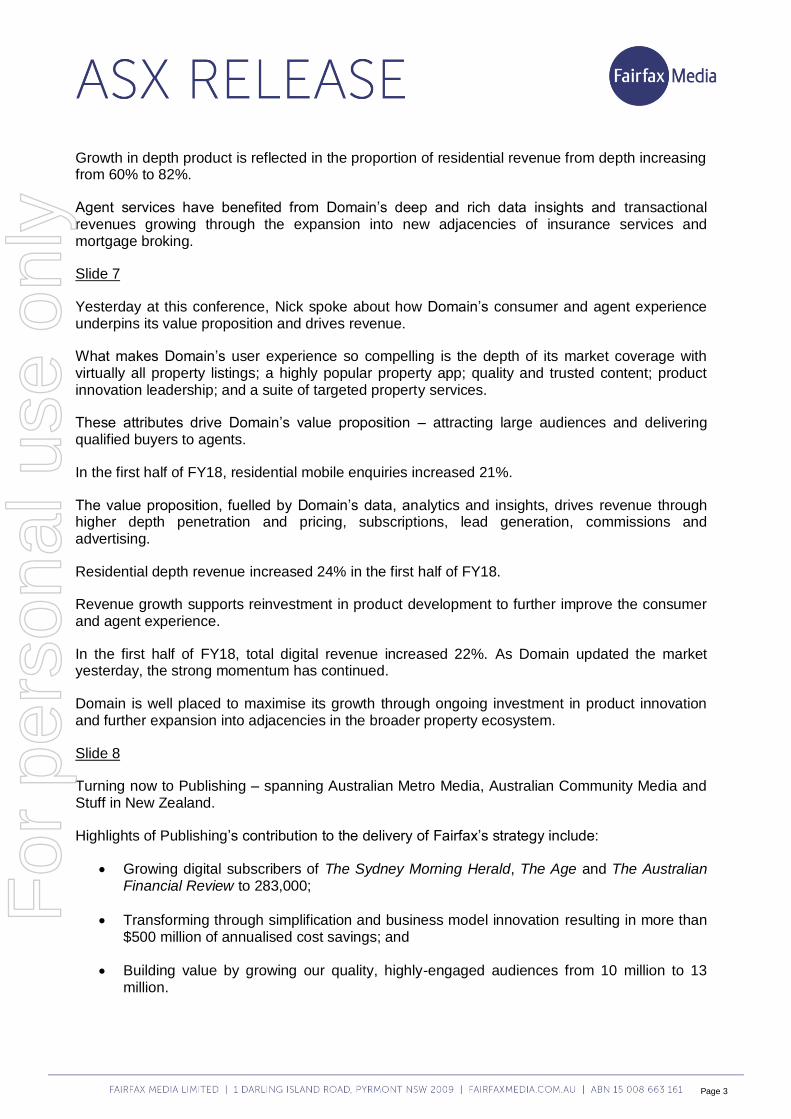
Growth in depth product is reflected in the proportion of residential revenue from depth increasing from 60% to 82%.
Agent services have benefited from Domain’s deep and rich data insights and transactional revenues growing through the expansion into new adjacencies of insurance services and mortgage broking.
Slide 7
Yesterday at this conference, Nick spoke about how Domain’s consumer and agent experience underpins its value proposition and drives revenue.
What makes Domain’s user experience so compelling is the depth of its market coverage with virtually all property listings; a highly popular property app; quality and trusted content; product innovation leadership; and a suite of targeted property services.
These attributes drive Domain’s value proposition – attracting large audiences and delivering qualified buyers to agents.
In the first half of FY18, residential mobile enquiries increased 21%.
The value proposition, fuelled by Domain’s data, analytics and insights, drives revenue through higher depth penetration and pricing, subscriptions, lead generation, commissions and advertising.
Residential depth revenue increased 24% in the first half of FY18.
Revenue growth supports reinvestment in product development to further improve the consumer and agent experience.
In the first half of FY18, total digital revenue increased 22%. As Domain updated the market yesterday, the strong momentum has continued.
Domain is well placed to maximise its growth through ongoing investment in product innovation and further expansion into adjacencies in the broader property ecosystem.
Slide 8
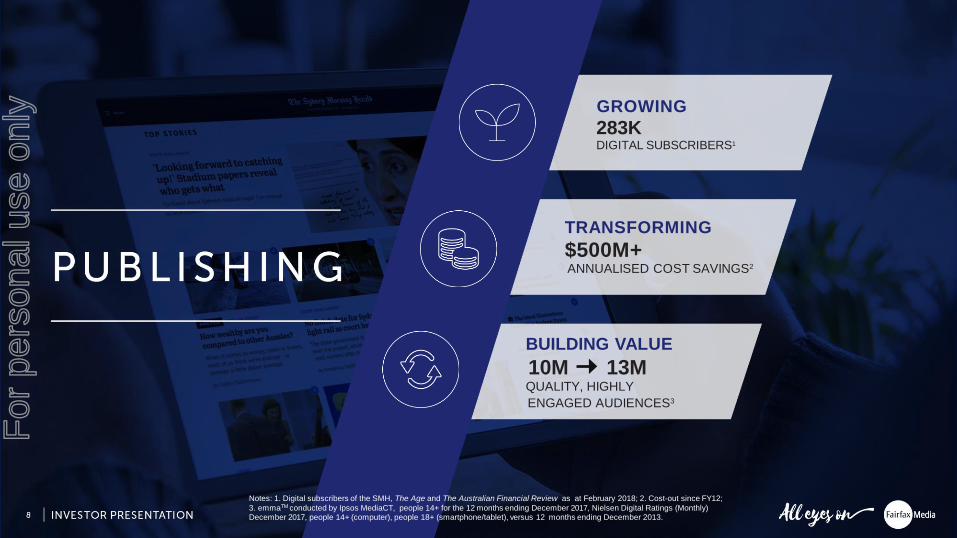
Turning now to Publishing – spanning Australian Metro Media, Australian Community Media and Stuff in New Zealand.
Highlights of Publishing’s contribution to the delivery of Fairfax’s strategy include:
Growing digital subscribers of The Sydney Morning Herald, The Age and The Australian Financial Review to 283,000;
Transforming through simplification and business model innovation resulting in more than $500 million of annualised cost savings; and
Building value by growing our quality, highly-engaged audiences from 10 million to 13 million.
For
per
sona
l use
onl
y
Page 4
Slide 9
The new revenue model underpinning our publishing business is multi-faceted and moves well beyond the traditional reliance on advertising, print subscriptions and circulation. It continues to leverage premium brands, quality journalism and audiences which have never been larger in the company’s history.
While this model has lower revenue than in the past, it is more sustainable and valuable, featuring multiple business models and diversified revenue streams.
The model leverages key publishing assets of large audiences and marketing inventory to build and grow new businesses. The success of this can be seen in Domain and Stan.
Advertising support from our publishing business has been instrumental in Domain’s fast rise to become a serious competitor in the Australian property listings scene; as well as the incredible scale of subscribers Stan has achieved in just over three years.
Slide 10
Before I dive into the detail on our three publishing businesses, this slide provides an overview of the structural distinctions which inform the targeted strategies we are implementing.
Australian Metro Media is focused on strengthening earnings and long-term growth by driving digital performance and maximising the print contribution. Metro operates six main capital city and national mastheads, and associated Life Media brands, attracting an audience of 11 million across platforms. Revenue is concentrated in that small number of mastheads, with contribution of digital and other non-print revenue at 35% of total.
Australian Community Media’s focus is on optimising the operating structure to grow digital and maximise cash flows of low capital intensive and profitable print. ACM comprises 13 daily and more than 130 non-daily regional titles, 9 community titles and 10 specialist agricultural titles. Revenue is diversified among mastheads with the top five contributing only 28% of total revenue. Contribution of digital and other non-print revenue is modest at 7% of total.
In New Zealand, our strategic focus is on leveraging the enormous power of Stuff into growing digital, transactional and advertising revenues, while rationalising the long tail of print. Stuff operates New Zealand’s leading national digital news site Stuff.co.nz, 9 large daily regional titles, 11 national titles and sites, along with more than 50 community titles. Revenue is relatively concentrated with the top five mastheads contributing half of total revenue. Contribution of digital and other non-print revenue is 17% of total and growing rapidly.
It is clear to us that there is not a ‘one size fits all’ solution for publishing. Each has a distinct market positioning, products and strategy to leverage growth.
Slide 11
Turning first to Australian Metro Media – where we are growing digital while maximising the performance of our print assets.
The framework on this page demonstrates the strategies we are implementing across our platforms and products to drive revenue generation.
For
per
sona
l use
onl
y
Page 5
The value pyramid builds on publishing’s mass audience, which we attract, develop and retain through our quality editorial and content. This audience is monetised through display advertising and branded content.
Our world-first partnership with Google maximises the value of our audience and advertising inventory to drive higher CPMs on our programmatic sales. This partnership is indicative of the developments in the industry that will help sustain publishing earnings into the medium and longer term.
Moving up the pyramid, we convert, engage and strengthen loyalty of targeted and specialist audiences, such as The Australian Financial Review’s highly sought after AB demographic. We
monetise this audience through premium display advertising, targeting and data products.
Our Metro business also includes e-commerce and transactions revenue. This includes our suite of events spanning sport, food, parenting, business and the arts, along with transactions, lead generation and commissions.
Building premium products and new businesses drives revenue generation through subscriptions and B2B, including digital subscriptions for the SMH, The Age and Financial Review, and B2B revenues through weather services business Weatherzone.
Metro’s strategy to drive digital growth is reflected in digital and non-print share of revenue increasing from 28% to 35% over the past four years; and digital subscriptions revenue growing around 150% over the same period.
The success in attracting, acquiring and developing audience is reflected in The Sydney Morning Herald being Australia’s most-read masthead, with a cross-platform audience of more than 5 million.
Slide 12
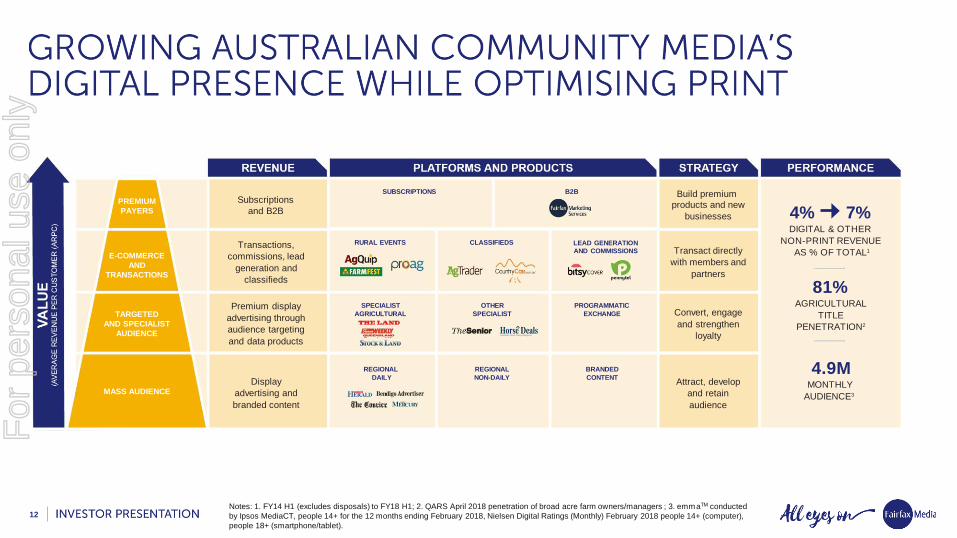
Applying that same framework to our Australian Community Media, we are seeing progress as it grows its digital presence while optimising the currently profitable long tail of print publications.
ACM’s regional dailies deliver the bulk of the mass audiences across highly-engaged local communities.
We reach and monetise targeted and specialist audiences at a premium through our leading agricultural mastheads, such as The Land, and other specialist titles including The Senior and Horse Deals.
Across the regional digital network, we are strengthening our position with programmatic exchanges to maximise advertising yields.
ACM’s close community connections deliver e-commerce and transactions revenue opportunities. This includes leading rural events, classifieds, and lead generation and commissions.
Subscriptions are expected to grow with new local news packages being progressively introduced, including paid digital subscriptions in key markets.
B2B revenues are growing strongly, benefiting from a strong performance from Fairfax Marketing Services, which delivers full digital marketing solutions to regional clients.
For
per
sona
l use
onl
y
Page 6
ACM is in the formative stages of its digital transformation, with digital and other non-print revenue as a percentage of total increasing from 4% to 7% over the past four years.
The strength of our market-leading agricultural franchise is reflected in 81% penetration of all broad acre farmer/managers. This sector has shown earnings resilience in the face of newspaper industry disruption.
The scale of our engaged local communities is reflected in a monthly audience of around 5 million.
Slide 13
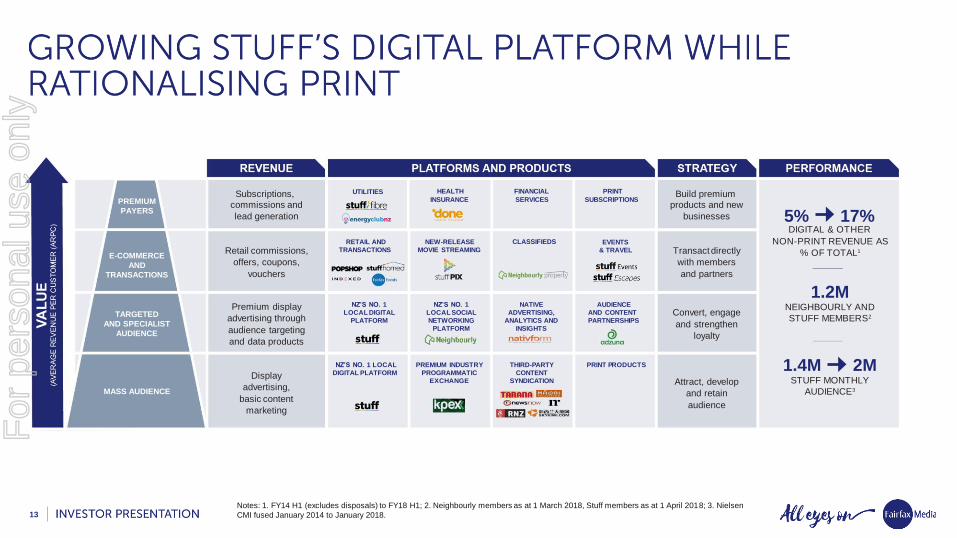
In New Zealand, the centrepiece of the audience and revenue generation model is Stuff.co.nz, which is the leading local digital platform nationally. Stuff group reaches 90% of the population. The scale of this audience and reach provides Stuff with compelling competitive advantage.
Mass audience is being monetised through the Stuff digital platform, premium industry programmatic exchange KPEX, third-party syndication and standalone print products.
Stuff and hyper-local community platform Neighbourly have very effectively built membership models of large, highly engaged and loyal audiences. Monetisation occurs via audience targeting and data products.
The engaged and loyal membership base of these powerful brands provides the opportunity to drive e-commerce and transactions revenue. Stuff is well progressed with its launch into new categories such as new release movie on-demand streaming service Stuff Pix; and Neighbourly has expanded into property classifieds.
Stuff is leveraging its strong market position into a broader consumer ecosystem. New premium products and businesses include joint venture internet service provider Stuff Fibre, as well as lead-generation partnerships with utilities, health insurance and financial services providers.
Print continues to attract subscription revenues in the majority of markets. We are rationalising, via sale or closure, around 35% of titles representing less than 5% of revenue. These titles do not have a subscription revenue base or are otherwise unprofitable.
The tremendous momentum of the Stuff platform is reflected in digital and other non-print revenue as a percentage of total increasing from 5% to 17% over the past four years; the creation of a membership base of 1.2 million across Neighbourly and Stuff; and an impressive monthly audience of 2 million.
Slide 14
We are being unrelenting in the way we are driving continued transformation across all three of our publishing businesses.
World-class product development underpins the new websites of The Sydney Morning Herald and The Age. Innovation continues apace. We are pleased with the uplift in traffic and higher engagement.
We are leveraging publishing’s extensive marketing inventory and audiences to further expand into new products and services and drive new revenue streams.
For
per
sona
l use
onl
y

Page 7
Commercial teams have been reshaped and refocused around industry verticals. New rich-media advertising formats are delivering results for clients.
Significant cost reduction has been achieved through a technology reset. We have simplified our publishing technology stack and are retiring complex legacy systems built up over decades. Our new publishing systems are not only low-cost, but allow us to rapidly respond to changing market demands and reader and advertiser needs. Over the past two years, our overall technology operating costs in Metro have reduced by a third. We expect to further reduce tech expenses in FY19.
The industry is entering a new era of cooperation.
Metro’s pivotal sales and technology partnership with Google meets the growing demand for premium programmatic inventory and is delivering promising early results.
We are progressing our constructive discussions with News Corp to seek industry-wide material efficiencies in printing and distribution.
These two initiatives are expected to contribute materially to Metro’s FY19 performance.
Our Metro newsrooms are honing in on their areas of journalistic excellence to maximise the public interest benefits of our $100 million annual investment in editorial, in turn accelerating audience engagement and subscriptions.
Across the board, cost management is part of our organisational DNA and we continue to focus on end-to-end efficiency.
Print continues to be underpinned by a level of advertiser and consumer support. We are investing in new product to meet demand and drive results. We are starting to see some early signs of stabilisation in print advertising.
The progress we are making with these transformation initiatives makes us more and more confident about the future of our publishing businesses, particularly Metro and Stuff.
Slide 15
Turning now to Investments, which include our 50%-owned subscription video-on-demand platform Stan, and 54.5%-owned ASX-listed radio broadcaster Macquarie Media.
Highlights of Investment’s contribution to the delivery of Fairfax’s strategy include:
Growing Stan’s active subscribers to around 930,000 (as at February) in just over three years;
Transforming through the successful merger of Fairfax Radio Network with Macquarie Radio Network, delivering a margin uplift from 16.4% to 23.7%; and
Building value through that merger, with total value creation in excess of $120 million.
For
per
sona
l use
onl
y

Page 8
Slide 16
Since launching in January 2015, Stan has established itself as the leading Australian streaming brand and dominant local streaming platform.
Stan’s compelling subscription proposition is underpinned by the exclusive Australian output deal with SHOWTIME; a range of exclusive content rights with global studios; as well as investment in original local productions.
Financial and brand support of strategically-aligned shareholders Fairfax and Nine Entertainment has leveraged the mass market consumer marketing reach of both companies.
Stan is strongly positioned to continue its growth trajectory, and in a changing landscape well placed to benefit from further strategic alignment with global studios and networks.
Slide 17
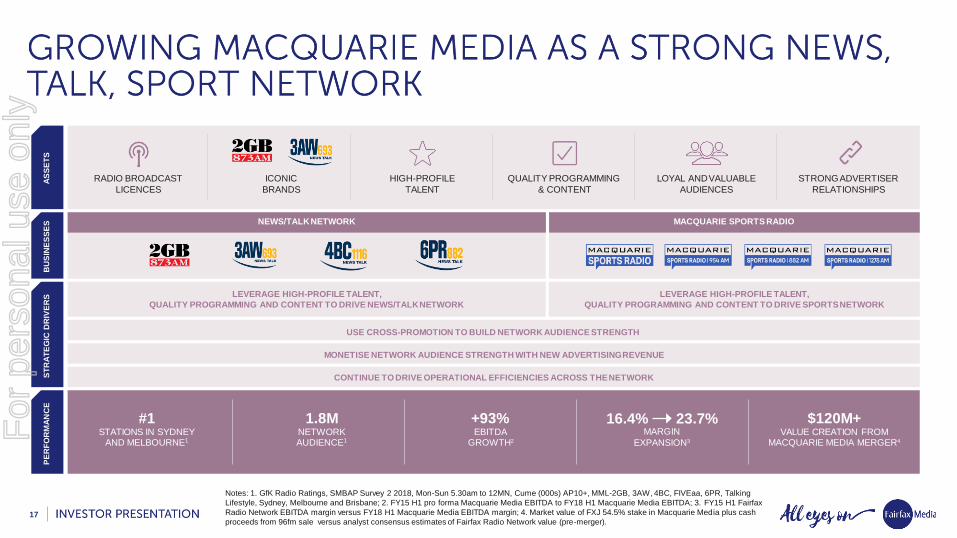
Macquarie Media is a news/talk/sport radio powerhouse with high-profile talent and the number-
one stations in the key markets of Sydney and Melbourne.
2GB, 3AW, 4BC and 6PR and the recently launched Macquarie Sports Radio franchise provide quality programming and content, and opportunities for cross promotion to build network audience strength.
A loyal and valuable audience of almost 2 million is monetised through strong advertiser relationships and new advertising categories.
The merger in 2015 has clearly been a success, with significant operational synergies delivered, underpinning a 93% increase in pro forma EBITDA.
Slide 18
In summary, the growth-focused and cost-efficient assets that make up Fairfax Media’s portfolio of Domain, Publishing and Investments are performing well. These assets underpin our future growth and offer a significant value creation opportunity.
Slide 19
Our strategy to grow has delivered an increase in the Group’s digital and other non-print revenue as a percentage of total from 23% to 39% in the past four years. Print is generating strong cash flows which should continue for some time given the industry back-end cost initiatives underway.
Our strategy to transform has delivered net debt reduction of close to $1 billion resulting in a strong balance sheet with a net cash position for Fairfax’s 100%-owned entities.
Our strategy to build value has delivered Fairfax shareholders $1.6 billion in value creation.
In conclusion, Fairfax is thriving.
We are well placed to take advantage of opportunities as they arise now that the Australian Government has passed new media ownership laws. Any decisions we take will be in our shareholders’ best interests.
For
per
sona
l use
onl
y
Page 9
Slide 20
Earlier today we provided a trading update to the market as is our usual practice at this conference.
Slide 21
Trading in the first 17 weeks of FY18 H2 (25 December 2017 to 22 April 2018) saw overall Group revenues around 1% below last year.
Revenue across our reporting segments:
− Domain’s digital revenue growth is 21% and total revenue growth is 13%;
− Australian Metro Media is down around 2%;
− Australian Community Media is down around 9%;
− Stuff (New Zealand Media) is down around 8% including currency impact;
− Macquarie Media is up around 4% (up 6% excluding disposals).
Across the Fairfax Group, we continue to implement cost savings measures.
Slide 21
Thanks for your attention.
David will now join me for Q&A.
Ends
Contact:
Brad Hatch Director of Communications +61 2 9282 2168 [email protected]
For
per
sona
l use
onl
y

1
FINAL
01/05/2018
For
per
sona
l use
onl
y

2
Q U A L I T Y CO N T E N T | P R E M I U M B R A N D S | DATA & I N S I G H T S | L A R G E AU D I E N C E S
Strong and growing ecosystem of real estate
media and services businesses engaging
consumers and agents
Leading networks of information brands,
marketplaces and entertainment assets with
Australia & New Zealand’s No. 1 mastheads
Leading Australian SVOD service and leading
national radio network with Sydney and Melbourne’s
No. 1 stations
For
per
sona
l use
onl
y

3 Notes: FXJ shareholder value includes market capitalisation plus value delivered to shareholders from Domain Group separation and on-market
buybacks; Newspaper industry share of Australian advertising revenue source Zenith.
For
per
sona
l use
onl
y

4
T R A NSF O R MI NG
Through cost efficiency and business
model innovation
B UI L DI N G VA L U E
Through strategic decision-making
and portfolio management
G RO W I N G
By building on core strengths
and maximising opportunities
For
per
sona
l use
onl
y

5
GROWING
66% 95%+ RELATIVE MARKET SHARE
LISTINGS PENETRATION1
DIGITAL AS % OF EBITDA2
MARKET VALUATION3
TRANSFORMING
71% 84%
BUILDING VALUE
$1.8BN
Notes: 1. March 2014 to March 2018; 2. FY14 H1 to FY18 H1 (FY18 H1 excludes corporate);
3. DHG market capitalisation.
For
per
sona
l use
onl
y

6
COMMERCIAL MEDIA RESIDENTIAL AND DEVELOPERS
GROW DEPTH PRODUCT PENETRATION GROW AGENT SERVICES
PENETRATION GROW NEW
TRANSACTIONAL REVENUES
EXPAND AGENTS AND LISTINGS COVERAGE
AGENT SERVICES AND PROPERTY DATA
TRANSACTIONS
12K RESIDENTIAL
AGENTS
3K COMMERCIAL REAL
ESTATE AGENTS
3.7M DIGITAL
AUDIENCE
2.1M PRINT
AUDIENCE
1.5M SOCIAL
AUDIENCE
112M EDITORIAL CONTENT (SESSIONS)
3.5K CRM
SUBSCRIBERS
5K DATA
SUBSCRIBERS
~740 EMPLOYEES1
80% 90%+ RELATIVE AGENT
SHARE2
2.65M 6.34M MOBILE APP
DOWNLOADS5
+189% DIGITAL REVENUE
GROWTH3
+108% MONTHLY AVERAGE
APP USERS7
60% 82% RESIDENTIAL REVENUE
FROM DEPTH6
+161% DIGITAL EBITDA
GROWTH4
PE
RF
OR
MA
NC
E
ST
RA
TE
GIC
DR
IVE
RS
B
US
INE
SS
ES
C
OR
E A
SS
ET
S
GROW ACTIVE USERS AND QUALITY ENQUIRIES
CREATE MOBILE-CENTRIC PLATFORM AT CENTRE OF PROPERTY ECOSYSTEM
Notes: 1. Employees of 100%-owned entities; 2. March 2014 to March 2018; 3. FY14 H1 to FY18 H1; 4. FY14 H1 to FY18 H1; 5. March 2014 to
March 2018; 6. FY14 H1 to FY18 H1; 7. Google Analytics, users of residential apps, Domain and Allhomes (monthly average) FY14 H1 to FY18 H1.
For
per
sona
l use
onl
y

7 Note: Financial metrics relate to FY18 H1
For
per
sona
l use
onl
y
8
GROWING
283K DIGITAL SUBSCRIBERS1
$500M+ ANNUALISED COST SAVINGS2
TRANSFORMING
BUILDING VALUE
10M 13M QUALITY, HIGHLY
ENGAGED AUDIENCES3
Notes: 1. Digital subscribers of the SMH, The Age and The Australian Financial Review as at February 2018; 2. Cost-out since FY12;
3. emmaTM conducted by Ipsos MediaCT, people 14+ for the 12 months ending December 2017, Nielsen Digital Ratings (Monthly) December 2017, people 14+ (computer), people 18+ (smartphone/tablet), versus 12 months ending December 2013.
For
per
sona
l use
onl
y

9
MARKETING INVENTORY
PREMIUM BRANDS
PARTNERING
JOURNALISM/CONTENT
TALENT AND CAPABILITY
AUDIENCE
DATA AND INSIGHTS
TRADITIONAL MODEL
ADVERTISING
PRINT SUBSCRIPTIONS
AND CIRCULATION
NEW MODEL
- PLUS -
LEVERAGING OUR PUBLISHING AND MARKETING INVENTORY TO BUILD VALUE ACROSS PORTFOLIO
SVOD/ STREAMING
EVENTS
ADVERTISING PRINT SUBSCRIPTIONS AND CIRCULATION
DIGITAL SUBSCRIPTIONS
EG.
VALUE ADDED SERVICES AND TRANSACTIONS
LEAD GENERATION/ COMMISSIONS
For
per
sona
l use
onl
y

10
AUSTRALIAN METRO MEDIA AUSTRALIAN COMMUNITY MEDIA STUFF
STRATEGIC FOCUS Strengthen earnings and long-term growth by
driving digital performance and maximising
print contribution
Continue to optimise operating structure to
grow digital and maximise cash flows of
low capital intensive and profitable print
Leverage enormous power of Stuff brand to
grow digital revenues while rationalising the
long tail of print
GEOGRAPHIC FOOTPRINT Australian national and capital cities Australian regional and local/community New Zealand national, regional and local/community
MASTHEAD SUMMARY • Australia’s No. 1 masthead
The Sydney Morning Herald
• Leading national specialist financial
title The Australian Financial Review
• Strong Vic, Qld, WA and ACT news
brands - The Age, Brisbane Times,
WAtoday and The Canberra Times
• Associated Life Media mastheads
• 13 daily/regional titles - e.g. Newcastle
Herald, Illawarra Mercury, Bendigo Advertiser,
The Courier (Ballarat)
• 138 non-daily regional titles
• 9 local/community titles
• 10 specialist agricultural titles - e.g.
The Land
• Leading national digital news site Stuff.co.nz
• 11 national titles/sites
• 9 large daily/regional newspapers
• 53 local/community titles
AUDIENCE (CROSS PLATFORM) 11 million1 4.9 million2 3.6 million3
PRIMARY REVENUE DRIVERS Subscription/circulation revenue, advertising,
branded content
Subscription/circulation revenue, advertising,
branded content
Subscription/circulation revenue, advertising,
branded content
OTHER REVENUE DRIVERS Events, transactions, commissions, lead generation Events, digital marketing services, commissions,
lead generation
Events, retail, transactions, commissions,
lead generation
PROPORTION OF TOTAL DIGITAL
& OTHER NON-PRINT REVENUE
35% 7% 17%
REVENUE OF TOP 5
MASTHEADS AS % OF TOTAL
~100% 28% 50%
REVENUE OF BOTTOM THIRD OF
MASTHEADS AS % OF TOTAL n/a 4% <5%
Notes: 1 and 2. emmaTM conducted by Ipsos MediaCT, people 14+ for the 12 months ending February 2018, Nielsen Digital Ratings (Monthly)
February 2018 people 14+ (computer), people 18+ (smartphone/tablet); 3. Nielsen CMI fused Q1 17 – Q4 17 Jan 18.
For
per
sona
l use
onl
y

11
28% 35% DIGITAL & OTHER
NON-PRINT REVENUE
AS % OF TOTAL1
+150% DIGITAL
SUBSCRIPTION REVENUE2
5M+ SMH CROSS-PLATFORM
MONTHLY AUDIENCE3
PROGRAMMATIC
SALES
PRINT PRODUCTS
DIGITAL SUBSCRIPTIONS PRINT SUBSCRIPTIONS B2B
EVENTS
PREMIUM TARGETED
DISPLAY ADVERTISING
TRANSACTIONS
SPECIALIST
FINANCIAL
PUBLICATIONS
AUSTRALIA’S NO. 1
MASTHEAD AND OTHER
LEADING DIGITAL TITLES
Build premium
products and new
businesses
Transact directly
with members and
partners
Convert, engage
and strengthen
loyalty
Attract, develop
and retain
audience
Subscriptions
and B2B
Transactions,
commissions
and lead
generation
Premium display
advertising through
audience targeting
and data products
Display
advertising
and branded
content
PREMIUM
PAYERS
E-COMMERCE
AND
TRANSACTIONS
TARGETED
AND SPECIALIST
AUDIENCE
MASS AUDIENCE
Notes: 1. FY14 H1 (excludes disposals) to FY18 H1; 2. FY14 H1 to FY18 H1; 3. emmaTM conducted by Ipsos MediaCT, people 14+ for the 12
months ending February 2018, Nielsen Digital Ratings (Monthly) February 2018 people 14+ (computer), people 18+ (smartphone/tablet).
PREMIUM
PROGRAMMATIC
SALES
For
per
sona
l use
onl
y
12
Subscriptions
and B2B
Transactions,
commissions, lead
generation and
classifieds
Premium display
advertising through
audience targeting
and data products
Display
advertising and
branded content
Build premium products and new
businesses
Transact directly
with members and
partners
Convert, engage
and strengthen
loyalty
Attract, develop
and retain
audience
4% 7% DIGITAL & OTHER
NON-PRINT REVENUE
AS % OF TOTAL1
81% AGRICULTURAL
TITLE
PENETRATION2
4.9M MONTHLY
AUDIENCE3
B2B SUBSCRIPTIONS
PROGRAMMATIC
EXCHANGE
OTHER
SPECIALIST
SPECIALIST
AGRICULTURAL
BRANDED
CONTENT
REGIONAL
NON-DAILY
REGIONAL
DAILY
LEAD GENERATION
AND COMMISSIONS
CLASSIFIEDS RURAL EVENTS
PREMIUM
PAYERS
E-COMMERCE
AND
TRANSACTIONS
TARGETED
AND SPECIALIST
AUDIENCE
MASS AUDIENCE
Notes: 1. FY14 H1 (excludes disposals) to FY18 H1; 2. QARS April 2018 penetration of broad acre farm owners/managers ; 3. emmaTM conducted
by Ipsos MediaCT, people 14+ for the 12 months ending February 2018, Nielsen Digital Ratings (Monthly) February 2018 people 14+ (computer),
people 18+ (smartphone/tablet).
For
per
sona
l use
onl
y
13
5% 17% DIGITAL & OTHER
NON-PRINT REVENUE AS
% OF TOTAL1
1.2M NEIGHBOURLY AND
STUFF MEMBERS2
1.4M 2M STUFF MONTHLY
AUDIENCE3
Subscriptions, commissions and
lead generation
Retail commissions,
offers, coupons,
vouchers
Premium display
advertising through
audience targeting
and data products
Display
advertising,
basic content
marketing
UTILITIES FINANCIAL
SERVICES
SUBSCRIPTIONS
HEALTH
INSURANCE
AUDIENCE
AND CONTENT
PARTNERSHIPS
NATIVE
ADVERTISING,
ANALYTICS AND
INSIGHTS
NZ’S NO. 1
LOCAL SOCIAL
NETWORKING
PLATFORM
NZ’S NO. 1
LOCAL DIGITAL
PLATFORM
NZ’S NO. 1 LOCAL
DIGITAL PLATFORM
PREMIUM INDUSTRY
PROGRAMMATIC
EXCHANGE
THIRD-PARTY
CONTENT
SYNDICATION
PRINT PRODUCTS
RETAIL AND
TRANSACTIONS
NEW-RELEASE
MOVIE STREAMING
CLASSIFIEDS
Build premium products and new
businesses
Transact directly
with members
and partners
Convert, engage
and strengthen
loyalty
Attract, develop
and retain
audience
PREMIUM
PAYERS
E-COMMERCE
AND
TRANSACTIONS
TARGETED
AND SPECIALIST
AUDIENCE
MASS AUDIENCE
Notes: 1. FY14 H1 (excludes disposals) to FY18 H1; 2. Neighbourly members as at 1 March 2018, Stuff members as at 1 April 2018; 3. Nielsen
CMI fused January 2014 to January 2018.
EVENTS
& TRAVEL
For
per
sona
l use
onl
y

14
For
per
sona
l use
onl
y

15
GROWING
~930K STAN ACTIVE SUBSCRIBERS1
BUILDING VALUE
$120M+ VALUE CREATION FROM
MACQUARIE MEDIA MERGER3
TRANSFORMING
16.4% 23.7% MARGIN IMPROVEMENT FROM
MACQUARIE MEDIA MERGER2
Notes: 1. Stan active subscribers as at February 2018; 2. Pre-merger Fairfax Radio Network EBITDA margin in FY15 H1 compared with post-merger Macquarie Media EBITDA margin in FY18 H1; 3. Market value of FXJ 54.5% stake in Macquarie Media plus cash proceeds from 96fm sale versus analyst consensus estimates of Fairfax Radio Network value (pre-merger).
For
per
sona
l use
onl
y

16
~930K ACTIVE
SUBSCRIBERS
40 FIRST-RUN
EXCLUSIVE SHOWS
75% RETENTION FROM
TRIAL TO PAID SUBSCRIPTIONS
#1 LEADING LOCAL SVOD SERVICE
AWARD-WINNING
STAN ORIGINALS
1 3 PRICING TIER
EXTENSION DELIVERING ARPU GROWTH
LEADING
AUSTRALIAN
STREAMING BRAND
DOMINANT LOCAL
STREAMING
PLATFORM
ACTIVE
SUBSCRIBERS
EXCLUSIVE
AUSTRALIAN
OUTPUT DEAL
BEST OF GLOBAL
STUDIOS AND
NETWORKS
ORIGINAL
PROGRAMMING
STRATEGICALLY
ALIGNED
SHAREHOLDERS
DELIVER WORLD-CLASS DIFFERENTIATED CONTENT PROPOSITION
INVEST IN AUSTRALIAN/LOCAL PRODUCTIONS
LEVERAGE MASS MARKET CONSUMER MARKETING REACH OF FAIRFAX AND NINE
CONTINUE THE GROWTH TRAJECTORY AND FURTHER EXTEND POSITION AS DOMINANT LOCAL STREAMING PLATFORM
STRATEGICALLY ALIGN WITH GLOBAL STUDIOS AND NETWORKS IN A CHANGING LANDSCAPE
PE
RF
OR
MA
NC
E
SUBSCRIPTIONS
($10 BASIC, $12 STANDARD, $15 PREMIUM)
ST
RA
TE
GIC
DR
IVE
RS
B
US
INE
SS
ES
A
SS
ET
S
For
per
sona
l use
onl
y
17
#1 STATIONS IN SYDNEY
AND MELBOURNE1
$120M+ VALUE CREATION FROM
MACQUARIE MEDIA MERGER4
+93% EBITDA
GROWTH2
1.8M NETWORK AUDIENCE1
16.4% 23.7% MARGIN
EXPANSION3
LEVERAGE HIGH-PROFILE TALENT,
QUALITY PROGRAMMING AND CONTENT TO DRIVE NEWS/TALK NETWORK
LEVERAGE HIGH-PROFILE TALENT,
QUALITY PROGRAMMING AND CONTENT TO DRIVE SPORTS NETWORK
USE CROSS-PROMOTION TO BUILD NETWORK AUDIENCE STRENGTH
MONETISE NETWORK AUDIENCE STRENGTH WITH NEW ADVERTISING REVENUE
CONTINUE TO DRIVE OPERATIONAL EFFICIENCIES ACROSS THE NETWORK
PE
RF
OR
MA
NC
E
ST
RA
TE
GIC
DR
IVE
RS
B
US
INE
SS
ES
A
SS
ET
S
RADIO BROADCAST
LICENCES
QUALITY PROGRAMMING
& CONTENT
LOYAL AND VALUABLE
AUDIENCES
HIGH-PROFILE
TALENT
STRONG ADVERTISER
RELATIONSHIPS
NEWS/TALK NETWORK MACQUARIE SPORTS RADIO
ICONIC
BRANDS
Notes: 1. GfK Radio Ratings, SMBAP Survey 2 2018, Mon-Sun 5.30am to 12MN, Cume (000s) AP10+, MML-2GB, 3AW, 4BC, FIVEaa, 6PR, Talking
Lifestyle, Sydney, Melbourne and Brisbane; 2. FY15 H1 pro forma Macquarie Media EBITDA to FY18 H1 Macquarie Media EBITDA; 3. FY15 H1 Fairfax
Radio Network EBITDA margin versus FY18 H1 Macquarie Media EBITDA margin; 4. Market value of FXJ 54.5% stake in Macquarie Media plus cash
proceeds from 96fm sale versus analyst consensus estimates of Fairfax Radio Network value (pre-merger).
For
per
sona
l use
onl
y

18
For
per
sona
l use
onl
y

19
$920M NET DEBT
REDUCTION2
+$1.6BN FXJ SHAREHOLDER
VALUE CREATION3
T R A NSFO R MI NG B UI L DI N G VA L U E G RO W I N G
23% 39% DIGITAL AND OTHER
NON-PRINT REVENUE
AS % OF TOTAL1
Notes: 1. FY14 H1 (excludes disposals) to FY18 H1; 2. Change in Fairfax wholly-owned net debt between June 2012 and December 2017; 3. Includes increase in FXJ market capitalisation from 2012 to 2018, value distributed to FXJ shareholders through Domain separation, and on-market share buybacks.
For
per
sona
l use
onl
y

20
For
per
sona
l use
onl
y

21
• Trading in the first 17 weeks of FY18 H2 (25 December 2017 to 22 April 2018) saw overall Group revenues
around 1% below last year.
• Revenue across our reporting segments:
− Domain’s digital revenue growth is 21% and total revenue growth is 13%;
− Australian Metro Media is down around 2%;
− Australian Community Media is down around 9%;
− Stuff (New Zealand Media) is down around 8% including currency impact;
− Macquarie Media is up around 4% (up 6% excluding disposals).
• Across the Fairfax Group, we continue to implement cost savings measures.
For
per
sona
l use
onl
y

22
For
per
sona
l use
onl
y

23
For
per
sona
l use
onl
y

24
SUMMARY INFORMATION
This presentation contains summary information about Fairfax Media Limited and its activities current as at 2 May 2018. The information in this presentation is of a general background nature
and does not purport to be complete. It should be read in conjunction with Fairfax Media Limited other periodic and continuous disclosure announcements which are available
at www.fairfaxmedia.com.au.
NOT FINANCIAL PRODUCT ADVICE
This presentation is for information purposes only and is not financial product or investment advice or a recommendation to acquire Fairfax Media Limited securities and has
been prepared without taking into account the objectives, financial situation or needs of individuals. Before making an investment decision, prospective investors should consider
the appropriateness of the information having regard to their own objectives, financial situation and needs and seek legal and taxation advice appropriate to their jurisdiction.
Statements made in this presentation are made as at the date of the presentation unless otherwise stated.
PAST PERFORMANCE
Past performance information given in this presentation is given for illustrative purposes only and should not be relied upon as (and is not) an indication of future performance.
FUTURE PERFORMANCE
This presentation contains certain “forward-looking statements”. The words “expect”, “should”, “could”, “may”, “predict”, “plan” and other similar expressions are intended to identify
forward- looking statements. Indications of, and guidance on, future earnings and financial position and performance are also forward-looking statements.
Forward-looking statements, opinions and estimates provided in this presentation are based on assumptions and contingencies which are subject to change without notice,
as are statements about market and industry trends, which are based on interpretations of current market conditions. Forward-looking statements including projections, guidance
on future earnings and estimates are provided as a general guide only and should not be relied upon as an indication or guarantee of future performance. Actual results, performance
or achievements may vary materially for many projections because events and actual circumstances frequently do not occur as forecast and these differences can be material.
This presentation contains such statements that are subject to risk factors associated with the industries in which Fairfax Media Limited operates which may materially impact on
future performance. Investors should form their own views as to these matters and any assumptions on which any forward-looking statements are based. Fairfax Media Limited
assumes no obligation to update or revise such information to reflect any change in expectations or assumptions. The inclusion of forward-looking statements in this presentation
should not be regarded as a representation, warranty of guarantee with respect to its accuracy or the accuracy of the underlying assumptions or that Fairfax Media Limited will achieve,
or is likely to achieve, any particular results.
For
per
sona
l use
onl
y