Embed Size (px)
Citation preview
Macquarie Centre Redevelopment Stage 1 Concept DA
Economic Impact Assessment
December 2015
MacroPlan Dimasi
MELBOURNE
Level 4
356 Collins Street
Melbourne VIC 3000
(03) 9600 0500
SYDNEY
Level 6
39 Martin Place
Sydney NSW 2000
(02) 9221 5211
BRISBANE
Level 15
111 Eagle Street
Brisbane QLD 4000
(07) 3221 8166
GOLD COAST
Level 2
89 -91 Surf Parade
Broadbeach QLD 4218
(07) 3221 8166
ADELAIDE
Ground Floor
89 King William Street
Adelaide SA 5000
(08) 8221 6332
PERTH
Level 1
89 St Georges Terrace
Perth WA 6000
(08) 9225 7200
Prepared for: AMP Capital
MacroPlan Dimasi staff responsible for this report:
Tony Dimasi, Managing Director - Retail
James Turnbull, Senior Manager - Retail
Meagan Ellis, Manager - GIS
Table of contents
Executive summary i
Introduction vi
Section 1: Site and centre context and proposed development 1
1.1 Local and regional context 1
1.2 Proposed redevelopment 5
Section 2: Trade area analysis 7
2.1 Trade area definition 7
2.2 Trade area population 13
2.3 Socio-demographic profile 18
2.4 Retail expenditure 19
Section 3: Worker and student markets 24
3.1 Worker customer segment 24
3.2 Student customer segment 29
3.3 Macquarie Transport Interchange: Train and bus passengers 30
Section 4: Competition 32
4.1 Regional centres 32
4.2 Sub-regional centres 35
4.3 Proposed centres/developments 37
Section 5: Retail demand & estimated sales potential 38
5.1 Retail floorspace demand 38
5.2 Estimated sales potential 40
Section 6: Retail hierarchy impacts 42
6.1 Purpose of assessing impacts 42
6.2 Impacts methodology 43
6.3 Consideration of trading impacts 46
Section 7: Other economic and community impacts 49
7.1 Estimated employment potential 49
7.2 Residential component 50
7.3 Commercial component 51
7.4 Net community benefit 52

Macquarie Centre Redevelopment Stage 1 Concept DA
Economic Impact Assessment i
Executive summary
This report has been prepared on behalf of AMP Capital (AMPC) in support of a Stage 1
Development Application (DA) for the mixed use redevelopment of Macquarie Shopping
Centre (Macquarie Centre). This report supports the proposed future redevelopment of the
Macquarie Centre in relation to economic impacts. The key findings of this report are
summarised as follows:
Existing centre and proposed development
Macquarie Centre is a regional shopping centre which contains 130,600 sq.m of total
gross leasable area (GLA) (170,850 sq.m GFA), provided over seven levels, of which
108,312 sq.m is occupied retail GLA.
The centre contains a solid provision of mini-major tenants, with 13 tenants totalling
14,008 sq.m, including the likes of H&M, Zara, Rebel Sport, Sephora, Uniqlo, JB Hi-Fi, and
Forever 21, as well as 285 occupied specialty retail tenancies, totalling 30,826 sq.m.
In addition to the occupied retail floorspace, Macquarie Centre contains three large
entertainment tenancies, a large Fitness First gym, a kids’ playground/café, massage
tenancies, travel agencies, medical centres, a dental practice and a few external tenancies
including Kmart Tyre and Auto and Star Car Wash.
The proposed expansion will consist of an additional 29,516 sq.m of retail GLA on
Herring Road and 10,207 sq.m of additional retail GLA in the Galleria precinct. In total,
39,723 sq.m of additional retail GLA is planned at Macquarie Centre as part of the
proposed expansion – which would result in a total retail GLA of 148,025 sq.m.
A further 85,315 sq.m of residential net saleable area (NSA) and commercial net lettable
area (NLA) is planned in the form of four towers above the centre. Two options are being
proposed by AMP Capital, with the larger option (totalling 85,315 sq.m) consisting of one
44,252 sq.m commercial office tower supported by three residential towers of
41,063 sq.m.

Executive summary
Macquarie Centre Redevelopment Stage 1 Concept DA
Economic Impact Assessment ii
Residential trade area
Macquarie Centre serves a broad regionally oriented trade area consisting of a primary
sector, five secondary sectors and five tertiary sectors. The current total trade area
population is estimated at 705,500 persons, including 309,000 in the main trade area and
79,500 in the key primary sector.
The total trade area population is estimated to increase by around 24% or
167,000 persons by 2031, reaching 872,500 persons, reflecting average annual growth of
1.3%.
The main trade area population is estimated to grow at an average annual rate of 1.2% to
reach 372,700 by 2031, an increase of 21%, while the primary sector population is
estimated to grow at 1.2% per annum to reach 95,500 by 2031, equivalent to an increase
of 20% from current levels.
The total trade area retail expenditure market is estimated to grow by around 47% to
2031 from $11.02 billion to $16.21 billion (in constant $2014/15) at an average annual
growth rate of 2.4%.
The total retail expenditure capacity of main trade area residents is expected to grow at
3.2% per annum, from $4.70 billion at 2015 to $6.7 billion by 2031.
Worker customer segment
Macquarie Centre is situated within the Macquarie Business Park and serves a
surrounding the worker trade area population of approximately 45,900 workers, including
18,600 in the primary sector (i.e. within walking distance).
This worker population is expected to increase by around 700 - 800 jobs per annum,
resulting in a worker population of 57,800 by 2031. This accounts for the proposed
expansion at Macquarie Centre and additional office/commercial development within the
Macquarie Business Park.
Executive summary
Macquarie Centre Redevelopment Stage 1 Concept DA
Economic Impact Assessment iii
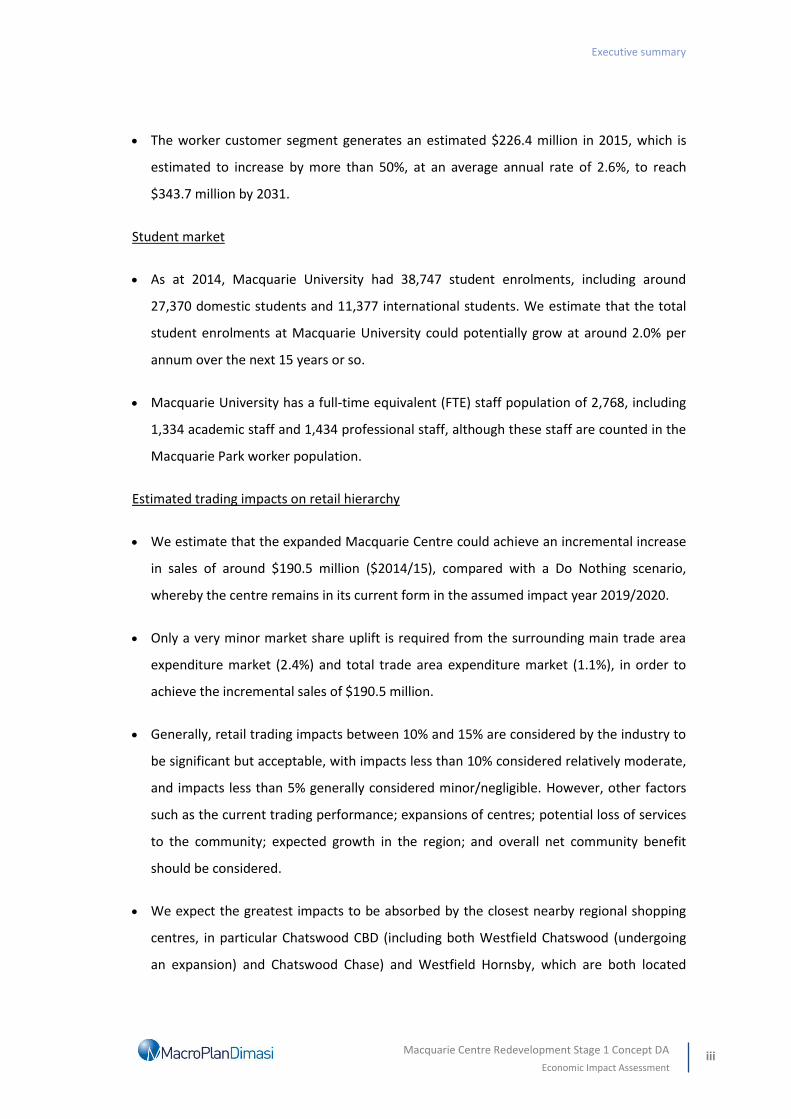
The worker customer segment generates an estimated $226.4 million in 2015, which is
estimated to increase by more than 50%, at an average annual rate of 2.6%, to reach
$343.7 million by 2031.
Student market
As at 2014, Macquarie University had 38,747 student enrolments, including around
27,370 domestic students and 11,377 international students. We estimate that the total
student enrolments at Macquarie University could potentially grow at around 2.0% per
annum over the next 15 years or so.
Macquarie University has a full-time equivalent (FTE) staff population of 2,768, including
1,334 academic staff and 1,434 professional staff, although these staff are counted in the
Macquarie Park worker population.
Estimated trading impacts on retail hierarchy
We estimate that the expanded Macquarie Centre could achieve an incremental increase
in sales of around $190.5 million ($2014/15), compared with a Do Nothing scenario,
whereby the centre remains in its current form in the assumed impact year 2019/2020.
Only a very minor market share uplift is required from the surrounding main trade area
expenditure market (2.4%) and total trade area expenditure market (1.1%), in order to
achieve the incremental sales of $190.5 million.
Generally, retail trading impacts between 10% and 15% are considered by the industry to
be significant but acceptable, with impacts less than 10% considered relatively moderate,
and impacts less than 5% generally considered minor/negligible. However, other factors
such as the current trading performance; expansions of centres; potential loss of services
to the community; expected growth in the region; and overall net community benefit
should be considered.
We expect the greatest impacts to be absorbed by the closest nearby regional shopping
centres, in particular Chatswood CBD (including both Westfield Chatswood (undergoing
an expansion) and Chatswood Chase) and Westfield Hornsby, which are both located

Executive summary
Macquarie Centre Redevelopment Stage 1 Concept DA
Economic Impact Assessment iv
within the defined Macquarie Centre trade area, as well as Castle Towers and Westfield
Parramatta. The latter two centres about to undergo major expansions over the short-
medium term.
We estimate impacts resulting from the proposed expansion to be less than 6% on any
individual centre, with impacts on the four identified regional centres in the network
ranging between 2% and 5%. Indeed, because both Westfield Parramatta and Castle
Towers are both planned to expand in the future, their trading levels are likely to be
significantly greater than their current trading volumes. Estimated impacts on the
Chatswood CBD and Westfield Hornsby are expected to be comfortably absorbed.
Estimated impacts on the surrounding sub-regional centres are all estimated to be less
than 5%, given the expected composition of the proposed expansion, given Macquarie
Centre already contains all three major supermarkets, and the different role these
centres play in the retail hierarchy (i.e. localised/sub-regional catchments with strong
convenience focus).
In summary, the proposed expansion of Macquarie Centre represents a relatively minor
addition to the retail network, especially in the context of some of the other major
proposed expansions (e.g. Castle Hill and Westfield Parramatta) evidenced by the very
minor impacts expected across the network.
Impacts of the order estimated are highly unlikely to result in any detrimental impacts on
the surrounding retail/centres hierarchy across northern and western Sydney.
Other economic impacts and net community benefit
The proposed expansion of Macquarie Centre will result in additional on-going
employment on-site as well as further job creation through the supply chain, across
industries servicing the retail (and non-retail) tenants at the site such as transport
workers, wholesalers and the like.
Furthermore, the construction phase of the project will support temporary construction
related employment, and additional temporary jobs through the broader economic
supply chain (i.e. multiplier impacts).
Executive summary
Macquarie Centre Redevelopment Stage 1 Concept DA
Economic Impact Assessment v
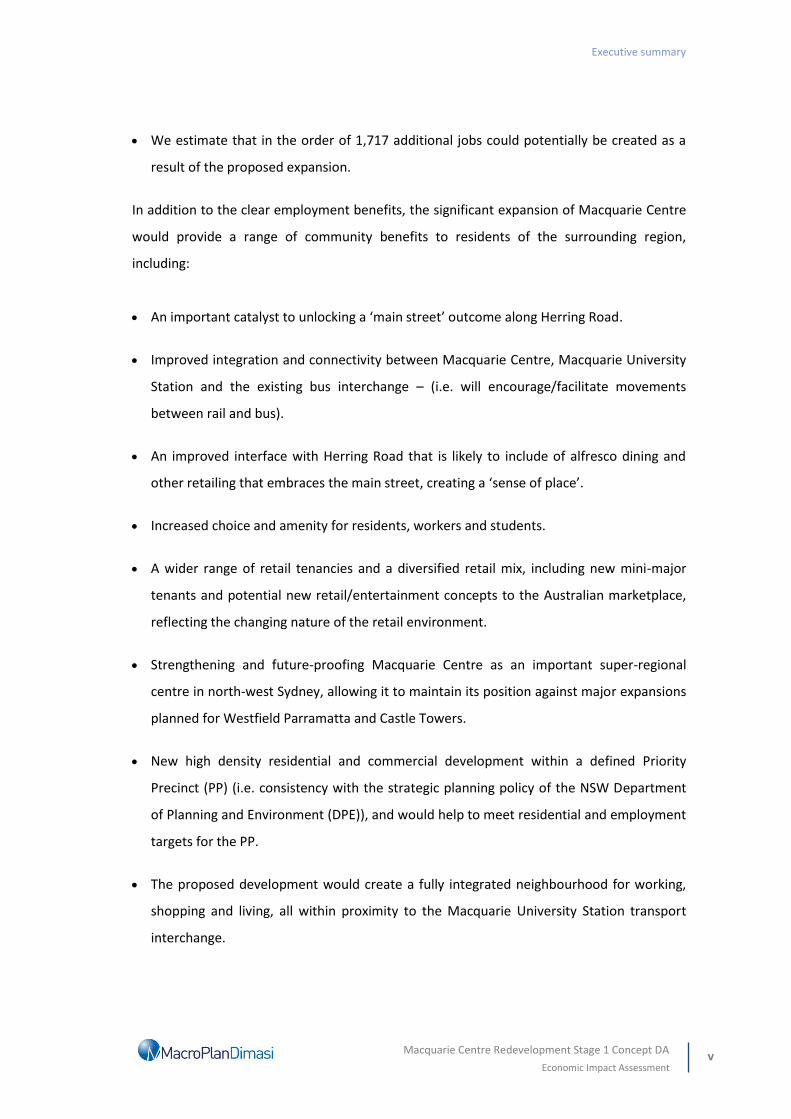
We estimate that in the order of 1,717 additional jobs could potentially be created as a
result of the proposed expansion.
In addition to the clear employment benefits, the significant expansion of Macquarie Centre
would provide a range of community benefits to residents of the surrounding region,
including:
An important catalyst to unlocking a ‘main street’ outcome along Herring Road.
Improved integration and connectivity between Macquarie Centre, Macquarie University
Station and the existing bus interchange – (i.e. will encourage/facilitate movements
between rail and bus).
An improved interface with Herring Road that is likely to include of alfresco dining and
other retailing that embraces the main street, creating a ‘sense of place’.
Increased choice and amenity for residents, workers and students.
A wider range of retail tenancies and a diversified retail mix, including new mini-major
tenants and potential new retail/entertainment concepts to the Australian marketplace,
reflecting the changing nature of the retail environment.
Strengthening and future-proofing Macquarie Centre as an important super-regional
centre in north-west Sydney, allowing it to maintain its position against major expansions
planned for Westfield Parramatta and Castle Towers.
New high density residential and commercial development within a defined Priority
Precinct (PP) (i.e. consistency with the strategic planning policy of the NSW Department
of Planning and Environment (DPE)), and would help to meet residential and employment
targets for the PP.
The proposed development would create a fully integrated neighbourhood for working,
shopping and living, all within proximity to the Macquarie University Station transport
interchange.
Macquarie Centre Redevelopment Stage 1 Concept DA
Economic Impact Assessment vi
Introduction
This report has been prepared on behalf of AMP Capital (AMPC) in support of a Stage 1
Development Application (DA) for the mixed use redevelopment of Macquarie Shopping
Centre (Macquarie Centre). The Stages 1 DA seeks concept approval for the redevelopment
of Macquarie Centre by establishing:
Building envelopes and design parameters for future development on the site, including
the proposed uses within the podium and tower components.
The distribution of floor space across the site.
Future pedestrian and vehicle connections to and within the site.
This report supports the proposed future redevelopment of the Macquarie Centre in relation
to economic impacts. More specifically, this report presents an independent assessment of
the need and demand for a proposed expansion of Macquarie Centre, located in Ryde Local
Government Area (LGA), as well as analysing the likely consequent impacts on other relevant
activity centres throughout the surrounding region.
The report has been prepared in accordance with instructions from AMP Capital, and is
structured as follows:
Section 1 reviews the local and regional context of the centre; and provides an overview
of the existing centre and proposed expansion of the centre.
Section 2 examines the trade area served by Macquarie Centre; provides estimates of
current and anticipated population levels within the trade area; analyses the socio-
demographic profile of the trade area population; and assesses the current and future
estimated retail expenditure volumes generated by trade area residents.
Section 3 examines the other key customer segments served by Macquarie Centre,
including the surrounding worker market and nearby student market.

Introduction
Macquarie Centre Redevelopment Stage 1 Concept DA
Economic Impact Assessment vii
Section 4 reviews the competitive context within which Macquarie Centre operates, now
and in the future, including all proposed competitive developments.
Section 5 provides an assessment of the retail floorspace demand generated by the
population of the trade area. This section also examines the likely sales potential of the
proposed expansion, examining the incremental sales of the proposed expansion, by
comparing the sales of the proposed expansion scenario with a “Do Nothing” scenario.
Section 6 presents our estimates of likely trading impacts on the surrounding retail
network and then discusses the implications of these impacts.
Section 7 examines the net community benefits associated with the proposed expansion,
including employment generation and other economic and social benefits, as well as
examining the impacts of the proposed residential/commercial towers.
Macquarie Centre Redevelopment Stage 1 Concept DA
Economic Impact Assessment 1
Section 1: Site and centre context and proposed development
1.1 Local and regional context
Macquarie Centre is approximately 11.25 hectares in area and is located at the corner of
Waterloo Road, Herring Road and Talavera Road, Macquarie Park, in the Ryde Local
Government Area (LGA), approximately 15 km north-west of the Sydney Central Business
District (CBD) (Refer Map 1.1). The site is legally described as Lot 100 in DP 1190494.
Macquarie Centre is a key component of the Macquarie University Station Priority Precinct,
which has been designated as such by the NSW Department of Planning and Environment
(DPE) due to its location around the rail station and Macquarie Park’s role as a major
commercial/business park, shopping destination and tertiary education infrastructure.
The intent for the Macquarie University Station Priority Precinct is to accommodate up to
5,800 new homes by 2031, as well as increased employment and retail infrastructure.
Macquarie Centre is bounded by Herring Road, Waterloo Road and Talavera Road with
access provided to the centre from all of these roads. Located within the Macquarie Park
Corridor, the site has excellent access to public transport, situated immediately adjacent the
Macquarie University Railway Station and the Herring Road Bus Station. Located between
the M2 Hills Motorway and Epping Road, the site also enjoys excellent vehicle connectivity.
The centre is located adjacent to the Macquarie University campus, which supports almost
40,000 students and more than 2,800 staff (Refer Map 1.2).
The Macquarie Business Park contains around 850,000 sq.m of commercial office space and
employs more than 43,000 workers, with additional capacity for greater floorspace.
Section 1: Site and centre context and proposed development
Macquarie Centre Redevelopment Stage 1 Concept DA
Economic Impact Assessment 2
The centre is easily accessible via the M2 Motorway, Epping Road and Lane Cove Road, all of
which are major transport thoroughfares throughout the area. Furthermore, the subject site
is highly accessible via public transport – it is effectively integrated with the Macquarie
University Railway Station and contains the Macquarie Centre bus interchange.
The owners of Macquarie Centre, AMP Capital plan a major redevelopment of the centre
including improved linkages with the existing transport interchange that would maximise the
benefit to transport users, provide an enhanced accessibility between the bus station and
train station, and additional retail, residential and commercial floorspace.
The proposed expansion is consistent with the vision of the NSW DPE and Ryde City Council
for upgrading Herring Road as a key main street through the Macquarie University Station
Priority Precinct. AMP Capital plans to provide active frontages to the Herring Road main
street, with alfresco dining and entertainment type tenancies.

Map 1.1: Macquarie Centre
Regional context
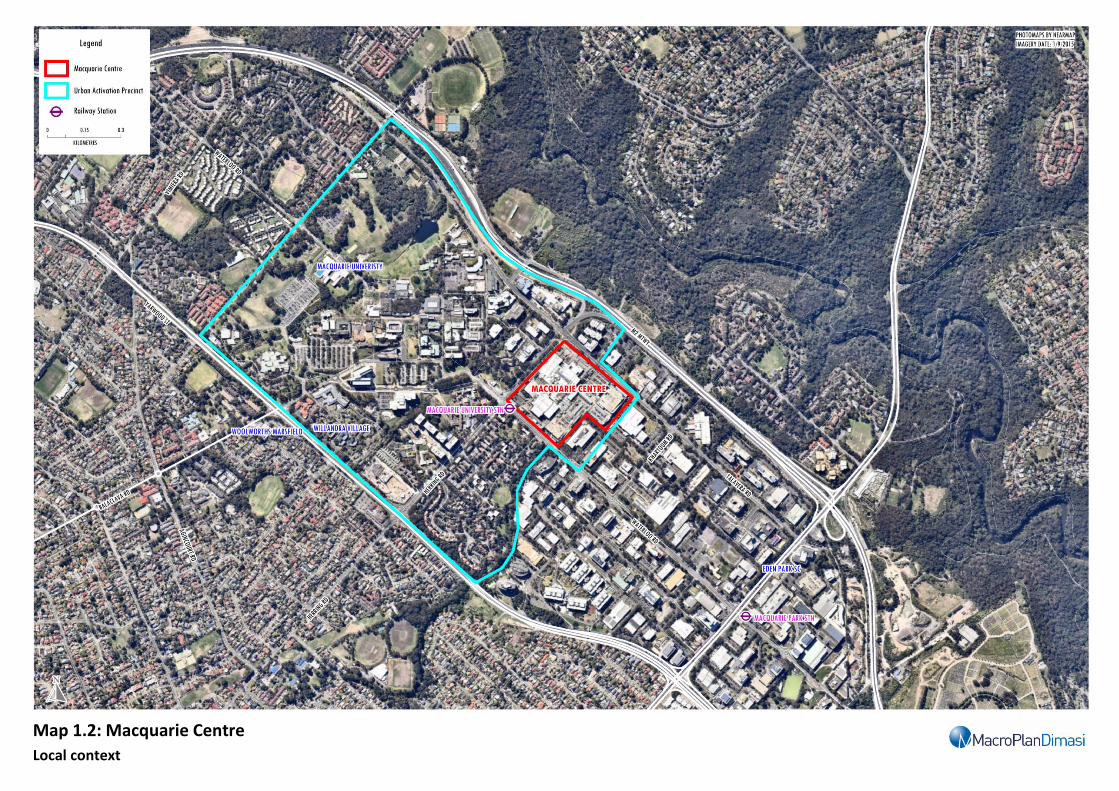
Map 1.2: Macquarie Centre
Local context

Section 1: Site and centre context and proposed development
Macquarie Centre
Economic Impact Assessment 5
1.2 Proposed redevelopment
Macquarie Centre was originally constructed in 1981. The centre has undergone various
stages of redevelopment and extensions. A major refurbishment occurred in 2000, 2003 and
most recently in 2014, creating a fresh food court, David Jones expansion, addition of second
full line supermarket (Coles), a value supermarket (Aldi), with new speciality food and
convenience stores. Today Macquarie Centre is the largest shopping centre in NSW and the
8th largest shopping centre in Australia and includes a wide range of retail, entertainment
and service offerings.
Macquarie Centre is a regional shopping centre which contains 136,300 sq.m of total gross
leasable area (GLA), provided over seven levels, of which 108,312 sq.m is occupied retail
GLA. The centre contains David Jones and Myer department stores; Big W and Kmart
discount department stores; and Coles, Woolworths and Aldi supermarkets; with major
tenant floorspace totalling 63,478 sq.m.
The centre contains a solid provision of mini-major tenants, with 13 tenants totalling
14,008 sq.m, including the likes of H&M, Zara, Rebel Sport, Uniqlo, Sephora, JB Hi-Fi, and
Forever 21, as well as 285 occupied specialty retail tenancies, totalling 30,826 sq.m.
In addition to the occupied retail floorspace, Macquarie Centre contains three large
entertainment tenancies - an 8,183 sq.m Event Cinema complex, the 3,716 sq.m
Macquarie Ice Rink and a 1,590 sq.m Strike Bowling facility. The centre also contains a large
Fitness First gym, a kids’ playground/café, massage tenancies, travel agencies, a dental
practice and a few external tenancies including Kmart Tyre and Auto and Star Car Wash.
Table 1.1 shows that the proposed expansion (Stage 1 DA) will consist of an additional
29,516 sq.m of retail GLA on Herring Road, contributing to the town centre main street; and
10,207 sq.m of additional retail GLA in the Galleria. In total, 39,723 sq.m of additional retail
GLA is planned at Macquarie Centre as part of the proposed expansion. We have assumed
that around 30,000 sq.m of the proposed 39,723 sq.m of GLA would be allocated to typical
‘retail’ uses like fashion/non-food mini-majors and specialty retail including additional dining.

Section 1: Site and centre context and proposed development
Macquarie Centre Redevelopment Stage 1 Concept DA
Economic Impact Assessment 6
The remaining 9,723 sq.m attributed to non-retail type uses such as bowling, gyms, gaming
areas, child care, kids entertainment etc.
A further 85,315 sq.m of residential net saleable area (NSA) and commercial net lettable area
(NLA) is planned in the form of four towers above the centre. Two options are being
proposed by AMP Capital, with the larger option (totalling 85,315 sq.m) consisting of one
44,252 sq.m commercial office tower supported by three residential towers of 41,063 sq.m.
Alternatively, a slightly smaller scheme with 61,361 sq.m of residential NSA is proposed, with
no commercial tower, i.e. all four towers would be residential oriented.
Additional - Stage 1 DA**
Category GLA
(sq.m) (% of retail) (sq.m) (sq.m) (% of retail)
Retail
Major tenants 63,478 58.6% 63,478 42.9%
Mini-majors 14,008 12.9% 14,008 9.5%
Retail specialties 30,826 28.5% 30,826 20.8%
Total centre - retail 108,312 100.0% 39,723 148,035 100.0%
Non-retail
Non-retail GLA 27,988 27,988
Residential 0 41,063 41,063
Commercial/office 0 44,252 44,252
Total non-retail 27,988 85,315 113,303
Total centre 136,300 125,038 261,338
*As at September 2015
**As per the proposed development Option 1 - with 3 x residential towers and 1 x commercial tower
Source: AMP; MacroPlan Dimasi
Table 1.1
Macquarie Centre - Centre composition*
Current Post Expansion
GLA GLA
Macquarie Centre Redevelopment Stage 1 Concept DA
Economic Impact Assessment 7
Section 2: Trade area analysis
This section of the report examines the trade area served by Macquarie Centre; provides
estimates of current and anticipated population levels within the trade area; analyses the
socio-demographic profile of the trade area population; and assesses the current and future
estimated retail expenditure volumes generated by trade area residents.
2.1 Trade area definition
The extent of the trade area or catchment for any shopping centre is shaped by a number of
critical factors, described as follows:
The relative attraction of the centre, in comparison with alternative competitive retail
facilities. The factors that determine the strength and attraction of any particular centre
are primarily its scale and composition (in particular the major trader or traders that
anchor the centre); its layout and ambience; and carparking, including access and ease of
use.
The proximity and attractiveness of competitive retail centres. The locations,
compositions quality and scale of competitive retail facilities all serve to define the extent
of the trade area which a shopping centre is able effectively to serve.
The available road network and public transport infrastructure, which determine the ease
(or difficulty) with which customers are able to access a shopping centre.
Significant physical barriers which are difficult to negotiate, and can act as delineating
boundaries to the trade area served by an individual shopping centre.
Section 2: Trade area analysis
Macquarie Centre Redevelopment Stage 1 Concept DA
Economic Impact Assessment 8
The trade area has been defined having regard to all of the above, in particular the following
key determinants:
The location of major existing and proposed competitive retail facilities within the region,
including regional shopping centres and large sub-regional shopping centres.
Accessibility to the centre, which, as discussed in Section 1 of this report, is very good
from both a local and regional perspective given its proximity to the M2 and major roads
such as Lane Cove Road and Epping Road.
The current scale and composition of the centre, as a significant regional centre with
extensive provisions of major stores, a unique collection of mini-major retailers (some of
which have limited representation in Sydney), specialty shops, as well as cinemas and an
ice-skating rink.
The scale/mix of the proposed expansion, which will increase the retail GLA by around
40,000 sq.m.
This trade area is also based on information provided by Quantium. Quantium utilises
electronic transactions data from customers using NAB credit/debit cards over a 12 month
period, providing in-depth analysis of customer spending behaviours, both at the centre and
at competitive centres/precincts. The Quantium data offers a very robust basis for trade area
definition, reflecting the actual purchasing behaviour at the centre of many thousands of
customers, all of which can be analysed at a very granular level geographically (SA1s or
Statistical Area 1).
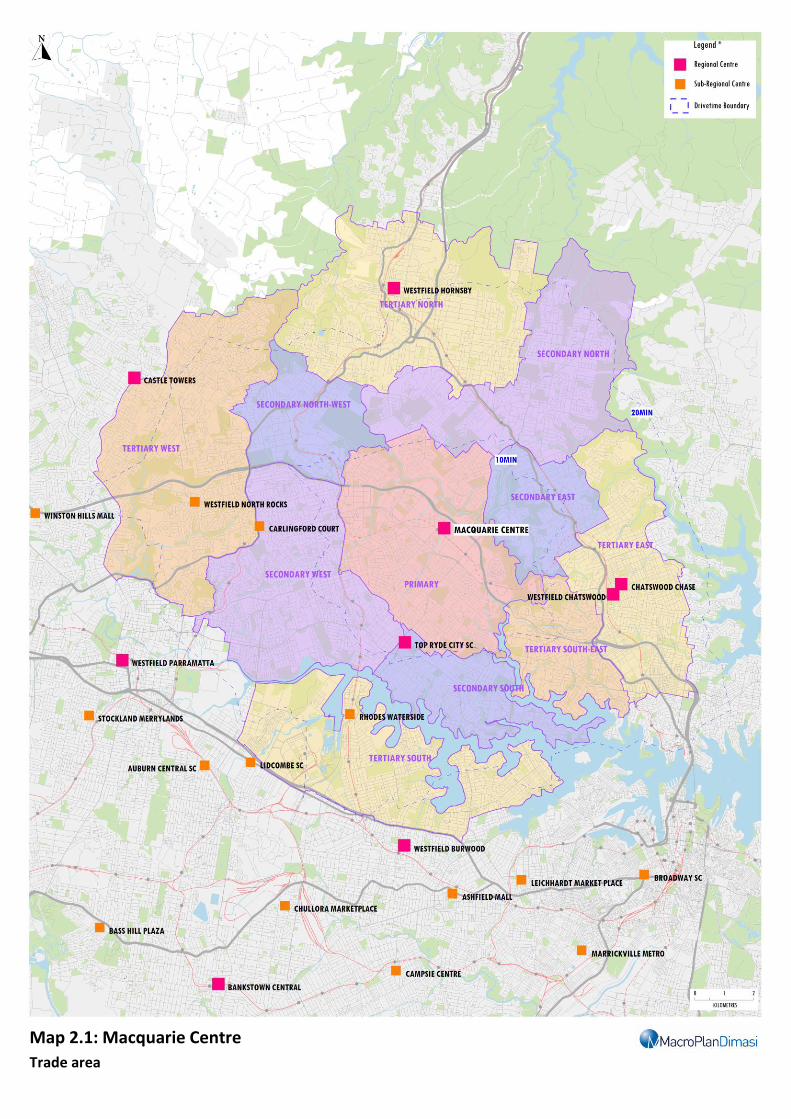
Having regard to all of the above, and as illustrated on Map 2.1, the trade area has been
defined to include one primary sector, five secondary sectors and five tertiary sectors,
described as follows (refer Map 2.1):
• The primary sector is generally bounded by Canoon Road and The Comenarra Parkway to
the north; the Lane Cove River and Lane Cove National Park to the east; Buffalo Creek to
the south; and the T1 Northern railway line to the west. Suburbs in this sector include
Section 2: Trade area analysis
Macquarie Centre Redevelopment Stage 1 Concept DA
Economic Impact Assessment 9
Macquarie Park, North Ryde, East Ryde, North Epping, West Pymble and parts of
Eastwood, Ryde and Epping.
• The secondary north sector extends around 8 km to the north-east of the primary sector
to Ku-ring-gai Chase National Park and incorporates the suburbs of St Ives, St Ives Chase
and Pymble, as well as parts of Gordon, Turramurra and Wahroonga.
• The secondary east sector extends around 4 km to the east of the primary sector and
encompasses the suburbs of Killara and Lindfield, as well as part of Gordon.
• The secondary south sector extends south to the Parramatta River and incorporates the
suburbs of Hunters Hill, Gladesville, Henley, Woolwich, Tennyson Point and Putney.
• The secondary west sector extends 4 – 5 km west of the primary sector and includes the
suburbs of Ermington, Dundas, Telopea, Melrose Park, Meadowbank and parts of Ryde,
Denistone East, Eastwood and Epping. The sector is bound to the north by the Hills
Motorway (M2) and Pennant Hills Road and to the south by the Parramatta River.
• The secondary north-west sector extends north to the Berowra Valley National Park and
west to Pennant Hills Road and Castle Hill Road. The sector incorporates the suburbs of
Pennant Hills and Cheltenham, as well as parts of Beecroft and West Pennant Hills.
The primary and secondary sectors in combination make up the centre’s main trade area.
In addition to the main trade area, Macquarie Centre also serves five tertiary sectors, as
follows:
The tertiary north sector extends 5 – 6 km north to encompass the suburbs of Hornsby,
Asquith, Westleigh, Thornleigh, North Wahroonga, Normanhurst and North Turramurra,
as well as parts of Wahroonga, Warrawee and Turramurra.
The tertiary east sector includes the suburbs of Chatswood, East Killara, East Lindfield,
Roseville, North Willoughby, Willoughby East, Willoughby, Artarmon, Naremburn,
Crows Nest and St Leonards.
Section 2: Trade area analysis
Macquarie Centre Redevelopment Stage 1 Concept DA
Economic Impact Assessment 10
The tertiary south-east sector extends south to the Lane Cove River and incorporates the
suburbs of Chatswood West, Lane Cove, Lane Cove North, Lane Cove West, Riverview,
Longueville and Greenwich.
The tertiary west sector extends to Windsor Road and Old Northern Road, and includes
the suburbs of Cherrybrook, West Pennant Hills, North Rocks and Oatlands, as well as
parts of Castle Hill, North Parramatta and Baulkham Hills.
The combination of the main trade area and tertiary sectors is referred to as the total trade
area throughout the remainder of this report.
Macquarie Centre Redevelopment Stage 1 Concept DA
Economic Impact Assessment 11
Map 2.1: Macquarie Centre
Trade area

Macquarie Centre Redevelopment Stage 1 Concept DA
Economic Impact Assessment 12
Map 2.2: Macquarie Centre
Major residential projects
Section 2: Trade area analysis
Macquarie Centre Redevelopment Stage 1 Concept DA
Economic Impact Assessment 13
2.2 Trade area population
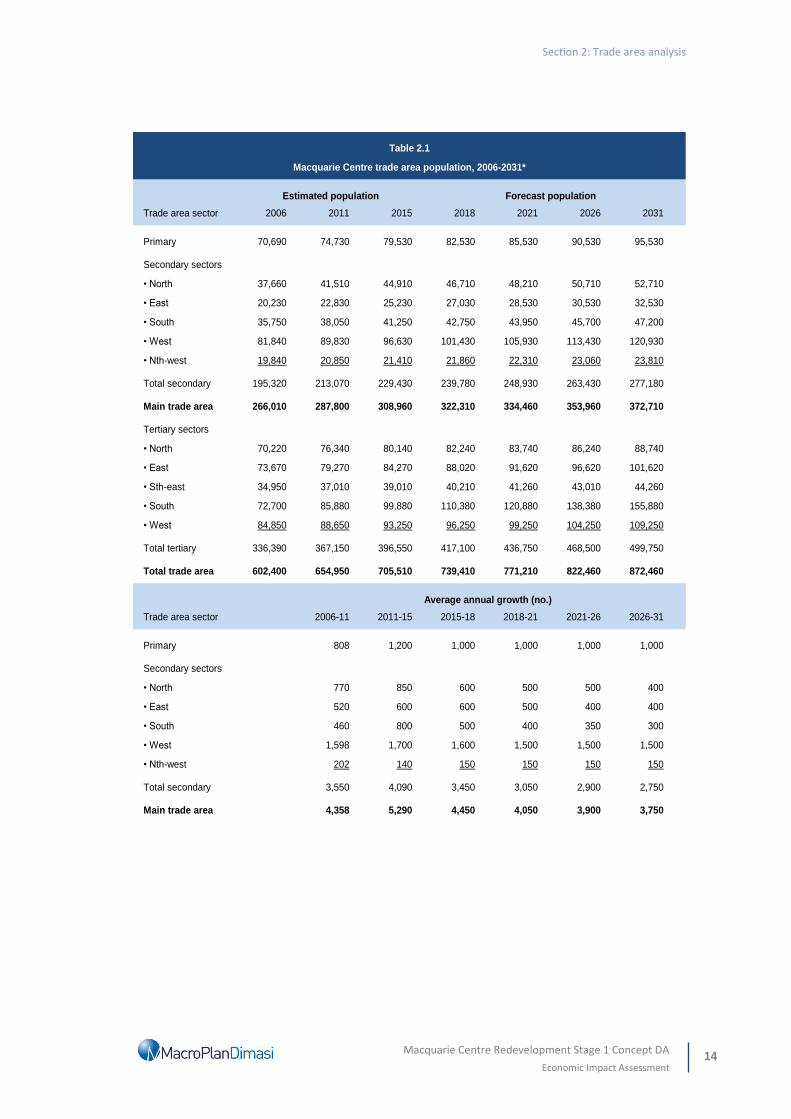
Table 2.1 details the current and projected population levels within the Macquarie Centre
trade area. This information has been collected from a range of sources, including the
following:
Australian Bureau of Statistics Census of Population and Housing (2006 and 2011);
Australian Bureau of Statistics Dwelling Approvals Data (2010–14);
Australian Bureau of Statistics Estimated Residential Population Data (ERP) (2011-2014);
Population projections prepared by the NSW DPE and NSW Bureau of Transport
Statistics (BTS);
North West Rail Link Corridor Strategy (March 2013); and
Other investigations of future residential development, undertaken by this office.
The current total trade area population is estimated at 705,500 persons, including 309,000 in
the main trade area and 79,500 in the key primary sector.
Over the most recent intercensal period (2006 to 2011), the total trade area population grew
by around 1.7% per annum, reflecting an average annual population increase of
approximately 10,500 persons.
More recently (i.e. 2011-2015), population growth averaged 1.9% per annum, or around
12,600 persons per annum, fuelled by significant urban renewal projects and a strong
housing market within the total trade area.
Section 2: Trade area analysis
Macquarie Centre Redevelopment Stage 1 Concept DA
Economic Impact Assessment 14
Trade area sector 2006 2011 2015 2018 2021 2026 2031
Primary 70,690 74,730 79,530 82,530 85,530 90,530 95,530
Secondary sectors
• North 37,660 41,510 44,910 46,710 48,210 50,710 52,710
• East 20,230 22,830 25,230 27,030 28,530 30,530 32,530
• South 35,750 38,050 41,250 42,750 43,950 45,700 47,200
• West 81,840 89,830 96,630 101,430 105,930 113,430 120,930
• Nth-west 19,840 20,850 21,410 21,860 22,310 23,060 23,810
Total secondary 195,320 213,070 229,430 239,780 248,930 263,430 277,180
Main trade area 266,010 287,800 308,960 322,310 334,460 353,960 372,710
Tertiary sectors
• North 70,220 76,340 80,140 82,240 83,740 86,240 88,740
• East 73,670 79,270 84,270 88,020 91,620 96,620 101,620
• Sth-east 34,950 37,010 39,010 40,210 41,260 43,010 44,260
• South 72,700 85,880 99,880 110,380 120,880 138,380 155,880
• West 84,850 88,650 93,250 96,250 99,250 104,250 109,250
Total tertiary 336,390 367,150 396,550 417,100 436,750 468,500 499,750
Total trade area 602,400 654,950 705,510 739,410 771,210 822,460 872,460
Trade area sector 2006-11 2011-15 2015-18 2018-21 2021-26 2026-31
Primary 808 1,200 1,000 1,000 1,000 1,000
Secondary sectors
• North 770 850 600 500 500 400
• East 520 600 600 500 400 400
• South 460 800 500 400 350 300
• West 1,598 1,700 1,600 1,500 1,500 1,500
• Nth-west 202 140 150 150 150 150
Total secondary 3,550 4,090 3,450 3,050 2,900 2,750
Main trade area 4,358 5,290 4,450 4,050 3,900 3,750
Table 2.1
Macquarie Centre trade area population, 2006-2031*
Estimated population Forecast population
Average annual growth (no.)
Section 2: Trade area analysis
Macquarie Centre Redevelopment Stage 1 Concept DA
Economic Impact Assessment 15
Tertiary sectors
• North 1,224 950 700 500 500 500
• East 1,120 1,250 1,250 1,200 1,000 1,000
• Sth-east 412 500 400 350 350 250
• South 2,636 3,500 3,500 3,500 3,500 3,500
• West 760 1,150 1,000 1,000 1,000 1,000
Total tertiary 6,152 7,350 6,850 6,550 6,350 6,250
Total trade area 10,510 12,640 11,300 10,600 10,250 10,000
Trade area sector 2006-11 2011-15 2015-18 2018-21 2021-26 2026-31
Primary 1.1% 1.6% 1.2% 1.2% 1.1% 1.1%
Secondary sectors
• North 2.0% 2.0% 1.3% 1.1% 1.0% 0.8%
• East 2.4% 2.5% 2.3% 1.8% 1.4% 1.3%
• South 1.3% 2.0% 1.2% 0.9% 0.8% 0.6%
• West 1.9% 1.8% 1.6% 1.5% 1.4% 1.3%
• Nth-west 1.0% 0.7% 0.7% 0.7% 0.7% 0.6%
Total secondary 1.8% 1.9% 1.5% 1.3% 1.1% 1.0%
Main trade area 1.6% 1.8% 1.4% 1.2% 1.1% 1.0%
Tertiary sectors
• North 1.7% 1.2% 0.9% 0.6% 0.6% 0.6%
• East 1.5% 1.5% 1.5% 1.3% 1.1% 1.0%
• Sth-east 1.2% 1.3% 1.0% 0.9% 0.8% 0.6%
• South 3.4% 3.8% 3.4% 3.1% 2.7% 2.4%
• West 0.9% 1.3% 1.1% 1.0% 1.0% 0.9%
Total tertiary 1.8% 1.9% 1.7% 1.5% 1.4% 1.3%
Total trade area 1.7% 1.9% 1.6% 1.4% 1.3% 1.2%
NSW average 1.1% 1.3% 1.3% 1.2% 1.1% 1.0%
*As at June
Source: ABS Census 2011; NSW Department of Planning and Environment 2014; MacroPlan Dimasi
Average annual growth (%)

Section 2: Trade area analysis
Macquarie Centre Redevelopment Stage 1 Concept DA
Economic Impact Assessment 16
Primary Main Syd Metro Aust.
Census item sector North East South West Nth-west TA avg. avg.
Per capita income $40,320 $52,720 $52,444 $47,054 $37,322 $47,731 $43,562 $37,441 $34,467
Var. from Syd Metro benchmark 7.7% 40.8% 40.1% 25.7% -0.3% 27.5% 16.3%
Avg. household income $109,163 $155,088 $149,320 $120,024 $101,859 $139,773 $119,762 $101,090 $88,205
Var. from Syd Metro benchmark 8.0% 53.4% 47.7% 18.7% 0.8% 38.3% 18.5%
Avg. household size 2.7 2.9 2.8 2.6 2.7 2.9 2.7 2.7 2.6
Age distribution (% of population)
Aged 0-14 17.3% 20.0% 20.3% 18.1% 17.8% 18.7% 18.3% 19.2% 19.3%
Aged 15-19 6.1% 7.9% 8.4% 6.4% 6.2% 7.8% 6.7% 6.3% 6.5%
Aged 20-29 16.4% 9.2% 10.4% 12.4% 14.8% 10.9% 13.5% 14.8% 13.8%
Aged 30-39 13.7% 9.1% 9.5% 14.3% 14.4% 10.4% 12.8% 15.3% 13.8%
Aged 40-49 14.3% 16.0% 16.1% 14.7% 14.9% 15.0% 15.0% 14.3% 14.2%
Aged 50-59 12.2% 14.3% 13.9% 12.0% 13.4% 14.4% 13.1% 12.2% 12.8%
Aged 60+ 20.1% 23.6% 21.5% 22.0% 18.6% 22.7% 20.7% 18.0% 19.6%
Average age 38.5 40.1 39.2 39.5 38.2 39.9 38.9 37.1 37.9
Housing status (% of households)
Owner (total) 68.9% 86.0% 79.1% 66.0% 67.0% 83.0% 72.2% 66.8% 68.7%
• Owner (outright) 36.7% 46.2% 45.5% 33.7% 33.1% 43.8% 37.8% 31.1% 32.9%
• Owner (with mortgage) 32.2% 39.8% 33.6% 32.4% 33.9% 39.2% 34.5% 35.7% 35.8%
Renter 30.0% 13.5% 20.0% 32.7% 32.3% 16.1% 26.9% 32.4% 30.4%
Other 1.1% 0.4% 0.9% 1.3% 0.8% 0.9% 0.9% 0.8% 0.9%
Birthplace (% of population)
Australian born 56.0% 60.6% 60.8% 66.8% 55.0% 68.9% 59.1% 63.6% 74.0%
Overseas born 44.0% 39.4% 39.2% 33.2% 45.0% 31.1% 40.9% 36.4% 26.0%
• Asia 28.1% 13.2% 21.3% 13.7% 31.1% 16.5% 23.6% 15.5% 8.6%
• Europe 8.3% 12.0% 9.2% 11.6% 6.5% 7.7% 8.7% 10.6% 10.5%
• Other 7.7% 14.2% 8.7% 7.9% 7.4% 6.8% 8.6% 10.3% 7.0%
Family type (% of households)
Couple with dep't children 50.4% 58.2% 57.5% 48.6% 50.1% 57.2% 52.1% 48.2% 45.3%
Couple with non-dep't child. 9.1% 8.9% 7.6% 8.2% 9.7% 9.1% 9.0% 9.1% 7.7%
Couple without children 20.4% 20.1% 18.0% 21.1% 19.7% 19.2% 20.0% 20.1% 23.0%
One parent with dep't child. 5.6% 4.9% 6.2% 5.8% 7.0% 5.1% 6.0% 8.5% 9.2%
One parent w non-dep't child. 3.9% 2.4% 2.5% 3.4% 3.7% 2.7% 3.4% 3.9% 3.5%
Other family 1.3% 0.6% 1.0% 1.0% 1.3% 0.6% 1.1% 1.2% 1.1%
Lone person 9.3% 4.9% 7.2% 12.0% 8.6% 6.0% 8.5% 9.0% 10.2%
Source: ABS Census of Population & Housing, 2011; MacroPlan Dimasi
Table 2.2
Macquarie Centre main trade area - socio-demographic profile, 2011
Secondary sectors

Section 2: Trade area analysis
Macquarie Centre Redevelopment Stage 1 Concept DA
Economic Impact Assessment 17
Some of the larger residential developments of note within the trade area include:
Priority Precincts
Herring Road/Macquarie University Station - approximately 5,400 dwellings by 2031
Epping Town Centre – approx. 3,750 dwellings
North Ryde – approx. 3,000 dwellings
Cherrybrook – approx. 3,200 dwellings
Wentworth Point – approx. 2,300 dwellings
Major developments/precincts
Sydney Olympic Park – the current Masterplan indicates up to 6,500 dwellings however
we understand that this could potentially increase considerably (to more than 10,000
dwellings).
Telopea Urban Renewal Project - which is proposed to include 1,900 dwellings
Parramatta Road Urban Renewal Corridor – which is expected to accommodate an
additional 50,000 dwellings over the longer term, some of which will be located at the
southern periphery of the tertiary south sector.
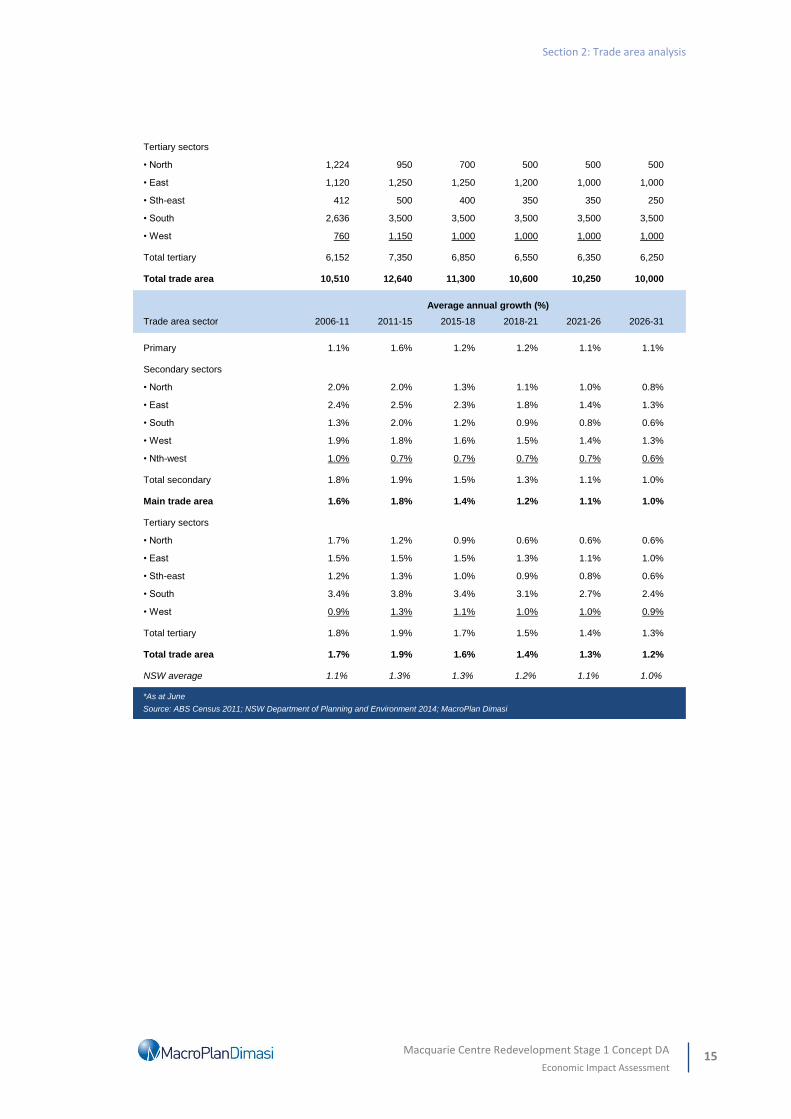
Having regard to the above, the total trade area population is estimated to increase by
around 24% or 167,000 persons by 2031, reaching 872,500 persons, reflecting average
annual growth of 1.3%.
The main trade area population is estimated to grow at an average annual rate of 1.2% to
reach 372,700 by 2031, an increase of 21%, while the primary sector population is estimated
to grow at 1.2% per annum to reach 95,500 by 2031, equivalent to an increase of 20% from
current levels.
In summary, the trade area served by Macquarie Centre, has grown, and will continue to
grow significantly in the future, increasing by almost 25% over the next 15 years or so.
Section 2: Trade area analysis
Macquarie Centre Redevelopment Stage 1 Concept DA
Economic Impact Assessment 18
2.3 Socio-demographic profile
Table 2.2 illustrates the socio-demographic profile of the Macquarie Centre main trade area
population, compared with benchmarks for metropolitan Sydney and Australia, based on
data from the 2011 ABS Census of Population and Housing. Key highlights are as follows:
The average per capita and per household incomes of the total trade area population, at
23.0% and 22.7% respectively, are well above the Sydney metropolitan benchmarks. Main
trade area residents are also very affluent and earn per capita incomes that are 16.3%
above benchmark.
The average age of total trade area (38.5 years) and main trade area residents (38.9
years) is in each case older than the Sydney metropolitan average of 37.1 years.
The home ownership levels across the total trade area are slightly higher than Sydney
benchmarks.
Australian born residents account for 59.6% of the total trade area population and 59.1%
of the main trade area population which is below the Sydney average. Asian born
residents are significant and make up the highest proportion of overseas born residents
accounting for 22.0% of the population in the total trade area and 23.6% in the main
trade area, well above the metropolitan Sydney average of 15.5%.
Traditional families (i.e. couples with dependent children) represent the most prevalent
household type in the total trade area, accounting for over half of all households.
Overall, the total trade area population comprises a culturally diverse mix of affluent,
traditional families.

Section 2: Trade area analysis
Macquarie Centre Redevelopment Stage 1 Concept DA
Economic Impact Assessment 19
2.4 Retail expenditure
MacroPlan Dimasi estimates retail expenditure capacity generated by the main trade area
residents based on information sourced from Market Data Systems (MDS), which utilises a
detailed micro simulation model of household expenditure behaviour for all residents of
Australia. The model takes into account information from a wide variety of sources including
the regular ABS Household Expenditure Surveys, national accounts data, Census data and
other information. We consider MarketInfo data to be an accurate measure of available
retail expenditure and it is widely relied on in the retail industry. This office has undertaken
thousands of retail assessments using actual retail sales turnover data from retailers and
shopping centres and numerous customer surveys to understand the expenditure behaviour
of shoppers.
Total retail expenditure is detailed in a number of categories, as follows:
Take-home food and groceries – goods typically sold in supermarkets and specialty fresh
food stores.
Packaged liquor – packaged beer, wine and spirits such as those purchased at bottle-
shops and liquor outlets.
Food catering – cafes, take-away outlets and restaurants, including liquor consumed on
such premises.
Apparel – clothing, footwear, fashion and accessories.
Household Goods – giftware, electrical, computers, furniture, homewares, and hardware
goods.
Leisure – sporting goods, music, DVDs, games, books, newsagents and film
processing/photography.
General Retail –pharmaceutical goods, cosmetics, toys, florists, mobile phones.
Retail Services – retail services such as key cutting, shoe repairs, hair and beauty.
Section 2: Trade area analysis
Macquarie Centre Redevelopment Stage 1 Concept DA
Economic Impact Assessment 20
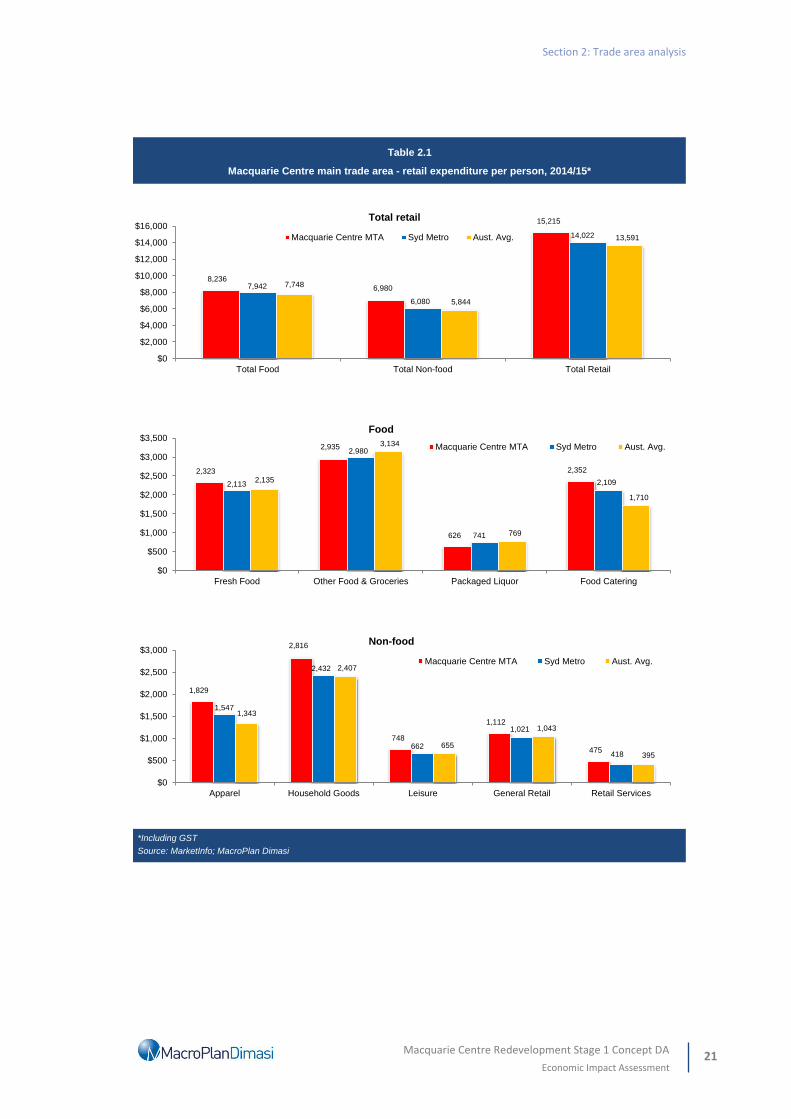
Chart 2.1 details the per capita retail expenditure of the main trade area population,
compared with averages for metropolitan Sydney and Australia. All expenditure estimates in
this report are presented inclusive of GST.
Retail expenditure per capita is estimated to be around 8.5% above the metropolitan
Sydney average.
Estimated per capita expenditure on fresh food is around 10% greater than the
metropolitan Sydney average, while per capita expenditure on other food and groceries is
on part with the Sydney average. These categories of are both of particular relevance to
supermarkets, as they represent 90-95% of items for sale at supermarkets.
Estimated expenditure per capita on non-food discretionary retail is about 15% above the
Sydney metropolitan average. This is reflective of the above average income levels of the
main trade area population and indicates a higher propensity to spend on retail/leisure
shopping such as that provided at Macquarie Centre.
Section 2: Trade area analysis
Macquarie Centre Redevelopment Stage 1 Concept DA
Economic Impact Assessment 21
*Including GST
Source: MarketInfo; MacroPlan Dimasi
Table 2.1
Macquarie Centre main trade area - retail expenditure per person, 2014/15*
8,236
6,980
15,215
7,942
6,080
14,022
7,748
5,844
13,591
$0
$2,000
$4,000
$6,000
$8,000
$10,000
$12,000
$14,000
$16,000
Total Food Total Non-food Total Retail
Total retail
Macquarie Centre MTA Syd Metro Aust. Avg.
2,323
2,935
626
2,352
2,113
2,980
741
2,1092,135
3,134
769
1,710
$0
$500
$1,000
$1,500
$2,000
$2,500
$3,000
$3,500
Fresh Food Other Food & Groceries Packaged Liquor Food Catering
Food
Macquarie Centre MTA Syd Metro Aust. Avg.
1,829
2,816
748
1,112
475
1,547
2,432
662
1,021
418
1,343
2,407
655
1,043
395
$0
$500
$1,000
$1,500
$2,000
$2,500
$3,000
Apparel Household Goods Leisure General Retail Retail Services
Non-food
Macquarie Centre MTA Syd Metro Aust. Avg.
Section 2: Trade area analysis
Macquarie Centre Redevelopment Stage 1 Concept DA
Economic Impact Assessment 22
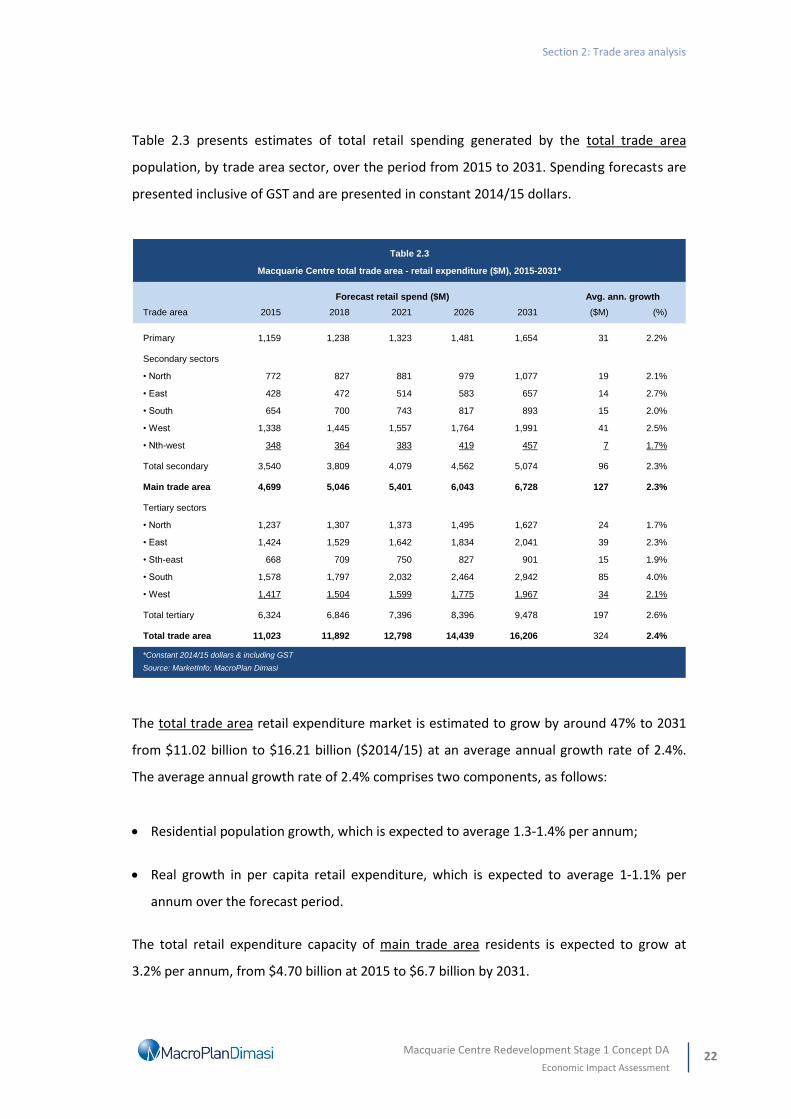
Table 2.3 presents estimates of total retail spending generated by the total trade area
population, by trade area sector, over the period from 2015 to 2031. Spending forecasts are
presented inclusive of GST and are presented in constant 2014/15 dollars.
The total trade area retail expenditure market is estimated to grow by around 47% to 2031
from $11.02 billion to $16.21 billion ($2014/15) at an average annual growth rate of 2.4%.
The average annual growth rate of 2.4% comprises two components, as follows:
Residential population growth, which is expected to average 1.3-1.4% per annum;
Real growth in per capita retail expenditure, which is expected to average 1-1.1% per
annum over the forecast period.
The total retail expenditure capacity of main trade area residents is expected to grow at
3.2% per annum, from $4.70 billion at 2015 to $6.7 billion by 2031.
Avg. ann. growth
Trade area 2015 2018 2021 2026 2031 ($M) (%)
Primary 1,159 1,238 1,323 1,481 1,654 31 2.2%
Secondary sectors
• North 772 827 881 979 1,077 19 2.1%
• East 428 472 514 583 657 14 2.7%
• South 654 700 743 817 893 15 2.0%
• West 1,338 1,445 1,557 1,764 1,991 41 2.5%
• Nth-west 348 364 383 419 457 7 1.7%
Total secondary 3,540 3,809 4,079 4,562 5,074 96 2.3%
Main trade area 4,699 5,046 5,401 6,043 6,728 127 2.3%
Tertiary sectors
• North 1,237 1,307 1,373 1,495 1,627 24 1.7%
• East 1,424 1,529 1,642 1,834 2,041 39 2.3%
• Sth-east 668 709 750 827 901 15 1.9%
• South 1,578 1,797 2,032 2,464 2,942 85 4.0%
• West 1,417 1,504 1,599 1,775 1,967 34 2.1%
Total tertiary 6,324 6,846 7,396 8,396 9,478 197 2.6%
Total trade area 11,023 11,892 12,798 14,439 16,206 324 2.4%
*Constant 2014/15 dollars & including GST
Source: MarketInfo; MacroPlan Dimasi
Table 2.3
Macquarie Centre total trade area - retail expenditure ($M), 2015-2031*
Forecast retail spend ($M)

Section 2: Trade area analysis
Macquarie Centre Redevelopment Stage 1 Concept DA
Economic Impact Assessment 23
Table 2.4 presents projections of spending for the total trade area by retail category. FLG
expenditure (i.e. take-home food & groceries including packaged liquor) is estimated at
$4.25 million in 2015, and accounts for around 40% of all retail expenditure in the trade
area.
The fastest growing retail category is expected to be food catering, which is estimated to
increase at an average annual rate of 3.0%.
Year ending FLG Food Apparel Household Leisure General Retail Total
June catering goods retail services retail
2015 4,253 1,735 1,326 2,018 542 794 355 11,023
2016 4,370 1,792 1,356 2,068 554 812 365 11,317
2017 4,484 1,848 1,384 2,117 566 828 374 11,600
2018 4,600 1,906 1,413 2,166 578 846 384 11,892
2019 4,718 1,965 1,442 2,216 590 863 394 12,187
2020 4,837 2,025 1,471 2,266 601 880 404 12,485
2021 4,962 2,089 1,502 2,318 614 898 415 12,798
2022 5,090 2,153 1,533 2,372 627 917 425 13,116
2023 5,217 2,219 1,563 2,425 639 935 436 13,434
2024 5,348 2,286 1,594 2,479 652 954 447 13,760
2025 5,483 2,355 1,626 2,535 665 973 458 14,095
2026 5,621 2,427 1,659 2,592 678 992 470 14,439
2027 5,759 2,499 1,691 2,648 691 1,011 482 14,782
2028 5,897 2,572 1,723 2,705 704 1,030 493 15,125
2029 6,038 2,648 1,756 2,762 718 1,050 505 15,477
2030 6,183 2,725 1,789 2,821 731 1,069 518 15,837
2031 6,332 2,805 1,823 2,882 745 1,090 530 16,206
Average annual growth ($M)
2015-2031 129.9 66.9 31.0 54.0 12.7 18.5 11.0 323.9
Average annual growth (%)
2015-2031 2.5% 3.0% 2.0% 2.3% 2.0% 2.0% 2.5% 2.4%
*Constant 2014/15 dollars & including GST
Source: MarketInfo; MacroPlan Dimasi
Table 2.4
Macquarie Centre total trade area - retail expenditure by category ($M), 2015-2031*
Macquarie Centre Redevelopment Stage 1 Concept DA
Economic Impact Assessment 24
Section 3: Worker and student markets
This section of the report examines the other key customer segments served by
Macquarie Centre, including the surrounding worker market and nearby student market.
3.1 Worker customer segment
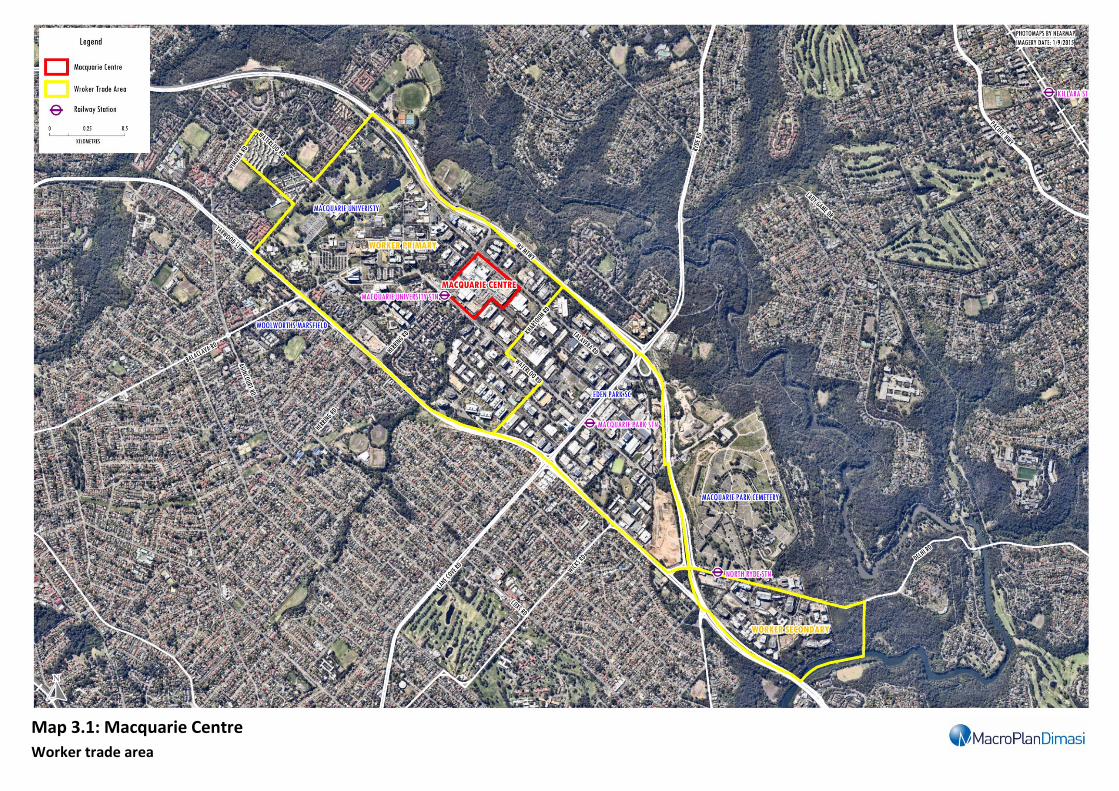
Macquarie Centre is the primary shopping centre destination for workers in the Macquarie
Business Park. The Macquarie Centre worker trade area, which has been defined to include a
primary and a secondary sector, encompasses the entire Macquarie Business Park, as
illustrated on Map 3.1.
The primary sector includes Macquarie University and Macquarie Centre, as well as the area
within a walkable distance from Macquarie Park. According to the Property Council of
Australia (PCA) Office Market Report (July 2015), the Macquarie Business Park contains over
850,000 sq.m of commercial/office floorspace, including around 590,000 – 600,000 sq.m of
prime floorspace and around 250,000 - 260,000 sq.m of secondary floorspace.
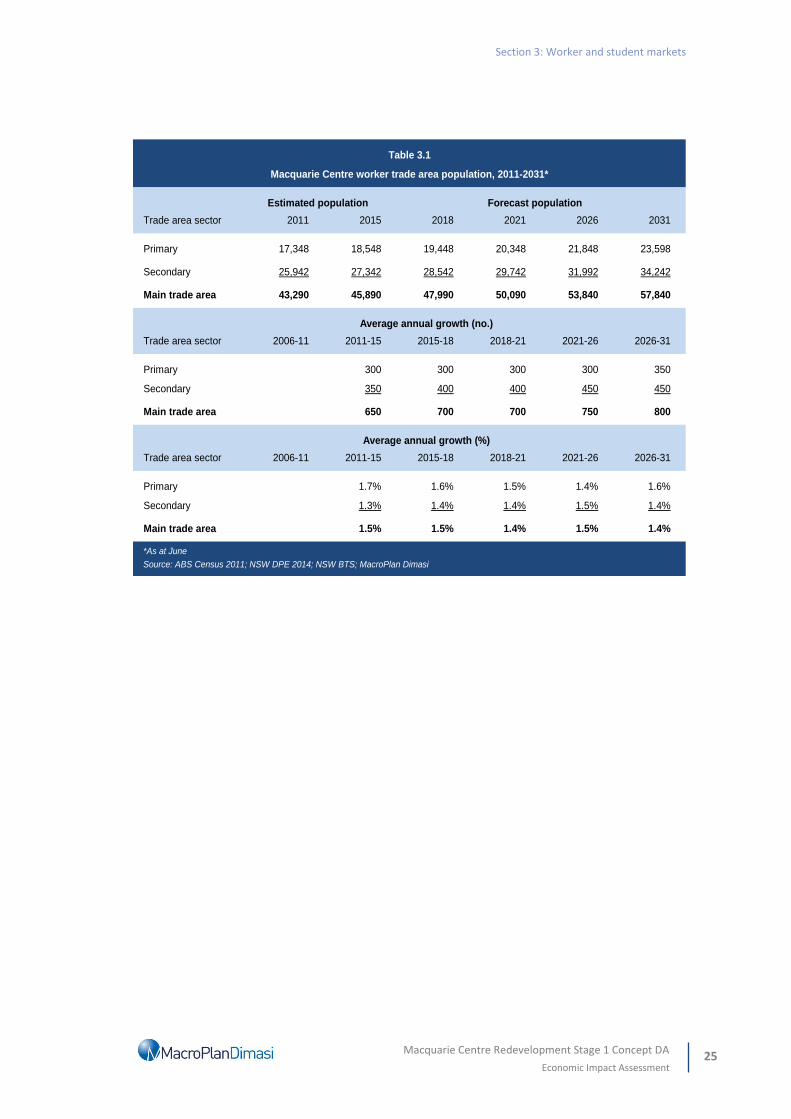
As at the 2011 ABS Census of Population and Housing, the worker trade area contained an
estimated 43,300 workers at 2011, including 17,350 in the primary sector and 25,940 in the
secondary sector (Refer Table 3.1).
Allowing for growth in employment over the past three years, including the recent expansion
of the Macquarie Centre, the worker trade area population is currently (i.e. in 2015)
estimated at 45,900, including 18,600 in the primary sector.
The NSW BTS projects future growth in employment in the worker trade area of around 1.4 –
1.5% per annum, equivalent to around 700 - 800 jobs per annum, resulting in a worker
population of 57,800 by 2031. This accounts for the proposed expansion at Macquarie
Centre and additional office/commercial development within the Macquarie Business Park.
Section 3: Worker and student markets
Macquarie Centre Redevelopment Stage 1 Concept DA
Economic Impact Assessment 25
Trade area sector 2011 2015 2018 2021 2026 2031
Primary 17,348 18,548 19,448 20,348 21,848 23,598
Secondary 25,942 27,342 28,542 29,742 31,992 34,242
Main trade area 43,290 45,890 47,990 50,090 53,840 57,840
Trade area sector 2006-11 2011-15 2015-18 2018-21 2021-26 2026-31
Primary 300 300 300 300 350
Secondary 350 400 400 450 450
Main trade area 650 700 700 750 800
Trade area sector 2006-11 2011-15 2015-18 2018-21 2021-26 2026-31
Primary 1.7% 1.6% 1.5% 1.4% 1.6%
Secondary 1.3% 1.4% 1.4% 1.5% 1.4%
Main trade area 1.5% 1.5% 1.4% 1.5% 1.4%
*As at June
Source: ABS Census 2011; NSW DPE 2014; NSW BTS; MacroPlan Dimasi
Average annual growth (%)
Average annual growth (no.)
Table 3.1
Macquarie Centre worker trade area population, 2011-2031*
Estimated population Forecast population
Macquarie Centre Redevelopment Stage 1 Concept DA
Economic Impact Assessment 26 Map 3.1: Macquarie Centre
Worker trade area

Section 3: Worker and student markets
Macquarie Centre Redevelopment Stage 1 Concept DA
Economic Impact Assessment 27
While there will be some overlap in the defined residential trade area and the worker trade
area (i.e. they are not mutually exclusive customer segments), the worker customer segment
generates significant additional retail expenditure for capture by Macquarie Centre.
As at June 2011, approximately 65% of all persons employed within the worker trade area
drove to and from work, while only 19% utilised public rail and bus transport. We expect the
proportion using public transport would have increased since the census and that it is likely
to increase in the future with upgrades to the rail network across northern Sydney.
Workers employed in professional roles account for the largest proportion of the worker
trade area workforce, at around 43%, which is in line with the benchmark for the Sydney
CBD. Furthermore, the average annual income earned by worker trade area workers is also
generally in line with the average for the Sydney CBD, at around $98,200 (as at the
2011 Census).
Generally, retail expenditure near one’s place of work is mainly on food and groceries, food
catering, retail services and other convenience related categories. Typically, workers spend
between 20% - 40% of their annual retail expenditure near their place of work, depending on
the retail offer provided. For example, workers near a regional shopping centre like
Macquarie Centre or workers in Sydney CBD would likely spend a higher proportion of their
annual retail expenditure near their place of work compared with workers in an industrial
estate with limited retail amenity.
Tables 3.2 presents the estimated retail expenditure capacity generated by workers in the
worker trade area, near their place of work. As shown, this customer segment generates an
estimated $226.4 million in 2015, which is estimated to increase by more than 50%, at an
average annual rate of 2.6%, to reach $343.7 million by 2031.

Section 3: Worker and student markets
Macquarie Centre Redevelopment Stage 1 Concept DA
Economic Impact Assessment 28
Year ending FLG Food Apparel Household Leisure General Retail Total
June catering goods retail services retail
Exp. near work** 25% 60% 30% 20% 30% 30% 50% 32%
2015 68.7 69.9 24.7 25.6 10.6 15.2 11.6 226.4
2016 70.4 72.0 25.2 26.2 10.8 15.5 11.9 232.1
2017 72.1 74.2 25.7 26.8 11.1 15.8 12.2 238.0
2018 74.0 76.5 26.3 27.4 11.3 16.2 12.5 244.0
2019 75.8 78.8 26.8 28.0 11.5 16.5 12.8 250.2
2020 77.8 81.2 27.4 28.7 11.7 16.8 13.1 256.7
2021 79.8 83.7 27.9 29.3 12.0 17.2 13.5 263.4
2022 81.9 86.4 28.5 30.1 12.2 17.5 13.8 270.5
2023 84.1 89.1 29.1 30.8 12.5 17.9 14.2 277.8
2024 86.4 92.0 29.8 31.5 12.8 18.3 14.6 285.3
2025 88.7 94.9 30.4 32.3 13.1 18.7 14.9 293.0
2026 91.0 97.9 31.1 33.1 13.3 19.1 15.3 300.9
2027 93.5 101.0 31.7 33.9 13.6 19.5 15.8 309.0
2028 96.0 104.2 32.4 34.7 13.9 19.9 16.2 317.3
2029 98.5 107.5 33.1 35.5 14.2 20.4 16.6 325.9
2030 101.1 110.9 33.8 36.4 14.5 20.8 17.1 334.7
2031 103.8 114.5 34.6 37.2 14.8 21.3 17.5 343.7
Average annual growth ($M)
2015-2031 2.2 2.8 0.6 0.7 0.3 0.4 0.4 7.3
Average annual growth (%)
2015-2031 2.6% 3.1% 2.1% 2.4% 2.1% 2.1% 2.6% 2.6%
*Constant 2014/15 dollars & including GST
**Share of total annual expenditure potentially spent near place of work
Source: MarketInfo; MacroPlan Dimasi
Table 3.2
Macquarie Centre worker trade area - retail expenditure by category ($M), 2015-2031*

Section 3: Worker and student markets
Macquarie Centre Redevelopment Stage 1 Concept DA
Economic Impact Assessment 29
3.2 Student customer segment
Macquarie University is located on the doorstep of Macquarie Centre and the student
market would form an important additional customer segment for the centre, particularly
given the centre accommodates the bus interchange and the Macquarie University train
station is located between both Macquarie Centre and the University.
A proportion of these students will be counted in the resident trade area population, as
many will clearly reside within the defined trade area. However, students utilise the centre
at all times of the day, and would use the centre differently to a typical residential trade area
customer.
As at 2014, Macquarie University had 38,747 student enrolments, including around 27,370
domestic students and 11,377 international students. Total student enrolments at
Macquarie University have grown at an average annual rate of 2.9% over the past 10 years,
however, over the past three years, enrolments have grown at around 1.6% per annum. We
estimate that the total student enrolments at Macquarie University could potentially grow at
around 2.0% per annum over the next 15 years or so.
Around 70% of students who attend Macquarie University are enrolled on a full-time basis.
Macquarie University has a full-time equivalent (FTE) staff population of 2,768, including
1,334 academic staff and 1,434 professional staff. These staff are counted in the Macquarie
Park worker population.
Section 3: Worker and student markets
Macquarie Centre Redevelopment Stage 1 Concept DA
Economic Impact Assessment 30
3.3 Macquarie Transport Interchange: Train and bus passengers
Table 3.3 summarises the historical and projected average weekday commuter movements
passing through the Macquarie University train station over the period 2010 to 2030, as well
as estimated bus passenger movements through the Macquarie Centre bus interchange,
based on information from the NSW BTS, the Herring Road (Macquarie University Station)
Priority Precinct planning proposal and information provided by AMP Capital.
Since the Epping-Chatswood Rail Link opened, the average number of commuters per
weekday passing through Macquarie University Station has almost doubled, from around
11,000 per day in 2009 to around 20,200 per day in 2014, reflecting significant annual
average growth in patronage greater than 12%. Average weekday movements are projected
to exceed 40,000 by 2030 (i.e. growth of around 4% – 4.5% per annum on average).
The Sydney Metro Northwest is expected to be fully operational by 2019 – 2020, with
stations along the Epping - Chatswood line expected to be upgraded and operational by early
2019, facilitating (smaller) trains that will run four times more regularly than they do
currently.
According to the Herring Road Priority Precinct planning proposal, average bus volumes
passing through the Macquarie Centre interchange are expected to increase significantly by
2030. The planning proposal indicates that average weekday bus movements through the
station are projected to be around about 1.5 times total train movements through
Macquarie University station, and thus are expected to exceed 60,000 passengers per
weekday by 2030.
This ‘commuter market’ would predominantly consist of persons already accounted for in
the customer segments previously identified in this report (i.e. residents, workers, students).
However, this analysis shows that there will significant future growth in public transport
movements through the Macquarie Interchange in the future driving significant localised
activity within and around the Macquarie Centre.

Section 3: Worker and student markets
Macquarie Centre Redevelopment Stage 1 Concept DA
Economic Impact Assessment 31
The proposed expansion scheme includes lower level areas that will facilitate the movement
of commuters between the bus and train stations, with supporting convenience retail and
food related retail envisaged in this part of the centre.
Indicator 2009 2010 2011 2012 2013 2014 2020 2025 2030
Train passengers
Est. train commuters per weekday* 10,980 14,960 17,020 17,640 17,480 20,180 26,746 34,136 40,543
Avg. ann growth 36.2% 13.8% 3.6% -0.9% 15.4% 5.1% 5.0% 3.5%
Bus passengers
Est. bus commuters per weekday** n.a. n.a. n.a. n.a. n.a. n.a. 40,120 51,204 60,814
Avg. ann growth
Total bus and train commuters per weekday 66,866 85,340 101,357
*Macquarie University station
**Macquarie Centre interchange
Source: AMP; NSW Bureau of Transport Statistics; City of Ryde (planning proposal Herring Road UAP)
Table 3.3
Avg. weekday commuter numbers at Macquarie Centre Transport Interchange: 2009 - 2030
Historical Projected

Macquarie Centre Redevelopment Stage 1 Concept DA
Economic Impact Assessment 32
Section 4: Competition
This section of the report reviews the competitive context within which Macquarie Centre
operates, now and in the future, including all proposed competitive developments.
The major competitive centres to Macquarie Centre are summarised in Table 4.1 and are
illustrated on the previous Map 2.1. As a regional shopping centre, the major competitors for
Macquarie Centre are other large, regional shopping centres across northern and western
Sydney. By regional shopping centre, we mean shopping centres generally anchored by one
or more department stores that serve broad, regionally sized trade areas.
4.1 Regional centres
Chatswood CBD
The closest regional shopping facilities to Macquarie Centre are located in the Chatswood
CBD, which contains the Westfield Chatswood and Chatswood Chase regional shopping
centres. The Chatswood CBD is the dominant retail precinct on the Lower North Shore,
accommodating an estimated 170,000 - 180,000 sq.m of retail floorspace, including
Westfield Chatswood and Chatswood Chase, a significant provision of street/strip retail
including a popular pedestrian mall, as well as cultural, entertainment, business, health,
community services, commercial office and high-density residential floorspace.
Westfield Chatswood provides 71,400 sq.m of retail floorspace, including a Myer
department store, Coles and Aldi supermarkets, a significant volume of specialty retail and a
Hoyts cinema complex. This centre is currently undergoing a major redevelopment that will
include a reconfiguration of the mall facing Victoria Avenue into a five level entrance
statement that will house new mini-majors and an Asian inspired dining market. The centre
retail GLA is expected to increase by 3,000 sq.m and will include Topshop/Topman.

Section 4: Competition
Macquarie Centre Redevelopment Stage 1 Concept DA
Economic Impact Assessment 33
Chatswood Chase provides about 56,800 sq.m of retail floorspace, and is anchored by a
David Jones department store and a large Coles supermarket. The specialty mix at this centre
is slightly more upmarket than Westfield Chatswood. This centre performs exceptionally
well, and is ranked 9th in Australia in terms of MAT per sq.m of all Big Guns shopping centres
as per the Shopping Centre News Big Guns 2015 publication and 7th in regards to specialty
MAT per sq.m.
Westfield Parramatta
Westfield Parramatta is the dominant shopping facility in the Parramatta CBD and is
currently the largest shopping centre in NSW containing 120,600 sq.m of retail GLA (total
GLA of 137,200 sq.m). This centre is anchored by David Jones and Myer department stores;
Target and Kmart discount department stores; and Woolworths and Coles supermarkets, and
includes over 400 retail specialty/mini-major stores, including international mini-majors such
as Uniqlo. The centre includes an external dining precinct, as well as two gyms and an
11 screen Event cinema complex. The centre provides a comprehensive provision of mini-
majors and specialty retail.
An approval exists for a major expansion of Westfield Parramatta of around 24,150 sq.m of
retail GLA, including a new upper level, which is expected to include a new Big W dds, a
larger (relocated) Woolworths supermarket, additional mini-major and retail specialty
floorspace. In addition to recent tenancy improvements at the centre (e.g. Uniqlo) we expect
this expansion will include additional international mini-majors of the likes of Zara, H&M and
Sephora etc. A commercial office tower of around 35,000 sq.m is also approved as part of
the redevelopment of the centre.
Since the approval was granted in 2014, a larger development of the centre has been
mooted, that could include a doubling of the size of the commercial office tower and an
increase in the scale of the retail expansion. No formal proposal has been submitted at this
stage.
Section 4: Competition
Macquarie Centre Redevelopment Stage 1 Concept DA
Economic Impact Assessment 34
Castle Towers
Castle Towers Shopping Centre currently contains around 100,000 sq.m of retail floorspace
including both major department stores, Kmart and Target discount department stores, and
Coles and Aldi supermarkets and around 280 - 300 specialty and mini-major stores. This
centre is the dominant regional shopping centre in outer north-western Sydney.
An approval exists for a major expansion of this centre of around 60,000 sq.m (of retail GLA),
however QIC has recently lodged a revised application that seeks an additional 80,000 sq.m
of total GLA (including around 69,000 sq.m retail GLA). This expansion is expected to include
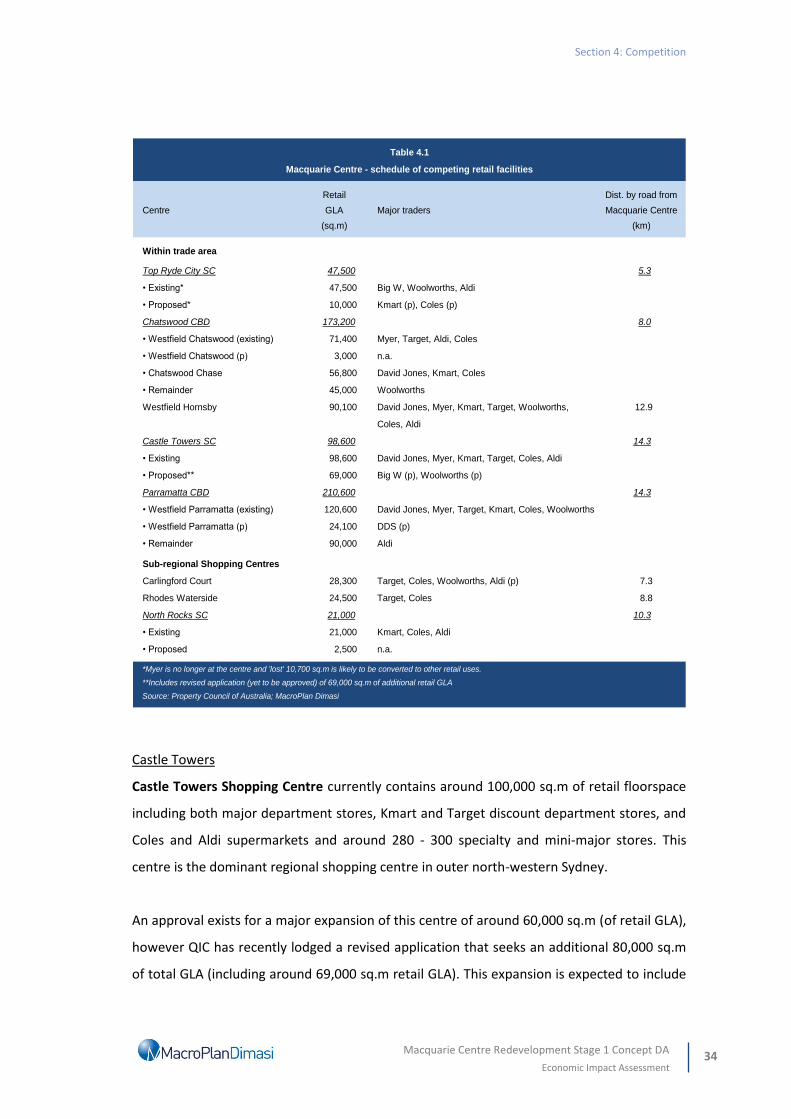
Retail Dist. by road from
Centre GLA Major traders Macquarie Centre
(sq.m) (km)
Within trade area
Top Ryde City SC 47,500 5.3
• Existing* 47,500 Big W, Woolworths, Aldi
• Proposed* 10,000 Kmart (p), Coles (p)
Chatswood CBD 173,200 8.0
• Westfield Chatswood (existing) 71,400 Myer, Target, Aldi, Coles
• Westfield Chatswood (p) 3,000 n.a.
• Chatswood Chase 56,800 David Jones, Kmart, Coles
• Remainder 45,000 Woolworths
Westfield Hornsby 90,100 David Jones, Myer, Kmart, Target, Woolworths, 12.9
Coles, Aldi
Castle Towers SC 98,600 14.3
• Existing 98,600 David Jones, Myer, Kmart, Target, Coles, Aldi
• Proposed** 69,000 Big W (p), Woolworths (p)
Parramatta CBD 210,600 14.3
• Westfield Parramatta (existing) 120,600 David Jones, Myer, Target, Kmart, Coles, Woolworths
• Westfield Parramatta (p) 24,100 DDS (p)
• Remainder 90,000 Aldi
Sub-regional Shopping Centres
Carlingford Court 28,300 Target, Coles, Woolworths, Aldi (p) 7.3
Rhodes Waterside 24,500 Target, Coles 8.8
North Rocks SC 21,000 10.3
• Existing 21,000 Kmart, Coles, Aldi
• Proposed 2,500 n.a.
*Myer is no longer at the centre and 'lost' 10,700 sq.m is likely to be converted to other retail uses.
**Includes revised application (yet to be approved) of 69,000 sq.m of additional retail GLA
Source: Property Council of Australia; MacroPlan Dimasi
Table 4.1
Macquarie Centre - schedule of competing retail facilities

Section 4: Competition
Macquarie Centre Redevelopment Stage 1 Concept DA
Economic Impact Assessment 35
new major tenants, mini-majors and retail specialty stores, as well as a redeveloped and
expanded dining/restaurant precinct. Upon completion, Castle Towers will become the
largest regional shopping centre in Sydney, and one of the largest shopping centres in
Australia.
4.2 Sub-regional centres
There are also a number of sub-regional shopping centres and supermarket based centres
located throughout the defined total trade area, however, most of these centres are of
limited competitive relevance to Macquarie Centre, as they generally perform a different
role and function (i.e. local convenience, or sub-regional retailing). The most relevant of the
sub-regional centres are discussed as follows:
Top Ryde City
Top Ryde City, which is located in the secondary north sector, is currently undergoing a
major internal refurbishment. Prior to this redevelopment the centre contained around
60,000 sq.m of retail GLA including a Myer department store. Myer recently exited the
centre as part of its broader property strategy of store consolidation, which has also seen the
closure of other stores in Sydney (e.g. Westfield Hurstville), while the IGA store has been
vacated as well. This space is expected to be back-filled by a Coles supermarket, possibly a
dds (e.g. Kmart) and a mix of mini-major and specialty retail floorspace.
The centre also contains a Big W dds, and Woolworths and Aldi supermarkets. The centre
also provides an extensive food catering, casual dining and entertainment offer including a 7
screen Event cinema complex. The casual dining piazza is one of the more successful
elements of the centre.
Section 4: Competition
Macquarie Centre Redevelopment Stage 1 Concept DA
Economic Impact Assessment 36
Rhodes Waterside SC
Rhodes Waterside is a 24,500 sq.m sub-regional shopping centre anchored by a Kmart
discount department store and a Coles supermarket, which also includes a well presented
and significant food catering offer, with many alfresco dining options. This centre serves the
surrounding sub-regional residential trade area as well as the workers within the Rhodes
Business Park. This centre also contains a cinema complex as well as an IKEA store.
Carlingford Court
Carlingford Court is a 28,300 sq.m sub-regional shopping centre anchored by a large Target
discount department store and Coles and Woolworths supermarkets, located around 7.3 km
to the west of Macquarie Centre. The centre contains around 95 – 100 specialty retail
tenants as well as a larger medical centre and a large Fitness First gym. An Aldi supermarket
is planned to be accommodated within the centre by mid-2017.
North Rocks Shopping Centre
North Rocks Shopping Centre is located a further 3km west of Carlingford Court and recently
changed owners, having previously been known as Westfield North Rocks. A development
application has been lodged to refurbish and expand the centre, consisting of a retail GFA
increase of around 2,500 sq.m. The refurbishment, if approved, will include the conversion of
the existing Coles supermarket into two mini-major tenancies and the development of a
new, larger Coles supermarket.
Section 4: Competition
Macquarie Centre Redevelopment Stage 1 Concept DA
Economic Impact Assessment 37
4.3 Proposed centres/developments
Most of the regional shopping centres identified in Section 4.1 are planned to undergo major
redevelopments in the near future. In addition to this, we expect additional convenience
oriented retail facilities to establish within the identified Priority Precincts across the main
trade area, including centres such as Cherrybrook, Epping and Wentworth Point. These
developments are expected to serve localised trade areas and are of little competitive
relevance to the existing Macquarie Centre, and planned future expansion of this centre.
The Camellia Priority Precinct is located just beyond the defined trade area and we
understand this precinct could potentially contain sub-regional scale retail development,
given around 15,000 dwellings could potentially be accommodated within this precinct over
the longer term. The development of the town centre within the Camellia Priority Precinct is
expected to evolve over the medium to longer term. An approval exists for up to 15,000
sq.m of retail floorspace at 181 James Ruse Drive and we understand the landowners across
the rest of the town centre are likely to submit revised planning proposals for their land in
the near future.
We expect that additional retail development is likely to occur within the Sydney Olympic
Park precinct in the future, particularly given this precinct could support at least 6,500 new
residential dwellings, and potentially in excess of 10,000 dwellings. Under the existing 2030
Masterplan for the precinct, up to 30,000 sq.m of retail floorspace is permissible within the
precinct.

Macquarie Centre Redevelopment Stage 1 Concept DA
Economic Impact Assessment 38
Section 5: Retail demand & estimated sales potential
This section of the report provides an assessment of the retail floorspace demand generated
by the population of the trade area. This section also examines the likely sales potential of
the proposed expansion, examining the incremental sales of the proposed expansion, by
comparing the sales of the proposed expansion scenario with a “Do Nothing” scenario.
5.1 Retail floorspace demand
Table 5.1 presents an indicative analysis of the retail floorspace demand generated by the
main trade area population and total trade area population over the period 2015 to 2031.
Across Australia there is an estimated 2.2 sq.m of retail floorspace per capita, including all
forms of retailing such as shopping centres, street/strip retail, stand-alone supermarkets and
bulky goods/large format retail (LFR). Approximately 0.6 sq.m is considered to be bulky
goods/LFR retail and around 1.6 sq.m is considered traditional retail floorspace.
Table 5.1 shows that the total trade area population currently generates retail demand
equivalent to around 1.55 million sq.m of floorspace, including 1.13 million sq.m of
traditional retail floorspace and 420,000 sq.m of bulky goods/LFR floorspace. This demand
would presently be met be a range of retail facilities including Macquarie Centre, higher
order centres like Chatswood, Hornsby, Top Ryde City; small neighbourhood centres; bulky
goods precincts; as well as the Sydney CBD.
The main trade area population generates around 40 – 45% of total trade area demand
equivalent to around 680,000 sq.m, of which around 490,000 sq.m is considered to be
traditional retail floorspace demand.

Section 5: Retail demand & estimated sales potential
Macquarie Centre Redevelopment Stage 1 Concept DA
Economic Impact Assessment 39
As indicated earlier in this report, the main trade area population is estimated to increase by
around 21% by 2031, which would result in an additional 102,000 sq.m of traditional retail
floorspace demand over this period. This assumes a constant retail provision per capita,
which is a conservative assumption given the provision of retail floorspace per capita has
increased from around 2.0 to 2.2 sq.m over the past 15 – 20 years or so.
The total trade area population is expected to generate an additional 267,000 sq.m of
traditional retail floorspace demand over the next 15 years or so to 2031, or around
16,700 sq.m per year.
In this context, the proposed expansion of Macquarie Centre, which includes an additional
39,723 sq.m of retail floorspace, is equivalent to only 2.5 years of traditional retail floorspace
demand growth over the next 15 years from the total trade area population.
Indicator/Category 2015 2018 2021 2026 2031 Chg. 15-31
Population
Primary sector 79,530 82,530 85,530 90,530 95,530 16,000
Secondary sectors 229,430 239,780 248,930 263,430 277,180 47,750
Total main trade area 308,960 322,310 334,460 353,960 372,710 63,750
Tertiary sectors 396,550 417,100 436,750 468,500 499,750 103,200
Total main trade area 705,510 739,410 771,210 822,460 872,460 166,950
Floorspace demand per capita
Traditional retail 1.60 1.60 1.60 1.60 1.60
Bulky/LFR 0.60 0.60 0.60 0.60 0.60
Total 2.20 2.20 2.20 2.20 2.20
Total demand - Main trade area
Traditional retail 494,336 515,696 535,136 566,336 596,336 102,000
Bulky/LFR 185,376 193,386 200,676 212,376 223,626 38,250
Total 679,712 709,082 735,812 778,712 819,962 140,250
Total demand - Total trade area
Traditional retail 1,128,816 1,183,056 1,233,936 1,315,936 1,395,936 267,120
Bulky/LFR 423,306 443,646 462,726 493,476 523,476 100,170
Total 1,552,122 1,626,702 1,696,662 1,809,412 1,919,412 367,290
Source: MacroPlan Dimasi
Table 5.1
Macquarie Centre - Main trade area and Total trade area retail floorspace demand (2015 - 2031)
Section 5: Retail demand & estimated sales potential
Macquarie Centre Redevelopment Stage 1 Concept DA
Economic Impact Assessment 40
5.2 Estimated sales potential
In order to examine the potential impacts that could result from the proposed expansion we
have estimated the potential sales for Macquarie Centre under a Do Nothing scenario (i.e.
assuming the centre remains in its current state) and compared this against estimated retail
sales that could be achieved by the centre under the proposed expansion scenario. This
analysis is presented in Table 5.2, expressed in constant $2014/15 and inclusive of GST.
We note that the analysis presented in Table 5.2 reflects independent estimates of the
future retail sales potential of Macquarie Centre prepared by MacroPlan Dimasi. These
estimates are to be considered indicative in nature, and could vary depending on the
ultimate composition of retail floorspace and the timing/scale of competitive developments
across the surrounding competitive network. We have assumed an indicative first year of
trade of 2019/20 for the purposes of examining the potential sales and impacts.
Table 5.2 shows that centre retail sales are estimated to reach around $815 million in the
year 2019/20, which accounts for growth in the available expenditure market as well as
future competitive developments/expansions such as Castle Towers and Westfield
Parramatta.
Under the expansion scenario, we have assumed that around 30,000 sq.m of the proposed
39,723 sq.m of GLA would be allocated to typical ‘retail’ uses like fashion/non-food mini-
majors and specialty retail including additional dining.
The remaining 9,723 sq.m attributed to non-retail type uses such as bowling, gyms, gaming
areas, child care, kids entertainment etc.
We estimate that the expanded centre could achieve sales in the order of $1.00 billion in the
year 2019/20, equivalent to an incremental increase of around $190.5 million.
It is this incremental sales volume which is of relevance to assessing the impacts on the
surrounding retail hierarchy.
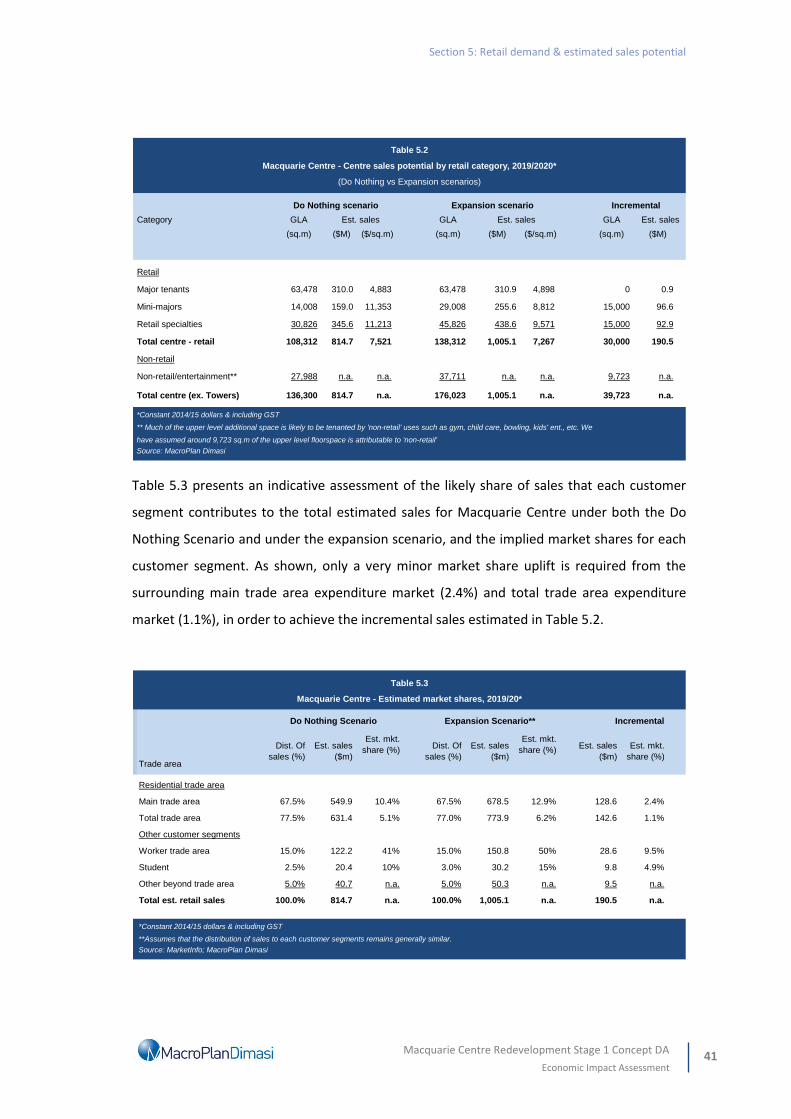
Section 5: Retail demand & estimated sales potential
Macquarie Centre Redevelopment Stage 1 Concept DA
Economic Impact Assessment 41
Table 5.3 presents an indicative assessment of the likely share of sales that each customer
segment contributes to the total estimated sales for Macquarie Centre under both the Do
Nothing Scenario and under the expansion scenario, and the implied market shares for each
customer segment. As shown, only a very minor market share uplift is required from the
surrounding main trade area expenditure market (2.4%) and total trade area expenditure
market (1.1%), in order to achieve the incremental sales estimated in Table 5.2.
Category GLA GLA GLA
(sq.m) ($M) ($/sq.m) (sq.m) ($M) ($/sq.m) (sq.m) ($M)
Retail
Major tenants 63,478 310.0 4,883 63,478 310.9 4,898 0 0.9
Mini-majors 14,008 159.0 11,353 29,008 255.6 8,812 15,000 96.6
Retail specialties 30,826 345.6 11,213 45,826 438.6 9,571 15,000 92.9
Total centre - retail 108,312 814.7 7,521 138,312 1,005.1 7,267 30,000 190.5
Non-retail
Non-retail/entertainment** 27,988 n.a. n.a. 37,711 n.a. n.a. 9,723 n.a.
Total centre (ex. Towers) 136,300 814.7 n.a. 176,023 1,005.1 n.a. 39,723 n.a.
*Constant 2014/15 dollars & including GST
** Much of the upper level additional space is likely to be tenanted by 'non-retail' uses such as gym, child care, bowling, kids' ent., etc. We
have assumed around 9,723 sq.m of the upper level floorspace is attributable to 'non-retail'
Source: MacroPlan Dimasi
Est. sales Est. sales Est. sales
Table 5.2
Macquarie Centre - Centre sales potential by retail category, 2019/2020*
(Do Nothing vs Expansion scenarios)
Do Nothing scenario Expansion scenario Incremental
Est. mkt.
share (%)
Est. mkt.
share (%)
Trade area
Residential trade area
Main trade area 67.5% 549.9 10.4% 67.5% 678.5 12.9% 128.6 2.4%
Total trade area 77.5% 631.4 5.1% 77.0% 773.9 6.2% 142.6 1.1%
Other customer segments
Worker trade area 15.0% 122.2 41% 15.0% 150.8 50% 28.6 9.5%
Student 2.5% 20.4 10% 3.0% 30.2 15% 9.8 4.9%
Other beyond trade area 5.0% 40.7 n.a. 5.0% 50.3 n.a. 9.5 n.a.
Total est. retail sales 100.0% 814.7 n.a. 100.0% 1,005.1 n.a. 190.5 n.a.
*Constant 2014/15 dollars & including GST
**Assumes that the distribution of sales to each customer segments remains generally similar.
Source: MarketInfo; MacroPlan Dimasi
Est. sales
($m)
Est. mkt.
share (%)
Dist. Of
sales (%)
Est. sales
($m)
Dist. Of
sales (%)
Est. sales
($m)
Table 5.3
Macquarie Centre - Estimated market shares, 2019/20*
Do Nothing Scenario Expansion Scenario** Incremental

Macquarie Centre Redevelopment Stage 1 Concept DA
Economic Impact Assessment 42
Section 6: Retail hierarchy impacts
This section of the report presents our estimates of likely trading impacts on the surrounding
retail network and discusses the implications of these impacts.
6.1 Purpose of assessing impacts
The purpose of an impact assessment is to provide guidance as to whether or not there is
likely to be a net community benefit or disbenefit from any proposed development. In
particular, if there is a real possibility of some existing facilities potentially being impacted to
such a degree that they may be lost to the community and if the service or services provided
by those facilities are not at the very least replaced by the proposed new facilities, then a
community disbenefit could result.
In order to understand whether any particular centre may be impacted to the extent that its
continued viability may be in question, we have estimated specific retail impacts that we
expect across the surrounding competitive network were Macquarie Centre to expand as
proposed.
These estimates provide indications as to whether the scale of the proposed retail
development is reasonable and whether any surrounding centres are likely to be at risk to
the extent that the community would suffer a net disbenefit, attributable to the proposed
retail development. In considering likely trading impacts on any individual centre or
individual retailer, it must first be acknowledged that such estimation can only realistically
expect to provide a broad indication of likely outcomes, since there are many factors which
can change in response to any new retail development, and which will have a bearing on the
consequent outcomes. The competitive response of each relevant centre or trader is one
such factor, as are further redevelopments/improvements which one or more of the
competitive network of centres might implement.

Section 6: Retail hierarchy impacts
Macquarie Centre Redevelopment Stage 1 Concept DA
Economic Impact Assessment 43
6.2 Impacts methodology
The following factors are typically considered when assessing the potential impacts of a new
supermarket based development on each existing facility or centre:
The distance of the (impacted) centre, or retail precinct, by road, from the proposed
development.
The size of the centre or precinct, in terms of total retail floorspace.
The amount of supermarket floorspace, and brands of these supermarkets.
The role and function of the centre or precinct.
Relative accessibility and relative convenience compared with the proposed retail
development.
The estimated performance of the centre/precinct (in current sales) and future
performance (in the impact year), accounting for any future developments in the region
that may also impact on the future sales of existing centres.
The share of available expenditure which the centre/precinct attracts from the identified
main trade area of the proposed development. A centre may not be situated in the
identified trade area of the proposed development but its main trade area may extend
to include parts, or all, of the trade area. For example, the trade area for large regional
shopping centre typically includes several hundred thousand persons. Such a trade area
is likely to include (partially or completely) trade areas for smaller convenience based
centres, sub-regional centres, retail strips and stand-alone supermarkets.
The following key principles are then relied on when assessing the dollar (and percentage)
impacts that are likely to be absorbed by existing facilities/centres:
The greatest impacts are typically absorbed by the closest comparable centres. For
example, an expansion of a regional shopping centre will predominantly impact on other
Section 6: Retail hierarchy impacts
Macquarie Centre Redevelopment Stage 1 Concept DA
Economic Impact Assessment 44
regional shopping centres within, and adjacent to that centre’s trade area, followed by
impacts on larger sub-regional sized centres.
Impacts on small scale sub-regional and local centres, tend to be relatively smaller in
scale, as these stores normally attract a small market share of available main trade area
expenditure and perform a different role and function in the hierarchy, often serving the
local walkable catchments surrounding them, and/or serving more specialised/discerning
needs (e.g. a small Foodworks foodstore).
Table 6.1 presents a summary of the key metrics for the surrounding centres of relevance to
the proposed development. This table includes the following:
Column (1) shows the distance of each centre or store from the subject site.
Column (2) shows the amount of retail floorspace at the centre.
Column (3) outlines the estimated sales for the year 2014/15.
Column (4) presents an estimate of the proportion of sales for each centre that is
generated from the main trade area population. This provides the starting point for the
allocation of sales redirected to the new development at the subject site.
Column (5) presents an estimate, for each centre, of the volume of sales generated from
the defined main trade area. Column (5) is calculated by multiplying Column (4) by
Column (3). This column represents the total amount estimated to be spent by residents
of the main trade area at each identified centre.
Column (6) shows, for each centre, the proportion of sales drawn by the centre from the
main trade area as a percentage of the total sales drawn from the main trade area by all
identified centres in the analysis. Column (6) is calculated by dividing each entry in
Column (5) by the sum total of Column (5).

Section 6: Retail hierarchy impacts
Macquarie Centre Redevelopment Stage 1 Concept DA
Economic Impact Assessment 45
Table 6.2 builds upon the analysis in Table 6.1, setting out an assessment of the likely order
of trading impact on each of the identified centres, showing:
The estimated floorspace (GLA) and sales volume for each centre as at 2014/15.
The estimated sales volume for each centre at 2019/2020 assuming Macquarie Centre
does not expand.
The estimated sales volume for each centre at 2019/2020 after allowing for the
proposed expansion by 2019/2020.
The consequent estimated trading impact, measured both as a sales volume and a
percentage impact, on each centre.
The estimated post-impact sales performance at 2019/2020 as compared with current
(2014/15) sales for each centre.
Distance Total Est. centre
from site GLA sales ($M)
Centre (km) (sq.m) (2014/15) (%) ($M) (%)
(1) (2) (3) (4) (5) (6)
Regional centres
Chatswood CBD** 8.0 131,200 1,015 35% 355 25%
Westfield Hornsby 12.9 90,100 624 45% 281 20%
Castle Towers 14.3 98,600 711 33% 234 16%
Westfield Parramatta 14.3 120,600 721 20% 144 10%
Sub-regional centres
Top Ryde City*** 5.3 47,500 299 70% 210 15%
Carlingford Court 8.0 28,300 178 60% 107 7%
Rhodes Waterside**** 8.8 24,500 183 15% 27 2%
Westfield North Rocks 10.3 21,000 142 45% 64 4%
Total identified centres 1,422 100%
Share of sales directed to identified centres from MTA residents
*Sales expressed inclusive of GST and in $2014/15
**Includes both Westfield Chatswood (inc. expansion) and Chatswood Chase
***Estimated GLA and sales performance without Myer and IGA (which have both vacated the centre)
****Excludes IKEA
Source: PCA, MacroPlan Dimasi
Table 6.1
Macquarie Centre - Estimated sales distribution of specific centres in region, 2014/15*
Est. % sales
drawn from
MTA
Est. % sales
drawn from
MTA
Share of
available MTA
retail exp. to
identified centres
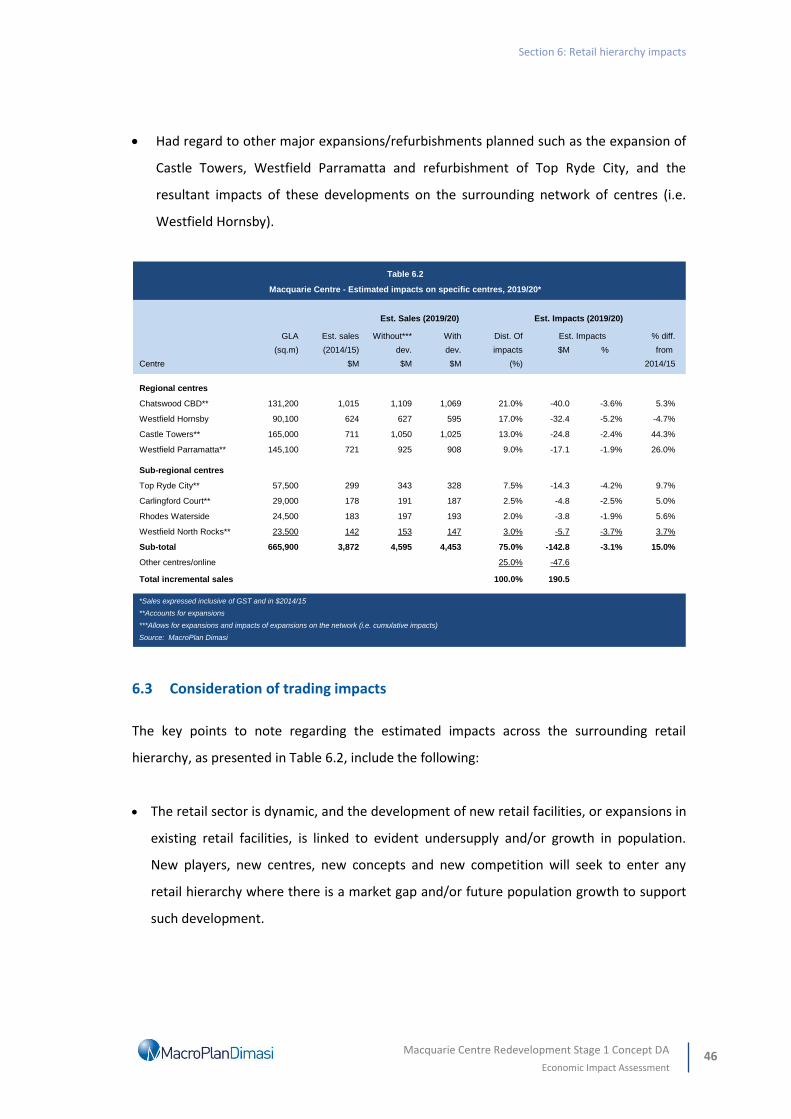
Section 6: Retail hierarchy impacts
Macquarie Centre Redevelopment Stage 1 Concept DA
Economic Impact Assessment 46
Had regard to other major expansions/refurbishments planned such as the expansion of
Castle Towers, Westfield Parramatta and refurbishment of Top Ryde City, and the
resultant impacts of these developments on the surrounding network of centres (i.e.
Westfield Hornsby).
6.3 Consideration of trading impacts
The key points to note regarding the estimated impacts across the surrounding retail
hierarchy, as presented in Table 6.2, include the following:
The retail sector is dynamic, and the development of new retail facilities, or expansions in
existing retail facilities, is linked to evident undersupply and/or growth in population.
New players, new centres, new concepts and new competition will seek to enter any
retail hierarchy where there is a market gap and/or future population growth to support
such development.
GLA Est. sales Without*** With Dist. Of % diff.
(sq.m) (2014/15) dev. dev. impacts $M % from
Centre $M $M $M (%) 2014/15
Regional centres
Chatswood CBD** 131,200 1,015 1,109 1,069 21.0% -40.0 -3.6% 5.3%
Westfield Hornsby 90,100 624 627 595 17.0% -32.4 -5.2% -4.7%
Castle Towers** 165,000 711 1,050 1,025 13.0% -24.8 -2.4% 44.3%
Westfield Parramatta** 145,100 721 925 908 9.0% -17.1 -1.9% 26.0%
Sub-regional centres
Top Ryde City** 57,500 299 343 328 7.5% -14.3 -4.2% 9.7%
Carlingford Court** 29,000 178 191 187 2.5% -4.8 -2.5% 5.0%
Rhodes Waterside 24,500 183 197 193 2.0% -3.8 -1.9% 5.6%
Westfield North Rocks** 23,500 142 153 147 3.0% -5.7 -3.7% 3.7%
Sub-total 665,900 3,872 4,595 4,453 75.0% -142.8 -3.1% 15.0%
Other centres/online 25.0% -47.6
Total incremental sales 100.0% 190.5
*Sales expressed inclusive of GST and in $2014/15
**Accounts for expansions
***Allows for expansions and impacts of expansions on the network (i.e. cumulative impacts)
Source: MacroPlan Dimasi
Est. Impacts
Table 6.2
Macquarie Centre - Estimated impacts on specific centres, 2019/20*
Est. Sales (2019/20) Est. Impacts (2019/20)
Section 6: Retail hierarchy impacts
Macquarie Centre Redevelopment Stage 1 Concept DA
Economic Impact Assessment 47
A projection of likely impacts on individual centres must be regarded as indicative only,
since there are many factors that will go to determine the future sales performance of
any shopping or activity centre. Not least amongst those factors are the initiatives or
changes which the centre in question might choose to implement, particularly as a
competitive response to improvements at another centre.
Generally, retail trading impacts between 10% and 15% are considered by the industry to
be significant but acceptable, with impacts less than 10% considered relatively moderate,
and impacts less than 5% generally considered minor/negligible. However, other factors
such as the current trading performance; expansions of centres; potential loss of services
to the community; expected growth in the region; and overall net community benefit
should be considered.
As discussed earlier, we expect the greatest impacts to be absorbed by the closest nearby
regional shopping centres, in particular Chatswood CBD (including both Westfield
Chatswood and Chatswood Chase) and Westfield Hornsby, which are both located within
the defined Macquarie Centre trade area.
We estimate impacts resulting from the proposed expansion to be less than 6% on any
individual centre, with impacts on the four identified regional centres in the network
ranging between 2% and 5%. Indeed, because both Westfield Parramatta and Castle
Towers are both planned to expand in the future, their trading levels are likely to be
significantly greater than their current trading volumes. Estimated impacts on the
Chatswood CBD and Westfield Hornsby are expected to be comfortably absorbed. The
estimated impacts on Westfield Hornsby have regard to the impacts from the proposed
Castle Towers expansion as well as other proposed expansions.
Estimated impacts on the surrounding sub-regional centres are all estimated to be less
than 5%, given the expected composition of the proposed expansion, given Macquarie
Centre already contains all three major supermarkets, and the different role these
centres play in the retail hierarchy (i.e. localised/sub-regional catchments with strong
convenience focus). We estimate impacts on Top Ryde City to be around 4.2% - although
sales are expected to be greater than they are currently as this centre is undergoing a
Section 6: Retail hierarchy impacts
Macquarie Centre Redevelopment Stage 1 Concept DA
Economic Impact Assessment 48
major internal refurbishment that will strengthen its position in its trade area. Without its
Myer store, it is less directly competitive with the surrounding network of regional
shopping centres.
It might well prove to be the case that some of the impacts on some of the centres might
be a little lower than these estimates, while others might be a little higher, again
depending on competitive responses which each of these centres might choose to make.
However, these impacts are considered to be moderate, and will be temporary in nature,
with impacts across all centres expected to dissipate within a year or so, given the
significant future population and retail market growth expected within the trade area.
The likely mix of mini-major tenants is expected to include a selection of unique retailers
and additional international retailers. As such we estimate that there would be some,
though small, impacts on these types of tenants in locations well beyond the trade area,
including the Sydney CBD for example and some potential redirection of business
currently escaping online.
In summary, the proposed expansion of Macquarie Centre represents a relatively minor
addition to the retail network, especially in the context of some of the other major
proposed expansions (e.g. Castle Hill and Westfield Parramatta) evidenced by the very
minor impacts expected across the network.
Impacts of the order estimated are highly unlikely to result in any detrimental impacts on
the surrounding retail/centres hierarchy across northern and western Sydney.
In summary, the proposed expansion of Macquarie Centre will future entrench the centre
as a super-regional centre and allow it to maintain its standing against the expanded
Castle Towers and Westfield Parramatta super-regional centres.
The expansion will be an important element of a broader redevelopment of the
Macquarie Centre which will also provide significant residential and commercial
floorspace within a defined Priority Precinct near a major multi-mode public transport
interchange.
Macquarie Centre Redevelopment Stage 1 Concept DA
Economic Impact Assessment 49
Section 7: Other economic and community impacts
This section of the report examines the net community benefits associated with the
proposed expansion, including employment generation and other economic and social
benefits, as well as examining the impacts of the proposed residential/commercial towers.
7.1 Estimated employment potential
The proposed expansion of Macquarie Centre will result in additional on-going employment
on-site as well as further job creation through the supply chain, across industries servicing
the retail (and non-retail) tenants at the site such as transport workers, wholesalers and the
like.
Furthermore, the construction phase of the project will support temporary construction
related employment, and additional temporary jobs through the broader economic supply
chain (i.e. multiplier impacts).
In estimated the various employment benefits, we have relied upon various data sources
including information from supermarket operators, the ABS, state and local government
agencies, as well as 30 years of experience in preparing assessments of this nature.
Table 7.1 presents the estimates of incremental employment at Macquarie Centre, under the
expansion scenario. These estimates allow for 5% of this total increase to be redirected jobs
as a result of reduced employment at existing retail facilities. As shown, we estimate that in
the order of 1,717 additional jobs could potentially be created as a result of the proposed
expansion.
Importantly, these jobs will be located within a strategically important employment centre
(i.e. Macquarie Business Park) and within the defined boundary of the Macquarie University
Station Priority Precinct.
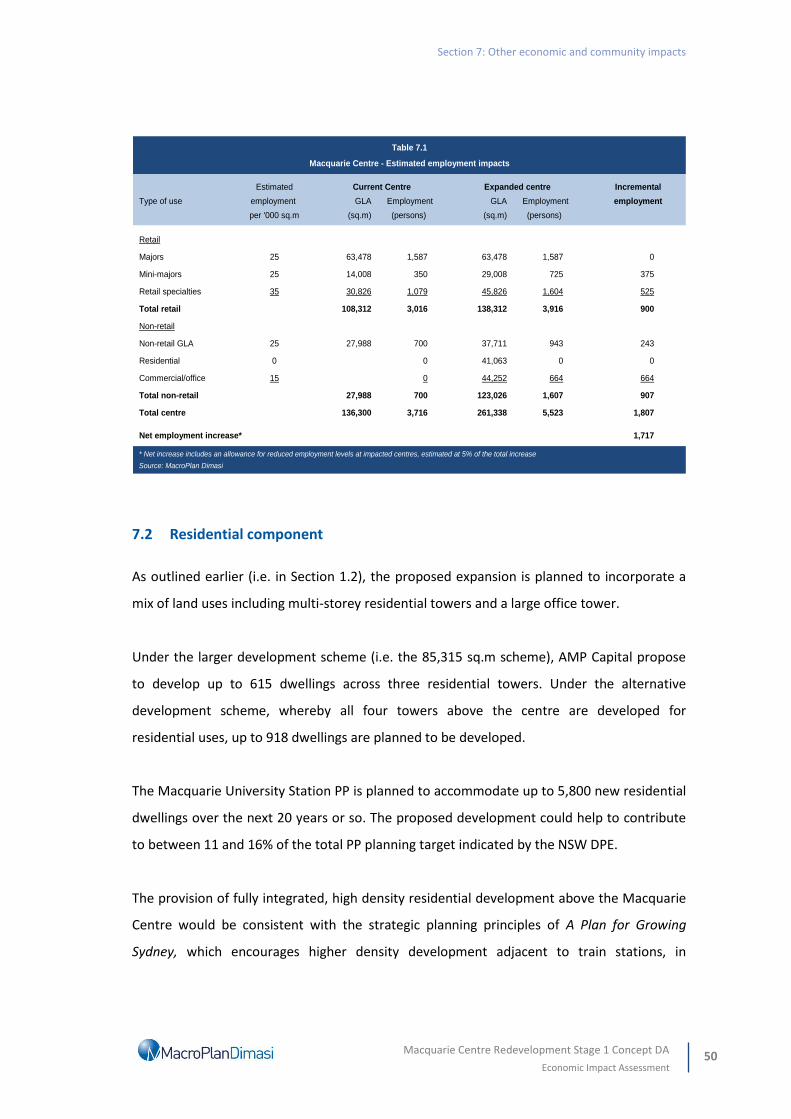
Section 7: Other economic and community impacts
Macquarie Centre Redevelopment Stage 1 Concept DA
Economic Impact Assessment 50
7.2 Residential component
As outlined earlier (i.e. in Section 1.2), the proposed expansion is planned to incorporate a
mix of land uses including multi-storey residential towers and a large office tower.
Under the larger development scheme (i.e. the 85,315 sq.m scheme), AMP Capital propose
to develop up to 615 dwellings across three residential towers. Under the alternative
development scheme, whereby all four towers above the centre are developed for
residential uses, up to 918 dwellings are planned to be developed.
The Macquarie University Station PP is planned to accommodate up to 5,800 new residential
dwellings over the next 20 years or so. The proposed development could help to contribute
to between 11 and 16% of the total PP planning target indicated by the NSW DPE.
The provision of fully integrated, high density residential development above the Macquarie
Centre would be consistent with the strategic planning principles of A Plan for Growing
Sydney, which encourages higher density development adjacent to train stations, in
Estimated Incremental
Type of use employment GLA Employment GLA Employment employment
per '000 sq.m (sq.m) (persons) (sq.m) (persons)
Retail
Majors 25 63,478 1,587 63,478 1,587 0
Mini-majors 25 14,008 350 29,008 725 375
Retail specialties 35 30,826 1,079 45,826 1,604 525
Total retail 108,312 3,016 138,312 3,916 900
Non-retail
Non-retail GLA 25 27,988 700 37,711 943 243
Residential 0 0 41,063 0 0
Commercial/office 15 0 44,252 664 664
Total non-retail 27,988 700 123,026 1,607 907
Total centre 136,300 3,716 261,338 5,523 1,807
Net employment increase* 1,717
* Net increase includes an allowance for reduced employment levels at impacted centres, estimated at 5% of the total increase
Source: MacroPlan Dimasi
Table 7.1
Macquarie Centre - Estimated employment impacts
Current Centre Expanded centre
Section 7: Other economic and community impacts
Macquarie Centre Redevelopment Stage 1 Concept DA
Economic Impact Assessment 51
particular a key interchange stations like the Macquarie University Station PP; high density
residential development near major employment precincts (i.e. Macquarie Park); and
accommodation facilities near a major University.
Mixed use/residential development above shopping centres is considered to be consistent
with the principles of sustainable planning, resulting in significant net community benefits.
Because Macquarie Park is primarily an employment destination, additional residential
population within Macquarie Park will help to activate the precinct, including the main street
(i.e. Herring Road) for longer periods during a typical weekday and over weekends, when
most of the 45,000 workers are not present.
The proposed development concept has already occurred in other parts of metropolitan
Sydney, and indeed, within the Ryde LGA. Recent examples of similar integrated
development across metropolitan Sydney include Top Ryde City Shopping Centre – in the
Ryde LGA; Central Park in Chippendale; and East Village in Zetland/Waterloo.
7.3 Commercial component
The larger of the two potential development scenarios includes a major commercial office
tower of 44,252 sq.m. As indicated in Table 7.1 above this tower could potentially sustain
around 650 – 700 workers in itself.
Most of the office stock around Macquarie Park is in the form of campus style commercial
office product, often with entire companies occupying individual buildings. There are many
national headquarters and there is a high proportion of pharmaceutical and technology
companies.
The provision of a multi-storey office tower above Macquarie Park would create additional
employment/business opportunities in Macquarie Park for smaller tenants. For example, a
multi-storey office tower would cater to small-medium sized businesses that may only
require 50 – 500 sq. of floorspace, in addition to major tenants that could occupy several
floors.
Section 7: Other economic and community impacts
Macquarie Centre Redevelopment Stage 1 Concept DA
Economic Impact Assessment 52
As with most new major office developments in Sydney, a minimum level of pre-
commitments would be required from major tenants before such a development would
proceed, so we would expect the tenancy mix would include some major tenants, which
would further enhance the branding/status of Macquarie Park as one of Sydney’s leading
office/employment markets.
The proximity of multi-storey office development near a multi-modal public transport
interchange is entirely consistent with A Plan for Growing Sydney i.e. the strategic direction
of the NSW DPE. Such development would provide employment opportunities in Macquarie
Park that would be effectively integrated with a major transport interchange. At present, due
to the large floorplate/low rise development that has characterised Macquarie Park, many
parts of the business park are an inconvenient walking distance from either of the two train
stations servicing the business park.
With the office tower fully integrated with the Macquarie Centre, workers could undertake
shopping; access breakfast/lunch/snacks/dinner; drop kids to childcare; go to the gym; and
access public transport; all within a very short walk from their place of work.
7.4 Net community benefit
In addition to the clear employment benefits, the significant expansion of Macquarie Centre
would provide a range of community benefits to residents of the surrounding region and
visitors from across broader metropolitan Sydney, including:
An important catalyst to unlocking a ‘main street’ outcome along Herring Road.
Improved integration and connectivity between Macquarie Centre, Macquarie University
Station and the existing bus interchange – (i.e. will encourage/facilitate movements
between rail and bus).
An improved interface with Herring Road that is likely to include of alfresco dining and
other retailing that embraces the main street, creating a ‘sense of place’.
Section 7: Other economic and community impacts
Macquarie Centre Redevelopment Stage 1 Concept DA
Economic Impact Assessment 53
Increased choice and amenity for residents, workers and students, and therefore
potential customers.
A wider range of retail tenancies and a diversified retail mix, including new mini-major
tenants and potential new retail/entertainment concepts to the Australian marketplace,
reflecting the changing nature of the retail environment.
Strengthening and future-proofing Macquarie Centre as an important super-regional
centre in north-west Sydney, allowing it to maintain its position against major expansions
planned for Westfield Parramatta and Castle Towers.
New high density residential and commercial development within a defined PP (i.e.
consistency with the strategic planning policy of the NSW DPE), and would help to meet
residential and employment targets for the PP.
The proposed development would create a fully integrated neighbourhood for working,
shopping and living, all within proximity to the Macquarie University Station transport
interchange.


![Stage technologies design concept[1]](https://img.pdfslide.net/doc/110x75/55854e01d8b42a0a3a8b49d1/stage-technologies-design-concept1.jpg)