Embed Size (px)
Citation preview
Macquarie Infrastructure Corporation 125 West 55th Street New York, NY10019 United States
Telephone +1 212 231 1825 Facsimile +1 212 231 1828 Internet: www.macquarie.com/mic
1
1
FOR IMMEDIATE RELEASE
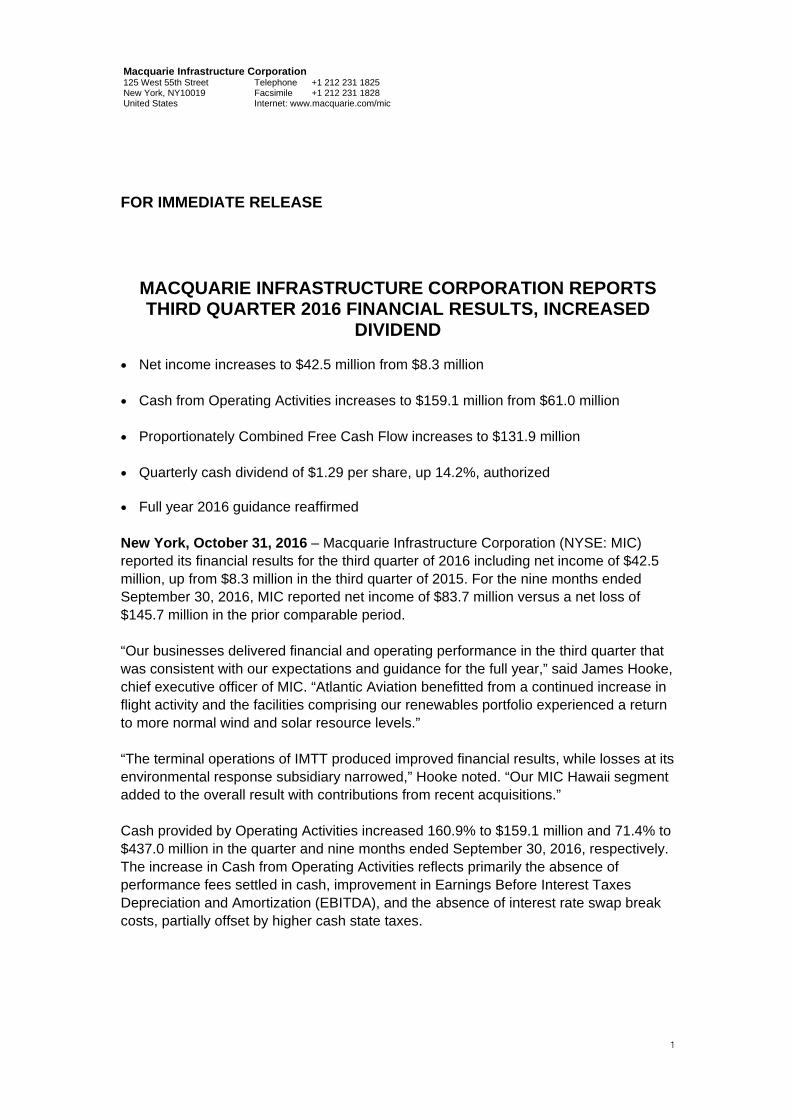
MACQUARIE INFRASTRUCTURE CORPORATION REPORTS THIRD QUARTER 2016 FINANCIAL RESULTS, INCREASED
DIVIDEND • Net income increases to $42.5 million from $8.3 million • Cash from Operating Activities increases to $159.1 million from $61.0 million • Proportionately Combined Free Cash Flow increases to $131.9 million • Quarterly cash dividend of $1.29 per share, up 14.2%, authorized
• Full year 2016 guidance reaffirmed New York, October 31, 2016 – Macquarie Infrastructure Corporation (NYSE: MIC) reported its financial results for the third quarter of 2016 including net income of $42.5 million, up from $8.3 million in the third quarter of 2015. For the nine months ended September 30, 2016, MIC reported net income of $83.7 million versus a net loss of $145.7 million in the prior comparable period. “Our businesses delivered financial and operating performance in the third quarter that was consistent with our expectations and guidance for the full year,” said James Hooke, chief executive officer of MIC. “Atlantic Aviation benefitted from a continued increase in flight activity and the facilities comprising our renewables portfolio experienced a return to more normal wind and solar resource levels.” “The terminal operations of IMTT produced improved financial results, while losses at its environmental response subsidiary narrowed,” Hooke noted. “Our MIC Hawaii segment added to the overall result with contributions from recent acquisitions.” Cash provided by Operating Activities increased 160.9% to $159.1 million and 71.4% to $437.0 million in the quarter and nine months ended September 30, 2016, respectively. The increase in Cash from Operating Activities reflects primarily the absence of performance fees settled in cash, improvement in Earnings Before Interest Taxes Depreciation and Amortization (EBITDA), and the absence of interest rate swap break costs, partially offset by higher cash state taxes.
2
Proportionately Combined Free Cash Flow (“PCFCF”) increased 42.2% to $131.9 million and 34.2% to $391.6 million in the quarter and nine months ended September 30, 2016, respectively. The increases were primarily the result of improved operations, including contributions from acquisitions in 2015 and 2016, and do not reflect adjustments made to exclude the impact of interest rate swap breaks costs of $19.2 million and $50.6 million in the quarter and year to date periods, respectively, and $9.3 million of transaction-related in the year to date figures in 2015. Adjusted for these items, the increase in PCFCF would have been 17.6% for the quarter and 11.4% for the nine month period. See “Use of Non-GAAP Measures” below for MIC’s definition of PCFCF and the attached tables for a reconciliation of non-GAAP measures including PCFCF to the most comparable GAAP measures. The weighted average number of MIC shares outstanding during the quarter ended September 30, 2016 increased 2.0% to 81,220,841 versus the prior comparable period. The increase was primarily the result of the reinvestment by MIC’s manager on August 1, 2016 of a previously deferred performance fee and the monthly reinvestment of base management fees. The MIC board of directors authorized a cash dividend of $1.29 per share, or $5.16 annualized, for the third quarter of 2016. The dividend will be payable November 15, 2016 to shareholders of record on November 10, 2016. The cash payment represents a 14.2% increase over the dividend paid for the third quarter of 2015. MIC reaffirmed its expectation that it will deliver a previously announced full-year 2016 dividend of between $5.00 and $5.10 per share, up from $4.46 in 2015. “Including the dividend to be paid in November, we will have returned $3.74 per share in cash to shareholders, or a payout of approximately 77.0% of PCFCF based on the Company’s financial performance in 2016,” said Hooke. The payment of any future dividend is predicated on the continued stable performance of MIC’s businesses and authorization by the Company’s board of directors. MIC made total capital expenditures of $79.4 million and $198.2 million in the quarter and nine month periods ended September 30, 2016, respectively. In addition, the Company completed bolt-on acquisitions having an aggregate value of $22.4 million and $48.9 million in the same two periods. MIC’s combined expenditures on growth projects and bolt-on acquisitions totaled $78.0 million and $201.2 million in the quarter and year to date periods ended September 30, 2016, respectively. The Company has also entered into agreements for additional acquisitions and investments that are expected to result in the deployment of approximately $50.0 million prior to year-end. “We have effectively achieved our capital deployment objectives for 2016 at this point having allocated approximately $150.0 million to growth projects and $100.0 to bolt-on acquisitions,” Hooke stated. “For the full year we now expect total growth capital expenditures to be approximately $300.0 million – a level that increases our confidence
3
in our ability to deploy a forecast $350.0 million in 2017.” As of the end of September, MIC reported having a backlog of approved growth projects with a value of more than $340.0 million including the pending commitments. Following the quarter end, MIC completed the refinancing of the long-term debt of Atlantic Aviation. The previous Atlantic credit facility, consisting of a $595.9 million term loan and an undrawn $70.0 million revolving credit facility, was replaced with a $400.0 million term loan and $350.0 million revolving credit facility, of which $200.0 million was drawn at closing. MIC subsequently purchased an interest rate cap limiting the potential increase in the LIBOR component of the term loan coupon to 1.0% for total consideration of $8.6 million. MIC also completed a public offering of $402.5 million of seven-year, convertible senior notes including notes offered pursuant to the underwriters’ exercise of an over-allotment option of $52.5 million. Net proceeds of the offering were used primarily to pay down approximately $175.0 million of the outstanding balance on Atlantic Aviation’s new revolving credit facility and other revolving credit facilities, to fund a portion of the announced growth projects and to pay costs including approximately $17.8 million of interest rate swap break fees. The notes bear interest at a rate of 2% per annum, are convertible only upon satisfaction of certain conditions and during certain periods and may, at MIC’s option, be settled upon conversion in shares, cash or a combination thereof. Summary of Consolidated (GAAP) Results for the Quarter and Nine Months Ended September 30, 2016 MIC reported growth in revenue of 1.2% to $420.5 million for the quarter and a decrease of 1.9% to $1,214.5 million in the nine month period. Changes in revenue reflect, in part, fluctuations in the cost of energy inputs such as jet fuel and gas. The pass-through of energy input costs, up or down, makes gross profit – revenue less direct expenses - effectively the “top line” to which MIC manages its businesses. The decrease in revenue in the nine month period was entirely offset by a decrease in direct expenses primarily related to the decline in the cost of energy inputs recorded in cost of services/cost of product sales. Gross profit increased 4.2% to $246.2 million and 6.1% to $734.7 million in the quarter and nine months ended September 30, 2016, respectively. The growth in the quarter reflects increased flight activity and contributions from sites acquired by Atlantic Aviation, an improvement in wind and solar resources and the addition of gross profit from acquisitions in 2016. Through nine months, the improvement also includes the incremental gross profit in the first quarter related to the acquisition of BEC and favorable changes in the value of commodity hedges. Selling, general and administrative expenses increased by 4.8% to $77.5 million in the third quarter and decreased by 1.5% to $222.2 million for the nine months ended September 30, 2016. The increase in expenses for the quarter reflects primarily costs
4
related to the evaluation of various acquisition and investment opportunities and the expenses associated with acquired businesses.
The decrease in selling, general and administrative expenses for the nine month period reflects primarily a reduction in transaction related expenses and the absence of costs related to the conversion of MIC from a limited liability company to a corporation, partially offset by the incremental one quarter of costs associated with BEC. The consolidated items above resulted in MIC reporting net income of $42.5 million and $83.7 million in the quarter and nine months ended September 30, 2016, respectively, compared with net income of $8.3 million and a net loss of $145.7 million in the prior comparable periods. Summary of Proportionately Combined (non-GAAP) Results for the Quarter and Nine Months Ended September 30, 2016
The following items are discussed on a proportionately combined basis reflective of MIC’s partial interest in certain of its businesses. See “Use of Non-GAAP Measures” below for MIC’s definition of Free Cash Flow, EBITDA excluding Non-Cash Items and proportionately combined metrics as well as further information on MIC’s use of these measures. See also the reconciliations of non-GAAP measures to the comparable GAAP measures attached to this release. MIC’s EBITDA excluding non-cash items increased 14.7% to $183.9 million and 12.5% to $521.0 million in the quarter and nine months ended September 30, 2016, respectively. The increases reflect primarily the growth in gross profit, and approximately $13.0 million of insurance proceeds recorded in Other income, net, partially offset in the quarter by higher selling, general and administrative expenses. Excluding the insurance proceeds, EBITDA would have increased by 6.5%. Cash interest expense decreased in the quarter and nine months periods versus the prior comparable periods primarily as a result of a reduction in weighted average interest rates partially offset by higher average balances outstanding on debt facilities. Cash taxes increased primarily as a result of the absence of any performance fees and associated tax benefits in 2016 versus the comparable periods in 2015. MIC files a consolidated federal income tax return and any federal income tax liability generated by its operating companies in 2016, other than Alternative Minimum Tax, is expected to be offset by the application of net operating loss carryforwards available at the holding company level. Maintenance capital expenditures increased in both the third quarter and year to date periods versus the comparable periods in 2015. Of the increase, $13.9 million in both periods relates to expenditures for the repair of damage to IMTT docks that were insured losses. The insurance recoveries are recorded as a component of Other Income, net in both IMTT segment and MIC consolidated statements of operations.
5
MIC’s Free Cash Flow increased to $131.9 million in the third quarter of 2016 and to $391.6 million through nine months versus $92.8 million and $291.8 million in the comparable periods in 2015. The comparable period figures do not reflect adjustments made to exclude the impact of interest rate swap breaks costs of $19.2 million and $50.6 million in the quarter and year to date periods, respectively, and $9.3 million of transaction-related in the year to date figure. Conference Call and Webcast
When: Management has scheduled a conference call for 8:00 a.m. Eastern Time on Tuesday, November 1, 2016 during which it will review and comment on the Company’s results for the third quarter. How: To listen to the conference call please dial +1(650) 521-5252 or +1(877) 852-2928 at least 10 minutes prior to the scheduled start time. A webcast of the call will be accessible via the Company’s website at www.macquarie.com/mic. Please allow extra time prior to the call to visit the site and download the necessary software to listen to the webcast. Slides: The Company will prepare materials in support of its conference call presentation. The materials will be available for downloading from the Company’s website prior to the conference call. Replay: For interested individuals unable to participate in the live conference call, a replay will be available after 2:00 p.m. on November 1, 2016 through midnight on November 7, 2016, at +1(404) 537-3406 or +1(855) 859-2056, Passcode: 49732812. An online archive of the webcast will be available on the Company’s website for one year following the call. MIC-G About MIC
MIC owns, operates and invests in a diversified group of businesses providing basic services to customers in the United States. Its businesses consist of a bulk liquid terminals business, International-Matex Tank Terminals, an airport services business, Atlantic Aviation, entities comprising an energy services, production and distribution segment, MIC Hawaii, and entities comprising a Contracted Power and Energy segment. For additional information, please visit the MIC website at www.macquarie.com/mic. MIC-G Use of Non-GAAP Measures In addition to MIC’s results under U.S. GAAP, the Company uses certain non-GAAP measures to assess the performance and prospects of its businesses. In particular, MIC uses Free Cash Flow, EBITDA excluding non-cash items and certain proportionately combined financial metrics. See the reconciliations of these non-GAAP measures to the comparable GAAP measures in the tables attached to this release.
6
In analyzing the financial performance of its businesses, MIC focuses primarily on cash generation and Free Cash Flow in particular. MIC believes investors use Free Cash Flow as a measure of its ability to sustain and potentially increase its quarterly cash dividend and to fund a portion of its growth. MIC measures EBITDA excluding non-cash items as it reflects its businesses’ ability to effectively manage the volume of products sold or services provided, the margin earned on those transactions and the management of operating expenses independent of the capitalization and tax attributes of those businesses. Given MIC’s varied ownership levels in some of its businesses, principally in the CP&E segment, together with its obligations to report the results of these businesses on a consolidated basis, management believes that GAAP measures such as net income (loss) do not fully reflect all of the items it considers in assessing the amount of cash generated based on its ownership interest in its businesses. Proportionately combined financial metrics reflect MIC Corporate and its ownership interest in each of its businesses. MIC notes that the proportionately combined metrics used may be calculated in a different manner by other companies and may limit their usefulness as a comparative measure. Therefore, proportionately combined metrics should be used as a supplemental measure to help understand MIC’s financial performance and not in lieu of financial results reported under GAAP. MIC defines Free Cash Flow, including Proportionately Combined Free Cash Flow (PCFCF), as cash from operating activities —the most comparable GAAP measure — which includes cash paid for interest, taxes and pension contributions, less maintenance capital expenditures, which includes principal repayments on capital lease obligations used to fund maintenance capital expenditures, and excludes changes in working capital. MIC defines EBITDA excluding non-cash items as net income (loss) or earnings —the most comparable GAAP measure— before interest, taxes, depreciation and amortization and non-cash items including impairments, unrealized derivative gains and losses and adjustments for other non-cash items reflected in the statements of operations. EBITDA excluding non-cash items also excludes base management fees and performance fees, if any, whether paid in cash or stock. In its Quarterly Report on Form 10-Q, MIC has disclosed Free Cash Flow on a consolidated basis and for each of its operating segments and MIC Corporate. The Company believes that both Free Cash Flow and EBITDA excluding non-cash items support a more complete understanding of the business factors and economic trends reflected in the financial performance of its businesses than would otherwise be achieved using GAAP results alone. Free Cash Flow reflects the ability of MIC businesses to generate cash on an ongoing basis, in part in support of its dividend and to fund a portion of its growth. MIC characterizes its businesses as owners of high-value, long-lived assets which are capable of generating Free Cash Flow in excess of GAAP net income as a result of: (i) non-cash depreciation, amortization and any impairment charges; (ii) the Company’s ability to defer all or a portion of current federal income taxes; (iii) non-cash unrealized gains or losses on derivative instruments; and, (iv) various other non-cash items such as
7
pension expense, amortization of tolling liabilities and gains (losses) on disposal of assets. The non-cash pension expense primarily consists of interest cost, expected return on plan assets and amortization of actuarial and performance gains and losses. Any cash contributions to pension plans are reflected as a reduction to Free Cash Flow, as noted above. In addition, management uses Free Cash Flow as a measure of the Company’s ability to sustain and potentially increase its quarterly cash dividend and to fund a portion of its growth. MIC believes that external consumers of its financial statements, including investors and research analysts, use this metric to assess the Company’s performance and as an indicator of its success in generating a cash return on investment. Free Cash Flow does not take into consideration required payments on indebtedness and other fixed obligations or the other cash items that are excluded from MIC’s definition of Free Cash Flow. The Company notes that Free Cash Flow may be calculated differently by other companies thereby limiting its usefulness as a comparative measure. Free Cash Flow should be used as a supplemental measure to help understand MIC’s financial performance and not in lieu of its financial results reported under GAAP. Classification of Maintenance Capital Expenditures and Growth Capital Expenditures MIC categorizes capital expenditures as either maintenance capital expenditures or growth capital expenditures. As neither maintenance capital expenditure nor growth capital expenditure is a GAAP term, the Company has adopted a framework to categorize specific capital expenditures. In broad terms, maintenance capital expenditures primarily maintain its businesses at current levels of operations, capability, profitability or cash flow, while growth capital expenditures primarily provide new or enhanced levels of operations, capability, profitability or cash flow. MIC management considers a number of factors in determining whether a specific capital expenditure will be classified as maintenance or growth. In some cases, specific capital expenditures contain characteristics of both maintenance and growth capital expenditures. MIC does not bifurcate specific capital expenditures into growth and maintenance components. Each discrete capital expenditure is considered within the above framework and the entire capital expenditure is classified as either maintenance or growth. Forward-Looking Statements
This press release contains forward-looking statements. MIC may, in some cases, use words such as "project”, "believe”, "anticipate”, "plan”, "expect”, "estimate”, "intend”, "should”, "would”, "could”, "potentially”, or "may” or other words that convey uncertainty of future events or outcomes to identify these forward-looking statements. Forward-looking statements in this release are subject to a number of risks and uncertainties, some of which are beyond MIC’s control including, among other things: changes in general economic or business conditions; its ability to service, comply with the terms of
8
and refinance debt, successfully integrate and manage acquired businesses, retain or replace qualified employees, manage growth, make and finance future acquisitions, and implement its strategy; risks associated with development, investment and expansion in the power industry; its regulatory environment establishing rate structures and monitoring quality of service; demographic trends, the political environment, the economy, tourism, construction and transportation costs, air travel, environmental costs and risks; fuel and gas and other commodity costs; its ability to recover increases in costs from customers, cybersecurity risks, work interruptions or other labor stoppages, reliance on sole or limited source suppliers, risks or conflicts of interests involving its relationship with the Macquarie Group and changes in U.S. federal tax law.
MIC’s actual results, performance, prospects or opportunities could differ materially from those expressed in or implied by the forward-looking statements. Additional risks of which MIC is not currently aware could also cause its actual results to differ. In light of these risks, uncertainties and assumptions, you should not place undue reliance on any forward-looking statements. The forward-looking events discussed in this release may not occur. These forward-looking statements are made as of the date of this release. MIC undertakes no obligation to publicly update or revise any forward-looking statements, whether as a result of new information, future events or otherwise, except as required by law.
“Macquarie Group” refers to the Macquarie Group of companies, which comprises Macquarie Group Limited and its worldwide subsidiaries and affiliates. Macquarie Infrastructure Corporation is not an authorized deposit-taking institution for the purposes of the Banking Act 1959 (Commonwealth of Australia) and its obligations do not represent deposits or other liabilities of Macquarie Bank Limited ABN 46 008 583 542 (MBL). MBL does not guarantee or otherwise provide assurance in respect of the obligations of Macquarie Infrastructure Corporation.
For further information, please contact:
Investor enquiries Jay A. Davis Investor Relations MIC (212) 231-1825
Media enquiries Melissa McNamara Corporate Communications MIC (212) 231-1667
Michael Hacke Investor Relations MIC (212) 231-6483
9
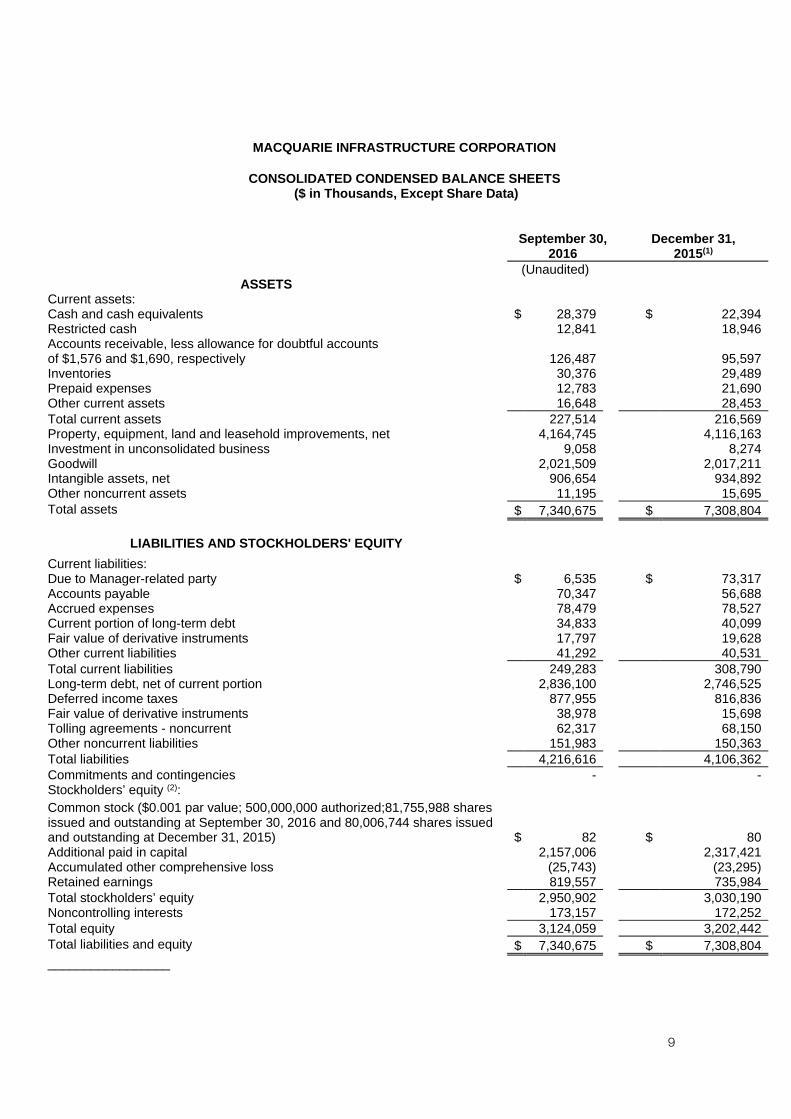
MACQUARIE INFRASTRUCTURE CORPORATION
CONSOLIDATED CONDENSED BALANCE SHEETS ($ in Thousands, Except Share Data)
September 30, 2016
December 31, 2015(1)
(Unaudited) ASSETS
Current assets: Cash and cash equivalents $ 28,379 $ 22,394Restricted cash 12,841 18,946Accounts receivable, less allowance for doubtful accounts of $1,576 and $1,690, respectively 126,487 95,597Inventories 30,376 29,489Prepaid expenses 12,783 21,690Other current assets 16,648 28,453Total current assets 227,514 216,569Property, equipment, land and leasehold improvements, net 4,164,745 4,116,163Investment in unconsolidated business 9,058 8,274Goodwill 2,021,509 2,017,211Intangible assets, net 906,654 934,892Other noncurrent assets 11,195 15,695Total assets $ 7,340,675 $ 7,308,804
LIABILITIES AND STOCKHOLDERS' EQUITY
Current liabilities: Due to Manager-related party $ 6,535 $ 73,317Accounts payable 70,347 56,688Accrued expenses 78,479 78,527Current portion of long-term debt 34,833 40,099Fair value of derivative instruments 17,797 19,628Other current liabilities 41,292 40,531Total current liabilities 249,283 308,790Long-term debt, net of current portion 2,836,100 2,746,525Deferred income taxes 877,955 816,836Fair value of derivative instruments 38,978 15,698Tolling agreements - noncurrent 62,317 68,150Other noncurrent liabilities 151,983 150,363Total liabilities 4,216,616 4,106,362Commitments and contingencies - -Stockholders’ equity (2): Common stock ($0.001 par value; 500,000,000 authorized;81,755,988 shares issued and outstanding at September 30, 2016 and 80,006,744 shares issued and outstanding at December 31, 2015) $ 82 $ 80Additional paid in capital 2,157,006 2,317,421Accumulated other comprehensive loss (25,743) (23,295)Retained earnings 819,557 735,984Total stockholders’ equity 2,950,902 3,030,190Noncontrolling interests 173,157 172,252Total equity 3,124,059 3,202,442Total liabilities and equity $ 7,340,675 $ 7,308,804_________________
10
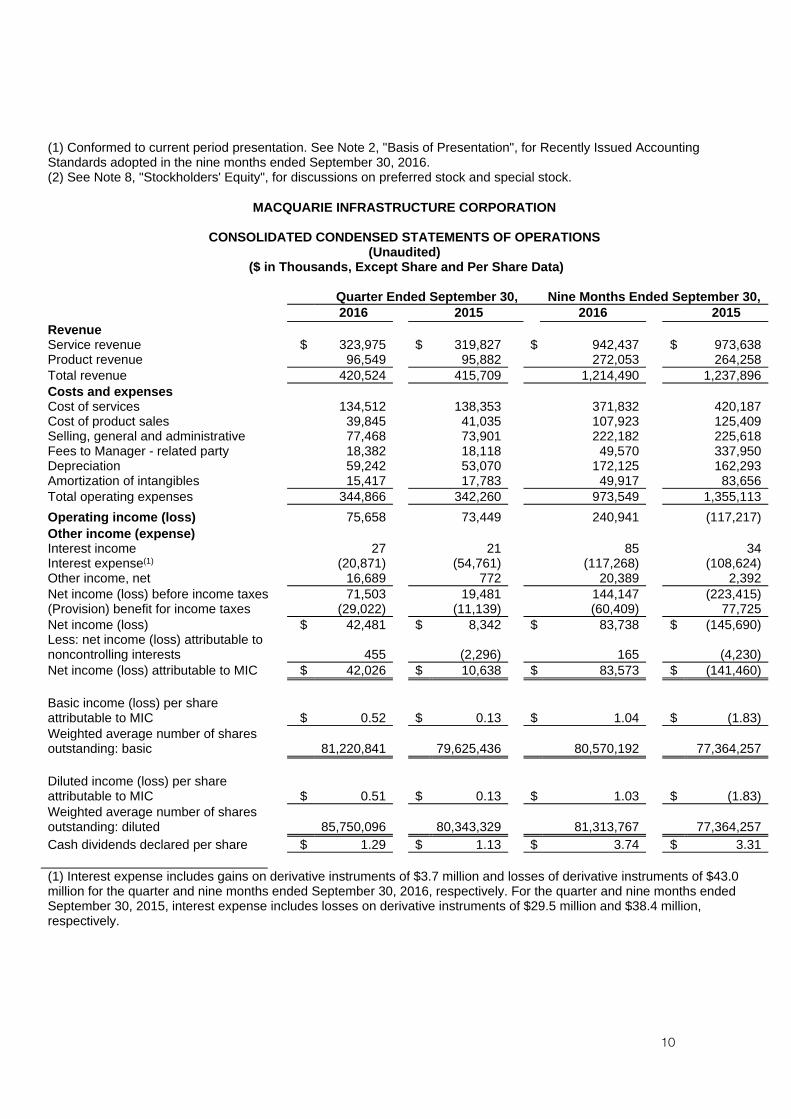
(1) Conformed to current period presentation. See Note 2, "Basis of Presentation", for Recently Issued Accounting Standards adopted in the nine months ended September 30, 2016. (2) See Note 8, "Stockholders' Equity", for discussions on preferred stock and special stock.
MACQUARIE INFRASTRUCTURE CORPORATION
CONSOLIDATED CONDENSED STATEMENTS OF OPERATIONS (Unaudited)
($ in Thousands, Except Share and Per Share Data) Quarter Ended September 30, Nine Months Ended September 30, 2016 2015 2016 2015
Revenue Service revenue $ 323,975 $ 319,827 $ 942,437 $ 973,638Product revenue 96,549 95,882 272,053 264,258Total revenue 420,524 415,709 1,214,490 1,237,896Costs and expenses Cost of services 134,512 138,353 371,832 420,187Cost of product sales 39,845 41,035 107,923 125,409Selling, general and administrative 77,468 73,901 222,182 225,618Fees to Manager - related party 18,382 18,118 49,570 337,950Depreciation 59,242 53,070 172,125 162,293Amortization of intangibles 15,417 17,783 49,917 83,656Total operating expenses 344,866 342,260 973,549 1,355,113
Operating income (loss) 75,658 73,449 240,941 (117,217)Other income (expense) Interest income 27 21 85 34Interest expense(1) (20,871) (54,761) (117,268) (108,624)Other income, net 16,689 772 20,389 2,392Net income (loss) before income taxes 71,503 19,481 144,147 (223,415)(Provision) benefit for income taxes (29,022) (11,139) (60,409) 77,725Net income (loss) $ 42,481 $ 8,342 $ 83,738 $ (145,690)Less: net income (loss) attributable to noncontrolling interests 455 (2,296) 165 (4,230)Net income (loss) attributable to MIC $ 42,026 $ 10,638 $ 83,573 $ (141,460) Basic income (loss) per share attributable to MIC $ 0.52 $ 0.13 $ 1.04 $ (1.83)Weighted average number of shares outstanding: basic 81,220,841 79,625,436 80,570,192 77,364,257 Diluted income (loss) per share attributable to MIC $ 0.51 $ 0.13 $ 1.03 $ (1.83)Weighted average number of shares outstanding: diluted 85,750,096 80,343,329 81,313,767 77,364,257Cash dividends declared per share $ 1.29 $ 1.13 $ 3.74 $ 3.31
(1) Interest expense includes gains on derivative instruments of $3.7 million and losses of derivative instruments of $43.0 million for the quarter and nine months ended September 30, 2016, respectively. For the quarter and nine months ended September 30, 2015, interest expense includes losses on derivative instruments of $29.5 million and $38.4 million, respectively.
11
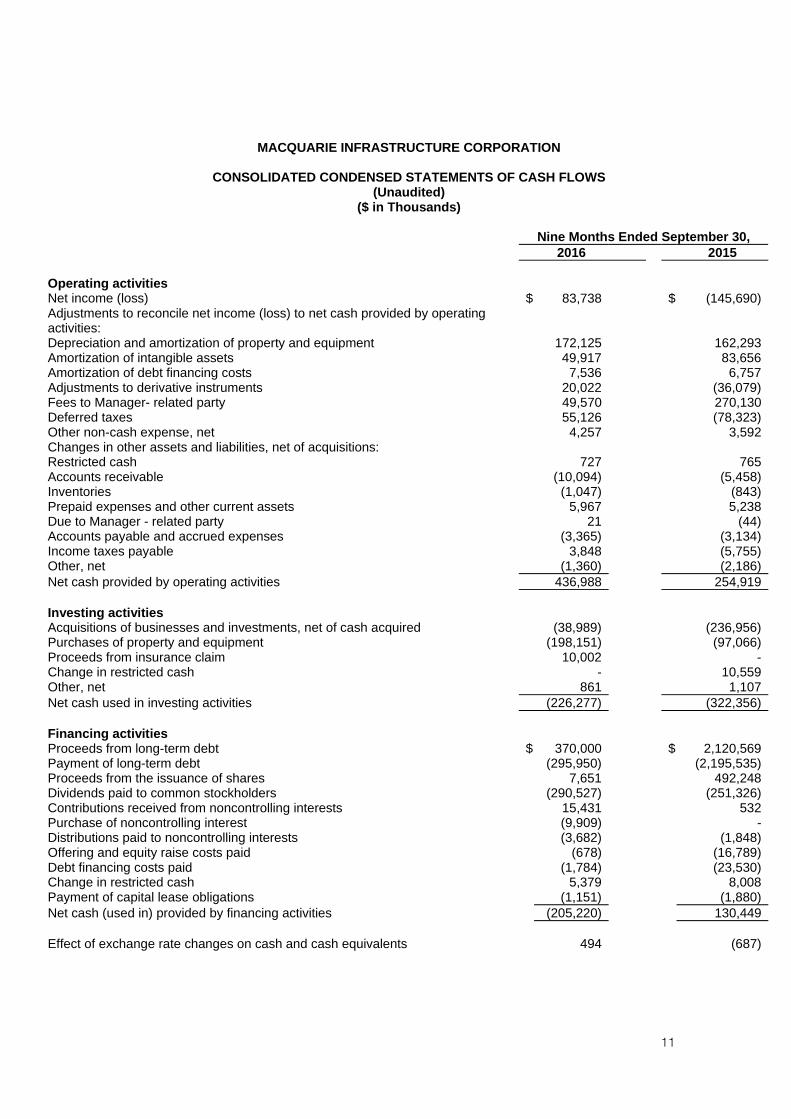
MACQUARIE INFRASTRUCTURE CORPORATION
CONSOLIDATED CONDENSED STATEMENTS OF CASH FLOWS (Unaudited)
($ in Thousands) Nine Months Ended September 30, 2016 2015
Operating activities Net income (loss) $ 83,738 $ (145,690)Adjustments to reconcile net income (loss) to net cash provided by operating activities: Depreciation and amortization of property and equipment 172,125 162,293 Amortization of intangible assets 49,917 83,656 Amortization of debt financing costs 7,536 6,757 Adjustments to derivative instruments 20,022 (36,079) Fees to Manager- related party 49,570 270,130 Deferred taxes 55,126 (78,323) Other non-cash expense, net 4,257 3,592 Changes in other assets and liabilities, net of acquisitions: Restricted cash 727 765 Accounts receivable (10,094) (5,458) Inventories (1,047) (843) Prepaid expenses and other current assets 5,967 5,238 Due to Manager - related party 21 (44) Accounts payable and accrued expenses (3,365) (3,134) Income taxes payable 3,848 (5,755) Other, net (1,360) (2,186) Net cash provided by operating activities 436,988 254,919
Investing activities Acquisitions of businesses and investments, net of cash acquired (38,989) (236,956)Purchases of property and equipment (198,151) (97,066)Proceeds from insurance claim 10,002 -Change in restricted cash - 10,559Other, net 861 1,107Net cash used in investing activities (226,277) (322,356)
Financing activities Proceeds from long-term debt $ 370,000 $ 2,120,569Payment of long-term debt (295,950) (2,195,535)Proceeds from the issuance of shares 7,651 492,248Dividends paid to common stockholders (290,527) (251,326)Contributions received from noncontrolling interests 15,431 532Purchase of noncontrolling interest (9,909) -Distributions paid to noncontrolling interests (3,682) (1,848)Offering and equity raise costs paid (678) (16,789)Debt financing costs paid (1,784) (23,530)Change in restricted cash 5,379 8,008Payment of capital lease obligations (1,151) (1,880)Net cash (used in) provided by financing activities (205,220) 130,449
Effect of exchange rate changes on cash and cash equivalents 494 (687)
12
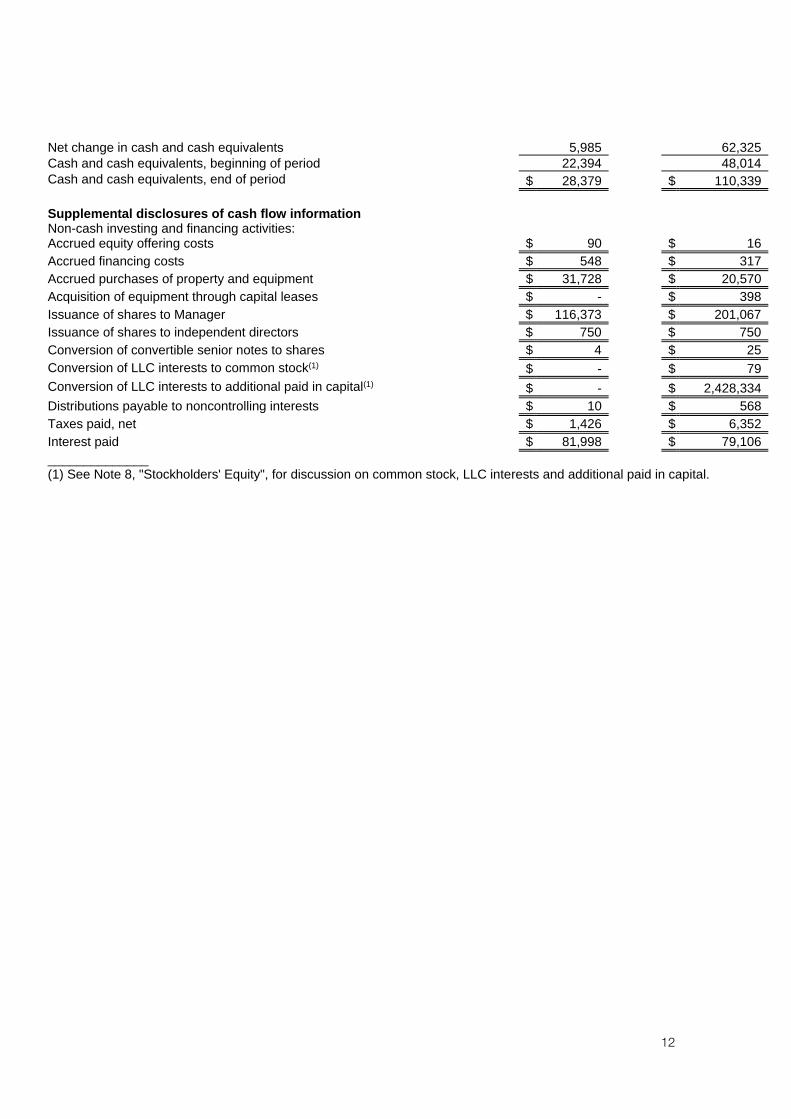
Net change in cash and cash equivalents 5,985 62,325Cash and cash equivalents, beginning of period 22,394 48,014Cash and cash equivalents, end of period $ 28,379 $ 110,339
Supplemental disclosures of cash flow information Non-cash investing and financing activities: Accrued equity offering costs $ 90 $ 16 Accrued financing costs $ 548 $ 317 Accrued purchases of property and equipment $ 31,728 $ 20,570 Acquisition of equipment through capital leases $ - $ 398 Issuance of shares to Manager $ 116,373 $ 201,067 Issuance of shares to independent directors $ 750 $ 750 Conversion of convertible senior notes to shares $ 4 $ 25 Conversion of LLC interests to common stock(1) $ - $ 79
Conversion of LLC interests to additional paid in capital(1) $ - $ 2,428,334
Distributions payable to noncontrolling interests $ 10 $ 568 Taxes paid, net $ 1,426 $ 6,352Interest paid $ 81,998 $ 79,106______________ (1) See Note 8, "Stockholders' Equity", for discussion on common stock, LLC interests and additional paid in capital.
13
13
MACQUARIE INFRASTRUCTURE CORPORATION
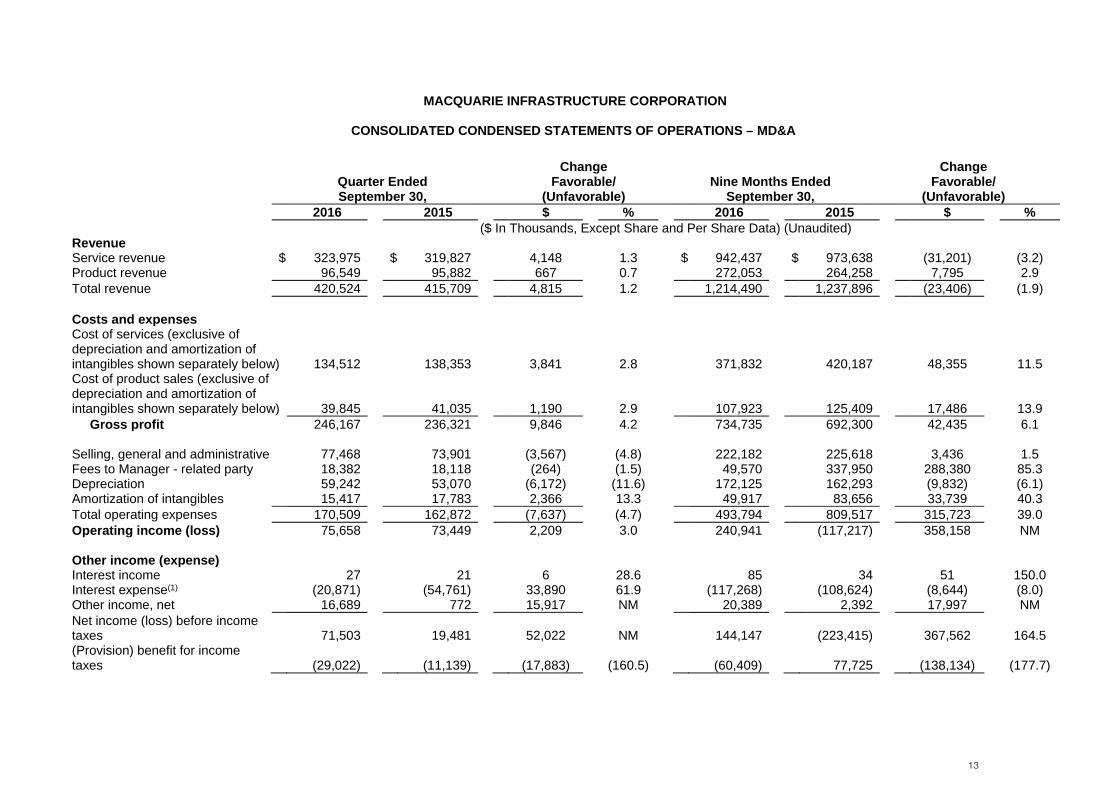
CONSOLIDATED CONDENSED STATEMENTS OF OPERATIONS – MD&A
Quarter Ended September 30,
Change Favorable/
(Unfavorable)
Nine Months Ended September 30,
Change Favorable/
(Unfavorable) 2016 2015 $ % 2016 2015 $ % ($ In Thousands, Except Share and Per Share Data) (Unaudited)
Revenue Service revenue $ 323,975 $ 319,827 4,148 1.3 $ 942,437 $ 973,638 (31,201) (3.2) Product revenue 96,549 95,882 667 0.7 272,053 264,258 7,795 2.9 Total revenue 420,524 415,709 4,815 1.2 1,214,490 1,237,896 (23,406) (1.9) Costs and expenses Cost of services (exclusive of depreciation and amortization of intangibles shown separately below) 134,512 138,353 3,841 2.8 371,832 420,187 48,355 11.5 Cost of product sales (exclusive of depreciation and amortization of intangibles shown separately below) 39,845 41,035 1,190 2.9 107,923 125,409 17,486 13.9 Gross profit 246,167 236,321 9,846 4.2 734,735 692,300 42,435 6.1 Selling, general and administrative 77,468 73,901 (3,567) (4.8) 222,182 225,618 3,436 1.5 Fees to Manager - related party 18,382 18,118 (264) (1.5) 49,570 337,950 288,380 85.3 Depreciation Amortization of intangibles
59,242 53,070 (6,172) (11.6) 172,125 162,293 (9,832) (6.1) 15,417 17,783 2,366 13.3 49,917 83,656 33,739 40.3
Total operating expenses 170,509 162,872 (7,637) (4.7) 493,794 809,517 315,723 39.0 Operating income (loss) 75,658 73,449 2,209 3.0 240,941 (117,217) 358,158 NM Other income (expense) Interest income 27 21 6 28.6 85 34 51 150.0 Interest expense(1) (20,871) (54,761) 33,890 61.9 (117,268) (108,624) (8,644) (8.0) Other income, net 16,689 772 15,917 NM 20,389 2,392 17,997 NM Net income (loss) before income taxes 71,503 19,481 52,022 NM 144,147 (223,415) 367,562 164.5 (Provision) benefit for income taxes (29,022) (11,139) (17,883) (160.5) (60,409) 77,725 (138,134) (177.7)
14
Net income (loss) $ 42,481 $ 8,342 34,139 NM $ 83,738 $ (145,690) 229,428 157.5 Less: net income (loss) attributable to noncontrolling interests 455 (2,296) (2,751) (119.8) 165 (4,230) (4,395) (103.9) Net income (loss) attributable to MIC $ 42,026 $ 10,638 31,388 NM $ 83,573 $ (141,460) 225,033 159.1 Basic income (loss) per share attributable to MIC $ 0.52 $ 0.13 0.39 NM $ 1.04 $ (1.83) 2.87 156.8 Weighted average number of shares outstanding: basic 81,220,841 79,625,436 1,595,405 2.0 80,570,192 77,364,257 3,205,935 4.1 NM - Not meaningful (1) Interest expense includes gains on derivative instruments of $3.7 million and losses on derivative instruments of $43.0 million for the quarter and nine months ended September 30, 2016, respectively. For the quarter and nine months ended September 30, 2015, interest expense includes losses on derivative instruments of $29.5 million and $38.4 million, respectively.
15
15
MACQUARIE INFRASTRUCTURE CORPORATION
RECONCILIATION OF CONSOLIDATED NET INCOME (LOSS) TO EBITDA EXCLUDING NON-CASH ITEMS AND A RECONCILIATION FROM CASH PROVIDED BY OPERATING ACTIVITIES TO FREE CASH FLOW
Quarter Ended
September 30, Change
Favorable/(Unfavorable)Nine Months Ended Change
September 30, Favorable/(Unfavorable) 2016 2015 $ % 2016 2015 $ % ($ In Thousands) (Unaudited)
Net income (loss) $ 42,481 $ 8,342 $ 83,738 $ (145,690) Interest expense, net(1) 20,844 54,740 117,183 108,590 Provision (benefit) for income taxes 29,022 11,139 60,409 (77,725) Depreciation 59,242 53,070 172,125 162,293 Amortization of intangibles 15,417 17,783 49,917 83,656 Fees to Manager-related party(2) 18,382 18,118 49,570 337,950 Other non-cash expense (income), net (3) 1,435 (484) (3,360) 860 EBITDA excluding non-cash items $ 186,823 $ 162,708 24,115 14.8 $ 529,582 $ 469,934 59,648 12.7
EBITDA excluding non-cash items $ 186,823 $ 162,708 $ 529,582 $ 469,934 Interest expense, net(1) (20,844) (54,740) (117,183) (108,590)
Adjustments to derivative instruments recorded in interest expense(1)
(8,832) 24,243 27,639 17,209 Amortization of debt financing costs(1)
2,287 2,191 7,536 6,757
Interest rate swap breakage fees - (19,171) - (50,556) Provision/benefit for income taxes, net of changes in deferred taxes
(1,115) (150) (5,283) (598)
Changes in working capital(2) 751 (54,106) (5,303) (79,237) Cash provided by operating activities 159,070 60,975 436,988 254,919 Changes in working capital(2) (751) 54,106 5,303 79,237 Maintenance capital expenditures (24,472) (20,758) (44,725) (38,263) Free cash flow $ 133,847 $ 94,323 39,524 41.9 $ 397,566 $ 295,893 101,673 34.4
16
(1) Interest expense, net, includes adjustment to derivative instruments and non-cash amortization of deferred financing fees. Interest expense also included a non-cash write-off of deferred financing fees related to the February 2016 refinancing at Hawaii Gas for the nine months ended September 30, 2016 and a non-cash write-off of deferred financing costs related to the May 2015 refinancing at IMTT for the nine months ended September 30, 2015. (2) In July 2015, our Board requested, and our Manager agreed, that $67.8 million of the performance fee for the quarter ended June 30, 2015 be settled in cash in July 2015 to minimize dilution. The remaining $67.8 million obligation was settled and reinvested in 944,046 shares by our Manager on August 1, 2016 using the June 2016 volume weighted average share price of $71.84. (3) Other non-cash expense (income), net, primarily includes non-cash pension expense, amortization of tolling liabilities, unrealized gains (losses) on commodity hedges and non-cash gains (losses) related to disposal of assets. See "Free Cash Flow, Earnings Before Interest, Taxes, Depreciation and Amortization (EBITDA) excluding non-cash items and Proportionately Combined Metrics" above for a further discussion.
MACQUARIE INFRASTRUCTURE CORPORATION
RECONCILIATION FROM CONSOLIDATED FREE CASH FLOW TO PROPORTIONATELY COMBINED FREE CASH FLOW
Quarter Ended September 30,
Change Favorable/
(Unfavorable) Nine Months Ended
September 30,
Change
Favorable/ Unfavorable
2016 2015 $ % 2016 2015 $ % ($ In Thousands) (Unaudited)
Free Cash Flow- Consolidated basis $ 133,847 $ 94,323 39,524 41.9 $ 397,566 $ 295,893 101,673 34.4 100% of CP&E Free Cash Flow included in consolidated Free Cash Flow (26,718) (2,577) (56,532) (9,607) MIC's share of CP&E Free Cash Flow 24,773 1,040 50,580 5,496 100% of MIC Hawaii Free Cash Flow included in consolidated Free Cash Flow (8,696) (9,121) (30,432) (35,728) MIC's share of MIC Hawaii Free Cash Flow 8,694 9,121 30,430 35,728 Free Cash Flow- Proportionately Combined basis $ 131,900 $ 92,786 39,114 42.2 $ 391,612 $ 291,782 99,830 34.2
17
17
MACQUARIE INFRASTRUCTURE CORPORATION
RECONCILIATION OF SEGMENT NET INCOME (LOSS) TO EBITDA EXCLUDING NON-CASH ITEMS AND A RECONCILIATION FROM CASH PROVIDED BY OPERATING ACTIVITIES TO FREE CASH FLOW
IMTT
Quarter Ended September 30,
Change Favorable/
(Unfavorable) Nine Months Ended
September 30,
Change Favorable/
(Unfavorable)
2016 2015 2016 2015 $ $ $ % $ $ $ % ($ In Thousands) (Unaudited)
Revenues 133,143 135,436 (2,293) (1.7) 396,786 415,881 (19,095) (4.6) Cost of services (exclusive of depreciation and amortization of intangibles shown separately below) 53,085 55,990 2,905 5.2 149,845 170,633 20,788 12.2 Gross profit 80,058 79,446 612 0.8 246,941 245,248 1,693 0.7 General and administrative expenses 8,358 8,903 545 6.1 24,322 24,909 587 2.4 Depreciation and amortization
35,709 32,233 (3,476) (10.8) 103,612 99,785 (3,827) (3.8)
Operating income 35,991 38,310 (2,319) (6.1) 119,007 120,554 (1,547) (1.3) Interest expense, net(1) (7,827) (19,045) 11,218 58.9 (41,462) (32,214) (9,248) (28.7) Other income, net 13,495 549 12,946 NM 16,947 1,950 14,997 NM Provision for income taxes (17,079) (8,053) (9,026) (112.1) (38,717) (36,801) (1,916) (5.2) Net income(2) 24,580 11,761 12,819 109.0 55,775 53,489 2,286 4.3 Less: net income attributable to noncontrolling interests - 172 172 100.0 59 530 471 88.9 Net income attributable to MIC(2) 24,580 11,589 12,991 112.1 55,716 52,959 2,757 5.2
Reconciliation of net income to EBITDA excluding non-cash items and a reconciliation of cash provided by operating activities to Free Cash Flow: Net income(2) 24,580 11,761 55,775 53,489 Interest expense, net(1) 7,827 19,045 41,462 32,214 Provision for income taxes 17,079 8,053 38,717 36,801 Depreciation and amortization 35,709 32,233 103,612 99,785 Other non-cash expense, net(3) 1,825 1,769 6,045 4,624 ` EBITDA excluding non-cash items 87,020 72,861 14,159 19.4 245,611 226,913 18,698 8.2
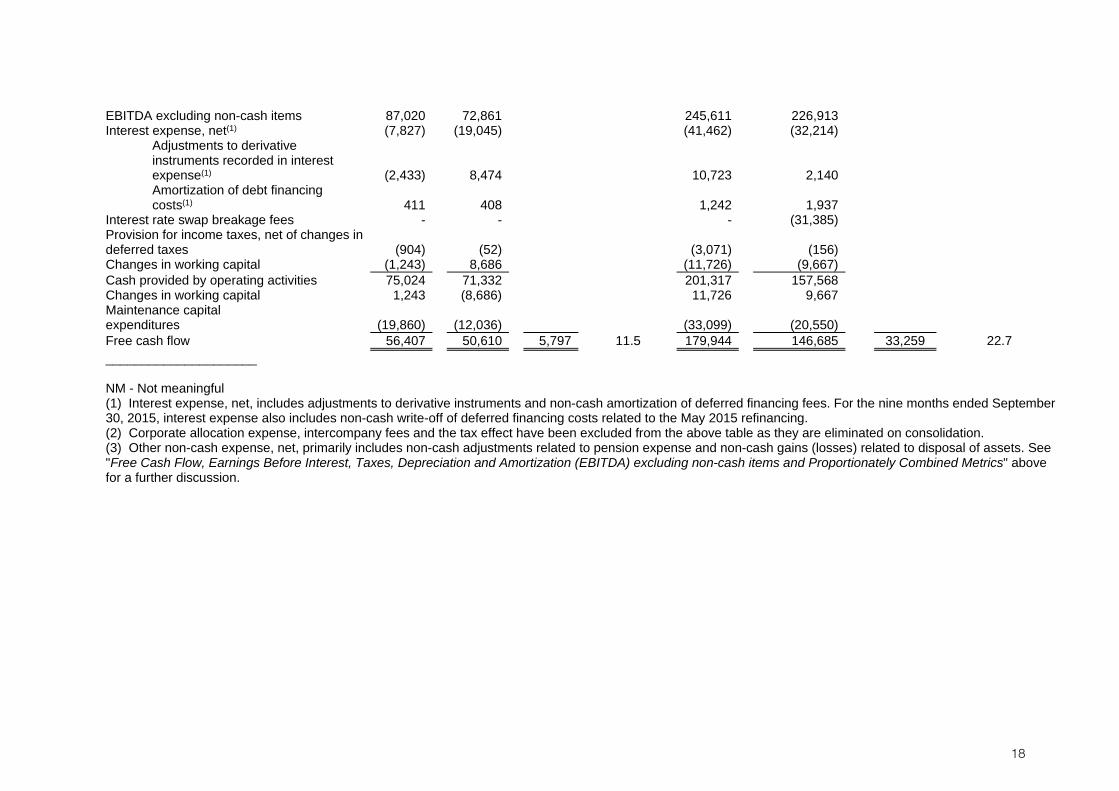
18
EBITDA excluding non-cash items 87,020 72,861 245,611 226,913 Interest expense, net(1) (7,827) (19,045) (41,462) (32,214)
Adjustments to derivative instruments recorded in interest expense(1) (2,433) 8,474 10,723 2,140 Amortization of debt financing costs(1) 411 408 1,242 1,937
Interest rate swap breakage fees - - - (31,385) Provision for income taxes, net of changes in deferred taxes (904) (52) (3,071) (156) Changes in working capital (1,243) 8,686 (11,726) (9,667) Cash provided by operating activities 75,024 71,332 201,317 157,568 Changes in working capital 1,243 (8,686) 11,726 9,667 Maintenance capital expenditures
(19,860) (12,036) (33,099) (20,550)
Free cash flow 56,407 50,610 5,797 11.5 179,944 146,685 33,259 22.7 _____________________
NM - Not meaningful (1) Interest expense, net, includes adjustments to derivative instruments and non-cash amortization of deferred financing fees. For the nine months ended September 30, 2015, interest expense also includes non-cash write-off of deferred financing costs related to the May 2015 refinancing. (2) Corporate allocation expense, intercompany fees and the tax effect have been excluded from the above table as they are eliminated on consolidation. (3) Other non-cash expense, net, primarily includes non-cash adjustments related to pension expense and non-cash gains (losses) related to disposal of assets. See "Free Cash Flow, Earnings Before Interest, Taxes, Depreciation and Amortization (EBITDA) excluding non-cash items and Proportionately Combined Metrics" above for a further discussion.
19
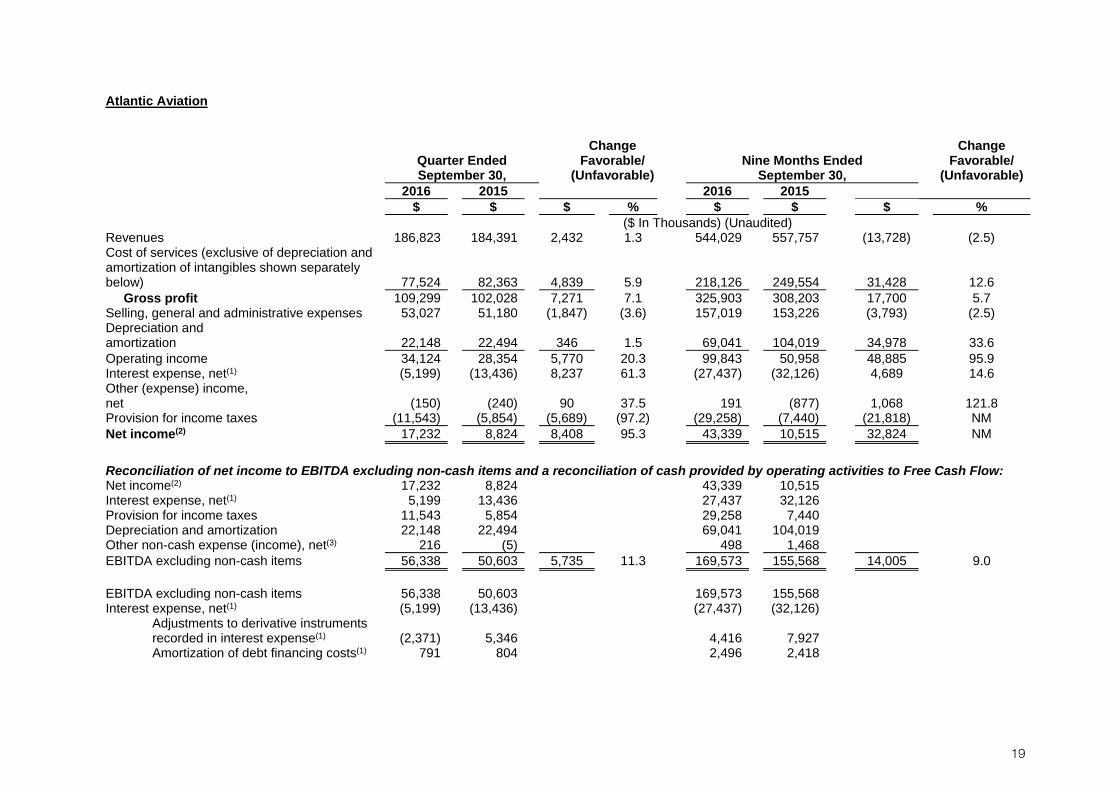
Atlantic Aviation
Quarter Ended September 30,
Change Favorable/
(Unfavorable) Nine Months Ended
September 30,
Change Favorable/
(Unfavorable)
2016 2015 2016 2015 $ $ $ % $ $ $ % ($ In Thousands) (Unaudited)
Revenues 186,823 184,391 2,432 1.3 544,029 557,757 (13,728) (2.5) Cost of services (exclusive of depreciation and amortization of intangibles shown separately below) 77,524 82,363 4,839 5.9 218,126 249,554 31,428 12.6
Gross profit 109,299 102,028 7,271 7.1 325,903 308,203 17,700 5.7 Selling, general and administrative expenses 53,027 51,180 (1,847) (3.6) 157,019 153,226 (3,793) (2.5) Depreciation and amortization
22,148 22,494 346 1.5 69,041 104,019 34,978 33.6
Operating income 34,124 28,354 5,770 20.3 99,843 50,958 48,885 95.9 Interest expense, net(1) (5,199) (13,436) 8,237 61.3 (27,437) (32,126) 4,689 14.6 Other (expense) income, net
(150) (240) 90 37.5 191 (877) 1,068 121.8
Provision for income taxes (11,543) (5,854) (5,689) (97.2) (29,258) (7,440) (21,818) NM Net income(2) 17,232 8,824 8,408 95.3 43,339 10,515 32,824 NM
Reconciliation of net income to EBITDA excluding non-cash items and a reconciliation of cash provided by operating activities to Free Cash Flow: Net income(2) 17,232 8,824 43,339 10,515 Interest expense, net(1) 5,199 13,436 27,437 32,126 Provision for income taxes 11,543 5,854 29,258 7,440 Depreciation and amortization 22,148 22,494 69,041 104,019 Other non-cash expense (income), net(3) 216 (5) 498 1,468 EBITDA excluding non-cash items 56,338 50,603 5,735 11.3 169,573 155,568 14,005 9.0 EBITDA excluding non-cash items 56,338 50,603 169,573 155,568 Interest expense, net(1) (5,199) (13,436) (27,437) (32,126)
Adjustments to derivative instruments recorded in interest expense(1) (2,371) 5,346 4,416 7,927
Amortization of debt financing costs(1) 791 804 2,496 2,418
20
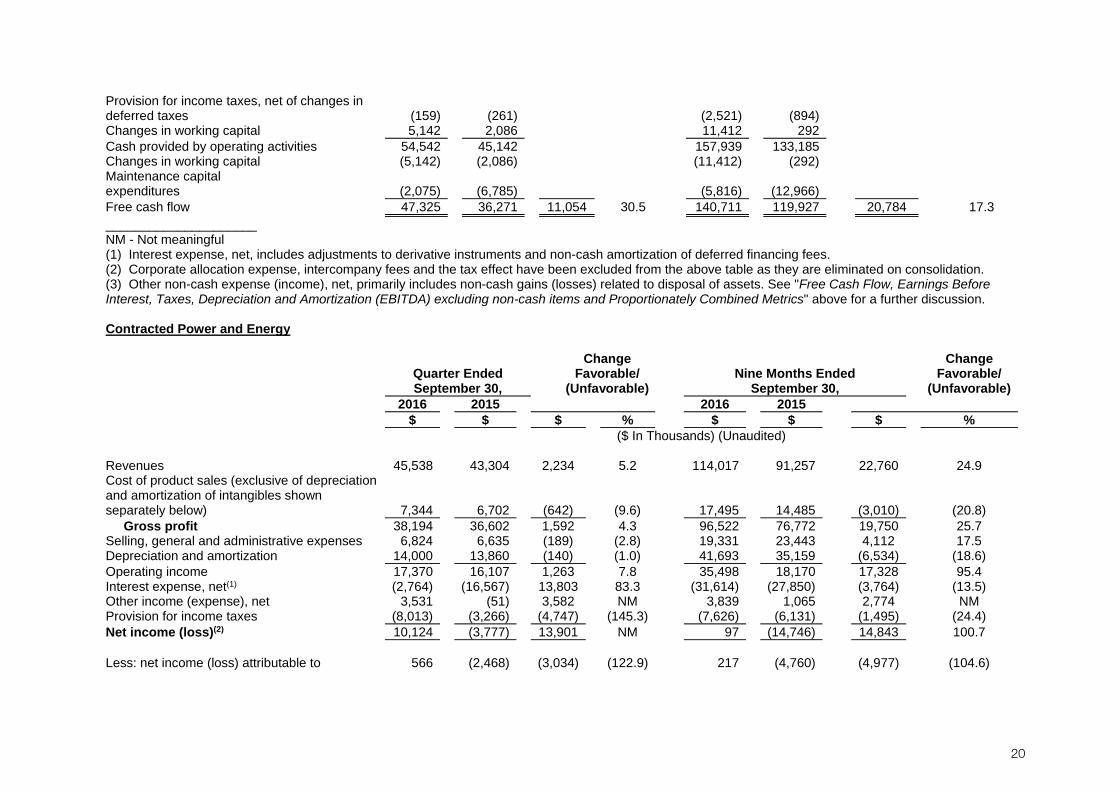
Provision for income taxes, net of changes in deferred taxes (159) (261) (2,521) (894)
Changes in working capital 5,142 2,086 11,412 292 Cash provided by operating activities 54,542 45,142 157,939 133,185 Changes in working capital (5,142) (2,086) (11,412) (292) Maintenance capital expenditures (2,075) (6,785) (5,816) (12,966)
Free cash flow 47,325 36,271 11,054 30.5 140,711 119,927 20,784 17.3 _____________________ NM - Not meaningful (1) Interest expense, net, includes adjustments to derivative instruments and non-cash amortization of deferred financing fees. (2) Corporate allocation expense, intercompany fees and the tax effect have been excluded from the above table as they are eliminated on consolidation. (3) Other non-cash expense (income), net, primarily includes non-cash gains (losses) related to disposal of assets. See "Free Cash Flow, Earnings Before Interest, Taxes, Depreciation and Amortization (EBITDA) excluding non-cash items and Proportionately Combined Metrics" above for a further discussion. Contracted Power and Energy
Quarter Ended September 30,
Change Favorable/
(Unfavorable) Nine Months Ended
September 30,
Change Favorable/
(Unfavorable)
2016 2015 2016 2015 $ $ $ % $ $ $ % ($ In Thousands) (Unaudited)
Revenues 45,538 43,304 2,234 5.2 114,017 91,257 22,760 24.9 Cost of product sales (exclusive of depreciation and amortization of intangibles shown separately below) 7,344 6,702 (642) (9.6) 17,495 14,485 (3,010) (20.8)
Gross profit 38,194 36,602 1,592 4.3 96,522 76,772 19,750 25.7 Selling, general and administrative expenses 6,824 6,635 (189) (2.8) 19,331 23,443 4,112 17.5 Depreciation and amortization 14,000 13,860 (140) (1.0) 41,693 35,159 (6,534) (18.6) Operating income 17,370 16,107 1,263 7.8 35,498 18,170 17,328 95.4 Interest expense, net(1) (2,764) (16,567) 13,803 83.3 (31,614) (27,850) (3,764) (13.5) Other income (expense), net 3,531 (51) 3,582 NM 3,839 1,065 2,774 NM Provision for income taxes (8,013) (3,266) (4,747) (145.3) (7,626) (6,131) (1,495) (24.4) Net income (loss)(2) 10,124 (3,777) 13,901 NM 97 (14,746) 14,843 100.7 Less: net income (loss) attributable to 566 (2,468) (3,034) (122.9) 217 (4,760) (4,977) (104.6)
21
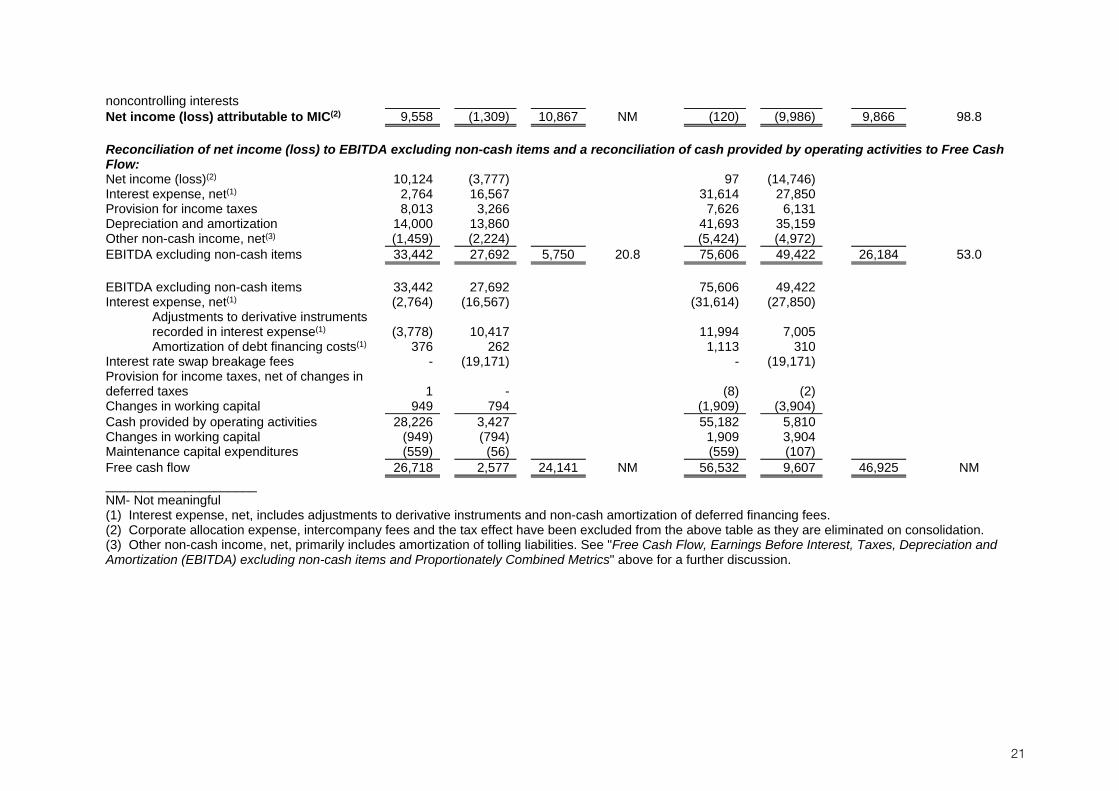
noncontrolling interests Net income (loss) attributable to MIC(2) 9,558 (1,309) 10,867 NM (120) (9,986) 9,866 98.8 Reconciliation of net income (loss) to EBITDA excluding non-cash items and a reconciliation of cash provided by operating activities to Free Cash Flow: Net income (loss)(2) 10,124 (3,777) 97 (14,746) Interest expense, net(1) 2,764 16,567 31,614 27,850 Provision for income taxes 8,013 3,266 7,626 6,131 Depreciation and amortization 14,000 13,860 41,693 35,159 Other non-cash income, net(3) (1,459) (2,224) (5,424) (4,972) EBITDA excluding non-cash items 33,442 27,692 5,750 20.8 75,606 49,422 26,184 53.0 EBITDA excluding non-cash items 33,442 27,692 75,606 49,422 Interest expense, net(1) (2,764) (16,567) (31,614) (27,850)
Adjustments to derivative instruments recorded in interest expense(1) (3,778) 10,417 11,994 7,005
Amortization of debt financing costs(1) 376 262 1,113 310 Interest rate swap breakage fees - (19,171) - (19,171) Provision for income taxes, net of changes in deferred taxes 1 - (8) (2)
Changes in working capital 949 794 (1,909) (3,904) Cash provided by operating activities 28,226 3,427 55,182 5,810 Changes in working capital (949) (794) 1,909 3,904 Maintenance capital expenditures (559) (56) (559) (107) Free cash flow 26,718 2,577 24,141 NM 56,532 9,607 46,925 NM _____________________ NM- Not meaningful (1) Interest expense, net, includes adjustments to derivative instruments and non-cash amortization of deferred financing fees. (2) Corporate allocation expense, intercompany fees and the tax effect have been excluded from the above table as they are eliminated on consolidation. (3) Other non-cash income, net, primarily includes amortization of tolling liabilities. See "Free Cash Flow, Earnings Before Interest, Taxes, Depreciation and Amortization (EBITDA) excluding non-cash items and Proportionately Combined Metrics" above for a further discussion.
22
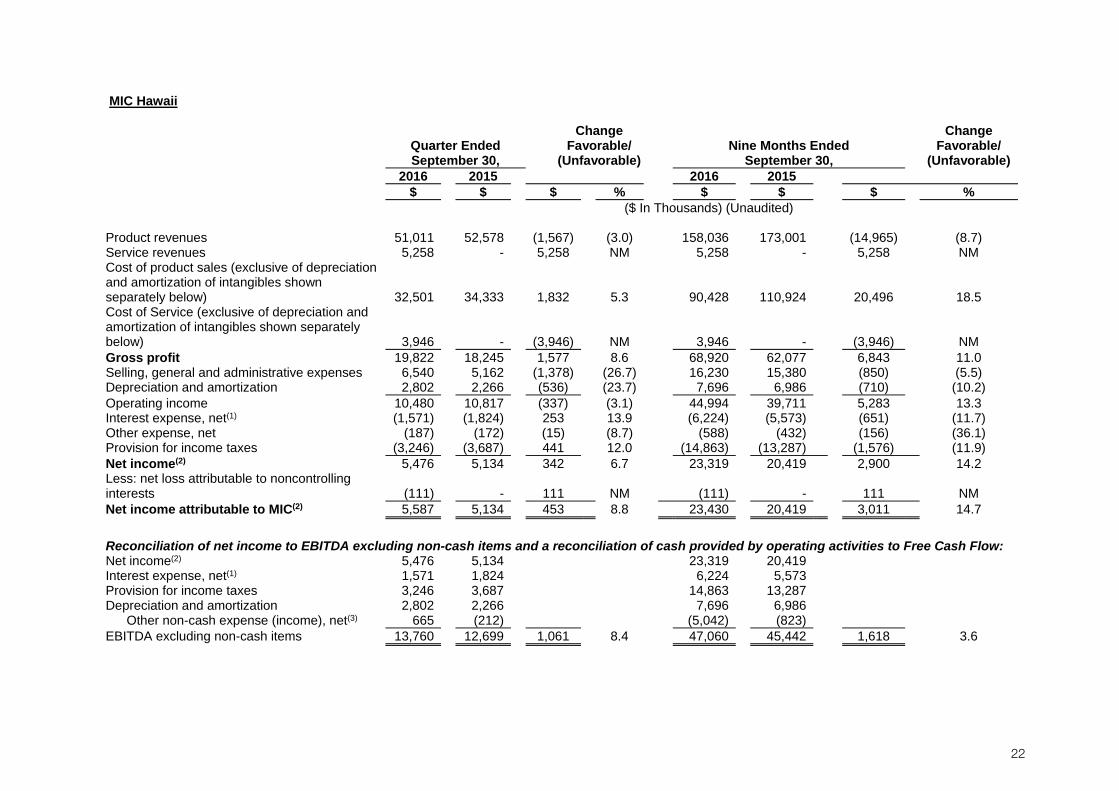
MIC Hawaii
Quarter Ended September 30,
Change Favorable/
(Unfavorable) Nine Months Ended
September 30,
Change Favorable/
(Unfavorable)
2016 2015 2016 2015 $ $ $ % $ $ $ %
($ In Thousands) (Unaudited)
Product revenues 51,011 52,578 (1,567) (3.0) 158,036 173,001 (14,965) (8.7) Service revenues 5,258 - 5,258 NM 5,258 - 5,258 NM Cost of product sales (exclusive of depreciation and amortization of intangibles shown separately below) 32,501 34,333 1,832 5.3 90,428 110,924 20,496 18.5
Cost of Service (exclusive of depreciation and amortization of intangibles shown separately below) 3,946 - (3,946) NM 3,946 - (3,946) NM
Gross profit 19,822 18,245 1,577 8.6 68,920 62,077 6,843 11.0 Selling, general and administrative expenses 6,540 5,162 (1,378) (26.7) 16,230 15,380 (850) (5.5) Depreciation and amortization 2,802 2,266 (536) (23.7) 7,696 6,986 (710) (10.2) Operating income 10,480 10,817 (337) (3.1) 44,994 39,711 5,283 13.3 Interest expense, net(1) (1,571) (1,824) 253 13.9 (6,224) (5,573) (651) (11.7) Other expense, net (187) (172) (15) (8.7) (588) (432) (156) (36.1) Provision for income taxes (3,246) (3,687) 441 12.0 (14,863) (13,287) (1,576) (11.9) Net income(2) 5,476 5,134 342 6.7 23,319 20,419 2,900 14.2 Less: net loss attributable to noncontrolling interests (111) - 111 NM (111) - 111 NM
Net income attributable to MIC(2) 5,587 5,134 453 8.8 23,430 20,419 3,011 14.7
Reconciliation of net income to EBITDA excluding non-cash items and a reconciliation of cash provided by operating activities to Free Cash Flow: Net income(2) 5,476 5,134 23,319 20,419 Interest expense, net(1) 1,571 1,824 6,224 5,573 Provision for income taxes 3,246 3,687 14,863 13,287 Depreciation and amortization 2,802 2,266 7,696 6,986
Other non-cash expense (income), net(3) 665 (212) (5,042) (823) EBITDA excluding non-cash items 13,760 12,699 1,061 8.4 47,060 45,442 1,618 3.6
23
EBITDA excluding non-cash items 13,760 12,699 47,060 45,442 Interest expense, net(1) (1,571) (1,824) (6,224) (5,573)
Adjustments to derivative instruments recorded in interest expense(1) (250) 6 506 137
Amortization of debt financing costs(1) 96 121 848 362 Provision for income taxes, net of changes in deferred taxes (1,361) - (6,507) -
Changes in working capital (1,394) 6,012 5,554 5,366 Cash provided by operating activities 9,280 17,014 41,237 45,734 Changes in working capital 1,394 (6,012) (5,554) (5,366) Maintenance capital expenditures (1,978) (1,881) (5,251) (4,640) Free cash flow 8,696 9,121 (425) (4.7) 30,432 35,728 (5,296) (14.8) _____________________ NM - Not meaningful (1) Interest expense, net, includes adjustments to derivative instruments related to interest rate swaps and non-cash amortization of deferred financing fees. For the nine months ended September 30, 2016, interest expense also included a non-cash write-off of deferred financing fees related to the February 2016 refinancing. (2) Corporate allocation expense, intercompany fees and the tax effect have been excluded from the above table as they are eliminated on consolidation. (3) Other non-cash expense (income), net, primarily includes non-cash adjustments related to pension expense and unrealized gains (losses) on commodity hedges. See "Free Cash Flow, Earnings Before Interest, Taxes, Depreciation and Amortization (EBITDA) excluding non-cash items and Proportionately Combined Metrics" above for a further discussion.
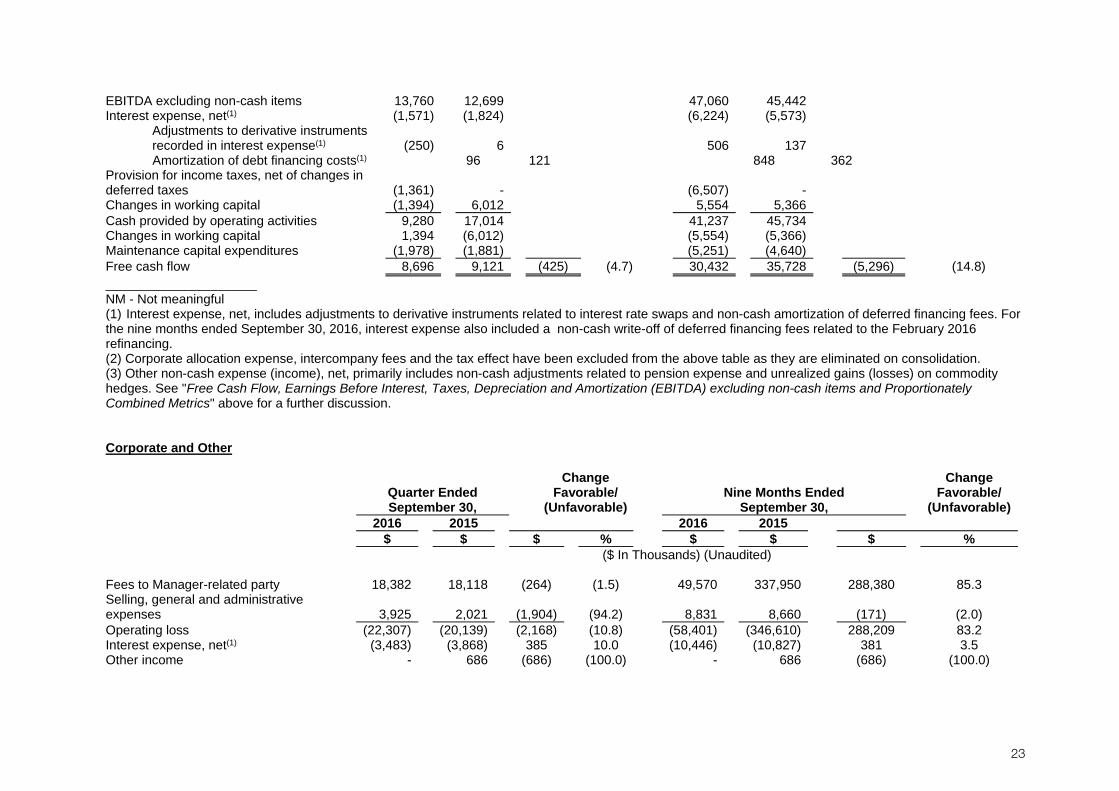
Corporate and Other
Quarter Ended September 30,
Change Favorable/
(Unfavorable) Nine Months Ended
September 30,
Change Favorable/
(Unfavorable)
2016 2015 2016 2015 $ $ $ % $ $ $ % ($ In Thousands) (Unaudited)
Fees to Manager-related party 18,382 18,118 (264) (1.5) 49,570 337,950 288,380 85.3 Selling, general and administrative expenses 3,925 2,021 (1,904) (94.2) 8,831 8,660 (171) (2.0) Operating loss (22,307) (20,139) (2,168) (10.8) (58,401) (346,610) 288,209 83.2 Interest expense, net(1) (3,483) (3,868) 385 10.0 (10,446) (10,827) 381 3.5 Other income - 686 (686) (100.0) - 686 (686) (100.0)
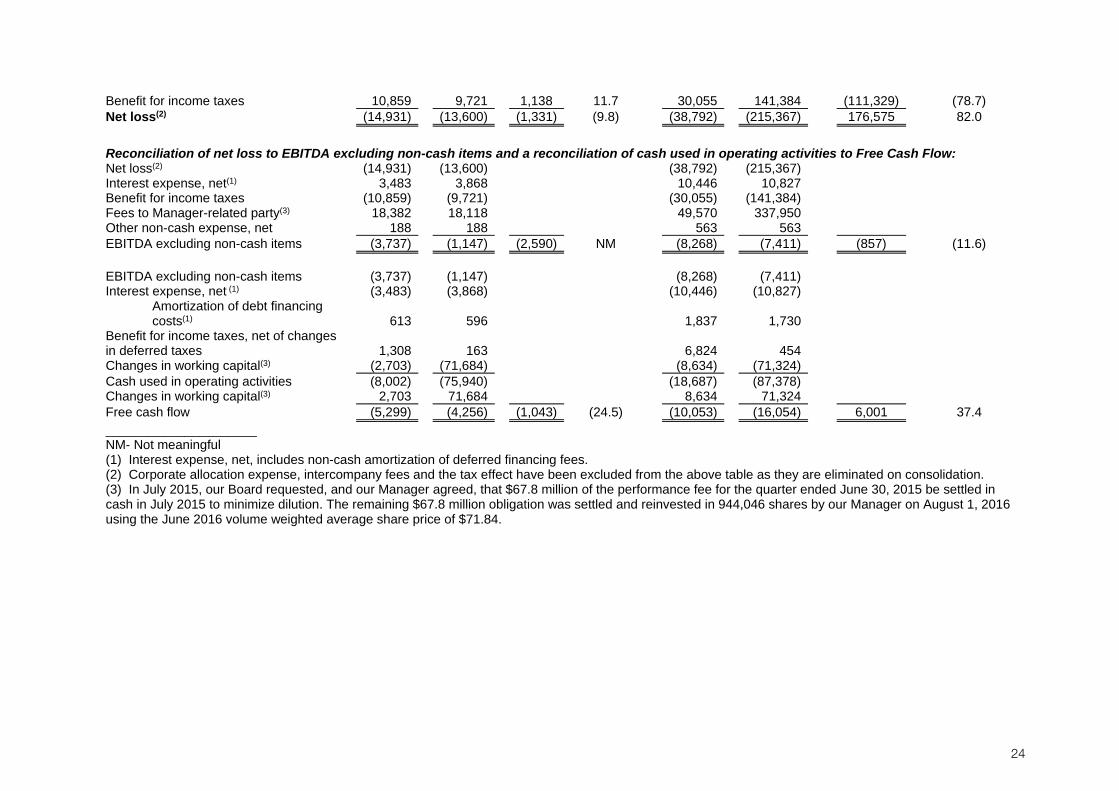
24
Benefit for income taxes 10,859 9,721 1,138 11.7 30,055 141,384 (111,329) (78.7) Net loss(2) (14,931) (13,600) (1,331) (9.8) (38,792) (215,367) 176,575 82.0
Reconciliation of net loss to EBITDA excluding non-cash items and a reconciliation of cash used in operating activities to Free Cash Flow: Net loss(2) (14,931) (13,600) (38,792) (215,367) Interest expense, net(1) 3,483 3,868 10,446 10,827 Benefit for income taxes (10,859) (9,721) (30,055) (141,384) Fees to Manager-related party(3) 18,382 18,118 49,570 337,950 Other non-cash expense, net 188 188 563 563 EBITDA excluding non-cash items (3,737) (1,147) (2,590) NM (8,268) (7,411) (857) (11.6) EBITDA excluding non-cash items (3,737) (1,147) (8,268) (7,411) Interest expense, net (1) (3,483) (3,868) (10,446) (10,827)
Amortization of debt financing costs(1) 613 596 1,837 1,730
Benefit for income taxes, net of changes in deferred taxes 1,308 163 6,824 454 Changes in working capital(3) (2,703) (71,684) (8,634) (71,324) Cash used in operating activities (8,002) (75,940) (18,687) (87,378) Changes in working capital(3) 2,703 71,684 8,634 71,324 Free cash flow (5,299) (4,256) (1,043) (24.5) (10,053) (16,054) 6,001 37.4 _____________________ NM- Not meaningful (1) Interest expense, net, includes non-cash amortization of deferred financing fees. (2) Corporate allocation expense, intercompany fees and the tax effect have been excluded from the above table as they are eliminated on consolidation. (3) In July 2015, our Board requested, and our Manager agreed, that $67.8 million of the performance fee for the quarter ended June 30, 2015 be settled in cash in July 2015 to minimize dilution. The remaining $67.8 million obligation was settled and reinvested in 944,046 shares by our Manager on August 1, 2016 using the June 2016 volume weighted average share price of $71.84.
25
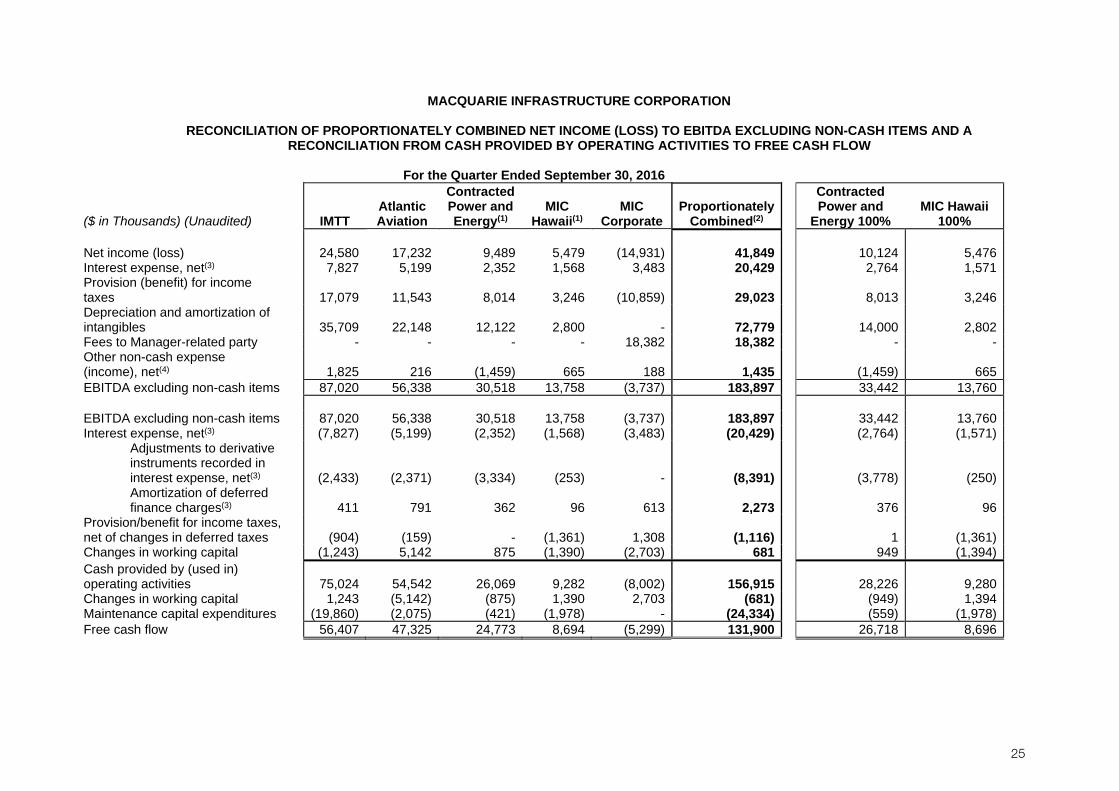
MACQUARIE INFRASTRUCTURE CORPORATION
RECONCILIATION OF PROPORTIONATELY COMBINED NET INCOME (LOSS) TO EBITDA EXCLUDING NON-CASH ITEMS AND A RECONCILIATION FROM CASH PROVIDED BY OPERATING ACTIVITIES TO FREE CASH FLOW
For the Quarter Ended September 30, 2016
($ in Thousands) (Unaudited) IMTT Atlantic Aviation
Contracted Power and Energy(1)
MIC Hawaii(1)
MIC Corporate
Proportionately Combined(2)
Contracted Power and
Energy 100% MIC Hawaii
100% Net income (loss) 24,580 17,232 9,489 5,479 (14,931) 41,849 10,124 5,476 Interest expense, net(3) 7,827 5,199 2,352 1,568 3,483 20,429 2,764 1,571 Provision (benefit) for income taxes 17,079 11,543 8,014 3,246 (10,859) 29,023 8,013 3,246 Depreciation and amortization of intangibles 35,709 22,148 12,122 2,800 - 72,779 14,000 2,802 Fees to Manager-related party - - - - 18,382 18,382 - - Other non-cash expense (income), net(4) 1,825 216 (1,459) 665 188 1,435 (1,459) 665 EBITDA excluding non-cash items 87,020 56,338 30,518 13,758 (3,737) 183,897 33,442 13,760 EBITDA excluding non-cash items 87,020 56,338 30,518 13,758 (3,737) 183,897 33,442 13,760 Interest expense, net(3) (7,827) (5,199) (2,352) (1,568) (3,483) (20,429) (2,764) (1,571)
Adjustments to derivative instruments recorded in interest expense, net(3) (2,433) (2,371) (3,334) (253) - (8,391) (3,778) (250) Amortization of deferred finance charges(3) 411 791 362 96 613 2,273 376 96
Provision/benefit for income taxes, net of changes in deferred taxes (904) (159) - (1,361) 1,308 (1,116) 1 (1,361) Changes in working capital (1,243) 5,142 875 (1,390) (2,703) 681 949 (1,394) Cash provided by (used in) operating activities 75,024 54,542 26,069 9,282 (8,002) 156,915 28,226 9,280 Changes in working capital 1,243 (5,142) (875) 1,390 2,703 (681) (949) 1,394 Maintenance capital expenditures (19,860) (2,075) (421) (1,978) - (24,334) (559) (1,978) Free cash flow 56,407 47,325 24,773 8,694 (5,299) 131,900 26,718 8,696
26
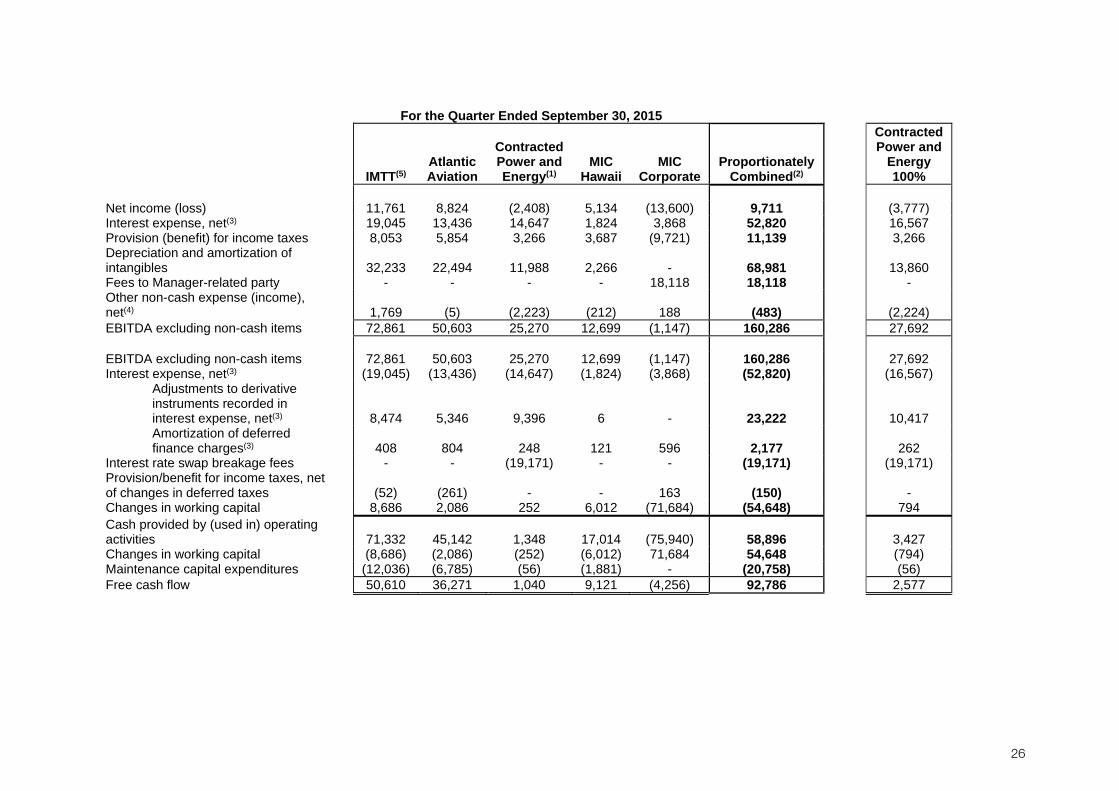
For the Quarter Ended September 30, 2015
IMTT(5) Atlantic Aviation
Contracted Power and Energy(1)
MIC Hawaii
MIC Corporate
Proportionately Combined(2)
Contracted Power and
Energy 100%
Net income (loss) 11,761 8,824 (2,408) 5,134 (13,600) 9,711 (3,777) Interest expense, net(3) 19,045 13,436 14,647 1,824 3,868 52,820 16,567 Provision (benefit) for income taxes 8,053 5,854 3,266 3,687 (9,721) 11,139 3,266 Depreciation and amortization of intangibles 32,233 22,494 11,988 2,266 - 68,981
13,860
Fees to Manager-related party - - - - 18,118 18,118 - Other non-cash expense (income), net(4) 1,769 (5) (2,223) (212) 188 (483)
(2,224)
EBITDA excluding non-cash items 72,861 50,603 25,270 12,699 (1,147) 160,286 27,692 EBITDA excluding non-cash items 72,861 50,603 25,270 12,699 (1,147) 160,286 27,692 Interest expense, net(3) (19,045) (13,436) (14,647) (1,824) (3,868) (52,820) (16,567)
Adjustments to derivative instruments recorded in interest expense, net(3) 8,474 5,346 9,396 6 - 23,222
10,417 Amortization of deferred finance charges(3) 408 804 248 121 596 2,177
262
Interest rate swap breakage fees - - (19,171) - - (19,171) (19,171) Provision/benefit for income taxes, net of changes in deferred taxes (52) (261) - - 163 (150)
-
Changes in working capital 8,686 2,086 252 6,012 (71,684) (54,648) 794 Cash provided by (used in) operating activities 71,332 45,142 1,348 17,014 (75,940) 58,896
3,427
Changes in working capital (8,686) (2,086) (252) (6,012) 71,684 54,648 (794) Maintenance capital expenditures (12,036) (6,785) (56) (1,881) - (20,758) (56) Free cash flow 50,610 36,271 1,040 9,121 (4,256) 92,786 2,577

27
For the Nine Months Ended September 30, 2016
($ in Thousands) (Unaudited) IMTT(5) Atlantic Aviation
Contracted Power and Energy(1)
MIC Hawaii(1)
MIC Corporate
Proportionately Combined(2)
Contracted Power and
Energy 100%
MIC Hawaii 100%
Net income (loss) 55,775 43,339 896 23,322 (38,792) 84,540 97 23,319 Interest expense, net(3) 41,462 27,437 27,801 6,221 10,446 113,367 31,614 6,224 Provision (benefit) for income taxes 38,717 29,258 7,625 14,863 (30,055) 60,408 7,626 14,863 Depreciation and amortization of intangibles 103,612 69,041 36,067 7,694 - 216,414 41,693 7,696 Fees to Manager-related party - - - - 49,570 49,570 - - Other non-cash expense (income), net(4) 6,045 498 (5,405) (5,042) 563 (3,341) (5,424) (5,042) EBITDA excluding non-cash items 245,611 169,573 66,984 47,058 (8,268) 520,958 75,606 47,060 EBITDA excluding non-cash items 245,611 169,573 66,984 47,058 (8,268) 520,958 75,606 47,060 Interest expense, net(3) (41,462) (27,437) (27,801) (6,221) (10,446) (113,367) (31,614) (6,224)
Adjustments to derivative instruments recorded in interest expense, net(3) 10,723 4,416 10,756 503 - 26,398 11,994 506 Amortization of deferred finance charges(3) 1,242 2,496 1,071 848 1,837 7,494 1,113 848
Provision/benefit for income taxes, net of changes in deferred taxes (3,071) (2,521) (9) (6,507) 6,824 (5,284) (8) (6,507) Changes in working capital (11,726) 11,412 (2,187) 5,558 (8,634) (5,577) (1,909) 5,554 Cash provided by (used in) operating activities 201,317 157,939 48,814 41,239 (18,687) 430,622 55,182 41,237 Changes in working capital 11,726 (11,412) 2,187 (5,558) 8,634 5,577 1,909 (5,554) Maintenance capital expenditures (33,099) (5,816) (421) (5,251) - (44,587) (559) (5,251) Free cash flow 179,944 140,711 50,580 30,430 (10,053) 391,612 56,532 30,432
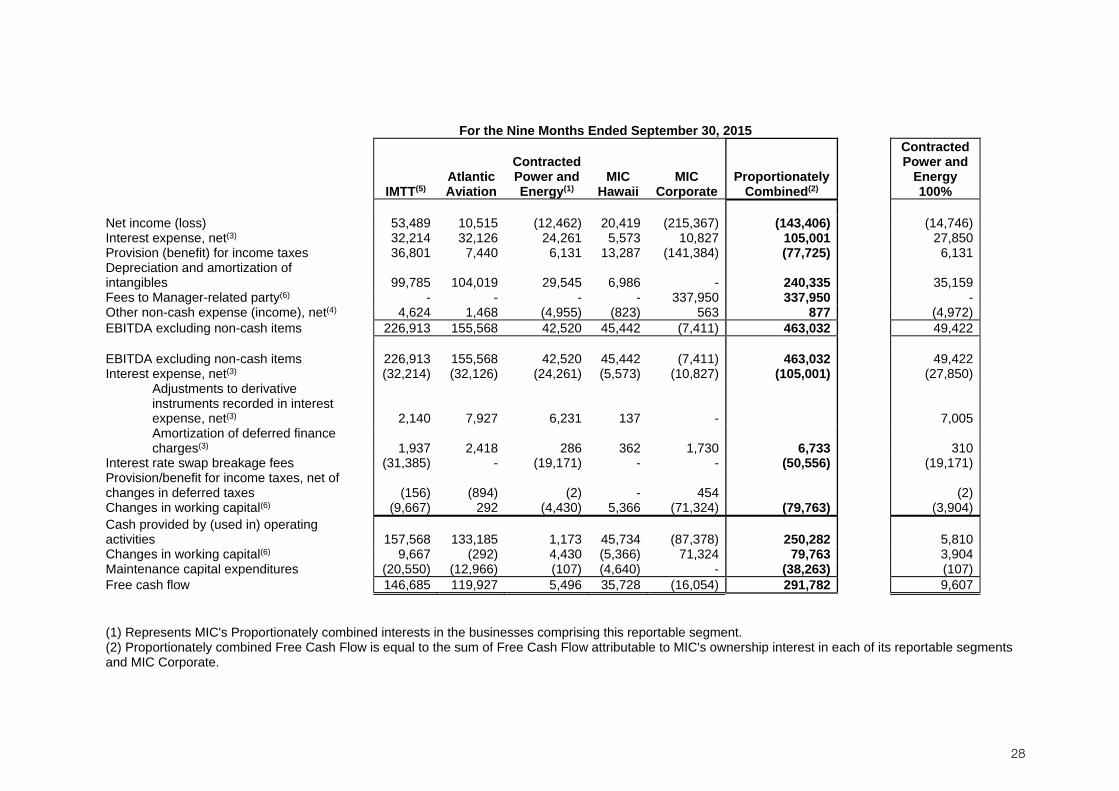
28
For the Nine Months Ended September 30, 2015
IMTT(5) Atlantic Aviation
Contracted Power and Energy(1)
MIC Hawaii
MIC Corporate
Proportionately Combined(2)
Contracted Power and
Energy 100%
Net income (loss) 53,489 10,515 (12,462) 20,419 (215,367) (143,406) (14,746)Interest expense, net(3) 32,214 32,126 24,261 5,573 10,827 105,001 27,850Provision (benefit) for income taxes 36,801 7,440 6,131 13,287 (141,384) (77,725) 6,131Depreciation and amortization of intangibles 99,785 104,019 29,545 6,986 - 240,335 35,159Fees to Manager-related party(6) - - - - 337,950 337,950 -Other non-cash expense (income), net(4) 4,624 1,468 (4,955) (823) 563 877 (4,972)EBITDA excluding non-cash items 226,913 155,568 42,520 45,442 (7,411) 463,032 49,422 EBITDA excluding non-cash items 226,913 155,568 42,520 45,442 (7,411) 463,032 49,422Interest expense, net(3) (32,214) (32,126) (24,261) (5,573) (10,827) (105,001) (27,850)
Adjustments to derivative instruments recorded in interest expense, net(3) 2,140 7,927 6,231 137 - 7,005Amortization of deferred finance charges(3) 1,937 2,418 286 362 1,730 6,733 310
Interest rate swap breakage fees (31,385) - (19,171) - - (50,556) (19,171)Provision/benefit for income taxes, net of changes in deferred taxes (156) (894) (2) - 454 (2)Changes in working capital(6) (9,667) 292 (4,430) 5,366 (71,324) (79,763) (3,904)Cash provided by (used in) operating activities 157,568 133,185 1,173 45,734 (87,378) 250,282 5,810Changes in working capital(6) 9,667 (292) 4,430 (5,366) 71,324 79,763 3,904Maintenance capital expenditures (20,550) (12,966) (107) (4,640) - (38,263) (107)Free cash flow 146,685 119,927 5,496 35,728 (16,054) 291,782 9,607
(1) Represents MIC's Proportionately combined interests in the businesses comprising this reportable segment.(2) Proportionately combined Free Cash Flow is equal to the sum of Free Cash Flow attributable to MIC's ownership interest in each of its reportable segments and MIC Corporate.
29
(3) Interest expense, net, includes adjustments to derivative instruments and non-cash amortization of deferred financing charges. Interest expense, net, also includes a non-cash write-off of deferred financing fees related to the February 2016 refinancing at Hawaii Gas for the nine months ended September 30, 2016 and a non-cash write-off of deferred financing costs related to the May 2015 refinancing at IMTT for the nine months ended September 30, 2015. (4) Other non-cash expense (income), net, primarily includes non-cash pension expense, amortization of tolling liabilities, unrealized gains (losses) on commodity hedges and non-cash gains (losses) related to disposal of assets. See "Free Cash Flow, Earnings Before Interest, Taxes, Depreciation and Amortization (EBITDA) excluding non-cash items and Proportionately Combined Metrics" above for a further discussion. (5) On March 31, 2016, IMTT acquired the remaining 33.3% interest in its Quebec terminal that it did not previously own. IMTT was previously providing management services to this terminal and no operational changes are expected. Prior to the acquisition, IMTT consolidated the results of the Quebec terminal in its financial statements and adjusted for the portion that it did not own through noncontrolling interests. Since the IMTT Acquisition in July 2014 and prior to the acquisition of the noncontrolling interest, MIC reported IMTT’s EBITDA excluding non-cash items and Free Cash Flow including the 33.3% portion of the Quebec terminal. The contribution from the minority interest was not significant. Therefore, there were no changes to our historical EBITDA excluding non-cash items, Free Cash Flow or results generally as a function of acquiring this noncontrolling interest. (6) In July 2015, our Board requested, and our Manager agreed, that $67.8 million of the performance fee for the quarter ended June 30, 2015 be settled in cash in July 2015 to minimize dilution. The remaining $67.8 million obligation was settled and reinvested in 944,046 shares by the Manager on August 1, 2016 using the June 2016 volume weighted average share price of $71.84.


![MKIF - Investment Overview [Eng]...MACQUARIE KOREA INFRASTRUCTURE FUND 2008 INVESTMENT OVERVIEW 2008 INVESTMENT OVERVIEW | MACQUARIE KOREA INFRASTRUCTURE FUND | PAGE 1 fåîÉëíãÉåí=lîÉêîáÉï=](https://img.pdfslide.net/doc/110x75/5f43265310154310672004f7/mkif-investment-overview-eng-macquarie-korea-infrastructure-fund-2008-investment.jpg)