Embed Size (px)
Citation preview

Macro Chapter 5
Presentation 1
Trade surplus, trade deficit, GDP, Absolute/Comparative advantage
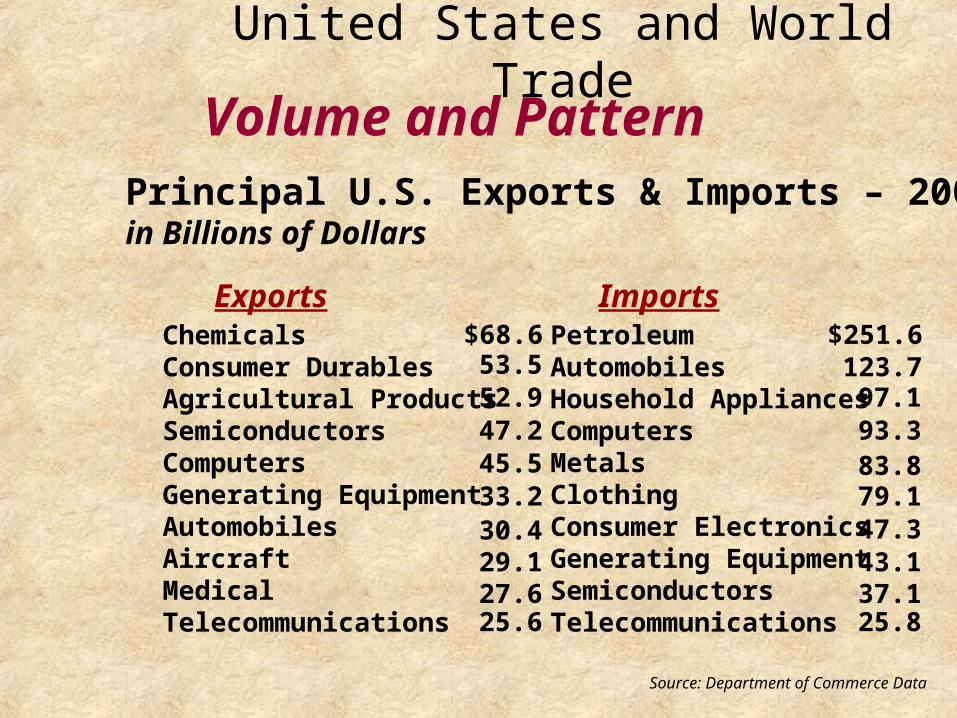
United States and World Trade
Volume and PatternPrincipal U.S. Exports & Imports – 2005in Billions of Dollars
ChemicalsConsumer DurablesAgricultural ProductsSemiconductorsComputersGenerating EquipmentAutomobilesAircraftMedicalTelecommunications
PetroleumAutomobilesHousehold AppliancesComputersMetalsClothingConsumer ElectronicsGenerating EquipmentSemiconductorsTelecommunications
Exports Imports
Source: Department of Commerce Data
$68.653.552.947.245.533.230.429.127.625.6
$251.6123.7
97.193.383.879.147.343.137.125.8
Gross Domestic Product (GDP)
• The total market value of all final goods and services produced in a given year
Trade Deficit
• Occurs when imports exceed exports
• **US has a trade deficit in goods
• The US had a $497.9 billion trade deficit in 2010… $1.8 trillion in exports minus $2.3 trillion in imports.

Trade Surplus
• Occurs when exports exceed imports
• ***US has a trade surplus in services such as transportation, legal, medical and financial services
• Trade surplus in services of $526 B in 2010

US Trade Balance

Trade Data
• **numerically, Canada is the biggest trading partner (16% of total trade)
• US has the biggest trade deficits to China and Mexico… trade surplus with Australia

Tariffs
• An excise tax on an imported product
• Used to encourage the purchase of domestic goods
Multinational Corporations
• Firms that have sizable production and distribution activities in other countries
• Ex- Coca-Cola (Atlanta), Nestle (Switzerland)
Specialization and Trade
• Specialization and international trade increase the productivity of a nation’s resources and allow for greater total output

Adam Smith Quote
• “It is the maxim of every prudent master of a family, never to attempt to make at home what it will cost him more to make than to buy.”
Absolute Advantage
• The ability of one person, company or country to produce more of a good or service than others using the same amount of resources

Comparative Advantage
• A lower opportunity cost than that of your competitor
• Give up less than the competition to produce a good

Comparative Advantage Output Problems
The following are the amount of cars and bikes Mike and Mary can produce in 1 day
# of cars # of Bikes
• Mike 4 6
• Mary 2 8
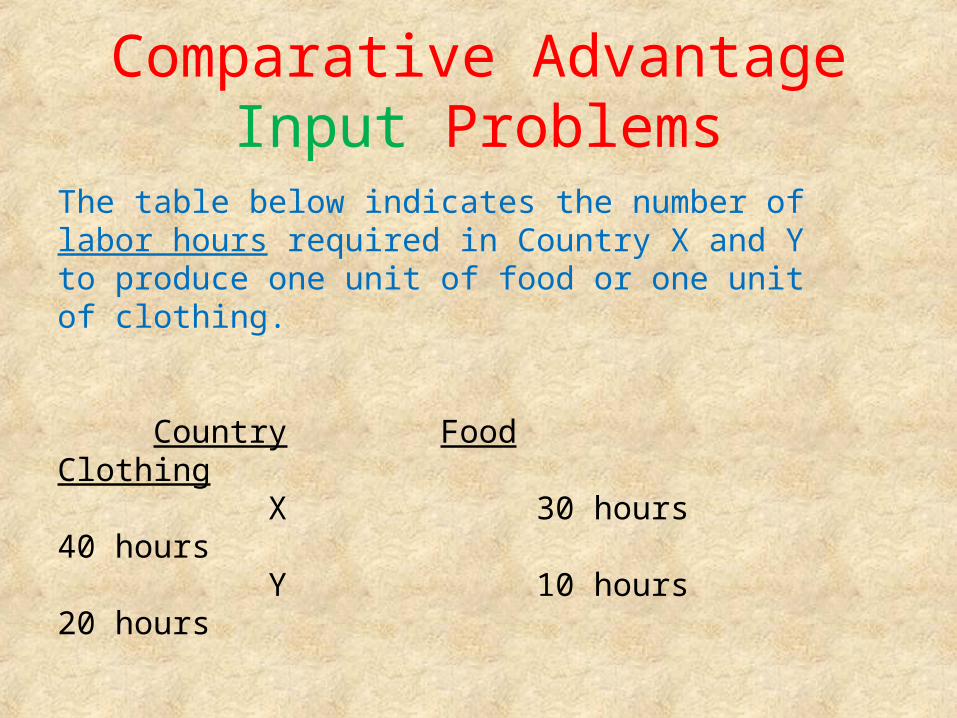
Comparative Advantage Input Problems
The table below indicates the number of labor hours required in Country X and Y to produce one unit of food or one unit of clothing.
Country Food Clothing X 30 hours 40 hours Y 10 hours 20 hours