Embed Size (px)
Citation preview
European Journal of Accounting Auditing and Finance Research
Vol.2, No.5, pp. 19-32, July 2014
Published by European Centre for Research Training and Development UK (www.ea-journals.org)
19
MACROECONOMIC VARIABLES AND SHARE PRICE MOVEMENTS IN NIGERIA
BREWERY INDUSTRY: EVIDENCE FROM NIGERIAN BREWERIES PLC.
Oliver Ike Inyiama Ph.D, FCA and Chike Nwoha PhD, FCNA
Department of Accountancy, Enugu State University of Science and Technology, Enugu State,
Nigeria.
ABSTRACT: The research aims at examining the relationship between macroeconomic variables
and the movement of share prices in Nigeria brewery industry, with emphasis on Nigeria
Breweries Plc; the largest beer producing brewery firm in Nigeria. The level of association of the
variables is validated using the ordinary least squares method, modeled in form of multiple
regression. Granger causality method was applied to examine the causality relationship among
the variables in the short run. Augmented Dickey- Fuller (ADF) test was conducted on all the
variables, complemented with the Phillip-Perron’s (PP) test for unit root to check for data series
stationary. All the variables except interest rate had the data series differenced at second
difference as a result of their unit root issues. Interest rate was however differenced at level and
intercept. The result indicates a positive but insignificant relationship between share price and
inflationary rate, real GDP and exchange rate while a negative and insignificant relationship is
found between share price and interest rate as only 13% of the variations in share price could be
explained by the independent variables. Correlation between share price and all the independent
variables are positive but largely weak. Granger causality test reveals no causal relationship
between share price and interest rate, inflationary rate, real GDP and exchange rate in the short
run. The paper recommends that macroeconomic variables should be seriously considered in
setting monetary and fiscal policies because of its multiplier effect on the economy.
KEYWORDS: Macroeconomics, Brewery, Share Prices, Regression, Causalities, Policies.
INTRODUCTION
The Nigeria brewery industry is one of the most viable industries in Nigeria especially since the
global financial crisis that brought the banking industry to its knees. Apart from the federal, state
and local government authorities in Nigeria, the brewery industry may be the next highest
employer of labour. The industry is very capital intensive and as a result, there is huge investment
outlay which is translated into heavy asset base through massive importations of machines and
materials. Their production lines are largely automated.
The production of beer and other alcoholic beverages in commercial quantity commenced in
Nigeria at about 1949. About this time, the foremost beer producing company in Nigeria, the
Nigeria Breweries Limited, now a public company, established its first brewery at a suburb in
Lagos called Igunlu. Up till 1960, the company had the monopoly of being the major beer
producing company before the likes of Golden Guinea, Guinness, West Africa Breweries and
North Breweries started making impact in the beer industry as they joined in 1962, 1963, 2964 and
1970, respectively (Okwo and Ugwunta, 2012). The company has grown very remarkably in asset

European Journal of Accounting Auditing and Finance Research
Vol.2, No.5, pp. 19-32, July 2014
Published by European Centre for Research Training and Development UK (www.ea-journals.org)
20
size, number of employees, branch networks and beer brands. It acquired three plants from
Heineken in 2011 and another plant in Ameke, Umuezeani at Ngwo, Enugu State, Nigeria which
is the sixth in their list of mega plants in the country. Many are of the opinion that the brewery at
Umuezeani Ameke Ngwo, Enugu State could be the largest brewery plant in Nigeria and even
West Africa.
However, the firm’s earnings and businesses are influenced by general economic conditions, the
performance of the financial markets, inflationary rates, money supply, interest rates, foreign
currency exchange rates, changes in laws, regulations and policies of the Central Bank, capital
market and other regulators as well as competitive factors on a global, federal, state and local
government basis (Vanguard, 2007).This is why Naik and Padhi(2012) submits that the stock
market avail long-term capital to the listed firms by pooling funds from different investors and
allow them to expand in business and also offers investors alternative investment avenues to put
their surplus funds in as they carefully watch the performance of stock markets.
Stock price movements as Aldin, Dehnavi and Entezari(2012) opines, are likely to be influenced
by many macroeconomic factors including political events, firms' guidelines, general economic
situations, inventory price index, investors' expectations, institutional investors' selections and
psychological factors. Citing Wang, Wang, Zhang and Guo (2011), the scholars concludes that the
accurate prediction of stock price movements is a very challenging and important issue which the
investors extensively regard in their investment decisions. Some of these factors which pivot
around the forces of demand and supply, may also determine whether a stock market is bearish or
bullish.
This paper therefore seeks to examine the extent to which foreign exchange rate, inflationary rate,
real gross domestic product and interest rate relate with share prices in Nigeria Brewery Sector.
The rest of this work is divided into four sections. Section 2 deals with the review of related
literature, Section 3 focuses on the methodology for data analysis while section 4 presents the
empirical results and discussion. Section 5 however concludes the study.
REVIEW OF RELATED LITERATURE
Theoretical Framework
Many divergent views trail the issue of stock price determination and the factors responsible. The
proponents of efficient market hypothesis are of the view that stock prices would be determined
primarily by fundamental factors such as earnings per share, dividend per share, payout ratio, size
of the firm and dividend yield, management and diversification (Srinivasan, 2012). However,
sequel to information asymmetry, stock market information may not be available to all
stakeholders at the same time. Citing Copeland and Weston (2005), Khan(2009) submits that the
source of the information asymmetry is the superior knowledge that managers have about the
firm’s prospects, while the investors in the firms comprise the uninformed group.
Consequently, the deficiency of Efficient Market Hypothesis saw the entrance of the Arbitrage
Pricing Model. The multifactor model as opine by Saeed and Akhter (2012) is based upon the
assumption that many macroeconomic factors such as Consumer Price Index, Interest Rate,

European Journal of Accounting Auditing and Finance Research
Vol.2, No.5, pp. 19-32, July 2014
Published by European Centre for Research Training and Development UK (www.ea-journals.org)
21
Industrial Production, Exchange Rate, Risk Free Rate and Money Supply are involved in the
determination of risk and return relationship. Hence, the Arbitrage Pricing Theory is the theory
underpinning this study.
Empirical Review The relationship between industrial production index, wholesale price index, money supply,
treasury bills rates, exchange rates and Indian Stock Index was examined by Naik and Padhi(2012)
applying Johansen’s co-integration and vector error correction as well as Granger Causality model.
The result, in line with the Arbitrage Pricing Model, reveals that macroeconomic variables and the
stock market index are co-integrated and hence, a long-run equilibrium relationship exists between
them. Stock prices relate positively to money supply and industrial production but negatively relate
to inflation while exchange rate and interest rate are insignificant determinants. Granger causality
test reveals that macroeconomic variable causes the stock prices in the long-run. Bidirectional
causality exists between industrial production and stock prices whereas, unidirectional causality
runs from money supply to stock price, stock price to inflation and interest rates to stock prices are
found.
Granger Causality model was applied after removing the effect of unit root from the data series by
Rasool, Fayyaz, Mumtaz (2012) in assessing the causal relationship between the stock price index
of KSE (Karachi Stock Exchange) and Exchange Rate (ER), Foreign Exchange Reserves (FER),
Industrial Production Index (IPI), Interest Rate (IR), Imports (M), Money Supply (MS), Wholesale
Price Index (WPI) and Exports (X). It was revealed that macroeconomics variables and stock
prices relate even in the long-run as supported by Naik and Padhi(2012). FER, IR, M, MS and
WPI relate positively and significantly with stock prices, while ER and X show a negative and
insignificant association with stock prices. IPI has a negative but significant relationship with stock
prices. Granger Causality reveals that MS and WPI have bi-directional relation; ER, FER and M
have uni-directional relationship while IPI, IR and X shows no casual relationship with stock
prices.
Using Augmented Dickey Fuller (ADF) test and estimate of error correction mechanism model,
Odior(2013) investigates the impact of macroeconomic factors on manufacturing productivity in
Nigeria. The cointegrating equation of the VECM reveals the presence of a long-run equilibrium
relationship. Loans and advances and foreign direct investment have positive and significant
impact on the level of manufacturing productivity in Nigeria, while broad money supply has less
impact. It recommends that government should create the right environment for manufacturers in
the area of infrastructure, financial, legal and property rights.
The vector error correction model (VECM), (Johansen (1991)) is utilized by Adel(2004) to
determine the impact of selected macroeconomic variables such as real economic activity, money
supply, inflation, and interest rate on Amman Stock Exchange (ASE). The result reveals that the
stock prices and macroeconomic variables have a long-term equilibrium relationship as supported
by Odior(2013) and Naik and Padhi(2012).
In an effort to validate the impact of macroeconomic factors such as Money Supply, Exchange
Rate, Industrial Production, Short Term Interest Rate and Oil prices on banking index within

European Journal of Accounting Auditing and Finance Research
Vol.2, No.5, pp. 19-32, July 2014
Published by European Centre for Research Training and Development UK (www.ea-journals.org)
22
Arbitrage Pricing context, Saeed and Akhter(2012) using regression approach carried out the
empirical analysis. The analysis results indicate that Oil Prices, Exchange Rate and Short Term
Interest Rate have significant impact on Banking index while Money Supply, Exchange Rate,
Industrial Production and Short Term Interest Rate show a negative relationship with banking
index.
Using Ordinary Least Square (OLS), the performance of the Arbitrage Pricing Theory (APT) in
the Nigerian Stock Exchange (NSE) was examined by Izedonmi and Abdullahi(2011). Inflation,
exchange rate and market capitalization were specially considered and the findings reveal that
there are no significant effects of those variables on the stocks’ return in Nigeria.
The relationship between interest rates, consumer price index, money supply, exchange rate, gold
prices, oil prices, current account deficit, export volume and Istanbul Stock Exchange (ISE)
industry index is examined by Ozcan(2012) using the Johansen’s cointegration test. The test result
reveals that macroeconomic variables exhibit a long run equilibrium relationship with the ISE
industry index as supported by.
In a related study, Mwangi(2013) tries to determine the effects of macroeconomic variables such
as real exchange rate, GDP growth rate, the change in money supply (M3), average annual lending
interest rates and inflation rate measured by annual percentage changes in the consumer price index
(CPI) on financial performance (proxied by Return on Assets (ROA)) of aviation industry in
Kenya. The results reveal that ROA has weak positive insignificant correlation with gross domestic
products growth rate and annual change in money supply M3 while a weak negative insignificant
correlation exist between ROA and exchange rate, annual average lending rate and annual average
inflation.
Olugbenga (2011) examines the impact of macroeconomic indicators such as money supply,
interest rate, exchange rate, inflation rate, oil price and gross domestic product on stock prices in
Nigeria using the pooled or panel model. The result reveals that macroeconomic variables have
varying significant impact on stock prices of individual firms in Nigeria.
The above review of related literature is an indication that there are varying results from different
countries, sectors and firms within the same industry. In Nigeria which is an emerging economy,
there is dearth of empirical study on the relationship between macroeconomic variables and stock
prices, especially in the brewery sector. This study is aimed at examining the extent to which
interest rate, inflationary rate, foreign exchange rate and real gross domestic product relate with
share prices of firms within the Nigeria brewery sector.
European Journal of Accounting Auditing and Finance Research
Vol.2, No.5, pp. 19-32, July 2014
Published by European Centre for Research Training and Development UK (www.ea-journals.org)
23
DATA AND METHODOLOGY
Data
Annual data was obtained for interest rate, inflation rate, foreign exchange rate and gross domestic
product from various issues of Central Bank of Nigeria (CBN) statistical bulletin especially the 50
years special anniversary edition while share prices as at 31st December of each year under
consideration was extracted from Nigeria Stock Exchange website.
Table 1: Description of Variables under Study
INFRATE Inflationary Rate(All items, Year on Change)
INTRATE Interest Rate
EXCHRATE Exchange Rate
RGDP Real Gross Domestic Product
SHPRICE Share Price
Methodology
The relationship between interest rate, inflation rate, foreign exchange rate, gross domestic product
and share prices of quoted brewery firms in Nigeria is examined in this study, in a bivariate
causality framework. The study employed an econometric model in data analysis that is consistent
with the studies done by Naik and Padhi(2012), Rasool, Fayyaz, Mumtaz (2012), Odior(2013),
Saeed and Akhter(2012), Izedonmi and Abdullahi(2011) and Ozcan(2012). Augmented Dickey
Fuller (ADF) and Phillips Perrons’(PP) Test is applied to test for stationary of the time series data.
The Granger causality test and the Johansen (1988) co-integration test are applied to test for
causality between each pair of the variables and long-run relationship between the macroeconomic
variables and share prices respectively. Augmented Dickey-Fuller test and Phillips Perrons’(PP)
Test reject a null hypothesis of unit root if the series are non-stationary and accept the alternate
hypothesis of stationary.
Granger-causality is normally tested in the context of linear regression models and specified as
follows in our bivariate linear autoregressive model of two variables X1 and X2 based on lagged
values as applied by Pasquale (2006) and cited in Inyiama(2013):
P p
X1(t) =∑ A11,jX1(t−j) + ∑ A12,jX2(t−j) + E1 (t)
j =1 j =1
P p
X2(t) =∑ A21,jX1(t−j) + ∑ A22,jX2(t−j) + E2 (t)

European Journal of Accounting Auditing and Finance Research
Vol.2, No.5, pp. 19-32, July 2014
Published by European Centre for Research Training and Development UK (www.ea-journals.org)
24
j =1 j =1
Where;
p is the maximum number of lagged observations included in the equation, the matrix A contains
the coefficients of the equation (i.e., the contributions of each lagged observation to the predicted
values of X1(t) and X2(t) ,
X1 is the share price which is constant while X2 takes the form of various macroeconomic indices
identified above and,
E1 and E2 are residuals (prediction errors) for each time series.
The primary model showing the relationship between interest rate, inflation rate, foreign exchange
rate, gross domestic product and share prices of quoted brewery firms in Nigeria is specified below:
Shprice = f (Intrate, Infrate, Exchrate, Rgdp)
Shprice = α0 +α1 Intratet +α2Infrate + α3Exchrate + α4Rgdp + εt.
To examine the relationship between Share Price and Interest Rate, Inflation Rate, Foreign
Exchange Rate and Real GDP as adopted in Inyiama(2013), the multiple regression equation is
estimated in the form:
SHPRICEt = K + β1 INTRATEt+ β2 INFRATEt + β3 EXCHRATEt + β4RGDP
Where
INFRATEt = Inflation Rate in time t (All items, Year on Change)
INTRATEt = Interest rate in time t
EXCHRATEt = Exchange rate in time t.
RGDPt = Real Gross domestic product in time, t.
SHPRICE = Share Price in time, t.
α0 is a constant term, ‘t’ is the time and ‘ε’ is the random error term.
DISCUSSION OF FINDINGS
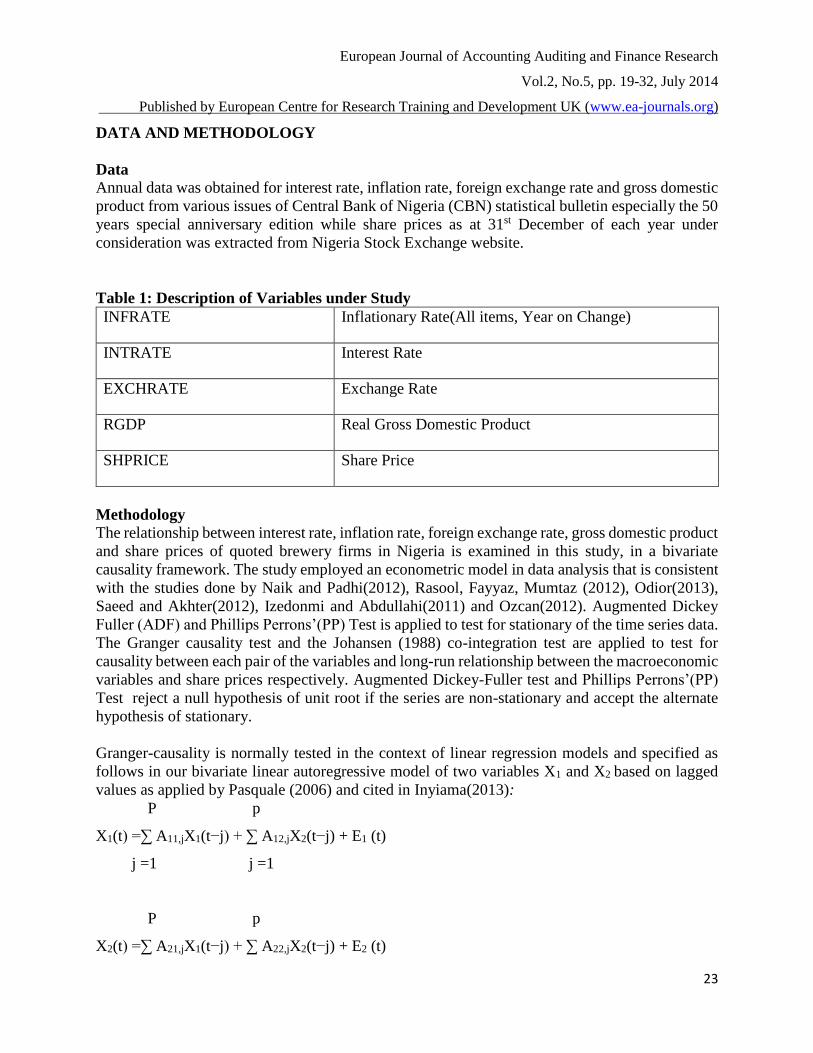
The data series is expected to be stationary to ensure the absence of unit root problems. To achieve
stationary of the data series, the data for the analysis are examined using the Augmented Dickey-
Fuller (ADF) test (Dickey and Fuller 1981) unit root tests which is complemented for robustness
of the estimates with the Phillip – Perrons(PP) Test.When the time series data which includes share
price, exchange rate, inflation rate, interest rate and real GDP series were checked for stationary,
the graphs reveal that there are unit root problems. The graphs were plotted to give the researcher
initial signal as to the existence of unit root in the series as the line graphs failed to cross the zero
line severally.

European Journal of Accounting Auditing and Finance Research
Vol.2, No.5, pp. 19-32, July 2014
Published by European Centre for Research Training and Development UK (www.ea-journals.org)
25
20
40
60
80
100
120
140
160
00 01 02 03 04 05 06 07 08 09 10 11 12
SHPRICE
4
8
12
16
20
24
00 01 02 03 04 05 06 07 08 09 10 11 12
INFRATE
6
8
10
12
14
16
18
20
00 01 02 03 04 05 06 07 08 09 10 11 12
INTRATE
300
400
500
600
700
800
900
00 01 02 03 04 05 06 07 08 09 10 11 12
RGDP
100
110
120
130
140
150
160
00 01 02 03 04 05 06 07 08 09 10 11 12
EXCHRATE
Figure 1: Graphical Representation of the Variables with Unit Root Issues
Source: Author’s EView 8.0 Output.
Table 2: Augmented Dickey- Fuller (ADF) Test Results
Test Critical Values
Variable 1% 5% 10% ADF Stat Status
Share Price -4.297073 -3.212696 -2.747676 -6.101887 1(2)
Inf. Rate -2.847250 -1.988198 -1.600140 -4.550151 1(2)
Int. Rate -4.121990 -3.144920 -2.713751 -4.315037 1(0)
Real GDP -5.295384 -4.008157 -3.460791 -12.39939 1(2)
Exch. Rate -.4.297073 -3.212696 -2.747676 -5.453782 1(2)
Source: Author’s EView 8.0 Computation

European Journal of Accounting Auditing and Finance Research
Vol.2, No.5, pp. 19-32, July 2014
Published by European Centre for Research Training and Development UK (www.ea-journals.org)
26
Table 3: Phillip- Perrons’ Test Results
Test Critical Values
Variable 1% 5% 10% ADF Stat Status
Share Price -4.297073 -3.212696 -2.747676 -7.187423 1(2)
Inf. Rate -.2.816740 -1.982344 -1.601144 -8.777988 1(2)
Int. Rate -4.121990 -3.144920 -2.713751 -4.185672 1(0)
Real GDP -5.295384 -4.008157 -3.460791 -11.97531 1(2)
Exch. Rate -.4.297073 -3.212696 -2.747676 -8.288309 1(2)
Source: Author’s EView 8.0 Computation
Tables 2 and 3 reveal that Share Price, Inflationary Rate, Real GDP and Exchange Rate achieved
stationary in their data series at second difference while Interest Rate attained stationary at level
and intercept. New data series emerged after differencing the series that were used in subsequent
computations except descriptive statistics that used raw data.
-40
-20
0
20
40
60
00 01 02 03 04 05 06 07 08 09 10 11 12
DSHPRICE
-10
-5
0
5
10
15
00 01 02 03 04 05 06 07 08 09 10 11 12
DINTRATE
-6
-4
-2
0
2
4
6
8
00 01 02 03 04 05 06 07 08 09 10 11 12
DINFRATE
20
30
40
50
60
70
80
00 01 02 03 04 05 06 07 08 09 10 11 12
DRGDP
-10
0
10
20
30
40
00 01 02 03 04 05 06 07 08 09 10 11 12
DEXCHRATE
Figure 2: Line Graphs of the Variables without Unit Root Issues
Source: Author’s EView 8.0 Output
The Figure 2 above show the line graphs resulting from the new data series that emerged for both
the dependent and independent variables of the study after differentiation. The graphs reveal that
the unit root problem is addressed as the lines crossed as many times, the zero line.

European Journal of Accounting Auditing and Finance Research
Vol.2, No.5, pp. 19-32, July 2014
Published by European Centre for Research Training and Development UK (www.ea-journals.org)
27
Table 4: Descriptive Statistics of the Variables
SHPRICE INFRATE INTRATE RGDP EXCHRATE
Mean 56.40462 12.14615 11.73077 600.2962 131.5054
Median 42.80000 12.00000 12.00000 595.8000 129.2200
Maximum 147.0000 20.50000 18.90000 887.8600 155.7000
Minimum 24.62000 6.000000 6.600000 329.2000 101.7000
Std. Dev. 33.48185 4.099719 3.313202 175.6768 16.87423
Skewness 1.683588 0.301339 0.327360 0.040590 0.002673
Kurtosis 5.148227 2.582678 3.101436 1.978588 2.064057
Jarque-Bera 8.641078 0.291079 0.237763 0.568681 0.474510
Probability 0.013293 0.864556 0.887913 0.752510 0.788790
Sum 733.2600 157.9000 152.5000 7803.850 1709.570
Sum Sq.
Dev. 13452.41 201.6923 131.7277 370347.9 3416.876
Observations 13 13 13 13 13
Source: Author’s Eview8 Output
Table 4 reveals, most importantly, the mean, maximum and minimum values for the series. The
skewness coefficients of interest rate, inflationary rate, real GDP and exchange rate have values less
than 1. This indicates a normal frequency distribution while that of share price show that the frequency
is not normally distributed given skewness coefficient higher than unity. Kurtosis coefficient supports
this findings as only share price indicates an abnormal distribution with coefficient higher than 4.
Jarque-Bera statistic which reveals that frequency distribution is not normal when the p-value is
significant also supports the findings as only share price indicates a significant p-value of 0.013293.
Real GDP shows a very volatile standard deviation.
Table 5: Coefficient of Regression Result
Variable Coefficient Std. Error t-Statistic Prob.
DINFRATE 2.336188 3.335210 0.700462 0.5062
DINTRATE -0.177058 2.447116 -0.072354 0.9443
DRGDP 0.274271 0.698212 0.392819 0.7061
DEXCHRATE 0.241845 0.743816 0.325141 0.7546
C -3.175306 33.73125 -0.094135 0.9276
R-squared 0.131421 Mean dependent var 10.19833
Adjusted R-squared -0.364911 S.D. dependent var 20.00762
S.E. of regression 23.37478 Akaike info criterion 9.435529
Sum squared resid 3824.663 Schwarz criterion 9.637574
Log likelihood -51.61318
Hannan-Quinn
criter. 9.360725
F-statistic 0.264784 Durbin-Watson stat 2.301789
Prob(F-statistic) 0.891616
Source: Author’s EView 8.0 Computation

European Journal of Accounting Auditing and Finance Research
Vol.2, No.5, pp. 19-32, July 2014
Published by European Centre for Research Training and Development UK (www.ea-journals.org)
28
Equation: Share Price = -3.175306 + 2.336188(INFRATE) -0.177058(INTRATE) +
0.274271(RGDP)
+ 0.241845(EXCHRATE) + et
Table 5 indicates that a positive but insignificant relationship exists between share price and
inflationary rate, real GDP and exchange rate while a negative and insignificant relationship is found
between share price and interest rate. It further reveals that only 13% of the variations in share price
could be explained by the independent variables while about 87% may be attributable to error term,
chance and other variables not considered. This is in line with the findings of Naik and Padhi(2012)
where stock price shared insignificant relationship with interest rate and exchange rate. Izedonmi and
Abdullahi(2011) also lends support to the findings.
Table 6: Correlation Results
DSHPRICE DINFRATE DINTRATE DRGDP DEXCHRATE
DSHPRICE 1.000000 0.264569 0.073501 0.146906 0.096089
DINFRATE 0.264569 1.000000 0.697129 -0.245320 -0.190902
DINTRATE 0.073501 0.697129 1.000000 -0.603841 -0.199216
DRGDP 0.146906 -0.245320 -0.603841 1.000000 0.207064
DEXCHRATE 0.096089 -0.190902 -0.199216 0.207064 1.000000
Source: Author’s EView 8.0 Computation
Table 6 depicts a positive correlation between share price and all the independent variables under
study. However, very weak correlation is found in almost all the association except for rate of inflation
which shows a 26.5% correlation with share price. The findings is in line with that of
Olugbenga(2011).
Table 7: Pairwise Granger Causality Tests
Date: 04/02/14 Time: 22:32
Sample: 2000 2012
Lags: 2
Null Hypothesis: Obs F-Statistic Prob.
DINFRATE does not Granger Cause
DSHPRICE 10 3.54546 0.1100
DSHPRICE does not Granger Cause DINFRATE 4.24905 0.0835
DINTRATE does not Granger Cause
DSHPRICE 10 2.46507 0.1799
DSHPRICE does not Granger Cause DINTRATE 0.11901 0.8902

European Journal of Accounting Auditing and Finance Research
Vol.2, No.5, pp. 19-32, July 2014
Published by European Centre for Research Training and Development UK (www.ea-journals.org)
29
DRGDP does not Granger Cause DSHPRICE 10 1.20673 0.3736
DSHPRICE does not Granger Cause DRGDP 2.72179 0.1586
DEXCHRATE does not Granger Cause
DSHPRICE 10 0.36467 0.7115
DSHPRICE does not Granger Cause DEXCHRATE 0.11006 0.8979
Source: Author’s EView 8.0 Computation
Granger causality test shown above reveals no causal relationship between share price and interest
rate, inflationary rate, real GDP and exchange rate in any direction. This is evidenced by the low
F-statistic and the insignificant P-values. The findings is in line with that of Naik and Padhi(2012),
Rasool, Fayyaz and Muntaz (2012), Ozcan(2012) and Saeed,and Akhter(2012). In all these studies,
no short run relationship was indicated by the causality test. However, they provide evidence of a
long run relationship between the independent variables (interest rate, inflationary rate, exchange
rate and real GDP) and the dependent variable (share price).
CONCLUSION
An in-depth knowledge of causalities and correlations between macroeconomic indicators and
share price is very important to the key beneficiaries of this work. The study is significant to policy
makers, regulatory bodies, professional institutes and associations, government agencies, planning
commissions and parastatals, standard setting bodies, research institutes, institutions of higher
learning, financial institutions, manufacturing and service sectors and so on. Macroeconomic
variables should drive the wheels of economic development in an economy. If the economic
planners are aware of the interactions and inter-relationships between and among these variables,
it will be a lot easier to set macroeconomic targets that are attainable. It accords to logical reasoning
to believe that macroeconomic variables could influence share price either in the short or long run
and in varying directions and magnitudes.
The result of the study confirms our a priori expectation to a reasonable extent. Positive but
insignificant relationship exists between share price and inflationary rate, real GDP and exchange
rate while a negative and insignificant relationship is found between share price and interest rate
as only 13% of the variations in share price could be explained by the independent variables.
Correlation between share price and all the independent variables under study are positive but
largely weak. Granger causality test reveals no causal relationship between share price and interest
rate, inflationary rate, real GDP and exchange rate.
However, no matter how insignificant the level of influence is, a unit increase in a macroeconomic
variable could result in a serious multiplier effect capable of stimulating more than a proportionate
feedback due to volatility. This implies that the direction of relationship and correlation is of
paramount concern to planners, policy makers and standard setters. Since the direction and
magnitude of their relationship could be estimated to a reasonable extent and considering the
volatile nature of these variables, Nigeria Economic Summit Group, the Coordinating Minister for
the economy, the Central Bank of Nigeria, capital market regulators and captains of brewery
European Journal of Accounting Auditing and Finance Research
Vol.2, No.5, pp. 19-32, July 2014
Published by European Centre for Research Training and Development UK (www.ea-journals.org)
30
industries in Nigeria should really consider these findings in their pursuit of enhanced performance
and the transformation agenda of the federal government of Nigeria.
REFERENCES
Adel, A.(2004)The Dynamic Relationship Between Macroeconomic Factors And The Jordanian
Stock Market, International Journal of Applied Econometrics and Quantitative Studies,
1(1).
Aldin, M., Dehnavi, D. and Entezari, S.(2012), Evaluating the Employment of Technical
Indicators in Predicting Stock Price Index Variations Using Artificial Neural Networks
(Case Study: Tehran Stock Exchange), International Journal of Business and Management;
7, (15).
Central Bank of Nigeria (CBN), Annual Reports and Statement of Accounts - Various Years.
Central Bank of Nigeria, CBN (2000): “The Changing Structure of the Nigerian Economy and
Implications for Development”, Realm Communications Ltd, Lagos.
Dickey, D. A., Fuller, W. A. (1979). Distribution of the Estimators for Autoregressive Time Series
with a Unit Root. Journal of the American Statistical Association, 74, 427-431.
Engle, R.F. (1982). Autoregressive conditional heteroskedasticity with estimates of the variance
of United Kingdom inflation. Econometrica, 50, 987-1008.
Engle, R. F and Granger, C. W. J.(1987). Co-Integration and Error-Correction: Representation,
Estimation and Testing, Econometrica, 55, 251-276.
Granger, C. W. J.(1986), Developments in the Study of Cointegrated Economic Variables, Oxford
Bulletin of Economics and Statistics 48, 213-27.
Granger; C.W.J (1969), Some recent developments in a concept of causality,Journal of
Econometrics, Vol. 39, pp: 199-211.
Inyiama, O.(2013), Does Inflation Weaken Economic Growth? Evidence from Nigeria, European
Journal of Accounting Auditing and Finance Research,
1(4), 139-150.
Izedonmi, F and Abdullahi, B.(2011), The Effects of Macroeconomic Factors on the Nigerian
Stock Returns: A Sectoral Approach, Global Journal of Management and Business
Research, 11 (7).
Johansen, S (1988), Statistical Analysis of Cointegration Vectors, Journal of Economic
Dynamics and Control, 12, 231-254.
Johansen, S. (1991), Estimation and Hypothesis Testing of Cointegrating Vectors in Gaussian
Vector Autoregressive Models, Econometrica 59, 1551-80.
Khan,S. H. (2009). Determinants of Share Price Movements in Bangladesh: Dividends and
Retained Earnings. Retrieved Match 29, 2014 from
http://btu.se/fou/cuppsats.nsf/all/7a3a58f2c2af8ba1c,1257695000a3b1d/$file/Final%20Ver
sion.pdf.
Malhotra, N and Tandon, K.(2013), Determinants of Stock Prices: Empirical Evidence from NSE
100 Companies, International Journal of Research in Management and Technology
(IJRMT), 3(3).

European Journal of Accounting Auditing and Finance Research
Vol.2, No.5, pp. 19-32, July 2014
Published by European Centre for Research Training and Development UK (www.ea-journals.org)
31
Mwangi, F. K (2013), The Effect Of Macroeconomic Variables On Financial Performance Of
Aviation Industry In Kenya,
http://erepository.uonbi.ac.ke:8080/xmlui/handle/123456789/58551
Naik and Padhi, (2012), The Impact of Macroeconomic Fundamentals on Stock Prices Revisited:
Evidence from Indian Data, Eurasian Journal of Business and Economics, 5 (10), 25-44.
Olugbenga A. A(2011), The Impact of Macroeconomic Indicators on Stock Prices In Nigeria,
Developing Country Studies www.iiste.org, l 1(2).
Ozcan, A.(2012), The Relationship Between Macroeconomic Variables and ISE Industry Index,
International Journal of Economics and Financial Issues, 2 (2), 184-189 Pasquale, F. (2006). "Testing for Granger causality between stock prices and economic growth," MPRA
Paper 2962, University Library of Munich, Germany, revised 2007. Phillips, P. C. B., and P. Perron, (1988), Testing for a Unit Root in Time SeriesRegression,
Biometrika 75, 335-46.
Saeed, S And Akhter, N(2012), Impact Of Macroeconomic Factors On Banking Index In Pakistan,
Interdisciplinary Journal Of Contemporary Research In Business Institute Of
Interdisciplinary Business Research, (4)6.
Srinivasan, P.(2012), Determinants of Equity Share Prices in India: A Panel Data Approach, The
Romanian Economic Journal,205.
Wang, J., Wang, J., Zhang, Z., and Guo, S. (2011). Forecasting stock indices with Back
propagation neural network. Expert Systems with Applications, 37 7056–7064.
http://dx.doi.org/10.1016/j.eswa.2011.04.222
Vanguard (2007), Macroeconomic Factors Affecting our Financial Condition and Results of Operations, Unibanco Brasileiros S.A. (UBB)


![KevinMilligan MichaelSmart August2017 · Results: Ordinaryleastsquaresestimates (1) (2) (3) VARIABLES Log1%share Log1%share Log1%share Owntaxrate -2.31** -2.18*** -2.18*** [0.93]](https://img.pdfslide.net/doc/110x75/5fc2036594954800f423d29b/kevinmilligan-michaelsmart-results-ordinaryleastsquaresestimates-1-2-3-variables.jpg)