Embed Size (px)
Citation preview
© 2014 Research Academy of Social Sciences
http://www.rassweb.com 129
International Journal of Financial Economics
Vol. 2, No. 3, 2014, 129-141
Macroeconomic Variables and Capital Market Performance:
Evidence from Nigeria
Oliver Ike Inyiama1, Michael Chidiebere Ekwe
2
Abstract
The study aims at determining the causalities, correlation, cointegration and the relationship between the
Nigeria Stock Exchange All Share Index(ASI), which is the proxy for capital market performance and
macroeconomic variables proxied by monetary policy rate, inflationary rate, foreign exchange rate and real
gross domestic product from 1985 to 2013. Granger Causality procedure was applied in determining the
causalities, multiple regression model in the form of Ordinary Least Square (OLS) method was applied in
evaluating the relationship between the dependent and independent variables while correlation technique was
applied in ascertaining the strength of the relationship. Johansen cointegration procedure was applied in
testing the sustainability of the relationship in the long run. To test for stationary of the data series, the
Augmented Dickey Fuller (ADF), Phillips-Perron (PP) and the Kwiatkowski-Phillips-Schmidt-Shin (KPSS)
procedures were applied. All the series were non stationary. Except for real gross domestic product which
was differenced at second difference, all the other variables were differenced at first difference. Inflationary
rate, exchange rate and the log of real GDP are negatively but insignificantly related to the log of All Share
Index while interest rate is positively but not significantly related to All Share Index. No causality was
revealed in lag 2 but in lag 1, there is a unidirectional causality running from log of All Share Index to
foreign exchange rate. Johansen cointigration reveals a long run relationship among the variables. The
implication of the findings is that effective regulation of macroeconomic policies, in the direction of the
findings of this study, could impact positively on the performance of the capital market.
1. Introduction
The mobilization, facilitation and accumulation of finance from surplus to deficit sectors of the
economy for investment purposes are the main function of the capital market globally. This effort is however
geared towards the growth and development of emerging economies and sustainability in developed
economies. Osisanwo and Atanda (2012) submits that Capital market is a market for government securities
and corporate bonds and includes all financial institutions established for the purpose of granting of medium
and long-term loans for development. Ita and Duke (2013) explained that mobilization and allocation of
investment funds when done effectively, will enable business and economies maximize human, material and
management resources for optimal output. They emphasized that the stock market is the channel through
which efficiency in capital mobilization, formation and allocation is achieved.
The stock market, as opine by Sohail and Hussain (2009) mobilizes savings from a group of small
savers (including civil servants, small farmers, artisans, small business proprietors, itinerant workers, etc),
activates investment projects, poses as mediator and even a regulator between the small savers and their
borrowers, channels funds into desirable investment, supports reallocation of funds among corporations and
sectors and provides liquidity for domestic expansion and credit growth.
The Nigeria Stock Exchange (NSE), which is an automated exchange, was in 1960 created to provide
listing, trading, clearing, settlement, custodian, delivery, data dissemination and market indices services
1Department of Accountancy, Enugu State University of Science and Technology, Enugu State, Nigeria
2Department of Accountancy, Enugu State University of Science and Technology, Enugu State, Nigeria

O. I. Inyiama & M. C. Ekwe
130
through its associate company, the Central Securities Clearing System (CSCS) Plc. The Securities and
Exchange Commission (SEC) was however established in 1979 to develop and regulate the nation’s capital
market as well as fix stock issue prices after establishing the basis of allotment. The stock exchange was
established to develop the capital market through the promotion of private capital investment for growth and
development (Osisanwo and Atanda, 2012). They emphasized that the capital market offers opportunities to
local and foreign investors to provide long-term funds, far longer than the duration for which they are willing
to commit their funds, in exchange for long-term financial assets.
The success of an increasing privatization of emerging economies like Nigeria will depend crucially on
the presence of an active and efficient stock market. This is the view of Nguyen and Nguyen (2012) citing
Islam and Khaled (2005). They submit that most rational investors are expected to move their investments
into the most profitable projects with an acceptable risk exposure. When a stock market is reasonably large
and developed, it is assumed to serve as an indicator of economic soundness, health and prospects of the
emerging economy and an index of the confidence of domestic and global investors (Ali, 2011).
Prantik
and Vina(2009) explain that it has always been known globally that the stock market esponds to
a large extent to movements in macroeconomic indicators and recently, there has been widespread argument
that the direction of the influence is in the opposite direction. Asaolu and Ogunmuyiwa (2010) submit that
while developed economies like the USA and Canada have taken advantage of the capital market to mobilize
resources for growth and development, the developing countries like Nigeria are yet to fully explore the
benefits of raising capital through the developing capital market. Citing Anyanwu (2005), Ita and Duke
(2013) reveals that in Nigeria, the majority of the studies on stock market growth or development centered on
the relationship between stock market and economic growth while the very few that focused on analyzing the
macroeconomic indicators that determine stock market development restricted themselves to the use of
narrower measures.
This study will however focus on the evaluation of the relationship and causalities between
macroeconomic indicators such as foreign exchange rate, inflationary rate, interest rate and gross domestic
product on capital market performance variable proxied by All Share Index. Nigeria Stock Exchange website
states that the index is an aggregate of the market capitalisation of all of the industrial equities listed in the
market which is computed as the percentage of Current Market Value to Base Market Value of the industrial
equities. The remaining part of the study is divided into four sections. Section 2 focuses on the review of
related literature, Section 3 handles the aspect of methodology for data analysis while section 4 deals with
presentation of empirical findings and discussion of results. Section 5 concludes the study.
2. Review of Related Literature
Theoretical Framework
The study adopts the Arbitrage Pricing Theory (APT) by Ross (1976) as a result of the criticisms
leveled on the popular Efficient Market Hypotheses (EMH). It is believed that most markets have not been
proven to be efficient in getting market information across to the users and/or participants at the same time so
as to influence their investments and returns. Nguyen and Nguyen (2012) submits that the term efficiency is
used to describe a market in which all relevant information is immediately impounded into the price of
financial assets such that investors cannot expect to achieve superior profits from their investment strategies.
Osisanwo and Atanda (2012) opine that early empirical work on APT centered on returns from individual
securities. They argue that it may also be used in an aggregate stock market framework; a situation where a
change in a given macroeconomic variable could reflect a change or cause a movement in an underlying
systemic risk factor, thereby determining future returns. In support of this argument, Rashid (2008) opine
that the Arbitrage Pricing Theory attempts to establish a link between risk associated with particular
macroeconomic variables such as foreign exchange rate, monetary policy rate, gross domestic product, broad
money supply, inflationary rate and expected asset returns as economic forces, especially demand and supply
forces, affect discount rates, ability of firms to generate cash flows and future dividend payments.
International Journal of Financial Economics
131
Empirical Review
Using cointegration and error correction version of Granger causality tests, Nguyen and Nguyen (2012)
investigates the relationship between stock prices and macroeconomic variables in Vietnam stock exchange.
It was revealed that Vietnamese stock market is not informationally efficient in both short- and long-run. The
implication is that the Efficient Market Hypothesis does not hold in this regard as a professional trader can
still make abnormal returns.
In Pakistan, Sohail and Hussain (2009), using VECM analysis, examined the long and short-run
relationships between Lahore Stock Exchange and macroeconomic variable. It was revealed that inflation
rate needs to come down to improve stock returns while exchange rate and money supply associate with
stock returns positively. This implies that a stronger naira to the dollar rate or at least an improvement from
the present exchange rate is desirable to increase stock returns.
An attempt was made by Prantik and Vani (2009) by applying VAR and Artificial Neural Network to
exhume the relationship between the real economic variables and the capital market in India. The study
shows that interest rate, output, money supply, inflation rate and the exchange rates are capable of causing
movements in stock market indices. However, other variables have very negligible impact on the stock
market.
Asaolu and Ogunmuyiwa (2010) in a related study and using Granger Causality test, Co-integration and
Error Correction Method (ECM), investigates the impact of macroeconomic variables on Average Share
Price (ASP) and goes further to determine whether changes in macroeconomic variables explain movements
in stock prices in Nigeria. The analysis reveals a weak relationship between Average Share Price and
macroeconomic variables in the long run.
The relationships between Indian stock market index (BSE Sensex) and five macroeconomic variables
were investigated by Naik and Padhi (2012) using Johansen’s co-integration and vector error correction
model. Long run co integration was revealed as stock prices relate positively to money supply and industrial
production but negatively to inflation. Macroeconomic variable however causes the stock prices in the long-
run as unidirectional causality runs from money supply to stock price, stock price to inflation and interest
rates to stock prices.
Agrawal, Srivastav and Srivastava (2010) analyzes the relationship between Nifty returns and Indian
rupee-US Dollar Exchange Rates and found that Nifty returns and Exchange Rates were non-normally
distributed and correlated negatively. Unidirectional Causality runs from Nifty returns to Exchange Rates.
Simple and multiple regression analysis was applied by AL- Shubiri (2010) to examine the relationship
between micro and macroeconomic factors with the stock prices and found highly positive significant
relationship between market price of stock and net asset value per share; market price of stock dividend
percentage, gross domestic product and negative significant relationship on inflation and lending interest
rate.
Hussainey and Ngoc (2009) investigates the effects of interest rate and the industrial production on
Vietnamese stock prices using cointegration approach and citing Nasseh and Strauss (2000) and Canova and
de Nicolo (1995). The paper found that there are statistically significant associations among the domestic
production sector, money markets, and stock prices in Vietnam and that the US macroeconomic
fundamentals significantly affect Vietnamese stock prices.
Using Augmented Dickey Fuller test, Johansen’s co-integration and Granger’s causality test, Ali,
Rehman, Yilmaz, Khan and Afzal (2009) examined the causal relationship between macro-economic
indicators (inflation, exchange rate, balances of trade and index of industrial production) and stock market
prices (represented by the general price Index) in Pakistan Karachi Stock Exchange. Co-integration was
found between industrial production index and stock exchange prices but no causal relationship was found
between macro-economic indicators and stock exchange prices.

O. I. Inyiama & M. C. Ekwe
132
Olugbenga (2011), panel model, investigates the impact of macroeconomic indicators (money supply
(BRDM), interest rate (INTR), exchange rate (ECHR), inflation rate (INF), oil price (OIL) and gross
domestic product (GDP)) on stock prices in Nigeria at the firm’s level. The study found that apart from
inflation rate and money supply, all the other macroeconomic variables have significant impacts on stock
prices in Nigeria.
The above review of related literature indicates that most of the studies on macroeconomic indicators
and capital market performance were done in countries outside Nigeria and at firm levels. Most of the few
studies also did not consider the impact of these indicators on the All Share Index(ASI) which is a broad
based index indicating a total stock market index that paints the overall picture of movements in the prices of
equity shares on a daily basis. However, an attempt in this regard in Nigeria dates back to 2008 using simple
regression and failing to consider Granger causalities among the variables under study. In this study, an
attempt is made to validate the relationship between the macroeconomic variables and All Share Index in a
multiple regression model and to ascertain the causality relationships as well as cointegration among the
variables between 1985 and 2013 in Nigeria.
3. Methodology
Foreign Exchange Rate, Interest Rate, Inflationary Rate and Real Gross Domestic Product data were
obtained from Central Bank Statistical bulletins for several years especially the CBN Statistical Bulletin, 50
years special Anniversary edition. All Share Index time series data was collected from the Nigeria Stock
Exchange for the period covering 1985 to 2013. The choice of 1985 was based on availability of data for the
analysis.
The relationship between the measure of capital market performance (All Share Index) and the
macroeconomic variables (foreign exchange rate, interest rate, inflationary rate and the real gross domestic
product) was estimated using the multiple regression approach. The causalities among the dependent and
independent variables especially at the short run were examined by applying the Granger Causality model
after using the Augmented Dickey Fuller (ADF) and Phillips Perrons’(PP) Test to check for stationary of the
time series data. The Johansen’s cointegration approach is applied to test for long run relationship among and
between the variables under study.
Citing Pasquale (2006), Inyiama(2013) submits that Granger-causality is normally tested in the context
of linear regression models and specified as follows in our bivariate linear autoregressive model of two
variables X1 and X2 based on lagged values as follows:
P p
X1(t) =∑ A11,jX1(t−j) + ∑ A12,jX2(t−j) + E1 (t)
j =1 j =1
P p
X2(t) =∑ A21,jX1(t−j) + ∑ A22,jX2(t−j) + E2 (t)
j =1 j =1
Where;
p is the maximum number of lagged observations included in the equation, the matrix A contains the
coefficients of the equation (i.e., the contributions of each lagged observation to the predicted values of X1(t)
and X2(t) ,
X1 is the share price which is constant while X2 takes the form of various macroeconomic indices identified
above and,
E1 and E2 are residuals (prediction errors) for each time series.
The econometric model applied in data analysis is consistent with the studies done by Hussainey and
Ngoc (2009), Olugbenga (2011), Ali, Rehman, Yilmaz, Khan and Afzal (2009), Agrawal, Srivastav and
Srivastava (2010), Naik and Padhi (2012), Asaolu and Ogunmuyiwa (2010) and Sohail and Hussain (2009).

International Journal of Financial Economics
133
The relationship between foreign exchange rate, interest rate, gross domestic product, inflation rate and
All Share Index (ASI) is specified by the primary model shown below:
ASI = f (Intrate, Infrate, Exchrate, Rgdp)
ASI = α0 +α1 Intrate +α2Infrate + α3Exchrate + α4Rgdp + εt.
Table 1: Description of Variables
INFRATE Inflationary Rate(All items, Year on
Change)
INTRATE Interest Rate
EXCHRATE Exchange Rate
RGDP Real Gross Domestic Product
ASI All Share Index
Multiple regression equation is applied in examining the relationship between All Share Index (ASI)
and Interest Rate, Inflation Rate, Foreign Exchange Rate and Real GDP as adopted in Inyiama(2013). The
equation is estimated in the form:
ASIt = K + β1 INTRATEt+ β2 INFRATEt + β3 EXCHRATEt + β4RGDP
Where;
INFRATEt = Inflation Rate in time t (All items, Year on Change)
INTRATEt = Interest Rate in time t
EXCHRATEt = Exchange Rate in time t.
RGDPt = Real Gross Domestic Product in time, t.
ASI = All Share Index in time, t.
α0 is a constant term, ‘t’ is the time and ‘ε’ is the random error term.
4. Discussion of Findings
Test of stationary is carried out on all the time series data to check for unit root problems. To achieve
this, three methods of testing for unit root were adopted namely, the Augmented Dickey Fuller (ADF),
Phillips-Perron (PP) and the Kwiatkowski-Phillips-Schmidt-Shin (KPSS) procedure. Data is expected to be
stationary as opine by Naik and Padhi (2012), emphasizing that the mean and variance of such data series
should be constant throughout the period and the value of covariance between two time periods should
depend only on the distance between the two periods and not the time at which the covariance is computed.
This condition is only achievable when the time series data is stationary.
The time series data which includes log of All Share Index, Inflationary Rate, Interest Rate, Foreign
Exchange Rate and log of Real Gross Domestic Product were tested and they could not pass the stationary
test. The graphs below were preliminary evidence of the unit root issues as the line graphs failed to cross the
zero lines repeatedly. However, time series data is integrated of order d when it becomes stationary after
being differenced d times as opine by Hosseini, Ahmad and Lai(2011). This is to avoid spurious results
which may arise as a result of carrying out regressions on time series data with unit root (Asaolu and
Ogunmuyiwa, 2010).

O. I. Inyiama & M. C. Ekwe
134
0
10,000
20,000
30,000
40,000
50,000
60,000
1985 1990 1995 2000 2005 2010
ASINDEX
5
10
15
20
25
30
1985 1990 1995 2000 2005 2010
INFRATE
0
20
40
60
80
1985 1990 1995 2000 2005 2010
INTRATE
0
40
80
120
160
1985 1990 1995 2000 2005 2010
EXCHRATE
0
200
400
600
800
1,000
1985 1990 1995 2000 2005 2010
REALGDP
Figure 1: Graphical Representation of the Variables with Unit Root
Source: Author’s EView 8.0 Output.
Table 2: Augmented Dickey- Fuller (ADF) Test Results
Null Hypothesis: Time Series Data are not Stationary
ALL SHARE
INDEX (LOG)
INFLATION
RATE
INTEREST
RATE
EXCHAN
GE RATE
REAL
GDP
(LOG)
ADF Statistic -4.037542 -7.627110 -4.554271 -5.013504 -7.287220
Critical Value:
1% -3.699871 -3.699871 -3.699871 -3.699871 -3.711457
5% -2.976263 -2.976263 -2.976263 -2.976263 -2.981038
10% -2.627420 -2.627420 -2.627420 -2.627420 -2.629906
Status 1(1) 1(1) 1(1) 1(1) 1(2) Source: Author’s EView 8.0 Computation
Table 3: Phillip-Perron’s (PP) Test Results
Null Hypothesis: Time Series Data are not Stationary
PP Statistic -4.045778 -8.241867 -4.726881 -5.013504 -7.287220
Critical Value:
1%
-3.699871 -3.699871 -3.699871 -3.699871 -3.711457
5% -2.976263 -2.976263 -2.976263 -2.976263 -2.981038
10% -2.627420 -2.627420 -2.627420 -2.627420 -2.629906
Status 1(1) 1(1) 1(1) 1(1) 1(2)
PP Statistic -4.045778 -8.241867 -4.726881 -5.013504 -7.287220 Source: Author’s EView 8.0 Computation

International Journal of Financial Economics
135
Table 4: Kwiatkowski-Phillip’s-Schmidt-Shin(KPSS) Test Results
Null Hypothesis: Time Series Data are not Stationary
KWSS Statistic 0.273198 0.183014 0.165047 0.097043 0.030499
Critical Value:
1%
0.739000 0.739000 0.739000 0.739000 0.739000
5% 0.463000 0.463000 0.463000 0.463000 0.463000
10% 0.347000 0.347000 0.347000 0.347000 0.347000
Status 1(1) 1(1) 1(1) 1(1) 1(2)
KWSS Statistic 0.273198 0.183014 0.165047 0.097043 0.030499 Source: Author’s EView 8.0 Computation
Tables 2, 3 and 4 reveals that when the Augmented Dickey Fuller (ADF), Phillips-Perron (PP) and the
Kwiatkowski-Phillips-Schmidt-Shin (KPSS) procedures were applied respectively in testing for unit root in
the time series data, the log of All Share Index, Inflationary Rate, Interest Rate and Foreign Exchange Rate
achieved stationary at first difference and intercept. Log of Real Gross Domestic Product attained stationary
at second difference and intercept. This means that the time series data except log of real gross domestic
product were integrated of the order one.
Citing Asteriou (2007), Nguyen and Nguyen (2012) submits that most macroeconomic variables are
cointegrated of order one. The result of the unit root test is also supported by other related literature which
established that most macroeconomic variables and stock indexes time series data are non stationary, as they
tend to exhibit either a deterministic or a stochastic trend (Asaolu and Ogunmuyiwa, 2010).The reason for
applying the Phillips-Perron (PP) procedure is because the ADF Test has been accused of its low power
while the Kwiatkowski-Phillips-Schmidt-Shin (KPSS) test was for robustness of the model. The graphs
below show clearly the absence of unit root as the line graphs repeatedly crossed the zero lines.
-.3
-.2
-.1
.0
.1
.2
.3
.4
1985 1990 1995 2000 2005 2010
DLOGASINDEX
-.02
.00
.02
.04
.06
.08
.10
1985 1990 1995 2000 2005 2010
DLOGRGDP
-15
-10
-5
0
5
10
1985 1990 1995 2000 2005 2010
DINFRATE
-60
-40
-20
0
20
40
1985 1990 1995 2000 2005 2010
DINTRATE
-20
0
20
40
60
80
1985 1990 1995 2000 2005 2010
DEXCHRATE
Figure 1: Graphical Representation of the Variables without Unit Root
Source: Author’s EView 8.0 Output.
O. I. Inyiama & M. C. Ekwe
136
Table 5: Descriptive Statistics
ASINDEX INFRATE INTRATE EXCHRATE REALGDP
Mean 13294.57 13.66207 19.69655 73.88103 437.1031
Median 6992.100 13.50000 12.00000 92.34000 312.2000
Maximum 57990.22 26.00000 72.80000 155.7000 948.9400
Minimum 127.3000 6.000000 5.400000 0.890000 201.0000
Std. Dev. 14763.94 4.445416 18.14390 61.52791 228.4848
Skewness 1.251307 0.643667 1.601434 0.049973 0.859199
Kurtosis 4.080507 3.551959 4.386022 1.209440 2.415058
Jarque-Bera 8.978613 2.370612 14.71681 3.886113 3.981514
Probability 0.011228 0.305653 0.000637 0.143265 0.136592
Sum 385542.5 396.2000 571.2000 2142.550 12675.99
Sum Sq. Dev. 6.10E+09 553.3283 9217.630 105999.2 1461749.
Observations 29 29 29 29 29 Source: Author’s EView 8.0 Computation
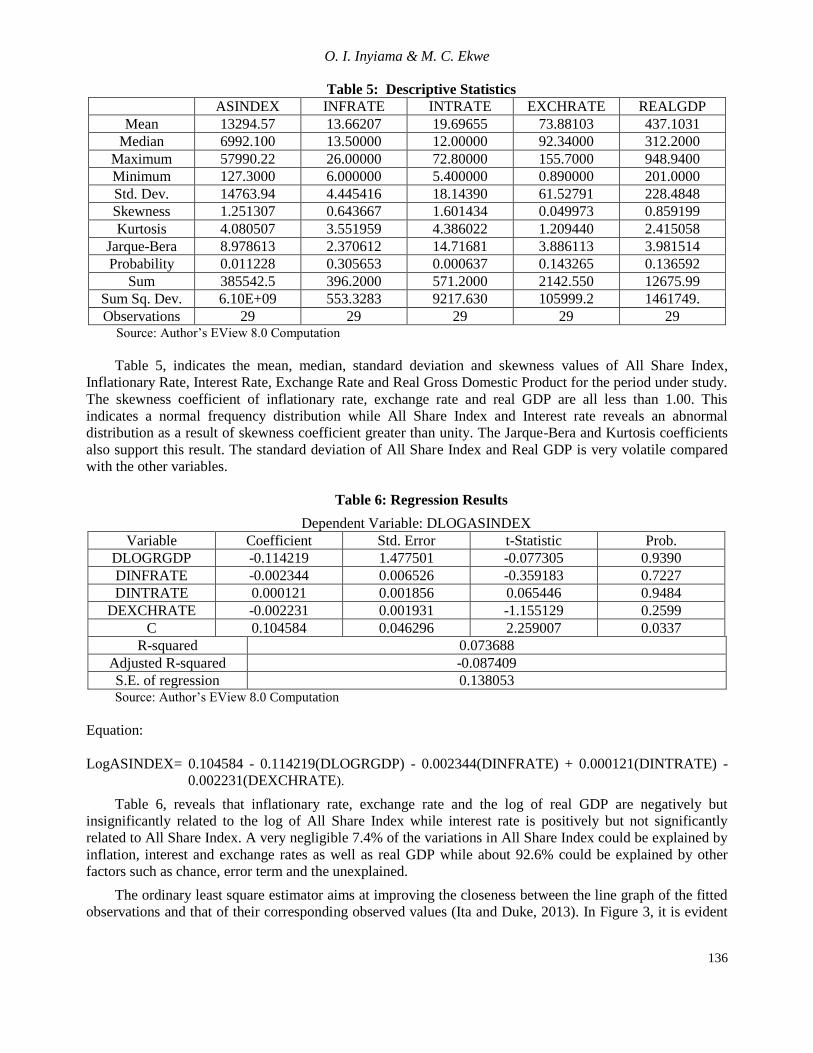
Table 5, indicates the mean, median, standard deviation and skewness values of All Share Index,
Inflationary Rate, Interest Rate, Exchange Rate and Real Gross Domestic Product for the period under study.
The skewness coefficient of inflationary rate, exchange rate and real GDP are all less than 1.00. This
indicates a normal frequency distribution while All Share Index and Interest rate reveals an abnormal
distribution as a result of skewness coefficient greater than unity. The Jarque-Bera and Kurtosis coefficients
also support this result. The standard deviation of All Share Index and Real GDP is very volatile compared
with the other variables.
Table 6: Regression Results
Dependent Variable: DLOGASINDEX
Variable Coefficient Std. Error t-Statistic Prob.
DLOGRGDP -0.114219 1.477501 -0.077305 0.9390
DINFRATE -0.002344 0.006526 -0.359183 0.7227
DINTRATE 0.000121 0.001856 0.065446 0.9484
DEXCHRATE -0.002231 0.001931 -1.155129 0.2599
C 0.104584 0.046296 2.259007 0.0337
R-squared 0.073688
Adjusted R-squared -0.087409
S.E. of regression 0.138053 Source: Author’s EView 8.0 Computation
Equation:
LogASINDEX= 0.104584 - 0.114219(DLOGRGDP) - 0.002344(DINFRATE) + 0.000121(DINTRATE) -
0.002231(DEXCHRATE).
Table 6, reveals that inflationary rate, exchange rate and the log of real GDP are negatively but
insignificantly related to the log of All Share Index while interest rate is positively but not significantly
related to All Share Index. A very negligible 7.4% of the variations in All Share Index could be explained by
inflation, interest and exchange rates as well as real GDP while about 92.6% could be explained by other
factors such as chance, error term and the unexplained.
The ordinary least square estimator aims at improving the closeness between the line graph of the fitted
observations and that of their corresponding observed values (Ita and Duke, 2013). In Figure 3, it is evident

International Journal of Financial Economics
137
that the line graph of the fitted observations is as close as possible to the graph of the corresponding observed
values.
-.4
-.2
.0
.2
.4
-.4
-.2
.0
.2
.4
86 88 90 92 94 96 98 00 02 04 06 08 10 12
Residual Actual Fitted Figure 3: Residual graph of the parsimonious model
Source: EViews 8.0 Output
Table 7: Correlation Coefficient
DLOGASINDEX DLOGRGDP DINFRATE DINTRATE DEXCHRATE
DLOGASINDEX 1.000000 0.014188 -0.137865 0.006946 -0.261332
DLOGRGDP 0.014188 1.000000 -0.095899 -0.227625 -0.107480
DINFRATE -0.137865 -0.095899 1.000000 0.162578 0.270619
DINTRATE 0.006946 -0.227625 0.162578 1.000000 -0.008188
DEXCHRATE -0.261332 -0.107480 0.270619 -0.008188 1.000000 Source: Author’s EView 8.0 Computation
Table 7, reveals a positive correlation between interest rate, log of real GDP and log of All Share Index.
A negative correlation is found between exchange rate, inflationary rate and log of All Share Index.
However, amongst all the variables under study, only exchange rate indicates up to 26% magnitude of
correlation as others are found to be very weak in strength.
Table 8: Pairwise Granger Causality Tests
Date: 04/22/14 Time: 20:34
Sample: 1985 2013
Lags: 2
Null Hypothesis: Obs F-Statistic Prob.
DLOGRGDP does not Granger Cause DLOGASINDEX 26 0.62339 0.5458
DLOGASINDEX does not Granger Cause DLOGRGDP 0.29071 0.7507
DINFRATE does not Granger Cause DLOGASINDEX 26 0.50904 0.6083
DLOGASINDEX does not Granger Cause DINFRATE 0.39047 0.6816
DINTRATE does not Granger Cause DLOGASINDEX 26 0.98492 0.3901
DLOGASINDEX does not Granger Cause DINTRATE 0.06209 0.9400
DEXCHRATE does not Granger Cause
DLOGASINDEX 26 0.95854 0.3996
DLOGASINDEX does not Granger Cause DEXCHRATE 2.71243 0.0896
Source: Author’s EView 8.0 Computation

O. I. Inyiama & M. C. Ekwe
138
Table 9: Pairwise Granger Causality Tests
Date: 04/22/14 Time: 20:37
Sample: 1985 2013
Lags: 1
Null Hypothesis: Obs F-Statistic Prob.
DLOGRGDP does not Granger Cause DLOGASINDEX 27 0.37806 0.5444
DLOGASINDEX does not Granger Cause DLOGRGDP 0.67143 0.4206
DINFRATE does not Granger Cause DLOGASINDEX 27 0.10998 0.7430
DLOGASINDEX does not Granger Cause DINFRATE 0.00676 0.9352
DINTRATE does not Granger Cause DLOGASINDEX 27 0.82386 0.3731
DLOGASINDEX does not Granger Cause DINTRATE 0.24188 0.6273
DEXCHRATE does not Granger Cause
DLOGASINDEX 27 1.97934 0.1723
DLOGASINDEX does not Granger Cause DEXCHRATE 5.56307 0.0268
Source: Author’s EView 8.0 Computation
Tables 8 and 9 indicate that no causal relationship exists between All Share Index and all the
independent variables of inflation rate, interest rate and real GDP. However, there is a unidirectional
causality running from log of All Share Index to foreign exchange rate at 5% and 10% levels of significance
and in lag 1. In lag 2, there is no Granger Causality between and among all the variables under study.
Citing Hansen and Juselius (2002), Gunasekarage, Pisedtasalasai and Power(2005) submits that to find
cointegration between nonstationary variables, at least two variables of all variables included in the
cointergration system have to be I(1) They argued that the existence of a cointegration reveals the existence
of a long term relationship between the market index and the macro-economic variables.. In this study, all
share index, interest rate, inflationary rate and exchange rate are integrated in the order 1(1) while only the
real gross domestic product is integrated in the order 1(2). Abraham(2012) opine, while citing Johansen
(1988), Stock and Watson (1988) and Johansen and Juselius (1990) that the two basic test statistics involved
in Johansen and Juselius’s maximum likelihood test are the trace test and the maximal eigenvalue test. These
two tests are conducted below and the result of the trace test indicates two(2) cointegrating equations at the
0.05 level while Maximum Eigenvalue indicates a cointegrating equation at the 0.10 level. The result
indicates that the short run relationship which they presently share can also be sustained in the long-run.
Table 10: Johansen Cointegration Results
a) Unrestricted Cointegration Rank Test (Trace)
Hypothesized
No. of CE(s) Eigenvalue
Trace
Statistic
0.05
Critical Value Prob.**
None * 0.674724 78.56671 69.81889 0.0085
At most 1 * 0.551868 49.36663 47.85613 0.0358
At most 2 0.373105 28.49727 29.79707 0.0700
At most 3 * 0.325491 16.35589 15.49471 0.0370
At most 4 * 0.209669 6.117878 3.841466 0.0134

International Journal of Financial Economics
139
b) Unrestricted Cointegration Rank Test (Maximum Eigenvalue)
Hypothesized
No. of CE(s) Eigenvalue
Max-Eigen
Statistic
0.05
Critical Value Prob.**
None 0.674724 29.20009 33.87687 0.1635
At most 1 0.551868 20.86935 27.58434 0.2842
At most 2 0.373105 12.14138 21.13162 0.5338
At most 3 0.325491 10.23801 14.26460 0.1968
At most 4 * 0.209669 6.117878 3.841466 0.0134 * denotes rejection of the hypothesis at the 0.05 level
Source: EViews 8.0 Output
5. Summary and Conclusion
The study aims at determining the relationship between All Share Index (the proxy for capital market
performance) and real gross domestic product, monetary policy rate, inflationary rate and foreign exchange
rate (the proxy for macroeconomic variables of the study). The regression result reveals that inflationary rate,
exchange rate and the log of real GDP are negatively but insignificantly related to the log of All Share Index
while interest rate is positively but not significantly related to All Share Index. This implies that maintaining
a low inflationary and exchange rates could improve capital market performance while a reasonably high
monetary policy rate could also yield positive results in the performance of capital market. No causal
relationship exists between All Share Index and the independent variables of inflation rate, interest rate and
real GDP except for a unidirectional causality running from log of All Share Index to foreign exchange rate
at 5% and 10% levels of significance and in lag 1 only. Positive correlation is found between interest rate,
log of real GDP and log of All Share Index while negative correlation exist between exchange rate,
inflationary rate and the dependent variable(ASI). The cointegrating equation found is an indication that their
short run relationship could be sustained in the future. Therefore, if macroeconomic variables could be
effectively regulated or controlled by the regulatory agencies such as Nigeria Stock Exchange, Securities and
Exchange Commission and the Central Bank of Nigeria, as suggested by the findings of this study, the
variables are most likely to impact tremendously on the performance of the Nigeria Capital Market.
References
Abraham, T.W(2012). Stock Market Reaction to Selected Macroeconomic Variables in the Nigerian
Economy, CBN Journal of Applied Statistics 2(1), 61-70.
Agrawal, G., Srivastav, A,K. and Srivastava, A.(2010). A Study of Exchange Rates Movement and Stock
Market Volatility, International Journal of Business and Management, 5(12).
Ali, M,B.(2011). Co integrating Relation between Macroeconomic Variables and Stock Return: Evidence
from Dhaka Stock Exchange (DSE), International Journal of Business and Commerce 1(2): 25-38.
Ali I., Rehman K. U., Yilmaz A. K., Khan M. A. and Afzal H. (2010) ‘Causal Relationship between
Macroeconomic Indicators and stock Exchange Prices in Pakistan’ African Journal of Business
Management, 4(3), 312 – 319.
AL- Shubiri, F(2010). Analysis the Determinants of Market Stock Price Movements: An Empirical Study of
Jordanian Commercial Banks, International Journal of Business & Management:
5(10):137.Available athttp://connection.ebscohost.com/c/articles/56104197/analysis-determinants-
market-stock- pricemovements- empirical-study-jordanian-commercial-banks
Anyanwu, J. C. (2005). Stock Market Development and Nigeria’s Economic Growth, The Nigerian Financial
Review, 13(3): 6-13

O. I. Inyiama & M. C. Ekwe
140
Asaolu, T.O., and Ogunmuyiwa, M.S. (2011). An Econometric Analysis of the Impact of Macroeconomic
Variables on Stock Market Movement in Nigeria. Asian Journal of Business Management, 3(1), 72-
78.
Asteriou, D. and Hall, S.G., 2007, Applied Econometrics: A Modern Approach Using Eviews and
Microfit, Revised Edition. Palgrave Macmillan
Central Bank of Nigeria (CBN), Annual Reports and Statement of Accounts - Various Years.
Dickey, D. A. and Fuller, W. A., 1979, Distributions of the estimators for autoregressive time series with a
unit root. Journal of the American Statistical Association, 74. 423–431.
Gunasekarage, A., Pisedtasalasai, A., and Power, D.M (2005). Macro-economic Influences on the Stock
Market: Evidence from an Emerging Market in South Asia.
Granger, C. W. J.(1986), Developments in the Study of Cointegrated Economic Variables, Oxford Bulletin
of Economics and Statistics 48, 213-27.
Hansen, H. and K. Juselius (2002), CATS in RATS Cointegration Analysis of Time Series, Estima.
Hosseini, S. M., Ahmad, Z., and Lai, Y. W.(2011). The Role of Macroeconomic variables on stock market
index in China and India, International Journal of Economics a nd Finance, 3 (6), 233-243.
Hussainey and Ngoc (2009), ‘Impact of Macroeconomic Variables on Vietnamese Stock Exchange’ Journal
of Risk Finance, 4, 18-46.
Inyiama, O.(2013), Does Inflation Weaken Economic Growth? Evidence from Nigeria, European Journal of
Accounting Auditing and Finance Research, 1(4), 139-150.
Ita, J,J and Duke, J.(2013). Macroeconomic Factors That Influence Stock Market Development In
Nigeria, International Journal of Business and Management Review, 1(2), 43-56.
Islam, A. and Khaled, M. (2005). Tests of Weak Form Efficiency of the Dhaka Stock Exchange. Journal of
Business Finance and Accounting, 32, 1613-1624.
Johansen, S. (1988) ‘Statistical Analysis of Cointegration Vectors’, Journal of Economic Dynamics and
Control, 12, 231-254.
Johansen, S., and K. Juselius, (1990) ‘Maximum Likelihood Estimation and Inference on Cointegration –
With Applications to the demand for money’, Oxford Bulletin of Economics and Statistics,52,169-
210
Kwiatkowski, D., P. C. B. Phillips, P. Schmidt and Y. Shin (1992), Testing the null hypothesis of trend
stationarity. Journal of Econometrics, 54, 159-178.
Naik and Padhi, (2012), The Impact of Macroeconomic Fundamentals on Stock Prices Revisited: Evidence
from Indian Data, Eurasian Journal of Business and Economics, 5 (10), 25-44.
Nguyen, T, H. and Nguyen, T, B.(2012). Stock Prices and Macroeconomic Variables in Vietnam:An
Empirical Analysis
Osisanwo, B, G., and Atanda, A.(2012). Determinants of Stock Market Returns in Nigeria: A Time Series
Analysis, African Journal of Scientific Research 9(1).
Olugbenga, A, A.(2011). The Impact of Macroeconomic Indicators on Stock Prices in Nigeria, Developing
Country Studies www.iiste.org 1(2).
Prantik, R
and Vani, V (2009). What Moves Indian Stock Market: A Study on the Linkage with Real
Economy in the Post-Reform Era.
Phillips, P. C. B., and P. Perron, (1988), Testing for a Unit Root in Time Series Regression, Biometrika 75,
335-46.
International Journal of Financial Economics
141
Pasquale, F. (2006). "Testing for Granger causality between stock prices and economic growth," MPRA
Paper 2962, University Library of Munich, Germany, revised 2007.
Rashid, A.(2008): Macroeconomic Variables and Stock Market Performance: Testing for Dynamic Linkages
with a Known Structural Break. Published in: Saving and Development, 1:77-102.
Ross, S.A., (1976), “The Arbitrage Theory of Capital Asset Pricing”, Journal of Economic Theory,13, 341-
360.
Sohail, N and Hussain, K.(2009). Long-Run And Short-Run Relationship Between Macroeconomic
Variables And Stock Prices In Pakistan :The Case Of Lahore Stock Exchange, Pakistan Economic
and Social Review 47, (2), 183-198.