Embed Size (px)
Citation preview
Teacher Notes | 1 http://www.ricediversity.org/foodfor9billion
Overview Why is food important to our bodies? In this data-‐rich lesson, students will learn about macronutrients and why our bodies need them. Students begin by recording their personal daily food intake and analyzing their own macronutrient consumption according to US standards. Students then compare macronutrient consumption profiles of teenagers from different countries. The two parts can be done in sequence or independently. Objectives 1. Students will define and describe what calories, carbohydrates,
fats, and proteins are. 2. Students will collect data and analyze that data in reference to US
dietary standards. 3. Students will evaluate the validity of their data collection
methods. 4. Students will create a bar graph to compare two data sets and
summarize that comparison in writing. 5. Students will consider the implications of and remedies for under-‐
and over-‐ consumption of macronutrients. Prior Knowledge Students need a basic understanding of the following terms: nutrient, macronutrient, water, Calorie, carbohydrate, fat, and protein. Teaching Tips/Activity Sequence Part 1 – Personal Intake and Macronutrient Analysis A note before beginning: Please be very sensitive to issues concerning being over-‐ or underweight. The purpose of this exercise is simply to think about macronutrients in terms of one’s personal nutrition, not to replace the advice of a physician. 1. Introduce the activity.
Briefly review macronutrients and their significance with the class. This lesson assumes that students have already learned what macronutrients are, and—to some extent—how they
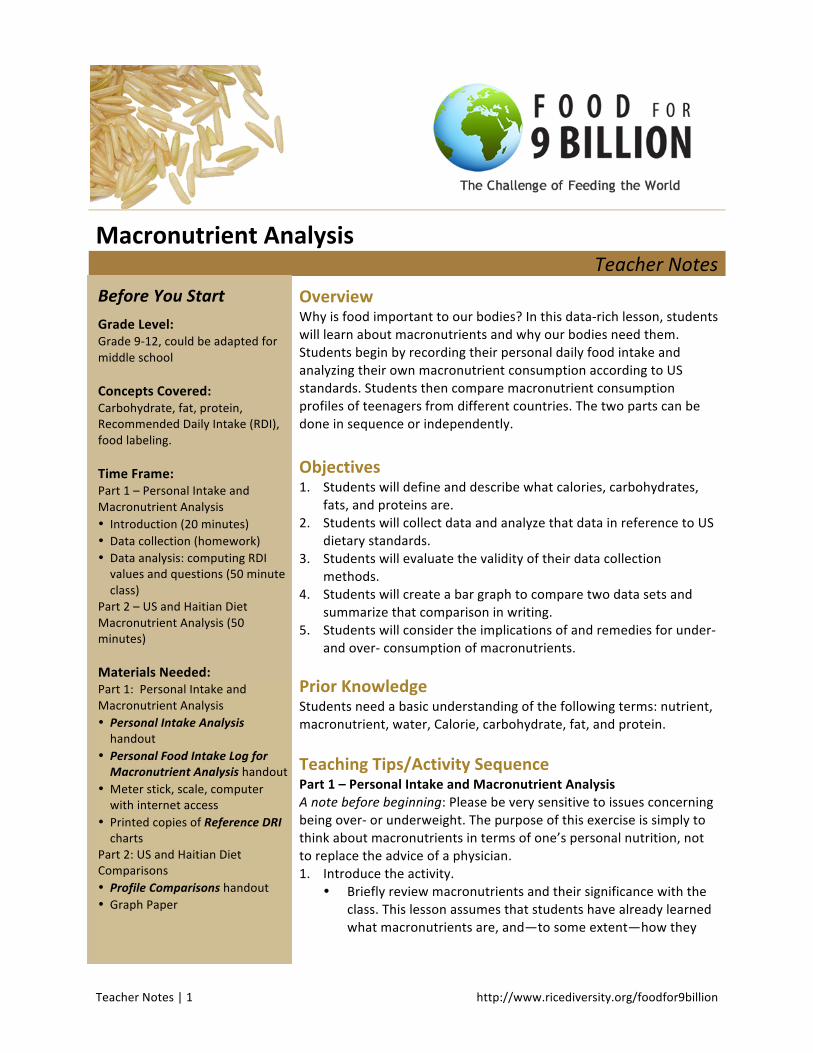
Macronutrient Analysis Teacher Notes
Before You Start Grade Level: Grade 9-‐12, could be adapted for middle school Concepts Covered: Carbohydrate, fat, protein, Recommended Daily Intake (RDI), food labeling. Time Frame: Part 1 – Personal Intake and Macronutrient Analysis • Introduction (20 minutes) • Data collection (homework) • Data analysis: computing RDI values and questions (50 minute class)
Part 2 – US and Haitian Diet Macronutrient Analysis (50 minutes) Materials Needed: Part 1: Personal Intake and Macronutrient Analysis • Personal Intake Analysis handout
• Personal Food Intake Log for Macronutrient Analysis handout
• Meter stick, scale, computer with internet access
• Printed copies of Reference DRI charts
Part 2: US and Haitian Diet Comparisons • Profile Comparisons handout • Graph Paper
Macronutrient Analysis Teacher Notes
Teacher Notes | 2 http://www.ricediversity.org/foodfor9billion
are used in the body. See the resources section below for websites that provide information about macronutrients.
Review instructions and expectations for collecting personal data. Demonstrate some examples of data collection.
2. Students should collect food intake data for two days. Encourage students to sample two weekdays rather than weekends, as the weekdays most likely provide a more accurate representation of what they eat.
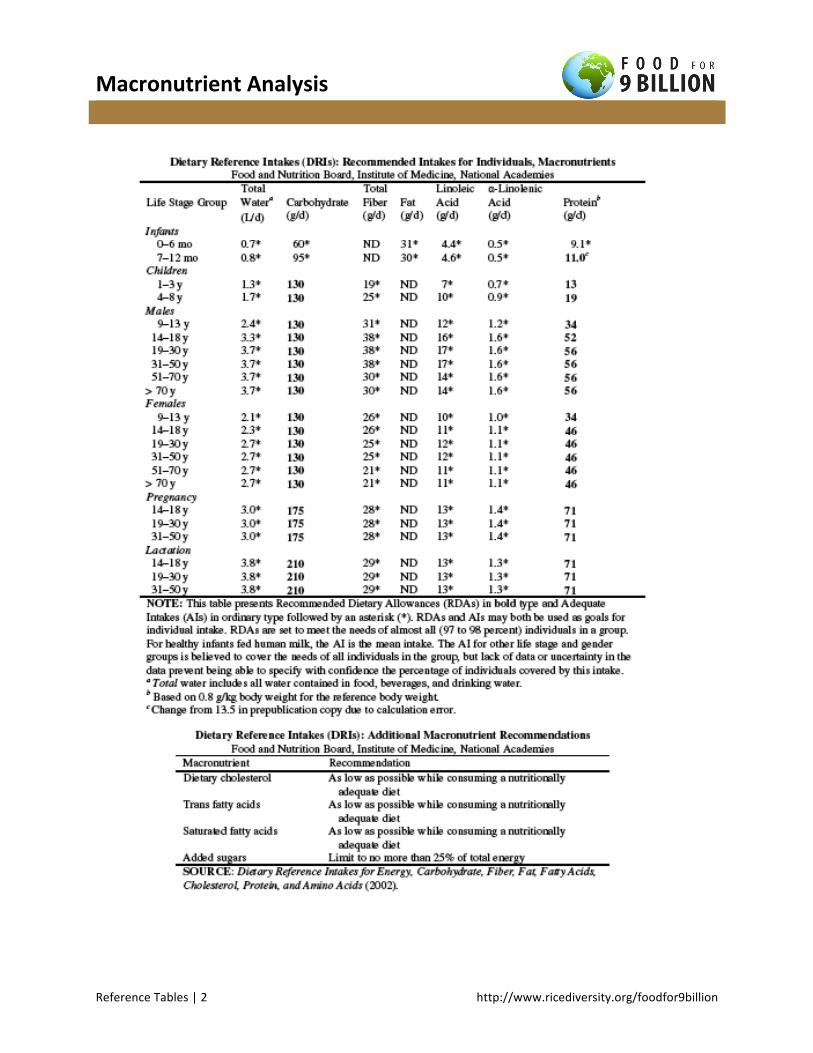
3. Students should calculate their recommended intake values, either working alone or in small groups. For this step, a meter stick or tape measure may be required if students do not know their heights. • As an alternative to reading the DRI charts, students could log in to MyPyramid.gov or use the
USDA online healthcare professional calculator at http://fnic.nal.usda.gov/interactiveDRI to obtain their DRI information.
4. Students can work alone or in small groups to analyze their data and answer the questions. 5. Discuss students’ findings as a group. Questions you may wish to ask include:
What did you find most surprising after you analyzed your macronutrient intakes? Do you think you need to change anything about your diets? What & why? Are there any particular foods that you found to be nutrient rich or nutrient poor?
Part 2 – Diet Comparisons 1. Introduce the activity.
Ask students how they think their diets compare to those of teenagers living in other places. Explain that they are going to compare their macronutrient consumption to that of a student from Haiti.
• Note: If students have not completed Part 1, or if they do not want to use their own data, two fictionalized profiles of US teens are included. This activity could also be completed with data from two or more profiles instead of using personal data.
2. Assign a Haitian profile to each student. The student is responsible for reading the background information on the profiled teenager and entering the provided nutritional values on the data table. Only the totals for each category will be compared.
3. Students will then create a column graph depicting their own nutritional values compared to those of the Haitian profile. They will use this visual comparison to answer the discussion questions.
4. Ask a volunteer to share their graph with the class. The student should share a brief summary of the Haitian individual’s story and how their nutrition differed.
Activity Suggestions Students may need help creating suitable axes for the column graph. If so, model setting up the graph for the class or select students in the following steps/questions: 1. Our graph needs a title. What will the graph show us? (Diet Comparisons) 2. The X-‐axis of a column graph will tell us about our categories that we measured. Which categories
are we measuring? (Calories, Fat, Saturated Fat, Carbohydrates, and Protein) 3. We named five categories. How many blocks should we use for each category? (Answer will vary
based on graph paper, but generally the axis should fill the page.) 4. The Y-‐axis of a column graph will show us numbers to measure the amount of our nutrient
categories. What unit do we use to measure our categories? (Calories and grams) 5. How will we tell the difference between these two units? (Color code, etc.)
Macronutrient Analysis Teacher Notes
Teacher Notes | 3 http://www.ricediversity.org/foodfor9billion
6. What range do we need to use for these measurements? In other words, where do we need to start numbering and stop numbering the Y-‐axis? (Answers will vary)
7. If we have a range of ___to ___, how should we space out the numbers on the axis so they cover most of the page? (Answers will vary)
8. Now we are ready to draw in our columns. For each category, we have to show a column for both your data and for the profiled teenager’s data. How will we tell whom the columns belong to? (Color, fill, legend, etc)
Extensions • Make Your Calories Count is an interactive tool helps people understand how to use the nutrition
facts label for healthy weight management. Available at: http://www.accessdata.fda.gov/videos/CFSAN/HWM/hwmintro.cfm
• The Food Label and You is an entertaining video about serving size, calories, and % daily value. Available at: http://www.fda.gov/Food/LabelingNutrition/ConsumerInformation/ucm246815.htm
Resources 1. You Are What You Eat lesson available as part of this nutrition unit. 2. Background information about macronutrients and digestion:
• CDC Nutrition basics website: http://www.cdc.gov/nutrition/everyone/basics/index.html • http://www.merckmanuals.com/professional/sec01/ch001/ch001a.html -‐ v881322 • NDDIC: Your Digestive System and How it Works
http://digestive.niddk.nih.gov/ddiseases/pubs/yrdd/ 3. American Heart Association Webpage on Sugar:
http://www.heart.org/HEARTORG/GettingHealthy/NutritionCenter/HealthyDietGoals/Sugars-‐and-‐Carbohydrates_UCM_303296_Article.jsp
4. US FDA: How to Understand and Use the Nutrition Facts Label http://www.fda.gov/Food/LabelingNutrition/ConsumerInformation/ucm078889.htm
5. US DRI Charts: • Dietary Reference Intakes (DRIs): Recommended Intakes for Individuals, Macronutrients • Dietary Reference Intakes (DRIs): Acceptable Macronutrient Distribution Ranges • Dietary Reference Intakes (DRIs): Estimated Energy Requirements (EER) for Men and Women 30
Years of Age
Macronutrient Analysis Teacher Notes
Teacher Notes | 4 http://www.ricediversity.org/foodfor9billion
Standards
National Science Education Standards Grades 9-‐12
Common Core State Standards for Literacy in History / Social Studies,
Science and Technical Subjects 6-‐12 Life Science The Cell 1.2 Matter, energy, and organization in living things 5.2, 5.3, 5.6
Science in Personal and Social Perspectives Personal and Community Health 1.1, 1.2, 1.5
Reading Standards Key Ideas and Details RST1 Integration of Knowledge and Ideas RST7, RST9
Writing Standards Text Types and Purposes WHST2 Production and Distribution of Writing WHST4 Range of Writing WHST10
Acknowledgements Molly Holden and Susan Dodge, M.S. Ed for Creative Curriculum, produced these teacher notes and resources in conjunction with the “Food for 9 Billion” project (http://FoodFor9Billion.org) with funding from the National Science Foundation (PGRP grant #1026555; http://ricediversity.org) and Cornell University.
Name: _____________________________ Date: __________________ Class:__________
Macronutrient Personal Intake Analysis
Personal Intake Analysis Student Worksheet | 1 http://www.ricediversity.org/foodfor9billion
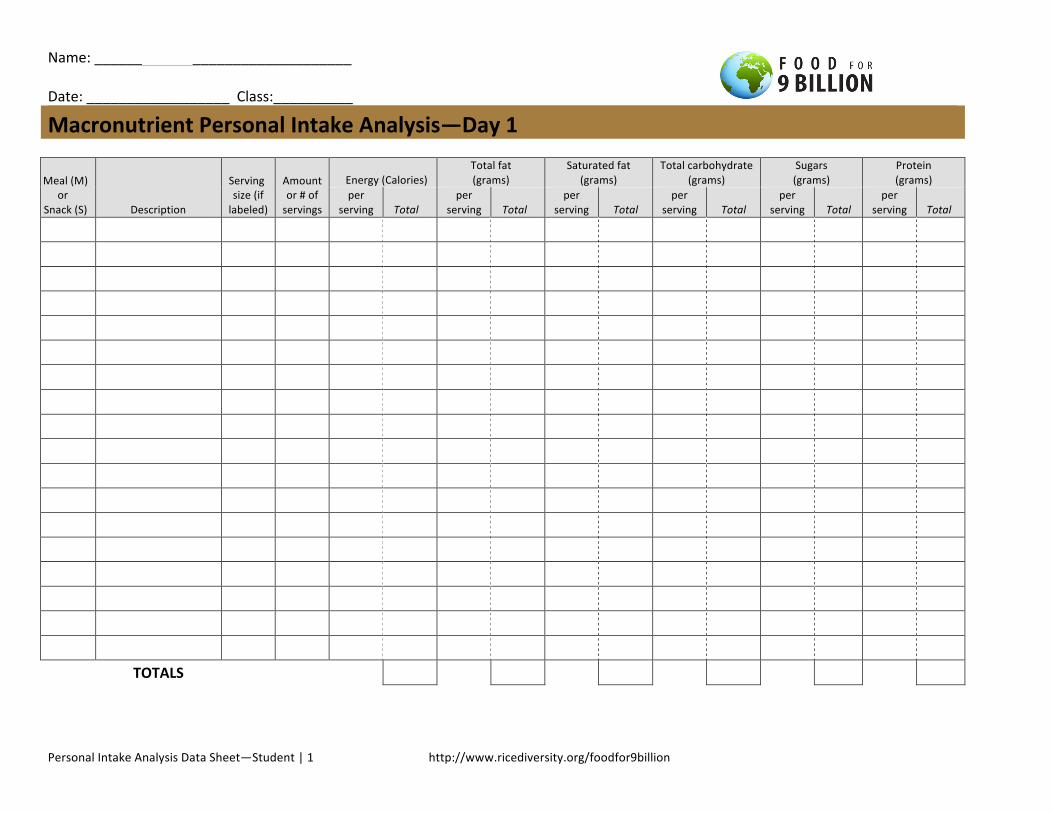
What Am I Eating? A Personal Intake and Macronutrient Analysis Why is food so important to human bodies? It provides the nutrients – both macronutrients and micronutrients – that the cells in our bodies use for everything they do. Are you consuming the macronutrients you need? Do you eat enough protein, fat, and carbohydrates? Too much? To know, you first need to understand what you are eating. Let’s take a look. First: Track your food consumption for two days Use the Personal Food Intake Log provided to keep track of your food intake. You will compile a list of everything you consume for 2 days and then determine the macronutrient composition for each item. Try to eat as you usually do; don’t consciously change your pattern for better or for worse. Include water as well as any other beverages in your log. • Record each item you eat or drink and how much you had. Note the serving size, if that
information is available on the label. Then record either the number of servings you ate or the amount you ate in teaspoons, cups, grams, number of items, etc.
• You will be keeping track of energy (Calories), total fat (grams), saturated fat (grams),
carbohydrates (grams), sugars (grams), and protein (grams). If you eat a packaged food with a nutrition label, you can gather this nutritional information directly from the package.
• Complex items, such as a salad can be difficult to record. You should try to separate the
salad into the various main components as best you can: lettuce, spinach, celery, carrots, dressing, etc.
• If your food doesn’t have a nutritional label, you will have to use an online database to get
its macronutrient data. We suggest you use http://www.nal.usda.gov/fnic/cgi-‐bin/nut_search.pl.
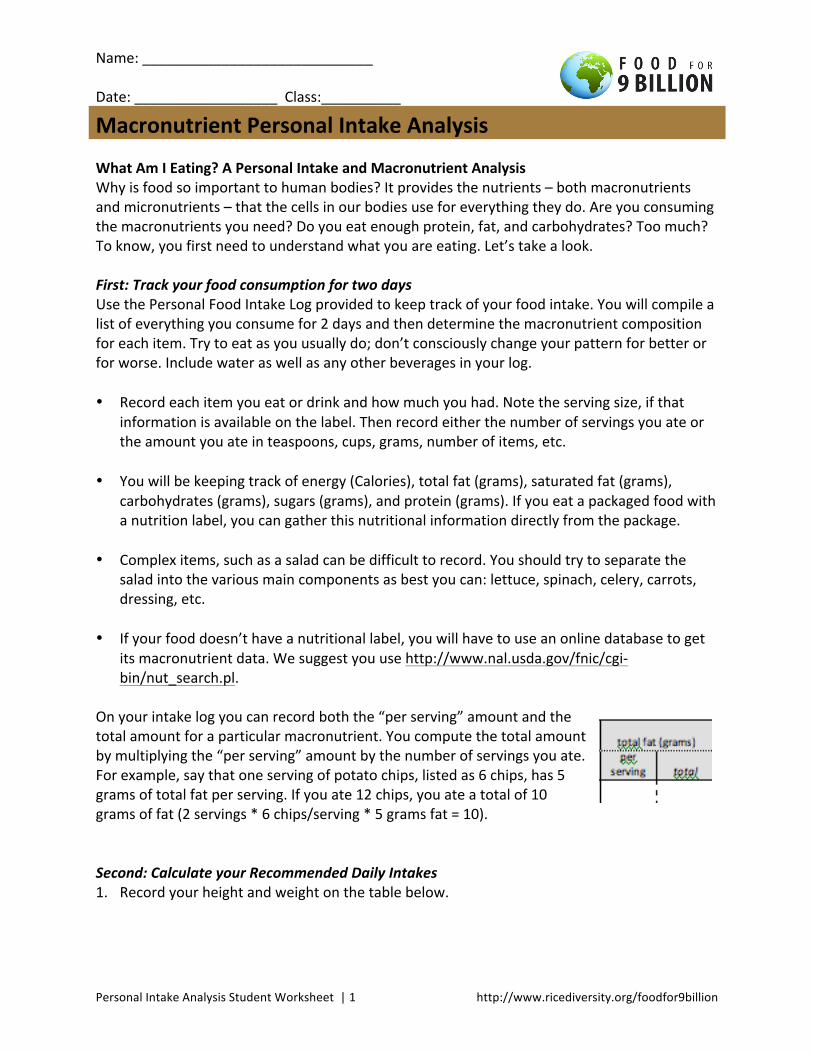
On your intake log you can record both the “per serving” amount and the total amount for a particular macronutrient. You compute the total amount by multiplying the “per serving” amount by the number of servings you ate. For example, say that one serving of potato chips, listed as 6 chips, has 5 grams of total fat per serving. If you ate 12 chips, you ate a total of 10 grams of fat (2 servings * 6 chips/serving * 5 grams fat = 10). Second: Calculate your Recommended Daily Intakes 1. Record your height and weight on the table below.
Name: _____________________________ Date: __________________ Class:__________
Macronutrient Personal Intake Analysis
Personal Intake Analysis Student Worksheet | 2 http://www.ricediversity.org/foodfor9billion
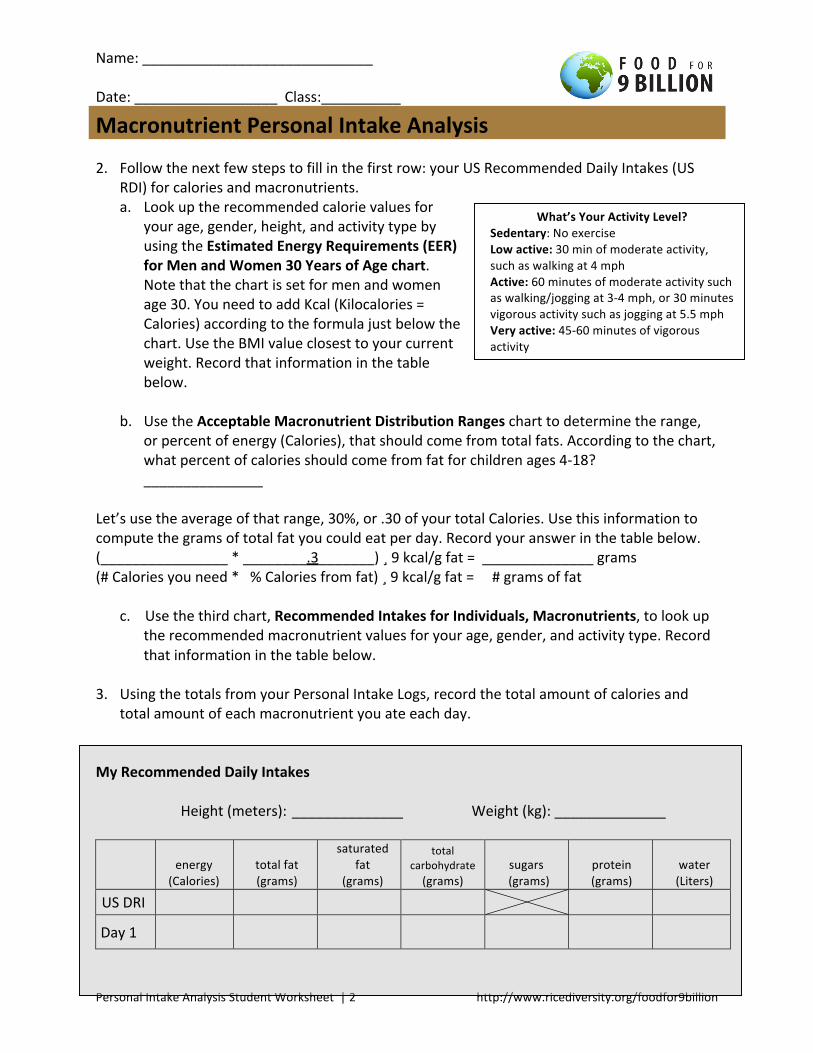
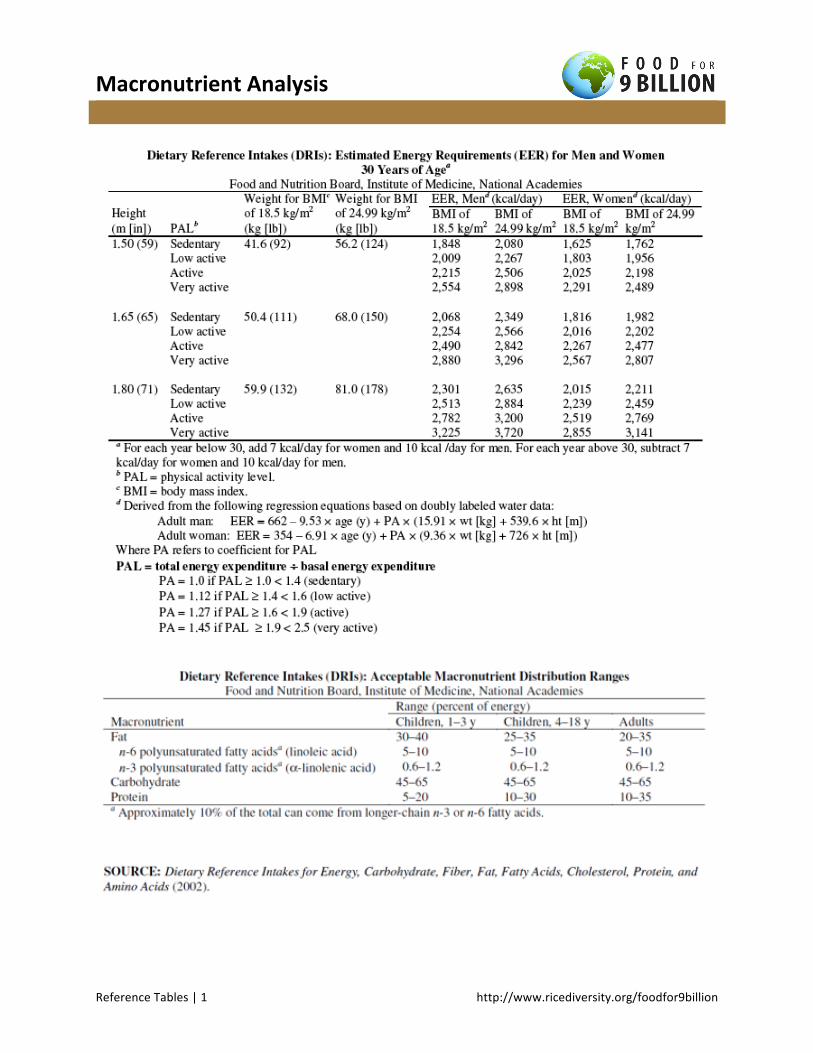
2. Follow the next few steps to fill in the first row: your US Recommended Daily Intakes (US RDI) for calories and macronutrients. a. Look up the recommended calorie values for
your age, gender, height, and activity type by using the Estimated Energy Requirements (EER) for Men and Women 30 Years of Age chart. Note that the chart is set for men and women age 30. You need to add Kcal (Kilocalories = Calories) according to the formula just below the chart. Use the BMI value closest to your current weight. Record that information in the table below.
b. Use the Acceptable Macronutrient Distribution Ranges chart to determine the range,
or percent of energy (Calories), that should come from total fats. According to the chart, what percent of calories should come from fat for children ages 4-‐18? _______________
Let’s use the average of that range, 30%, or .30 of your total Calories. Use this information to compute the grams of total fat you could eat per day. Record your answer in the table below. (________________ * ________.3_______) ¸ 9 kcal/g fat = ______________ grams (# Calories you need * % Calories from fat) ¸ 9 kcal/g fat = # grams of fat
c. Use the third chart, Recommended Intakes for Individuals, Macronutrients, to look up the recommended macronutrient values for your age, gender, and activity type. Record that information in the table below.
3. Using the totals from your Personal Intake Logs, record the total amount of calories and
total amount of each macronutrient you ate each day. My Recommended Daily Intakes
Height (meters): ______________ Weight (kg): ______________
energy
(Calories) total fat (grams)
saturated fat
(grams)
total carbohydrate (grams)
sugars (grams)
protein (grams)
water (Liters)
US DRI
Day 1
What’s Your Activity Level? Sedentary: No exercise Low active: 30 min of moderate activity, such as walking at 4 mph Active: 60 minutes of moderate activity such as walking/jogging at 3-‐4 mph, or 30 minutes vigorous activity such as jogging at 5.5 mph Very active: 45-‐60 minutes of vigorous activity
Name: _____________________________ Date: __________________ Class:__________
Macronutrient Personal Intake Analysis
Personal Intake Analysis Student Worksheet | 3 http://www.ricediversity.org/foodfor9billion
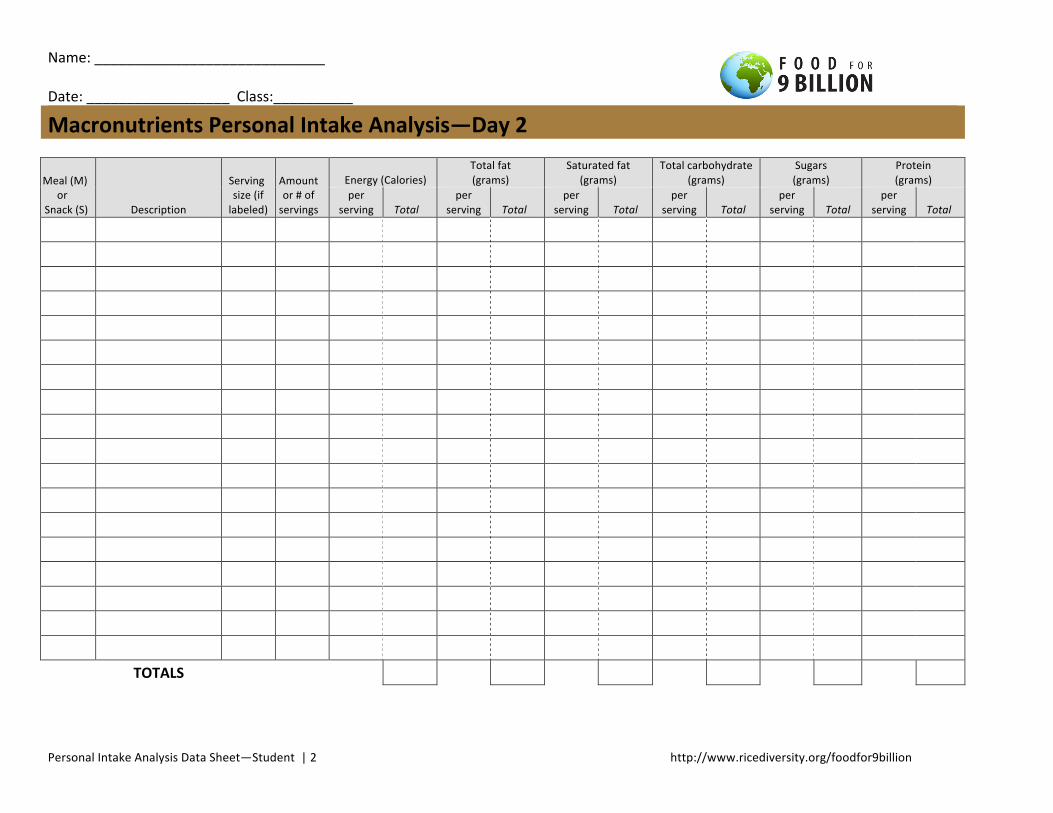
Day 2
Name: _____________________________ Date: __________________ Class:__________
Macronutrient Personal Intake Analysis
Personal Intake Analysis Student Worksheet | 4 http://www.ricediversity.org/foodfor9billion
Third: Analyze your food consumption and macronutrient intake If you need to review what the macronutrients are and why they are important, you can visit http://www.cdc.gov/nutrition/everyone/basics/index.html to read more about water, dietary fat, carbohydrates, and proteins.
1. Explain what Calories are and why you need them. How did the number of Calories you ate each day compare to the recommended caloric intake for your age, height, gender, and body type?
2. What are carbohydrates?
Evaluate your intake of carbohydrates based upon the US DRI for your age.
3. The category of sugar includes both naturally occurring sugars (like those in fruit and lactose
in milk) and added sugars. Visit the American Heart Association’s webpage to learn more and explain what added sugars are:
http://www.heart.org/HEARTORG/GettingHealthy/NutritionCenter/HealthyDietGoals/Sugars-‐and-‐Carbohydrates_UCM_303296_Article.jsp#.T2DjAMrpOXU
* The American Heart Association recommends that adult females consume no more than 6 tsp (24 grams) of added sugar and that adult males consume no more than 10 tsp (36 grams) of added sugar. The USDA sets a daily limit of 40g of added sugars.
Name: _____________________________ Date: __________________ Class:__________
Macronutrient Personal Intake Analysis
Personal Intake Analysis Student Worksheet | 5 http://www.ricediversity.org/foodfor9billion
4. Take a close look at your sugar intake. How much sugar do you consume? What are your sources of sugar? Keeping in mind that your total sugar values come from both added sugar and natural sugar, analyze your sugar consumption in light of the recommended limits.
5. Why must human beings consume proteins? Why are they important to our bodies? Evaluate your intake of protein based upon the US DRI for your age. Do you need to make any changes? If so, what?
6. What are fats? Explain why fats are important, but why we should also limit our daily intake of them.
Evaluate your intake of total fats based upon the US DRI for your age.
7. Discuss the validity (representativeness) of your data collection. Is sampling (collecting information) only two days a fair and accurate way to gather data about your macronutrient consumption? Why or why not?
Name: ______ KEY ____________________ Date: __________________ Class:__________
Macronutrient Personal Intake Analysis
Personal Intake Analysis Teacher Worksheet | 1 http://www.ricediversity.org/foodfor9billion
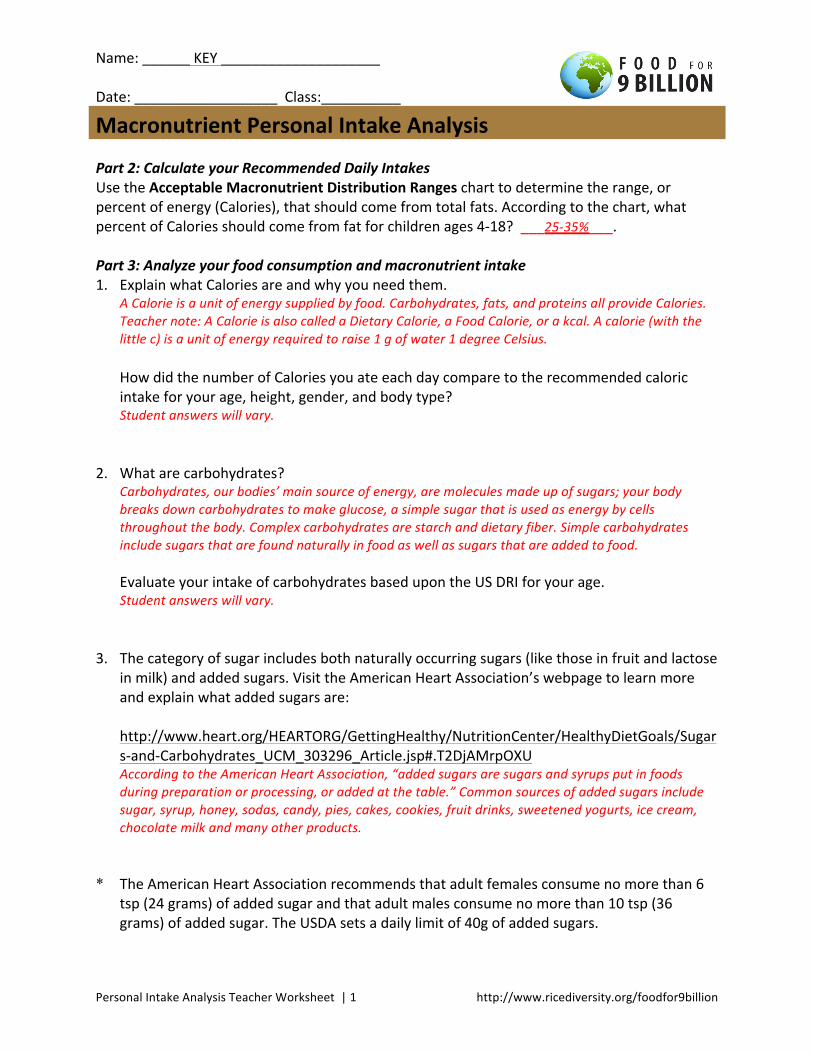
Part 2: Calculate your Recommended Daily Intakes Use the Acceptable Macronutrient Distribution Ranges chart to determine the range, or percent of energy (Calories), that should come from total fats. According to the chart, what percent of Calories should come from fat for children ages 4-‐18? ___25-‐35%___.
Part 3: Analyze your food consumption and macronutrient intake 1. Explain what Calories are and why you need them.
A Calorie is a unit of energy supplied by food. Carbohydrates, fats, and proteins all provide Calories. Teacher note: A Calorie is also called a Dietary Calorie, a Food Calorie, or a kcal. A calorie (with the little c) is a unit of energy required to raise 1 g of water 1 degree Celsius. How did the number of Calories you ate each day compare to the recommended caloric intake for your age, height, gender, and body type? Student answers will vary.
2. What are carbohydrates?
Carbohydrates, our bodies’ main source of energy, are molecules made up of sugars; your body breaks down carbohydrates to make glucose, a simple sugar that is used as energy by cells throughout the body. Complex carbohydrates are starch and dietary fiber. Simple carbohydrates include sugars that are found naturally in food as well as sugars that are added to food. Evaluate your intake of carbohydrates based upon the US DRI for your age. Student answers will vary.
3. The category of sugar includes both naturally occurring sugars (like those in fruit and lactose
in milk) and added sugars. Visit the American Heart Association’s webpage to learn more and explain what added sugars are:
http://www.heart.org/HEARTORG/GettingHealthy/NutritionCenter/HealthyDietGoals/Sugars-‐and-‐Carbohydrates_UCM_303296_Article.jsp#.T2DjAMrpOXU According to the American Heart Association, “added sugars are sugars and syrups put in foods during preparation or processing, or added at the table.” Common sources of added sugars include sugar, syrup, honey, sodas, candy, pies, cakes, cookies, fruit drinks, sweetened yogurts, ice cream, chocolate milk and many other products.
* The American Heart Association recommends that adult females consume no more than 6
tsp (24 grams) of added sugar and that adult males consume no more than 10 tsp (36 grams) of added sugar. The USDA sets a daily limit of 40g of added sugars.
Name: ______ KEY ____________________ Date: __________________ Class:__________
Macronutrient Personal Intake Analysis
Personal Intake Analysis Teacher Worksheet | 2 http://www.ricediversity.org/foodfor9billion
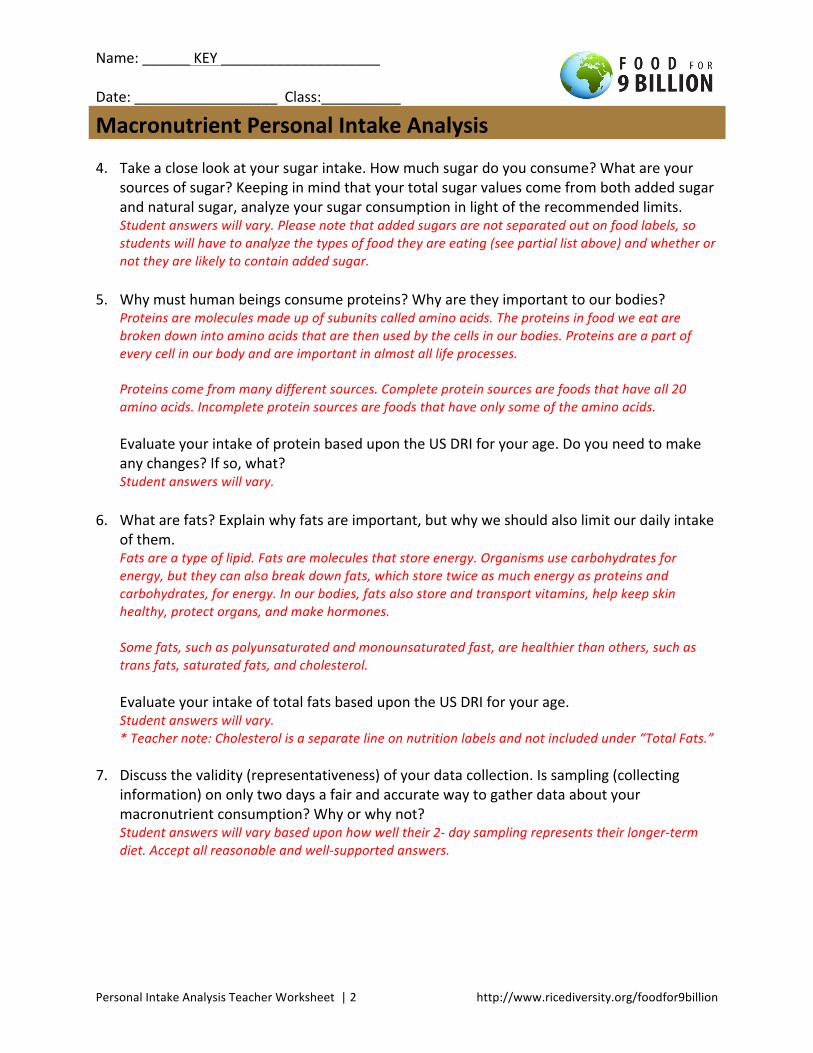
4. Take a close look at your sugar intake. How much sugar do you consume? What are your sources of sugar? Keeping in mind that your total sugar values come from both added sugar and natural sugar, analyze your sugar consumption in light of the recommended limits. Student answers will vary. Please note that added sugars are not separated out on food labels, so students will have to analyze the types of food they are eating (see partial list above) and whether or not they are likely to contain added sugar.
5. Why must human beings consume proteins? Why are they important to our bodies?
Proteins are molecules made up of subunits called amino acids. The proteins in food we eat are broken down into amino acids that are then used by the cells in our bodies. Proteins are a part of every cell in our body and are important in almost all life processes. Proteins come from many different sources. Complete protein sources are foods that have all 20 amino acids. Incomplete protein sources are foods that have only some of the amino acids. Evaluate your intake of protein based upon the US DRI for your age. Do you need to make any changes? If so, what? Student answers will vary.
6. What are fats? Explain why fats are important, but why we should also limit our daily intake
of them. Fats are a type of lipid. Fats are molecules that store energy. Organisms use carbohydrates for energy, but they can also break down fats, which store twice as much energy as proteins and carbohydrates, for energy. In our bodies, fats also store and transport vitamins, help keep skin healthy, protect organs, and make hormones. Some fats, such as polyunsaturated and monounsaturated fast, are healthier than others, such as trans fats, saturated fats, and cholesterol. Evaluate your intake of total fats based upon the US DRI for your age. Student answers will vary. * Teacher note: Cholesterol is a separate line on nutrition labels and not included under “Total Fats.”
7. Discuss the validity (representativeness) of your data collection. Is sampling (collecting information) on only two days a fair and accurate way to gather data about your macronutrient consumption? Why or why not? Student answers will vary based upon how well their 2-‐ day sampling represents their longer-‐term diet. Accept all reasonable and well-‐supported answers.
Name: ______ ____________________ Date: __________________ Class:__________
Macronutrient Personal Intake Analysis—Day 1
Personal Intake Analysis Data Sheet—Student | 1 http://www.ricediversity.org/foodfor9billion
Meal (M) or
Snack (S) Description
Serving size (if labeled)
Amount or # of servings
Energy (Calories) Total fat (grams)
Saturated fat (grams)
Total carbohydrate (grams)
Sugars (grams)
Protein (grams)
per serving Total
per serving Total
per serving Total
per serving Total
per serving Total
per serving Total
TOTALS
Name: _____________________________ Date: __________________ Class:__________
Macronutrients Personal Intake Analysis—Day 2
Personal Intake Analysis Data Sheet—Student | 2 http://www.ricediversity.org/foodfor9billion
Meal (M) or
Snack (S) Description
Serving size (if labeled)
Amount or # of servings
Energy (Calories) Total fat (grams)
Saturated fat (grams)
Total carbohydrate (grams)
Sugars (grams)
Protein (grams)
per serving Total
per serving Total
per serving Total
per serving Total
per serving Total
per serving Total
TOTALS
Name: _____________________________ Date: __________________ Class:__________
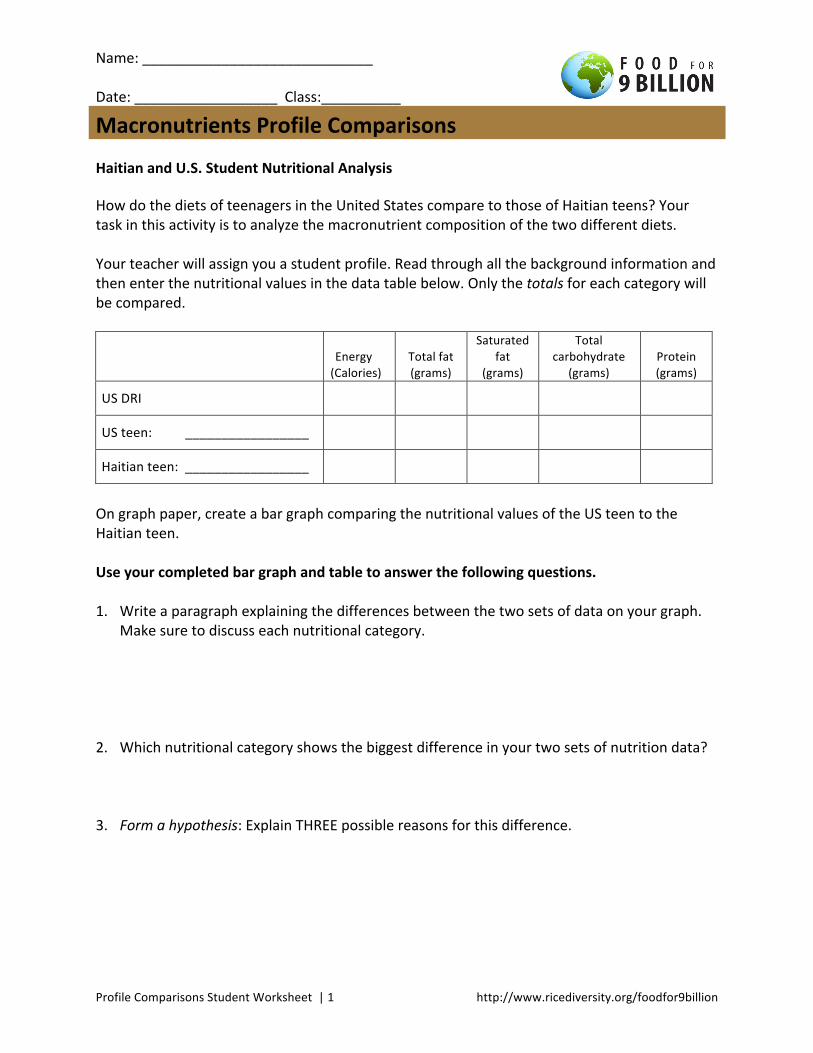
Macronutrients Profile Comparisons
Profile Comparisons Student Worksheet | 1 http://www.ricediversity.org/foodfor9billion
Haitian and U.S. Student Nutritional Analysis
How do the diets of teenagers in the United States compare to those of Haitian teens? Your task in this activity is to analyze the macronutrient composition of the two different diets. Your teacher will assign you a student profile. Read through all the background information and then enter the nutritional values in the data table below. Only the totals for each category will be compared.
Energy (Calories)
Total fat (grams)
Saturated fat
(grams)
Total carbohydrate
(grams) Protein (grams)
US DRI
US teen: _________________
Haitian teen: _________________
On graph paper, create a bar graph comparing the nutritional values of the US teen to the Haitian teen.
Use your completed bar graph and table to answer the following questions. 1. Write a paragraph explaining the differences between the two sets of data on your graph.
Make sure to discuss each nutritional category.
2. Which nutritional category shows the biggest difference in your two sets of nutrition data?
3. Form a hypothesis: Explain THREE possible reasons for this difference.
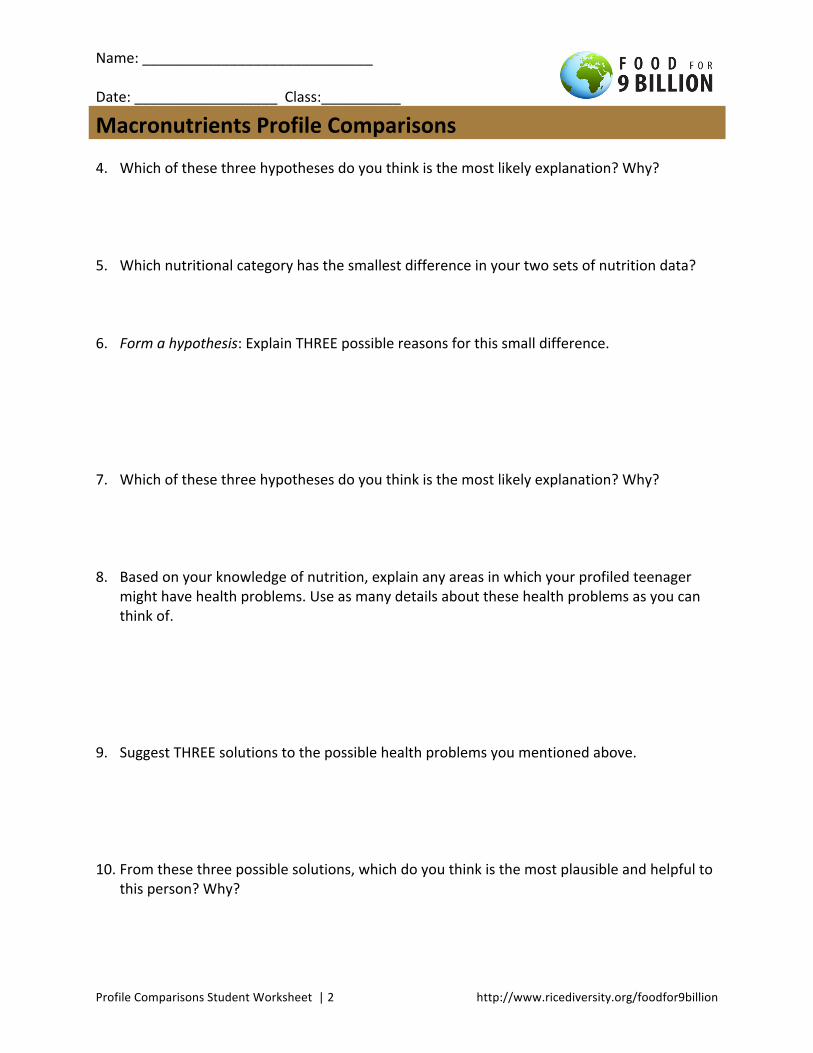
Name: _____________________________ Date: __________________ Class:__________
Macronutrients Profile Comparisons
Profile Comparisons Student Worksheet | 2 http://www.ricediversity.org/foodfor9billion
4. Which of these three hypotheses do you think is the most likely explanation? Why?
5. Which nutritional category has the smallest difference in your two sets of nutrition data?
6. Form a hypothesis: Explain THREE possible reasons for this small difference.
7. Which of these three hypotheses do you think is the most likely explanation? Why?
8. Based on your knowledge of nutrition, explain any areas in which your profiled teenager
might have health problems. Use as many details about these health problems as you can think of.
9. Suggest THREE solutions to the possible health problems you mentioned above.
10. From these three possible solutions, which do you think is the most plausible and helpful to
this person? Why?
Name: _____________________________ Date: __________________ Class:__________
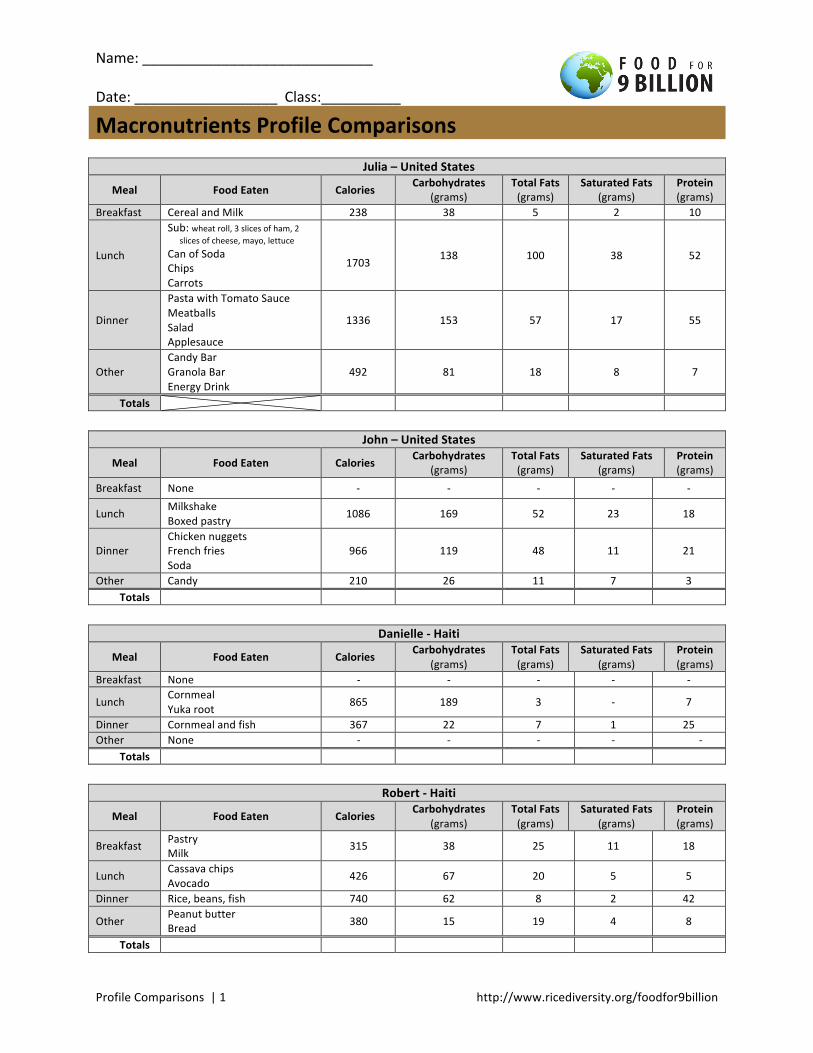
Macronutrients Profile Comparisons
Profile Comparisons | 1 http://www.ricediversity.org/foodfor9billion
Julia – United States
Meal Food Eaten Calories Carbohydrates (grams)
Total Fats (grams)
Saturated Fats (grams)
Protein (grams)
Breakfast Cereal and Milk 238 38 5 2 10
Lunch
Sub: wheat roll, 3 slices of ham, 2 slices of cheese, mayo, lettuce
Can of Soda Chips Carrots
1703 138 100 38 52
Dinner
Pasta with Tomato Sauce Meatballs Salad Applesauce
1336 153 57 17 55
Other Candy Bar Granola Bar Energy Drink
492 81 18 8 7
Totals
John – United States
Meal Food Eaten Calories Carbohydrates (grams)
Total Fats (grams)
Saturated Fats (grams)
Protein (grams)
Breakfast None -‐ -‐ -‐ -‐ -‐
Lunch Milkshake Boxed pastry 1086 169 52 23 18
Dinner Chicken nuggets French fries Soda
966 119 48 11 21
Other Candy 210 26 11 7 3 Totals
Danielle -‐ Haiti
Meal Food Eaten Calories Carbohydrates (grams)
Total Fats (grams)
Saturated Fats (grams)
Protein (grams)
Breakfast None -‐ -‐ -‐ -‐ -‐
Lunch Cornmeal Yuka root 865 189 3 -‐ 7
Dinner Cornmeal and fish 367 22 7 1 25 Other None -‐ -‐ -‐ -‐ -‐
Totals
Robert -‐ Haiti
Meal Food Eaten Calories Carbohydrates (grams)
Total Fats (grams)
Saturated Fats (grams)
Protein (grams)
Breakfast Pastry Milk 315 38 25 11 18
Lunch Cassava chips Avocado 426 67 20 5 5
Dinner Rice, beans, fish 740 62 8 2 42
Other Peanut butter Bread 380 15 19 4 8
Totals
Macronutrient Analysis
Reference Tables | 1 http://www.ricediversity.org/foodfor9billion
Macronutrient Analysis
Reference Tables | 2 http://www.ricediversity.org/foodfor9billion
Macronutrient Analysis
Reference Tables | 3 http://www.ricediversity.org/foodfor9billion