Embed Size (px)
Citation preview
www.africaneconomicoutlook.org
Madagascar2012
MadagascarThe political crisis continued to affect Madagascar economically and socially in 2011 and gross domesticproduct (GDP) grew by a weak 0.6%. It should grow faster in 2012, by 2.4%, and in 2013, by 4.5%.
The political crisis also slowed (and in some cases stopped) most public sector reforms. However, thebudget deficit was contained at 1.3% of GDP in 2011 thanks to continuing spending austerity and shouldremain steady in 2012.
Youth employment remains a big problem, with 5.9% of under-25s out of work, compared with an overallrate of 3.8%. Urban youths were more affected (8.9%) than those in the countryside (3.9%) but these lowfigures hide a rate of under-employment which is more explosive. The country has a national job supportprogramme but the current political and institutional instability has prevented it from achieving its goals.
Overview
The political crisis continued in 2011, affecting the economy and society. Higher oil and food prices and poorrainfall also played their part and real GDP rose by only 0.6%, barely more than the 0.5% in 2010. Theeconomy should expand, however, by 2.4% in 2012 and 4.5% in 2013, owing to hopes of a solution to the crisisafter agreement on a road-map on 17 September 2011 and the strength of the mining sector. But the ongoingeconomic crisis in the euro area could undermine this momentum with a fall in demand for Madagascan goodsand high unemployment in Europe that could reduce exports and affect the tourist industry.
Continuing austerity kept the budget deficit to 1.3% of GDP in 2011 and it should be about the same in 2012.Consumer price inflation was high at 9.5% in 2011 because of increases in oil and food prices. The currentaccount deficit shrank from 9.7% of GDP in 2010 to 3.4% in 2011 because of revived goods exports and a dropin imports arising from less economic activity. The deficit is expected to widen slightly to 4.4% in 2012 and4.7% in 2013 with the gradual resumption of imports of goods as the political situation normalises.
The weakness of the economy since the start of the political crisis has greatly affected living conditions and a2010 household survey showed 76% of Madagascans were considered poor, up from 68% in 2005. The onlyMillennium Development Goal (MDG) the country will achieve is that for reducing the rate of HIV/AIDS.
The household survey showed unemployment was fairly low (3.8%) but under-employment very high (67.2%)because of unsuitable jobs or the number of hours worked. Young people are most affected by this joblessnesspattern. The government has a national employment policy PNE (Politique nationale d'emploi) beingimplemented through a national employment support programme PNSE (Programme national de soutien àl'emploi), but the current political and institutional uncertainty has prevented it from achieving its goals. Sopractical steps to help young people enter the jobs market are little known about and, in any case, assessmentof their results is difficult for lack of data. The mismatch between training and employers’ needs, especially inthe private sector, is a big problem and the process for seeking work is inefficient. With so many young people,getting them into jobs should be a major government concern and special programmes to do this should belaunched when the political crisis is over.
African Economic Outlook 2012 2 | © AfDB, OECD, UNDP, UNECA
http://dx.doi.org10.1787/888932619032
http://dx.doi.org/10.1787/888932602407
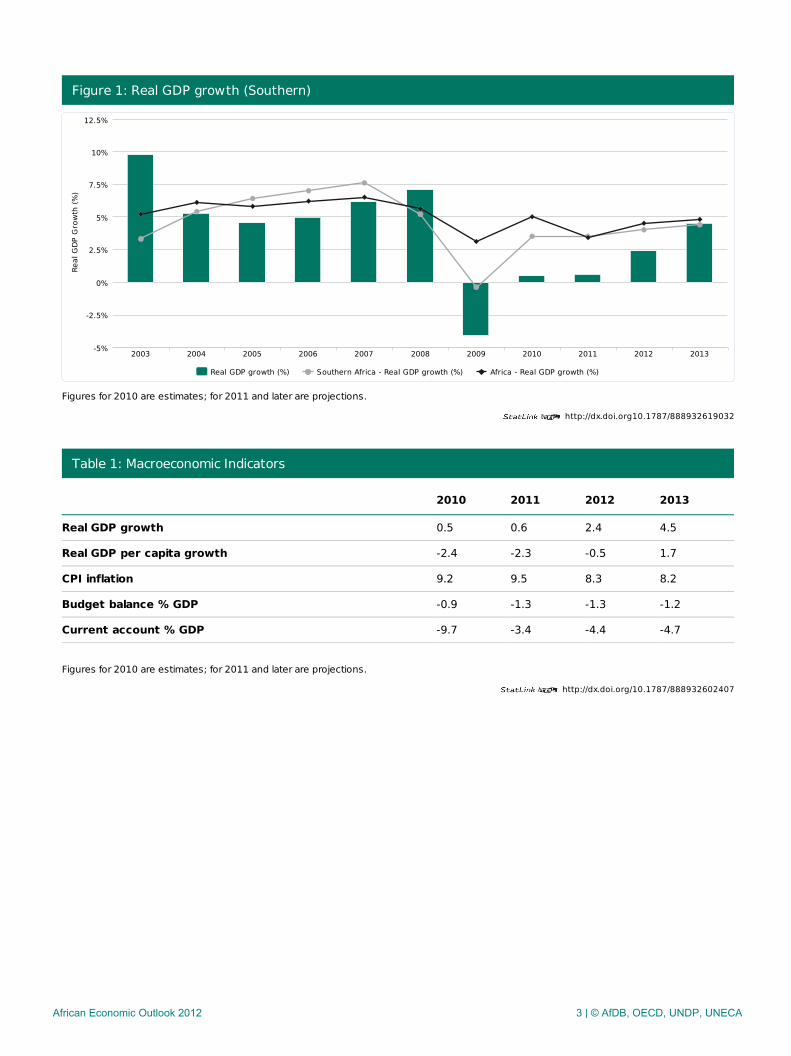
Figure 1: Real GDP growth (Southern)
Figures for 2010 are estimates; for 2011 and later are projections.
Table 1: Macroeconomic Indicators
2010 2011 2012 2013
Real GDP growth 0.5 0.6 2.4 4.5
Real GDP per capita growth -2.4 -2.3 -0.5 1.7
CPI inflation 9.2 9.5 8.3 8.2
Budget balance % GDP -0.9 -1.3 -1.3 -1.2
Current account % GDP -9.7 -3.4 -4.4 -4.7
Figures for 2010 are estimates; for 2011 and later are projections.
Real GDP growth (%) Southern Africa - Real GDP growth (%) Africa - Real GDP growth (%)
2003 2004 2005 2006 2007 2008 2009 2010 2011 2012 2013-5%
-2.5%
0%
2.5%
5%
7.5%
10%
12.5%
Real
GDP
Gro
wth
(%)
African Economic Outlook 2012 3 | © AfDB, OECD, UNDP, UNECA
http://dx.doi.org10.1787/888932621008
Recent Developments & Prospects
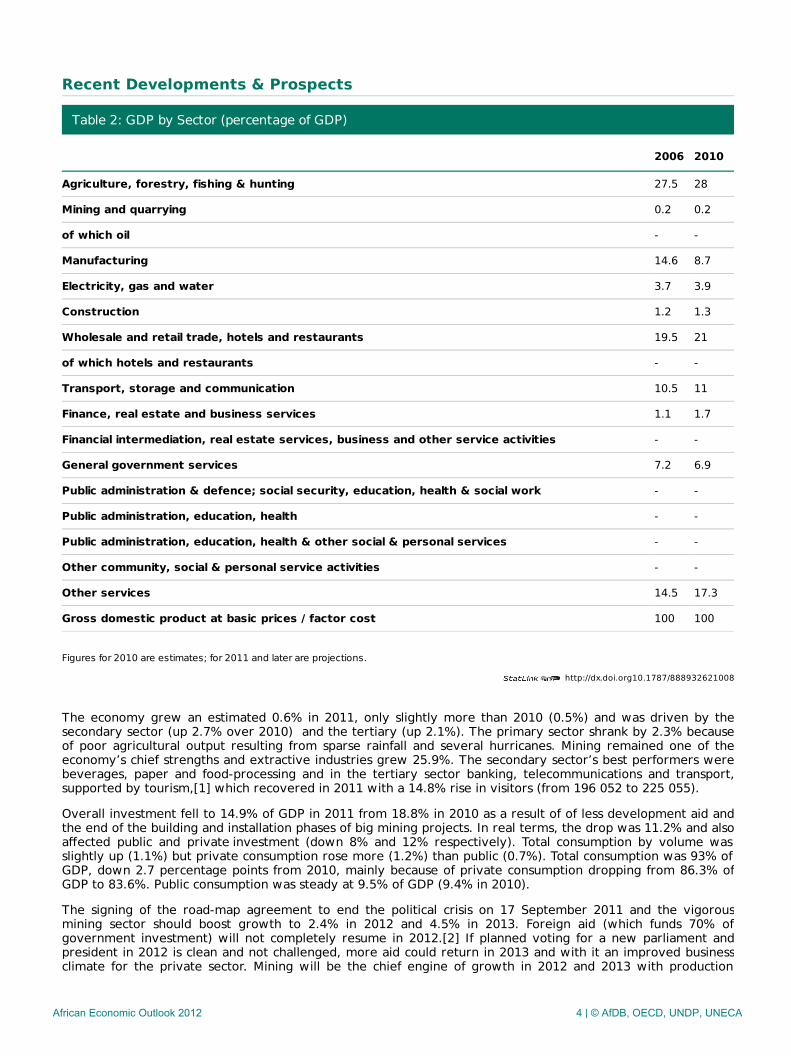
Table 2: GDP by Sector (percentage of GDP)
2006 2010
Agriculture, forestry, fishing & hunting 27.5 28
Mining and quarrying 0.2 0.2
of which oil - -
Manufacturing 14.6 8.7
Electricity, gas and water 3.7 3.9
Construction 1.2 1.3
Wholesale and retail trade, hotels and restaurants 19.5 21
of which hotels and restaurants - -
Transport, storage and communication 10.5 11
Finance, real estate and business services 1.1 1.7
Financial intermediation, real estate services, business and other service activities - -
General government services 7.2 6.9
Public administration & defence; social security, education, health & social work - -
Public administration, education, health - -
Public administration, education, health & other social & personal services - -
Other community, social & personal service activities - -
Other services 14.5 17.3
Gross domestic product at basic prices / factor cost 100 100
Figures for 2010 are estimates; for 2011 and later are projections.
The economy grew an estimated 0.6% in 2011, only slightly more than 2010 (0.5%) and was driven by thesecondary sector (up 2.7% over 2010) and the tertiary (up 2.1%). The primary sector shrank by 2.3% becauseof poor agricultural output resulting from sparse rainfall and several hurricanes. Mining remained one of theeconomy’s chief strengths and extractive industries grew 25.9%. The secondary sector’s best performers werebeverages, paper and food-processing and in the tertiary sector banking, telecommunications and transport,supported by tourism,[1] which recovered in 2011 with a 14.8% rise in visitors (from 196 052 to 225 055).
Overall investment fell to 14.9% of GDP in 2011 from 18.8% in 2010 as a result of of less development aid andthe end of the building and installation phases of big mining projects. In real terms, the drop was 11.2% and alsoaffected public and private investment (down 8% and 12% respectively). Total consumption by volume wasslightly up (1.1%) but private consumption rose more (1.2%) than public (0.7%). Total consumption was 93% ofGDP, down 2.7 percentage points from 2010, mainly because of private consumption dropping from 86.3% ofGDP to 83.6%. Public consumption was steady at 9.5% of GDP (9.4% in 2010).
The signing of the road-map agreement to end the political crisis on 17 September 2011 and the vigorousmining sector should boost growth to 2.4% in 2012 and 4.5% in 2013. Foreign aid (which funds 70% ofgovernment investment) will not completely resume in 2012.[2] If planned voting for a new parliament andpresident in 2012 is clean and not challenged, more aid could return in 2013 and with it an improved businessclimate for the private sector. Mining will be the chief engine of growth in 2012 and 2013 with production
African Economic Outlook 2012 4 | © AfDB, OECD, UNDP, UNECA
starting at the country’s biggest mine, at Ambatovy. The tertiary sector will benefit from revived tourism.Agricultural production will remain modest in 2012 and 2013 because of low rainfall and frequent hurricanes.
Total investment is expected to grow 2.2% in 2012 (14.5% of GDP), and 8.6% (14.4%) in 2013. With spendingon elections in 2012, estimated at MGA 45 billion (Madagascar ariary) or USD 22.5 million (US dollars), and afterthe economy has returned to normal in 2013, total consumption by volume should grow 1.3% in 2012 and 4.1%in 2013 to reach 93.7% of GDP.
[1] Tourism figures are from the Tableau de bord de l’économie de Madagascar, Institut National de laStatistique, January 2012.
[2] Aid will be needed however for the holding of elections.
African Economic Outlook 2012 5 | © AfDB, OECD, UNDP, UNECA
http://dx.doi.org10.1787/888932621996
Macroeconomic Policy
Fiscal PolicyWith direct external funding of the government reduced, the government continued budgetary austerity in2011, but the deficit still widened slightly to 1.3% of GDP (from 0.9% in 2010). Priorities were the ministries offinance, education, health, decentralisation and agriculture, which got about 60% of the budget.
Government revenue fell to 12.2% of GDP in 2011 from 13.3% in 2010 because of the drop in foreign aid andslower economic activity. Collection was 93.4% of the budgeted figure at the end of 2011 (96% for tax and36.3% for non-tax). Total spending was 13.5% of GDP (14.1% in 2010). Budget restraints meant priority wentto current spending (10.2% of GDP) over investment spending (3.3%). Average spending commitment in thegeneral budget was 89.3% at the end of 2011, including 70.2% for investment. Higher world oil prices forcedthe government to subsidise oil companies[3] to the tune of USD 33.7 million (0.4% of GDP) to keep pumpprices steady, though not all of it was paid, which weakened the financial situation of many oil firms. The 2011budget deficit was funded by disbursements from ongoing projects and by recourse to the banking system byauctioning treasury bonds.
The 2012 budget continues the policy of rigour, with tax breaks to encourage investment in renewable energy.Foreign aid will not have returned, except to help pay for elections, so total revenue (including grants) isestimated at 12.4% of GDP and total spending at 13.7%. The deficit will be about the same as 2011 (1.3% ofGDP). Constitutional normality should be restored by 2013 and revenue increase to 13.1% of GDP and spendingto 14.3%, with a budget deficit of 1.2% of GDP.
[3] These subsidies are general and not especially directed toward the poor.
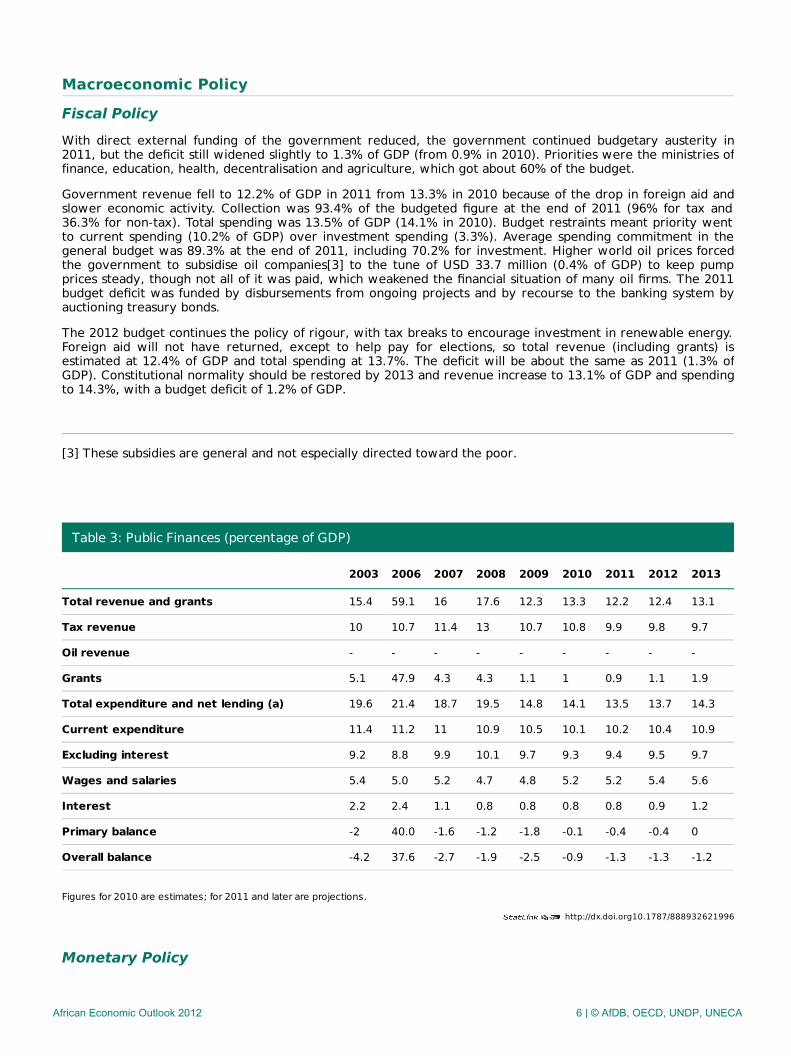
Table 3: Public Finances (percentage of GDP)
2003 2006 2007 2008 2009 2010 2011 2012 2013
Total revenue and grants 15.4 59.1 16 17.6 12.3 13.3 12.2 12.4 13.1
Tax revenue 10 10.7 11.4 13 10.7 10.8 9.9 9.8 9.7
Oil revenue - - - - - - - - -
Grants 5.1 47.9 4.3 4.3 1.1 1 0.9 1.1 1.9
Total expenditure and net lending (a) 19.6 21.4 18.7 19.5 14.8 14.1 13.5 13.7 14.3
Current expenditure 11.4 11.2 11 10.9 10.5 10.1 10.2 10.4 10.9
Excluding interest 9.2 8.8 9.9 10.1 9.7 9.3 9.4 9.5 9.7
Wages and salaries 5.4 5.0 5.2 4.7 4.8 5.2 5.2 5.4 5.6
Interest 2.2 2.4 1.1 0.8 0.8 0.8 0.8 0.9 1.2
Primary balance -2 40.0 -1.6 -1.2 -1.8 -0.1 -0.4 -0.4 0
Overall balance -4.2 37.6 -2.7 -1.9 -2.5 -0.9 -1.3 -1.3 -1.2
Figures for 2010 are estimates; for 2011 and later are projections.
Monetary Policy
African Economic Outlook 2012 6 | © AfDB, OECD, UNDP, UNECA
Madagascar does not belong to any monetary union. The official job of the central bank (BCM) is to keep thecurrency stable at home and abroad. Despite the current crisis, the ariary was fairly steady in 2011 againstmajor currencies because of the bank’s intervention, with the euro (EUR) at an average of MGA 2 815.07 andthe US dollar at MGA 2025.06. Monetary aggregates expanded during the year. The money supply (M3) grew13.5%, with the increase in net external assets to a record USD 1.1 billion in December (the equivalent of aboutfour months of imports). Despite the crisis, loans to the economy (chiefly medium and long term) were up anaverage 7%. The BCM’s intervention rate (9.5%) has not changed since August 2009.
Inflation was an average 9.5% in 2011. Prices for local products rose more (7.5%) than for imports (5.5%) andsemi-finished imports (3.4%). Food prices were up 9%, including rice (9.7%), which the government was forcedto import to meet demand. Energy was 7.8% dearer because of higher world oil prices.
The government plans to continue cautious fiscal and monetary policies that should bring inflation down to 8.3%in 2012 and 8.2% in 2013.
Economic Cooperation, Regional Integration & TradeMadagascar belongs to several regional groupings, including the Common Market for Eastern and SouthernAfrica (COMESA), the Southern African Development Community (SADC) and the Indian Ocean Commission((IOC), but does little trade with them.[4] In 2010, COMESA bought 4.6% of the country’s total exports, SADC5.85% and the IOC 3.33%. Of its total imports, 5.21% came from COMESA, 11.04% from SADC and 3.22% fromthe IOC countries. Madagascar has recently streamlined its customs and trade regulations and the World Bank’s2011 Doing Business report moved it up eight places for ease of cross-border trade, mainly thanks to bettercommunication and co-ordination between customs and port operators, and customs clearance took only threedays, compared with seven days in 2010.
Madagascar’s current account improved significantly in 2011 with its deficit shrinking from 9.7% of GDP to 3.4%,thanks to a 4.2% increase in exports (to 16.1% of GDP) despite the crisis. The deficit should hold more or lesssteady in 2012 (4.4%) and 2013 (4.7%). Main exports[5] in 2011 were (by value) food products(USD 352.9 million), mineral ore (USD 198.4 million) and shrimps (USD 66.7 million). Volume imports weredown 0.8% (to 22.8% of GDP) and were mainly rice (USD 85.6 million), oil products (USD 595.5 million, 7% ofGDP), sugar (USD 78.2 million) and food products (USD 294.9 million, 3.4% of GDP). Imports of capital goodswere down 39.6% and cement 15.9%, as construction of major investment projects, especially in mining, wascompleted. The trade deficit thus improved, from 12.3% of GDP in 2010 to 6.7% in 2011. It should widenslightly in both 2012 and 2013 before stabilising at 7.3% in the two succeeding years.
The services deficit shrank slightly to 0.8% of GDP in 2011 (1.1% in 2010) as a result of healthy exports oftransport and travel services. The current transfers deficit was steady at 4.6% of GDP (down 0.3 of apercentage point from 2010), because of private transfers, including by non-governmental organisations(NGOs). Foreign direct investment (FDI) amounted to SDR 438.7 million (special drawing rights), down 10%from SDR 486.6 million in 2010, owing to completion of big mining projects. Extractive industries continue toattract about 80% of FDI, with financial activity, construction and fuel distribution absorbing the rest. FDI in2010 came mostly from Canada (30.3%), Japan (21.5%), South Korea (20.6%), France (9.1%) and China (7.6%).South Korea and China, who are emerging country partners of Madagascar, thus provided almost a third of suchinvestment in 2010.
4 Data on trade with these regional groupings come from the report of the Indian Ocean Commission flagshipsurvey, AfDB, October 2011.
5 Data on value exports and imports are from the Tableau de bord de l’économie de Madagascar, January 2012.
African Economic Outlook 2012 7 | © AfDB, OECD, UNDP, UNECA
http://dx.doi.org10.1787/888932622984
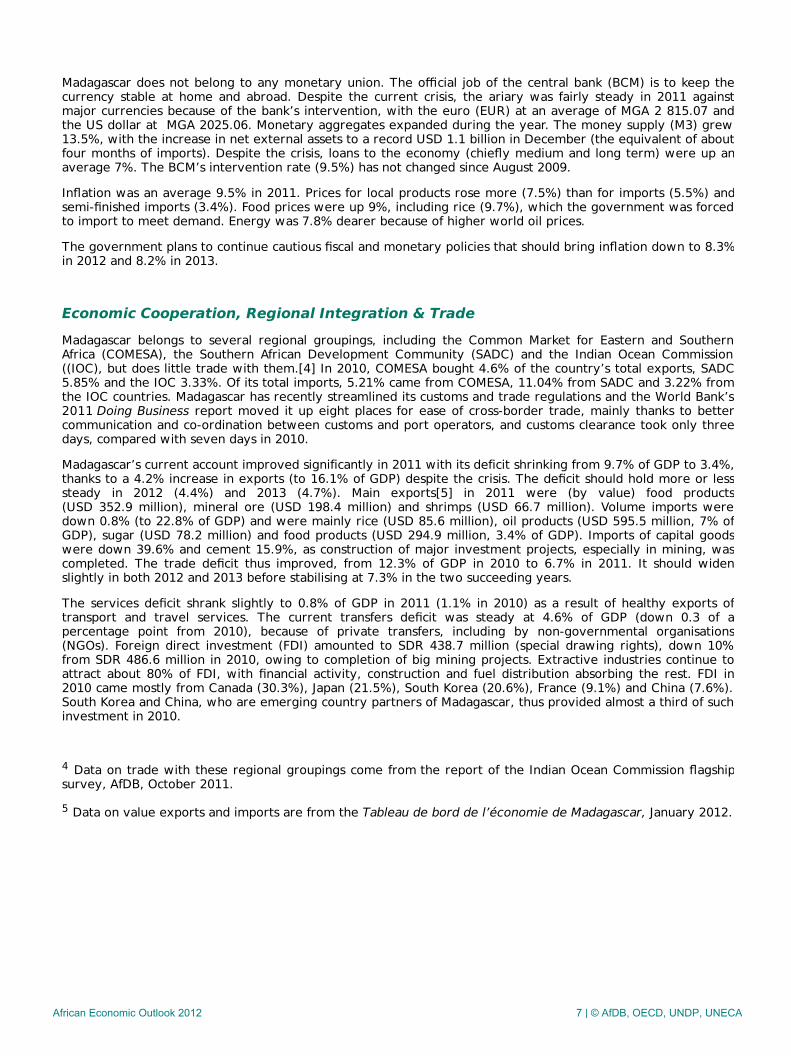
Table 4: Current Account (percentage of GDP)
2003 2006 2007 2008 2009 2010 2011 2012 2013
Trade balance -3.5 -10.2 -13.6 -20.2 -19.5 -12.3 -6.7 -7.3 -7.3
Exports of goods (f.o.b.) 17.2 17.5 16.8 13.9 12.3 12.3 16.1 14.7 13.7
Imports of goods (f.o.b.) 20.7 27.7 30.5 34.1 31.8 24.6 22.8 22 20.9
Services -5.5 -2.2 -2.4 -4.1 -4.2 -1.1 -0.8 -0.9 -0.9
Factor income -1.5 -1.5 -0.8 -0.5 -1.1 -1.2 -0.5 -0.6 -0.5
Current transfers 5.5 3.8 4.9 4.3 3.6 4.9 4.6 4.5 3.9
Current account balance -4.9 -10.0 -11.9 -20.6 -21.1 -9.7 -3.4 -4.4 -4.7
Figures for 2010 are estimates; for 2011 and later are projections.
Debt PolicySince the start of the crisis, the chances of obtaining new loans from traditional lenders have been slim, sopublic debt is quite small. External debt was estimated in June 2011 at SDR 1 401.12 million (19.7% of GDP,down from 24.9% in 2010). Despite the crisis, the government has paid on time its external debt interest, whichwas MGA 174.65 billion (USD 61.26 million) at the end of 2011. The exact amount of arrears due on domesticdebt at the end of 2011 was not known but the national business federation GEM (Groupement des Enterprisesde Madagascar) said the government owed firms about MGA 7 billion (USD 3.4 million),[6] mostly value addedtax (VAT) refunds, at the end of August 2011. Government debt should remain quite low in 2012 and 2013.
[6] Settlement of these is among the short-term steps proposed by GEM as part of economic recoverymeasures.
African Economic Outlook 2012 8 | © AfDB, OECD, UNDP, UNECA
http://dx.doi.org10.1787/888932619032
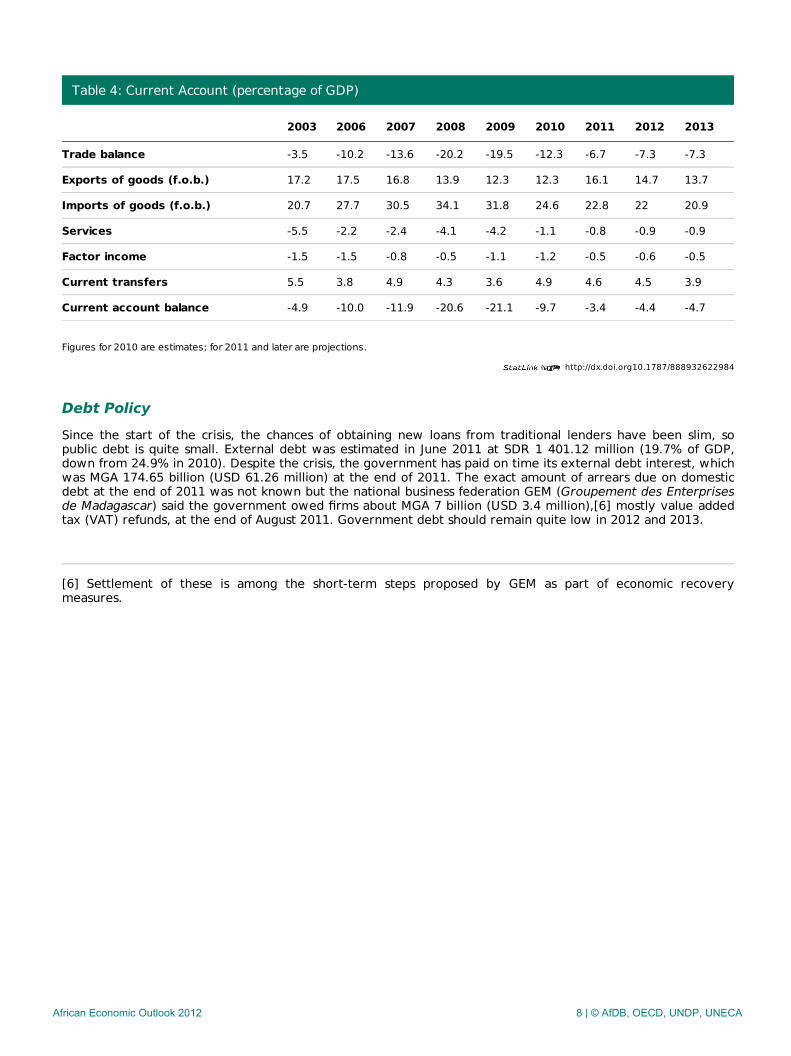
Figure 2: Stock of total external debt (percentage of GDP) and debt service (percentage of exports ofgoods and services)
Figures for 2010 are estimates; for 2011 and later are projections.
Debt/GDP Debt service/Exports
2003 2004 2005 2006 2007 2008 2009 2010 2011 2012 20130%
25%
50%
75%
100%
125%
150%
Perc
enta
ge
African Economic Outlook 2012 9 | © AfDB, OECD, UNDP, UNECA
Economic & Political Governance
Private SectorIn spite of the political and economic uncertainty since 2009, the business climate has recently improvedsomewhat. The country moved up seven places, to 137th overall among 183 countries in the World Bank 2012Doing Business report, with its best score for ease of starting a business, for which it moved up a spectacular 50places over the year to rank 20th in the world, after the government abolished the minimum capital required toset up limited companies but this did not have much impact and their number[7] actually fell 4% in 2011.However, the total of all firms created in 2011 rose 48% to 20 710 (from 13 977 in 2010). Individual firms were52.1% of the total, with 21.6% in the capital, Antananarivo. Despite this, the investment climate remainsdifficult. Electricity supply is poor and blackouts frequent and the country scores badly in the Doing Businessreport for enforcing contracts, ease of closing firms, registering property and getting construction permits.
[7] See Tableau de Bord de l’économie de Madagascar, January 2012.
Financial SectorThe financial sector comprises 11 banks, seven financial establishments and 29 micro-finance institutions (threeof which are currently suspended and awaiting reauthorisation to operate). Only two banks (Bank of Africa andBFV-Société Générale) are fairly well established outside the capital. Financial markets include the moneymarket (interbank exchanges and open market) and treasury bond auctions. The central bank’s interventionrate (9.5%) has been the same since August 2009 and the overall average weighted rate for auctioned treasurybonds was steady at 9.65% in June 2011 (9.6% in December 2010).
The political and economic crisis has affected the quality of the banks’ portfolios. The proportions of non-performing loans and capital risk levels are fairly low but rising. Bad and disputed debts increased to 13.8% ofgross loans at the end of June 2011 (from 11.9% in 2010).[8] The population’s use of banks remains low (about5%) and micro-finance institutions are used by 12%.
[8] See Bulletin de la BCM, June 2011.
Public Sector Management, Institutions & ReformBecause of the crisis, reforms to boost the private sector have slowed down, or even come to a halt, and thestate controls, or still has shares in, energy, telecommunications, agro-industry and air transport companies.Government kept promises in August 2011 to ease the plight of those affected by the crisis by, among otherthings, directly importing rice, sugar, cooking oil and flour, to the discomfort of private importers. Businessorganisations have made proposals to the government for tackling the private sector’s many problems. Theyinclude short and medium-term measures.[9]
The government has continued to implement the budget programme, procurement reforms, a hierarchicalcontrol system of spending, and better revenue collection. But the World Bank’s September 2011 review ofgovernment spending noted problems in revenue collection, budget coverage, the spending chain, budgetnomenclature, monitoring and the investment budget. It proposed several measures to encourage dialogueabout public finance reform between the government and its partners as soon as suitable conditions wererestored.
[9] Short-term measures include paying government arrears owed to private firms, a definitive solution topower cuts and setting up a frank dialogue between the government and the private sector. Medium-term onesinclude organising better economic transparency and drafting a policy of partnerships in mining investments.
African Economic Outlook 2012 10 | © AfDB, OECD, UNDP, UNECA
Natural Resource Management & EnvironmentMadagascar has one of the world’s greatest biodiversities and huge natural resources. But this natural heritageis threatened by deforestation and damage to natural areas, especially from the felling and illegal export ofrosewood. About 30 000 rosewood and ebony logs have been seized by the environment ministry and loggersare thought to have about 200 000 more. The government banned all rosewood exports in March 2010 and inAugust 2011 ordered confiscation of all felled logs and had rosewood and ebony added to Appendix III of theConvention on International Trade in Endangered Species of Wild Fauna and Flora (CITES). The confiscated logsare to be sold in 2012 in a transparent manner. The country’s natural resources are also threatened by climatechange. Its geographical position in the south-west Indian Ocean, one of the world’s major hurricane areas,exposes it to storms, flooding and drought.
Careful management is needed of revenue earned from exploitation of its natural resources, especially mining,so that it benefits Madagascans. The government has joined the Extractive Industries Transparency Initiative(EITI) and was admitted as a candidate country in February 2008. This status was suspended in October 2011until the political situation returned to normal. Extraction industry firms[10] paid the government MGA 251.9 billion (USD 132 million, or 1.5% of GDP) between 2007 and mid-2010, according to an EITI audit.The budgetised non-tax revenue collected by the ministries of fisheries, mining and the environment wasestimated at USD 7.9 million in 2011 (0.1% of GDP), so budget revenue from extraction of natural resourcesremains small but significant progress should be made in coming years.
[10] Qit Madagascar Minerals, Rio Tinto, Ambatovy and Kraoma SA.
Political ContextAfter several fruitless attempts to resolve the political crisis, progress seems to have been made since thesigning on 17 September 2011 by almost all political groups[11] of a road-map agreement to end the crisis,thanks to mediation by SADC. Measures to implement it have included the appointment of a consensus primeminister in October that year, formation of a transitional national unity government in November andenlargement of the two houses of the transitional parliament in December. An independent transitional electionscommission was appointed in February 2012 and legislative and presidential elections will be organised with thehelp of the United Nations and the French-speaking international body, the Organisation internationale de lafrancophonie by December 2012. In view of this progress, some countries and international bodies[12] havemoved towards recognising the transitional government. But only the holding of transparent and credibleelections can definitively end the crisis and allow the country to return to the international community and winentire recognition from its foreign partners.
[11] Only former President Didier Ratsiraka’s party has not yet signed.
[12] The Swiss ambassador, the head of the European Union (EU) delegation and the UN Resident Coordinatorhave already presented certified copies of their credentials to the foreign minister, on respectively 29November and 12 and 27 December 2011.
African Economic Outlook 2012 11 | © AfDB, OECD, UNDP, UNECA
Social Context & Human Development
Building Human ResourcesThe political and economic crisis has helped make living conditions harder for Madagascans. A 2010 householdsurvey showed 76% (including 82.2% in the countryside) of the population were regarded as poor, up from 68%in 2005. In 2008, the country had hopes of meeting three of the MDGs by the 2015 target date, but now onlythat for reducing HIV/AIDS[1] will be achieved.
The length of the crisis has undermined the healthcare system and its ability to meet people’s needs. Infantmortality remains high (61 per 1 000 in 2010), as does child (under-five) mortality (92.8 per 1 000). The MDGsare respectively 31 and 56. Maternal mortality is 498 for 100 000 live births, while the MDG target is 127. Majorbudget restraints[14] and lack of staff closed 214 healthcare centres in January 2011. All these factors havecaused the return of diseases that had been eradicated or were under control, such as plague, rabies and polio.The African Development Bank (AfDB) made a USD 1 million emergency grant in January 2012 for campaigns ofvaccination against the three diseases.
The country seems on the way to the goal of universal education, with 74.3% net enrolment in 2010, but poor-quality teaching is a major problem. The primary school completion rate was 66% in 2010, far from the MDG of100%. Ministry budget restrictions[15] undermined the education system and increased the cost of education tofamilies by 30%. About 400 000 children were unable to enrol for the 2011-12 school year, and urban primaryschools showed a 4.6% drop in enrolment in 2009-10.
Only 42% of the population had access to drinking water and 48% to proper sanitation in 2010. The MDGstargets are 65% and 71%.
[13] The disease affects 0.1% of the 15-24 age group. Prevention and treatment programmes are ongoing forthis, tuberculosis and malaria, but coverage is small and getting smaller as funding to combat infectious diseaseshas dwindled because of the political crisis. The achievements so far are under serious threat.
[14] Because of the suspension of most direct aid to the government, the health budget was cut by 43% in 2010and 14% in 2011, from the 2009 pre-crisis budget level. Due to regulation problems, only 66% of the 2010 onewas committed.
[15] The education budget was cut 19% in 2010 and 8% in 2011, from the 2009 pre-crisis budget level.
Poverty Reduction, Social Protection & LabourWith no clear national policy during the current crisis, funding is allocated on the basis of priorities set by thetransitional government. The 2011 budget earmarked 37% of the total for healthcare, education and foodsecurity. The 2012 budget expanded these priorities to include strengthening security of property and people,supporting agriculture and growth of energy supply and allocated about 40% to them.
To soften the effects of the social and political crisis on the most vulnerable sections of the population, variousnationwide social protection programmes have been launched but cover very few people. The governmentannounced measures in August 2011 to improve healthcare, education and food security. They included freehigher and technical education; free materials for pupils in government schools; free treatment and medicine inpublic hospitals; cheaper surgical operations through subsidies and supply of the most common drugs; lookingafter homeless people; providing water to the poorest families; and maintaining subsidies to fuel companies tokeep pump prices steady. It is hard to tell how far these measures have been implemented, in the absence ofregular government reports. Judging by the substantial budget limitations in 2011 and 2012, many of themcould just remain simply good intentions.
UN agencies are active in many areas, with targeted cash grants and food and also fortified nutrition for womenand children.
Gender Equality
African Economic Outlook 2012 12 | © AfDB, OECD, UNDP, UNECA
Madagascar has made significant efforts to promote gender equality, especially in the worldwide UNESCO-ledEducation For All campaign, compared with most sub-Saharan countries. The boy/girl ratio in primary schools in2010 was 97.5% (92% in sub-Saharan Africa) and in secondary education 94.2% (79% in sub-Saharan Africa).The MDG for these two indicators is 100%. Ante-natal care is free but provision of contraception (26.1%) andthe rate of births attended by qualified staff (43.9%) are not very high, especially in rural areas, according tothe 2008-09 demographic and health survey.
In law women have equal rights with men but in practice discrimination persists. The government has takensteps since 2000 to promote women's rights but enforcement is difficult. Participation of women in economicactivity is mostly informal and their presence in government institutions is low.
African Economic Outlook 2012 13 | © AfDB, OECD, UNDP, UNECA
Thematic analysis: Promoting Youth Employment
Half of all Madagascans are under 20. The 2010 household labour market survey[16] showed unemploymentwas quite low (3.8%), but under-employment very high because of unsuitable jobs (42.2%) or the number ofhours worked (25%), so more than 70% of the workforce are either unemployed or under-employed. Thosebetween 15-24 make up 27.4% of the working population (28% in towns and 25% in the countryside). Youngpeople (under 25) also suffer most from unemployment (5.9% compared with 3.8% overall), with more affectedin towns (8.9%) than in rural areas (3.9%).
The international financial and local political crises are reckoned to have destroyed 336 000 jobs (84.7% of themin industry and the services and infrastructure sectors) and made about 90% of jobs precarious, according to theInternational Labour Organization (ILO).
The government has a national employment policy, the PNE, which is implemented through a nationalemployment support programme, the PNSE, for 2007-11. These two are based on the strategic priorities ofdeveloping local skills (especially boosting the employability of vulnerable groups), encouraging sectors thatgenerate jobs and improving the legal and institutional environment. Youth employment is also a focus of thecountry programme for decent work (PPTD) and regional job-promotion strategies (SRPE) in two areas(Vatovavy Fitovinany and Atsimo Andrefana). Several government bodies[17] deal with youth employment.
Government measures, through the ministry of the civil service, labour and social laws (MFPTLS), to help youngpeople enter the labour market include: i) strengthening centralised job-seeking services; ii) reinforcing regionalemployment and training facilities; iii) seeking apprentice placement agreements; iv) organising employmentand training advice and information services; v) exhibitions about employment staged in four provinces; vi)training in job-seeking techniques and vocational training as well as initial and continuous training; and vii)technical support for designing job and income-generating projects. Assessment of these measures is not alwayseasy, for lack of data.
One-off measures to help young business people and provide skills training include a programme to supportsmall rural firms and regional economies (PROSPERER Madagascar) set up in 2008 to help growth of small non-agricultural trades in rural areas and to involve 21 000 small businesses (MER). It provides skills apprenticeshipsto young people who want to create or find a job. UN agencies are also trying to help youth employment,[18]with job fairs (in Analamanga, Antsiranana and Mahajanga) supported by the ILO, and, through the UnitedNations Development Programme (UNDP), the establishment of four information, guidance and job and self-employment help centres for people and businesses hurt by the crisis, in the capital, Mahitsy, Toliary-ville andSaint Augustin (Toliary II).
The mismatch between training and the skills needs of employers is a big problem in hiring young people. Basicand university education, and government technical and vocational training[19] turn out graduates who are notalways adapted for the labour market. About 94% of higher education graduates in 2009 qualified in education,literature, social and natural sciences, and healthcare. Only 4% were graduates in engineering and industrialproduction and processing even though these are skills highly sought after by the private sector.
A 2011 survey by the French Development Agency AFD (Agence française de développement)[20] found keypotential employment sectors in Madagascar were tourism, agriculture, agro-industry, information technology,transport and construction. It said only 500 people in the whole country were studying agriculture and tourism,sectors that could provide the most jobs. The situation was the same in construction, with a chronic lack ofqualified workers. Recruitment is even more difficult in non-strategic or non-priority sectors, leading some bigfirms to set up their own training facilities. Little attention is yet given to teaching methods at secondary anduniversity level.
As the formal sector cannot absorb enough of the many less-qualified young people, the informal sector remainsthe focus for jobs and training. The current national crisis is enlarging the informal sector through growth ofunder-employment and bad working conditions, of which young people are the main victims.
Insufficient job creation to absorb the unemployed is a major obstacle, along with lack of information andcommunication between the job-seekers and interested employers. Hiring of young people in Madagascar is notso much about various costs and charges[21] and the current legal minimum wage. Rather, employers are veryreluctant to hire people without experience or first-time job-seekers on long contracts. With more and morefirst-timers arriving on the job market,[22] employers are doing very little to help graduates and trainees.
Basic programmes to boost youth employment exist but have limited coverage. The job-seeking system hasmany flaws and the AFD survey noted the absence of a system to make people employable. Young people areoften left to their own devices in this respect. The occasional employment fairs only target young graduates.Between 25% and 50% of young job-seekers are able to sign on with an employment agency. Private
African Economic Outlook 2012 14 | © AfDB, OECD, UNDP, UNECA
employment firms help fewer than 10% of young people. Madagascar also has no system of unemploymentbenefit.
With so many young people, getting them into jobs should be a major concern for the government. Steps to betaken[23] should include, in the short term, quickly ending the political crisis to stop further destruction of jobsand designing (as soon as the crisis is over) special youth employment programmes including vocational training,help in finding jobs, starting work, reintegration and retraining, as well as access to loans for self-employment.Medium-term measures should include rethinking the education and training system to strengthen links to thejobs market and launching a serious economic recovery programme targeting sectors most affected by thepolitical and economic crisis, paying special attention to SMEs.
[16] Most the data on youth employment is taken from this survey. This section also draws on an assessment ofthe impact of the economic and political crises on employment published by the ILO and the UNDP in December2011 and on the AFD April 2011 working document – Métiers porteurs : le rôle de l’entreprenariat, de laformation et de l’insertion professionnelle à partir de l’analyse de trois pays.
[17] These are the ministries of the civil service, labour and social law (MFPTLS); education (MEN); technicaleducation and vocational training (METFP); higher education and scientific research; finance and the budget; theeconomy and industry; trade; population; youth and leisure (MJL), as well as the national monitoring centre foremployment and vocational training (OMEF), the national committee to monitor job creation and povertyreduction, the national labour council, the tripartite regional employment councils, and various state agenciesand training establishments.
[18] These efforts are explained in the December 2011 ILO/UNDP report.
[19] The country only has 63 government vocational training centres.
[20] AFD April 2011 working document, op. cit.
[21] Cost of dismissal, social security deductions and other charges, and uncertainty about wage costs because ofunpredictable fulfilment of contracts.
[22] The 2010 World Bank report on the challenges of urbanisation in Madagascar put the number at about300 000 a year in the main cities.
[23] These recommendations are partly inspired by those in the December 2011 ILO/UNDP report on promotionof decent work.
Notes1 Tourism figures are from the Tableau de bord de l’économie de Madagascar, Institut National de la Statistique,January 2012.
2 Aid will be needed, however, for the holding of elections.
3 These subsidies are general and not especially directed toward the poor.
4 Data on trade with these regional groupings come from the report of the Indian Ocean Commission flagship
African Economic Outlook 2012 15 | © AfDB, OECD, UNDP, UNECA
survey, AfDB, October 2011.
5 Data on value exports and imports are from the Tableau de bord de l’économie de Madagascar, January 2012.
6 Settlement of these is among the short-term steps proposed by the GEM as part of economic recoverymeasures.
7 See Tableau de Bord de l’économie de Madagascar, January 2012.
8 See Bulletin de la BCM, June 2011.
9 Short-term measures include paying government arrears owed to private firms, a definitive solution to powercuts and setting up a frank dialogue between the government and the private sector. Medium-term ones includeorganising better economic transparency and drafting a policy of partnerships in mining investments.
10 Qit Madagascar Minerals, Rio Tinto, Ambatovy and Kraoma SA.
11 Only former President Didier Ratsiraka’s party has not yet signed.
12 The Swiss ambassador, the head of the European Union (EU) delegation and the UN Resident Coordinatorhave already presented certified copies of their credentials to the foreign minister, on respectively 29November, and 12 and 27 December 2011.
13 The disease affects 0.1% of the 15-24 age group. Prevention and treatment programmes are ongoing forthis, tuberculosis and malaria, but coverage is small and reducing, as funding to combat infectious diseases hasdwindled because of the political crisis. The achievements so far are under serious threat.
14 Because of the suspension of most direct aid to the government, the health budget was cut by 43% in 2010and 14% in 2011 from the 2009 pre-crisis budget level. Because of regulation problems, only 66% of the 2010one was committed.
15 The education budget was cut 19% in 2010 and 8% in 2011 from the 2009 pre-crisis budget level.
16 Most the data on youth employment are taken from this survey. This section also draws on an assessment ofthe impact of the economic and political crises on employment published by the ILO and the UNDP in December2011 and on the Agence française de développement (AFD) April 2011 working document – Métiers porteurs :le rôle de l’entreprenariat, de la formation et de l’insertion professionnelle à partir de l’analyse de trois pays.
17 These are the ministries of the civil service, labour and social law (MFPTLS); education (MEN); technicaleducation and vocational training (METFP); higher education and scientific research; finance and the budget; theeconomy and industry; trade; population; youth and leisure (MJL), as well as the national monitoring centre foremployment and vocational training (OMEF), the national committee to monitor job creation and povertyreduction, the national labour council, the tripartite regional employment councils, and various state agenciesand training establishments.
18 These efforts are explained in the December 2011 ILO/UNDP report.
19 The country only has 63 government vocational training centres.
20 AFD April 2011 working document, op. cit.
21 Cost of dismissal, social security deductions and other charges, and uncertainty about wage costs because ofunpredictable fulfilment of contracts.
22 The 2010 World Bank report on the challenges of urbanisation in Madagascar put the number at about300 000 a year in the main cities.
23 These recommendations are partly inspired by those in the December 2011 ILO/UNDP report on promotionof decent work.
African Economic Outlook 2012 16 | © AfDB, OECD, UNDP, UNECA