Embed Size (px)
Citation preview
www.africaneconomicoutlook.org
Rwanda2012
http://dx.doi.org10.1787/888932619222
http://dx.doi.org/10.1787/888932602597
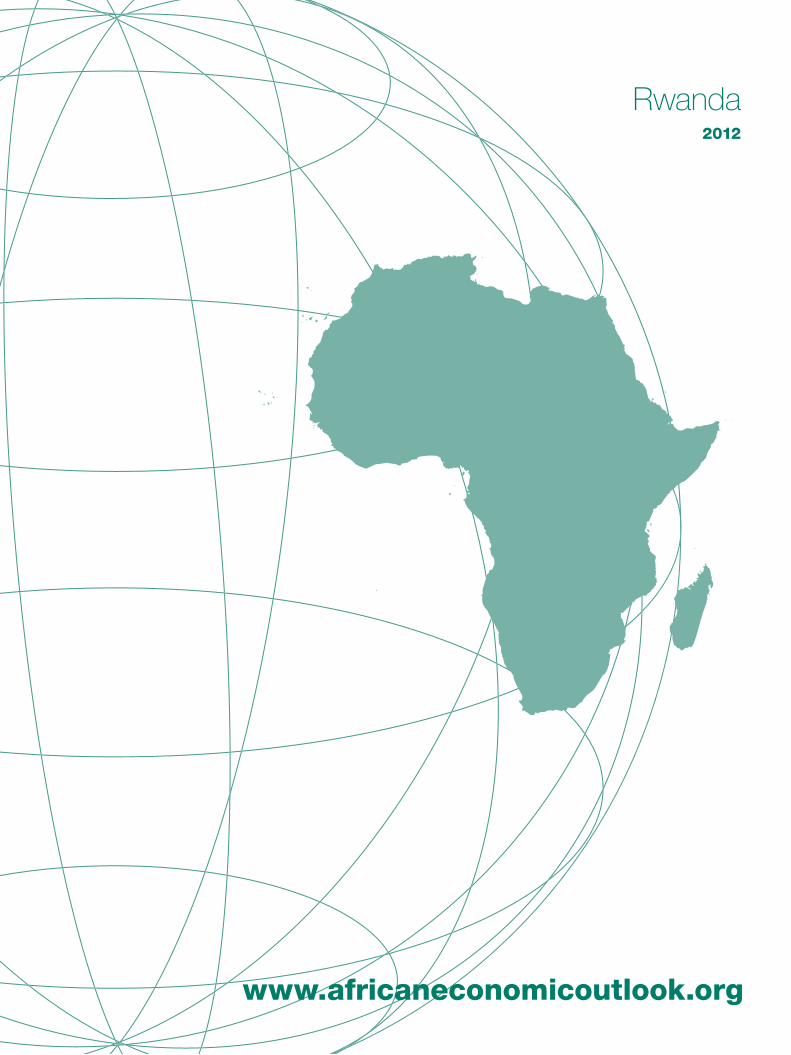
Figure 1: Real GDP growth (Eastern)
Figures for 2010 are estimates; for 2011 and later are projections.
Table 1: Macroeconomic Indicators
2010 2011 2012 2013
Real GDP growth 7.2 8.6 7.6 6.9
Real GDP per capita growth 4.2 5.7 4.6 3.9
CPI inflation 2.3 5.6 6 6.9
Budget balance % GDP -0.6 -2.2 -2.1 -1.4
Current account % GDP -7.5 -7.6 -11.3 -10.9
Figures for 2010 are estimates; for 2011 and later are projections.
Real GDP growth (%) Eastern Africa - Real GDP growth (%) Africa - Real GDP growth (%)
2003 2004 2005 2006 2007 2008 2009 2010 2011 2012 20130%
2.5%
5%
7.5%
10%
12.5%
Real
GDP
Gro
wth
(%)
African Economic Outlook 2012 3 | © AfDB, OECD, UNDP, UNECA
http://dx.doi.org10.1787/888932621198
Recent Developments & Prospects
Table 2: GDP by Sector (percentage of GDP)
2006 2011
Agriculture, forestry, fishing & hunting 41.5 34.9
Mining and quarrying 0.7 0.7
of which oil - -
Manufacturing - -
Electricity, gas and water 0.2 0.2
Construction 6.6 8.1
Wholesale and retail trade, hotels and restaurants 14.6 16.5
of which hotels and restaurants - -
Transport, storage and communication 7.3 8.5
Finance, real estate and business services 8.7 10.7
Financial intermediation, real estate services, business and other service activities - -
General government services - -
Public administration & defence; social security, education, health & social work - -
Public administration, education, health 5.5 5
Public administration, education, health & other social & personal services - -
Other community, social & personal service activities - -
Other services 7.7 8.2
Gross domestic product at basic prices / factor cost 100 100
Figures for 2010 are estimates; for 2011 and later are projections.
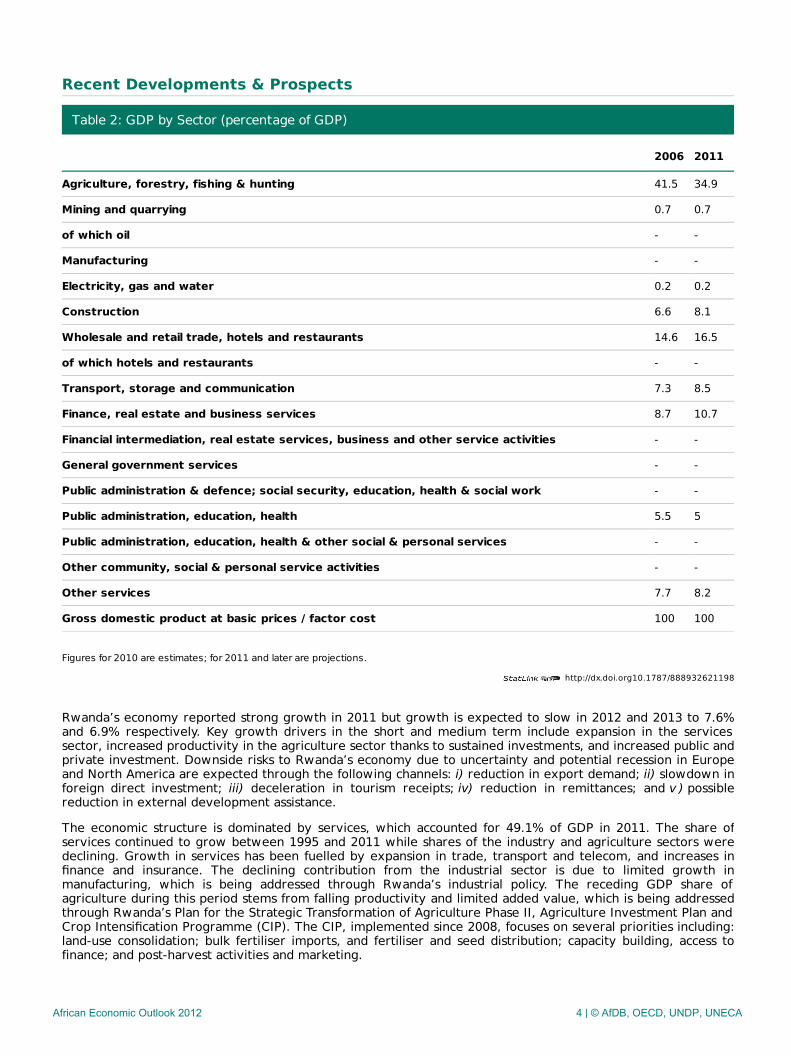
Rwanda’s economy reported strong growth in 2011 but growth is expected to slow in 2012 and 2013 to 7.6%and 6.9% respectively. Key growth drivers in the short and medium term include expansion in the servicessector, increased productivity in the agriculture sector thanks to sustained investments, and increased public andprivate investment. Downside risks to Rwanda’s economy due to uncertainty and potential recession in Europeand North America are expected through the following channels: i) reduction in export demand; ii) slowdown inforeign direct investment; iii) deceleration in tourism receipts; iv) reduction in remittances; and v ) possiblereduction in external development assistance.
The economic structure is dominated by services, which accounted for 49.1% of GDP in 2011. The share ofservices continued to grow between 1995 and 2011 while shares of the industry and agriculture sectors weredeclining. Growth in services has been fuelled by expansion in trade, transport and telecom, and increases infinance and insurance. The declining contribution from the industrial sector is due to limited growth inmanufacturing, which is being addressed through Rwanda’s industrial policy. The receding GDP share ofagriculture during this period stems from falling productivity and limited added value, which is being addressedthrough Rwanda’s Plan for the Strategic Transformation of Agriculture Phase II, Agriculture Investment Plan andCrop Intensification Programme (CIP). The CIP, implemented since 2008, focuses on several priorities including:land-use consolidation; bulk fertiliser imports, and fertiliser and seed distribution; capacity building, access tofinance; and post-harvest activities and marketing.
African Economic Outlook 2012 4 | © AfDB, OECD, UNDP, UNECA
Performance of the external sector was strong in 2011. Increased export earnings were driven by stable andrising prices for major exports such as coffee, tea and minerals, which together comprised 74.8% of exportearnings in 2011. Implementation of the mineral certification programme, which facilitated the export ofpreviously stocked minerals following the Dodd-Frank Act, strong informal cross-border exports and a recoveryin tourism also contributed to higher export earnings. Imports also increased, with rising imports of consumergoods (largely food products), intermediate goods (mainly construction materials and industrial products) andfuel. In 2011 versus 2010, exports of goods increased by 52.8% from USD 253.7 million (US dollars) to USD387.7 million. Imports increased by 17.3% to USD 1.63 billion in 2011 from USD 1.33 billion the previous year,deepening trade deficit to 16.6% of GDP, up from 14% in 2010. Tourism receipts increased to USD 251 millionin 2011, a 25.5% increase from 2010.
The current-account deficit including official transfers increased to 7.6% of GDP in 2011 up from 7.5% in 2010,but the overall balance of payments remained in surplus thanks to official and private inflows, which continuedto offset the deficit in the current account. The current-account deficit including official transfers is projected toincrease in 2012 and 2013, but the overall balance of payments is still expected to remain in surplus thanks toanticipated inflows to finance public and private investments. International reserves increased to an estimated7.7 months of imports, higher than the 7.0 months-of-import cover in 2010. Persistent trade deficits resultingfrom limited export diversification remain significant challenges in the medium term.
The medium-term outlook remains favourable with GDP growth projected to benefit from: strong capitalspending to finance the government’s Strategic Investment Programme; increased agriculture productivitythanks to increased investments in agricultural infrastructure and inputs (livestock infrastructure, fertilisers, andseeds); and a rebound in the services sector.
To address Rwanda’s infrastructure bottlenecks, the cabinet approved in 2010 a Strategic InvestmentProgramme (SIP) which prioritises six key investment projects aimed at expediting the realisation of the Vision2020 and Economic Development and Poverty Reduction Strategy (EDPRS) objectives. The SIP projects include:i) energy access rollout to increase household grid connections from 9% (84 MW) at end-2010 to 50%(1 000 MW) by 2017; ii) building core information and communications technology (ICT) infrastructure for high-speed broadband connectivity; iii) construction and rehabilitation of a regional railway linking Rwanda toBurundi and Tanzania; iv) construction of the Kigali Convention Centre; v) capitalisation of RwandAir; and vi)construction of Bugesera International Airport. Two key SIP projects – building core ICT infrastructure for high-speed broadband connectivity and the capitalisation of RwandAir – are nearing completion and are expected tocatalyse private-sector growth and further expansion in tourism.
Real GDP growth is projected to remain within the 6.9-7.6% band per year during the 2012–13 period, eventhough sustaining the growth trajectory is contingent upon securing financing for the government’s SIP, animproved external environment and a robust recovery in credit to the private sector.
African Economic Outlook 2012 5 | © AfDB, OECD, UNDP, UNECA
Macroeconomic Policy
Fiscal PolicyThe government’s fiscal policy in 2010/11 and 2011/12 was focused on achieving fiscal consolidation and on agradual withdrawal of the fiscal stimulus while still supporting expansion in economic activity. The fiscal-consolidation plan is anchored on reducing and prioritising public spending, eliminating domestic financing, andimplementing additional improvements in tax-administration efficiency and Public Financial Management (PFM)systems. Gambling taxes and royalty taxes on mining have also been introduced.
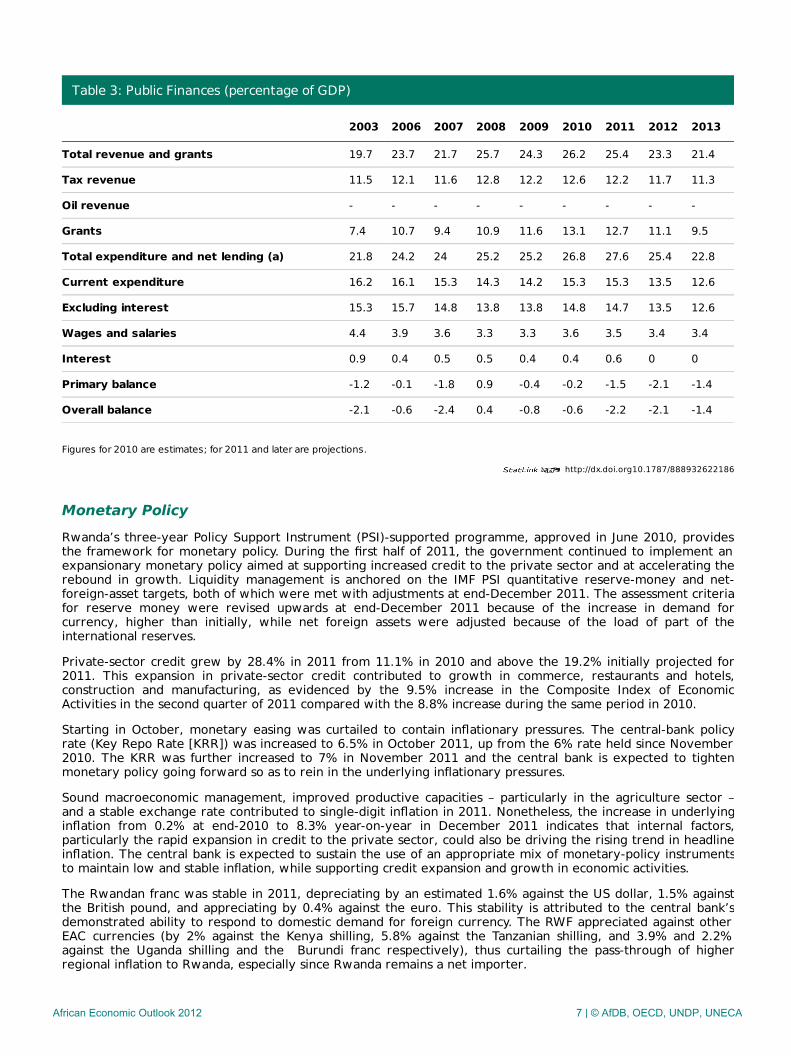
In line with the government’s major fiscal-policy objective of stimulating economic activity, capital expenditureas a share of GDP increased from 11.0% in 2009/10 to 11.5% in 2010/11 with recurrent expenditure increasingfrom 14.2% to 15.3% during this period. The increase in government revenues and grants between 2010 and2011 was insufficient to offset the increase in total expenditure and net lending, leading to deterioration in theoverall balance.
The government reduced taxes on fuel in July 2011 by RWF 50 (Rwandan francs) per litre and by an additionalRWF 50 in January 2012, representing a total fuel price reduction of about 10%, to mitigate the effects of risingfood and fuel prices on economic activity and the poor, as well as to align Rwanda’s fuel taxes with the rest ofthe East African Community (EAC) region. Tax-administration and tax-policy measures, including the adoption ofElectronic Tax Registers for value added tax (VAT) and the introduction of gambling and withholding taxes,were implemented to compensate for the anticipated revenue loss.
The structure of public spending is aligned with the EDPRS priority areas of economic infrastructure, productivecapacities and human development. The budget share for these sectors increased from 63.5% in 2009/10 to69.9% in 2010/11 and is projected to average 70% between 2011/12 and 2013/14. Expenditure and revenuemanagement has improved. A new chart of accounts consistent with the International Monetary Fund (IMF)’sGovernment Financial Statistics system was adopted in July 2011 and is aimed at improving the consolidation,coverage and recording of general government-sector transactions.
The tax structure is skewed towards taxes on goods and services (VAT, excise taxes and a fuel levy for the roadfund), which constituted 52% of total tax revenues in both 2009/10 and 2010/11, with VAT accounting for 58%of all taxes on goods and services. Tax revenues from individual and corporate income as well as property taxesare also significant and accounted for 39.1% of total tax revenues in 2010/11, though marginally less than 39.5%in 2009/10. Taxes on international trade accounted for 8.4% in 2010/11 largely as a result of Rwanda’s adoptionof the Common External Tariff. To reduce incentives for tax avoidance and tax planning, there is a singlestatutory corporate tax rate at 30%, which is also comparable to the maximum personal-income tax rate.
Measures such as the introduction in 2010/11 of electronic tax filing and payment, and the merger of social-security and income-tax files contributed to an increase in the tax-to-GDP ratio from 12.2% in 2009/10 to 12.6%in 2010/11. The Rwanda Revenue Authority commenced the audit, collection and enforcement of social-securitycontributions from employers in July 2010. This initiative, coupled with the automation of pension-fundcollection, is expected to contribute to reductions in income-tax evasion and to the widening of the tax base.
African Economic Outlook 2012 6 | © AfDB, OECD, UNDP, UNECA
http://dx.doi.org10.1787/888932622186
Table 3: Public Finances (percentage of GDP)
2003 2006 2007 2008 2009 2010 2011 2012 2013
Total revenue and grants 19.7 23.7 21.7 25.7 24.3 26.2 25.4 23.3 21.4
Tax revenue 11.5 12.1 11.6 12.8 12.2 12.6 12.2 11.7 11.3
Oil revenue - - - - - - - - -
Grants 7.4 10.7 9.4 10.9 11.6 13.1 12.7 11.1 9.5
Total expenditure and net lending (a) 21.8 24.2 24 25.2 25.2 26.8 27.6 25.4 22.8
Current expenditure 16.2 16.1 15.3 14.3 14.2 15.3 15.3 13.5 12.6
Excluding interest 15.3 15.7 14.8 13.8 13.8 14.8 14.7 13.5 12.6
Wages and salaries 4.4 3.9 3.6 3.3 3.3 3.6 3.5 3.4 3.4
Interest 0.9 0.4 0.5 0.5 0.4 0.4 0.6 0 0
Primary balance -1.2 -0.1 -1.8 0.9 -0.4 -0.2 -1.5 -2.1 -1.4
Overall balance -2.1 -0.6 -2.4 0.4 -0.8 -0.6 -2.2 -2.1 -1.4
Figures for 2010 are estimates; for 2011 and later are projections.
Monetary PolicyRwanda’s three-year Policy Support Instrument (PSI)-supported programme, approved in June 2010, providesthe framework for monetary policy. During the first half of 2011, the government continued to implement anexpansionary monetary policy aimed at supporting increased credit to the private sector and at accelerating therebound in growth. Liquidity management is anchored on the IMF PSI quantitative reserve-money and net-foreign-asset targets, both of which were met with adjustments at end-December 2011. The assessment criteriafor reserve money were revised upwards at end-December 2011 because of the increase in demand forcurrency, higher than initially, while net foreign assets were adjusted because of the load of part of theinternational reserves.
Private-sector credit grew by 28.4% in 2011 from 11.1% in 2010 and above the 19.2% initially projected for2011. This expansion in private-sector credit contributed to growth in commerce, restaurants and hotels,construction and manufacturing, as evidenced by the 9.5% increase in the Composite Index of EconomicActivities in the second quarter of 2011 compared with the 8.8% increase during the same period in 2010.
Starting in October, monetary easing was curtailed to contain inflationary pressures. The central-bank policyrate (Key Repo Rate [KRR]) was increased to 6.5% in October 2011, up from the 6% rate held since November2010. The KRR was further increased to 7% in November 2011 and the central bank is expected to tightenmonetary policy going forward so as to rein in the underlying inflationary pressures.
Sound macroeconomic management, improved productive capacities – particularly in the agriculture sector –and a stable exchange rate contributed to single-digit inflation in 2011. Nonetheless, the increase in underlyinginflation from 0.2% at end-2010 to 8.3% year-on-year in December 2011 indicates that internal factors,particularly the rapid expansion in credit to the private sector, could also be driving the rising trend in headlineinflation. The central bank is expected to sustain the use of an appropriate mix of monetary-policy instrumentsto maintain low and stable inflation, while supporting credit expansion and growth in economic activities.
The Rwandan franc was stable in 2011, depreciating by an estimated 1.6% against the US dollar, 1.5% againstthe British pound, and appreciating by 0.4% against the euro. This stability is attributed to the central bank’sdemonstrated ability to respond to domestic demand for foreign currency. The RWF appreciated against otherEAC currencies (by 2% against the Kenya shilling, 5.8% against the Tanzanian shilling, and 3.9% and 2.2%against the Uganda shilling and the Burundi franc respectively), thus curtailing the pass-through of higherregional inflation to Rwanda, especially since Rwanda remains a net importer.
African Economic Outlook 2012 7 | © AfDB, OECD, UNDP, UNECA
http://dx.doi.org10.1787/888932623174
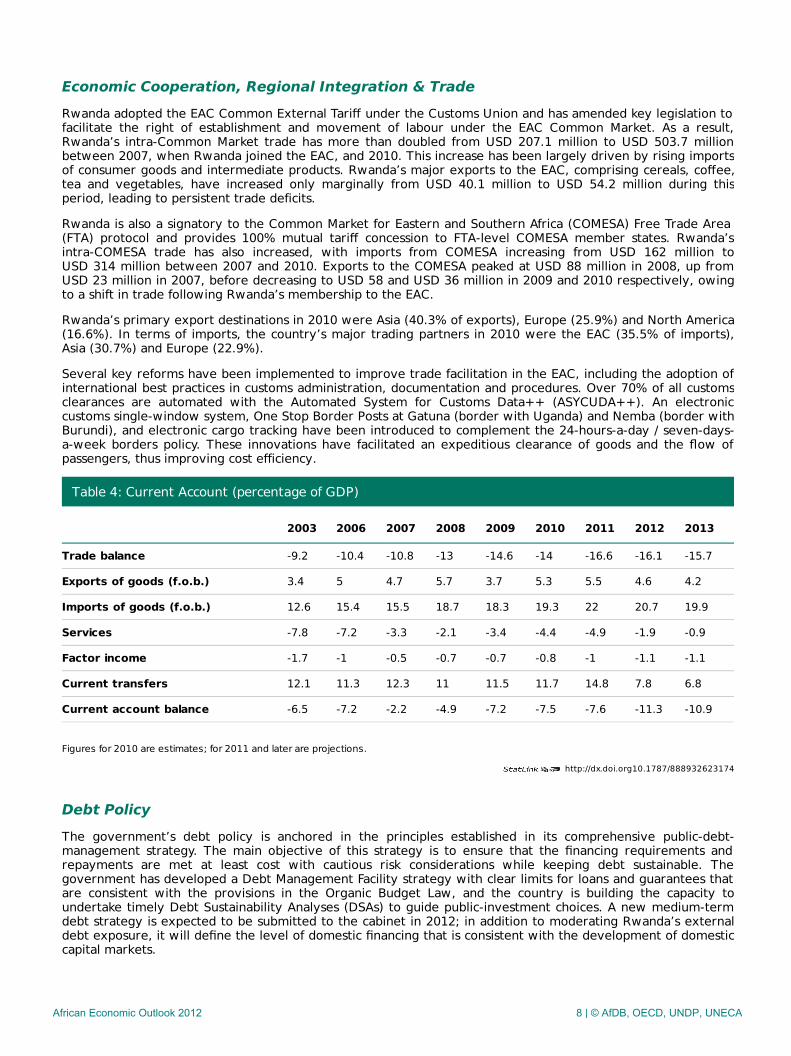
Economic Cooperation, Regional Integration & TradeRwanda adopted the EAC Common External Tariff under the Customs Union and has amended key legislation tofacilitate the right of establishment and movement of labour under the EAC Common Market. As a result,Rwanda’s intra-Common Market trade has more than doubled from USD 207.1 million to USD 503.7 millionbetween 2007, when Rwanda joined the EAC, and 2010. This increase has been largely driven by rising importsof consumer goods and intermediate products. Rwanda’s major exports to the EAC, comprising cereals, coffee,tea and vegetables, have increased only marginally from USD 40.1 million to USD 54.2 million during thisperiod, leading to persistent trade deficits.
Rwanda is also a signatory to the Common Market for Eastern and Southern Africa (COMESA) Free Trade Area(FTA) protocol and provides 100% mutual tariff concession to FTA-level COMESA member states. Rwanda’sintra-COMESA trade has also increased, with imports from COMESA increasing from USD 162 million toUSD 314 million between 2007 and 2010. Exports to the COMESA peaked at USD 88 million in 2008, up fromUSD 23 million in 2007, before decreasing to USD 58 and USD 36 million in 2009 and 2010 respectively, owingto a shift in trade following Rwanda’s membership to the EAC.
Rwanda’s primary export destinations in 2010 were Asia (40.3% of exports), Europe (25.9%) and North America(16.6%). In terms of imports, the country’s major trading partners in 2010 were the EAC (35.5% of imports),Asia (30.7%) and Europe (22.9%).
Several key reforms have been implemented to improve trade facilitation in the EAC, including the adoption ofinternational best practices in customs administration, documentation and procedures. Over 70% of all customsclearances are automated with the Automated System for Customs Data++ (ASYCUDA++). An electroniccustoms single-window system, One Stop Border Posts at Gatuna (border with Uganda) and Nemba (border withBurundi), and electronic cargo tracking have been introduced to complement the 24-hours-a-day / seven-days-a-week borders policy. These innovations have facilitated an expeditious clearance of goods and the flow ofpassengers, thus improving cost efficiency.
Table 4: Current Account (percentage of GDP)
2003 2006 2007 2008 2009 2010 2011 2012 2013
Trade balance -9.2 -10.4 -10.8 -13 -14.6 -14 -16.6 -16.1 -15.7
Exports of goods (f.o.b.) 3.4 5 4.7 5.7 3.7 5.3 5.5 4.6 4.2
Imports of goods (f.o.b.) 12.6 15.4 15.5 18.7 18.3 19.3 22 20.7 19.9
Services -7.8 -7.2 -3.3 -2.1 -3.4 -4.4 -4.9 -1.9 -0.9
Factor income -1.7 -1 -0.5 -0.7 -0.7 -0.8 -1 -1.1 -1.1
Current transfers 12.1 11.3 12.3 11 11.5 11.7 14.8 7.8 6.8
Current account balance -6.5 -7.2 -2.2 -4.9 -7.2 -7.5 -7.6 -11.3 -10.9
Figures for 2010 are estimates; for 2011 and later are projections.
Debt PolicyThe government’s debt policy is anchored in the principles established in its comprehensive public-debt-management strategy. The main objective of this strategy is to ensure that the financing requirements andrepayments are met at least cost with cautious risk considerations while keeping debt sustainable. Thegovernment has developed a Debt Management Facility strategy with clear limits for loans and guarantees thatare consistent with the provisions in the Organic Budget Law, and the country is building the capacity toundertake timely Debt Sustainability Analyses (DSAs) to guide public-investment choices. A new medium-termdebt strategy is expected to be submitted to the cabinet in 2012; in addition to moderating Rwanda’s externaldebt exposure, it will define the level of domestic financing that is consistent with the development of domesticcapital markets.
African Economic Outlook 2012 8 | © AfDB, OECD, UNDP, UNECA
http://dx.doi.org10.1787/888932619222
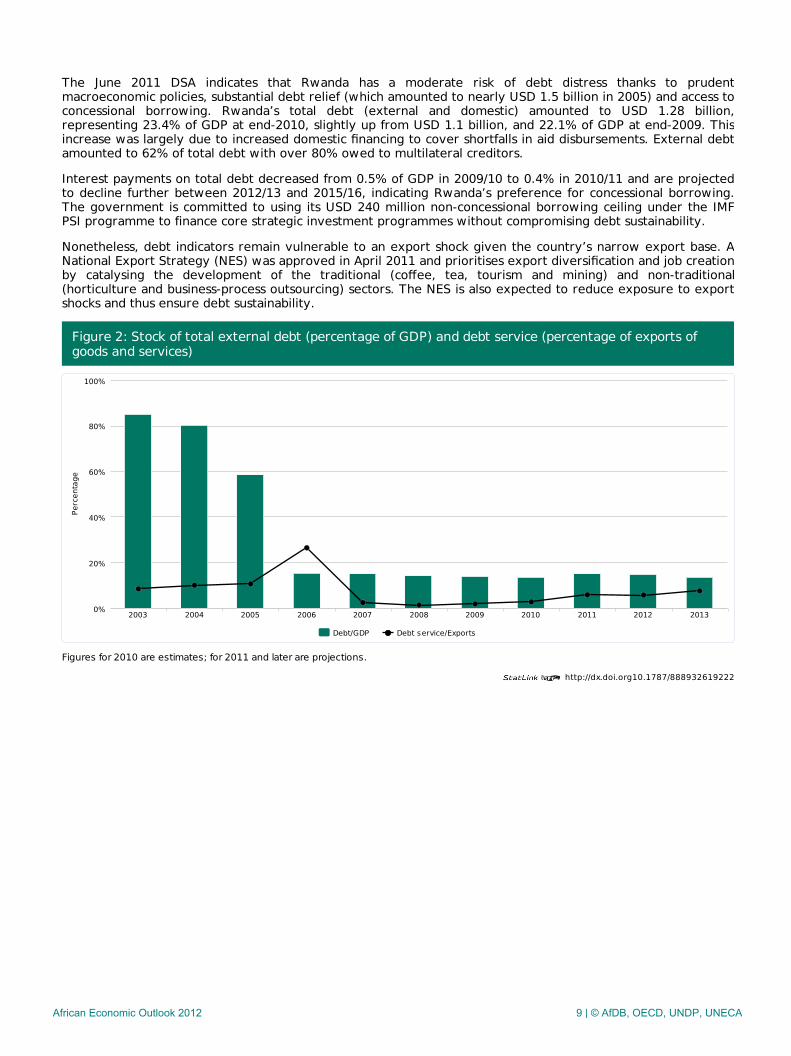
The June 2011 DSA indicates that Rwanda has a moderate risk of debt distress thanks to prudentmacroeconomic policies, substantial debt relief (which amounted to nearly USD 1.5 billion in 2005) and access toconcessional borrowing. Rwanda’s total debt (external and domestic) amounted to USD 1.28 billion,representing 23.4% of GDP at end-2010, slightly up from USD 1.1 billion, and 22.1% of GDP at end-2009. Thisincrease was largely due to increased domestic financing to cover shortfalls in aid disbursements. External debtamounted to 62% of total debt with over 80% owed to multilateral creditors.
Interest payments on total debt decreased from 0.5% of GDP in 2009/10 to 0.4% in 2010/11 and are projectedto decline further between 2012/13 and 2015/16, indicating Rwanda’s preference for concessional borrowing.The government is committed to using its USD 240 million non-concessional borrowing ceiling under the IMFPSI programme to finance core strategic investment programmes without compromising debt sustainability.
Nonetheless, debt indicators remain vulnerable to an export shock given the country’s narrow export base. ANational Export Strategy (NES) was approved in April 2011 and prioritises export diversification and job creationby catalysing the development of the traditional (coffee, tea, tourism and mining) and non-traditional(horticulture and business-process outsourcing) sectors. The NES is also expected to reduce exposure to exportshocks and thus ensure debt sustainability.
Figure 2: Stock of total external debt (percentage of GDP) and debt service (percentage of exports ofgoods and services)
Figures for 2010 are estimates; for 2011 and later are projections.
Debt/GDP Debt service/Exports
2003 2004 2005 2006 2007 2008 2009 2010 2011 2012 20130%
20%
40%
60%
80%
100%
Perc
enta
ge
African Economic Outlook 2012 9 | © AfDB, OECD, UNDP, UNECA
Economic & Political Governance
Private SectorAccording to the June 2011 Rwanda Establishments Census, 90.8% of Rwanda’s workforce is employed in theprivate sector. Over 123 000 small and medium-sized enterprises (SMEs) operate in the private sector,accounting for 98% of all businesses and 84% of private-sector employment. However, 88% of these SMEs areinformal and, as such, their contribution to tax revenues remains very minimal (less than 2% in 2009/10).Transport and energy bottlenecks, as well as deficiencies in core business competencies such as businessplanning and management, particularly for SMEs, are key impediments to private-sector development. Severalcomplementary policies and strategies have been formulated to bolster private-sector development, includingthe trade policy, the industrial policy and the SME policy.
Rwanda has registered marked improvements in the regulatory environment for business and in the past fiveyears has been commended as a lead reformer in East Africa, third in sub-Saharan Africa and second topconsistent reformer overall. Rwanda ranks 45 out of 183 countries surveyed in 2011 by the Doing BusinessReport 2012, up from 50 in the 2011 report. Improvements were reported in 5 of the 10 business-regulationareas measured, notably in getting credit and paying taxes, with also some improvement in starting a business,getting electricity and trading across borders. Rwanda ranks very poorly, however, in terms of resolvinginsolvency.
Rwanda’s overall ranking in the Global Competitiveness Report 2011-12 improved 10 places to 70 out of 142countries and third in sub-Saharan Africa. Strong and well-functioning institutions and efficient labour marketswere cited among the chief drivers of Rwanda’s superior ranking of 8 out of 142 countries surveyed comparedwith 9th in 2010-2011. However, the ranking for core sub-indicators such as flexibility in wage determination,hiring and firing practices, pay and productivity, and rigidity in employment only showed negligibleimprovement or stagnated.
Financial SectorThe financial sector remains highly concentrated even though competition is increasing owing to the entry offoreign-owned banking institutions and expansion in both domestic and foreign banks. The branch network hasexpanded rapidly to a total of 136 branches and 254 sub-branches or counters by December 2011, up from 105branches and 102 sub-branches in 2009. The foreign share of assets increased from 40% in 2004 to 49% in 2010while the government’s stake increased from 22% to 30% during this period, also the highest in the EAC.
The banking system is stable and sound but financial depth remains low. Banking assets doubled toRWF 1.1 billion (USD 1.8 million) between 2006 and 2011 and non-performing loans decreased from 25.5% ofgross loans in 2006 to 10.8% and 8% in December 2010 and 2011 respectively. The ratio of core capital to risk-weighted assets, a measure of capital adequacy, has increased from 13% in 2006 to 24.4% and 27.2% inDecember 2010 and 2011 respectively, and above the regulatory capital of 15%. Expansionary monetary policyhas contributed to increased liquidity in the financial sector, thus facilitating growth in credit to the privatesector, which increased by 28.4% in 2011, above the projected 19.2%. At 31 January 2012, the government hadfully licensed 220 of the 416 Umurenge (district-level) Savings and Credit Co‑operatives (SACCOs) while 196SACCOS were partially licensed to grant loans to expand access to banking services beyond the current 20% ofthe population. The central bank is expanding its bank-supervision capacity so as to provide adequate oversightto the SACCOs.
Legislation regulating capital markets in Rwanda and establishing the Capital Markets Authority were gazetted inMarch and June 2011 respectively. These regulatory and institutional developments have catalysed renewedinterest in the securities market as evidenced by the 276% over-subscription of the Bank of Kigali’s Initial PublicOffering in July 2011.
There is potential for improving the mobilisation of longer-term financing, but this will require judiciousmatching of the financing, funding and investment needs of various sectors. For instance, while bankinginstitutions are exposed to risks posed by the large maturity gap between their assets and liabilities, theinsurance and pension sector, particularly the Rwanda Social Security Board, has indicated increasing interest ininvesting in longer-term financial assets. Consequently, the channelling of such long-term financing into thebanking sub-sector remains a major priority.
Public Sector Management, Institutions & ReformThe 2012 Doing Business report indicates that there is still room for improvement in terms of protection andenforcement of contract rights. For instance, Rwanda’s ranking on registering property deteriorated markedlyfrom 41 out of 183 countries surveyed in 2010 to 61 out of 183 in 2011.
African Economic Outlook 2012 10 | © AfDB, OECD, UNDP, UNECA
Rwanda’s 2010 Investor Perception Survey, which rates investor perceptions on core issues that impede orfacilitate improvements in investment climate, showed an increase in the composite Investor Perception Indexfrom 60.17 in 2009 to 71.04 in 2010. The legal framework sub-index improved from 64.47 to 69.37 during thisperiod while the governance sub-index improved from 76.85 to 85.47 thanks to improved investor confidencein the political and legal systems.
The 2010 Public Expenditure and Financial Accountability (PEFA) reported improvements in several indicatorssince the last PEFA in 2008, including compliance with international best practices in budget credibility,transparency and comprehensiveness. The May 2011 mid-term evaluation of the government’s PFM reformstrategy also showed some improvement, ranking reform progress as moderately satisfactory. Weaknesseswere however noted in budget-control mechanisms, internal audit, and quality and timeliness of financialstatements and reports. Limited PFM capacity, due to insufficient qualified personnel such as accountants andprocurement officers, was identified as a major contributor to these PFM weaknesses.
An Integrated Personnel and Payroll System (IPPS) has been implemented since 2009 and is currently beingrolled out to central-government agencies and districts. Moreover, the integration of the IPPS with other public-sector management information systems is in its initial stages. The 2010 PEFA assessment reported animprovement in Rwanda’s score on the effectiveness of payroll controls to a B+ compared with the D+achieved in 2007.
The World Bank Worldwide Governance Indicators confirm that Rwanda has made significant progress in areassuch as government effectiveness, regulatory quality and control of corruption. Transparency Internationalranked Rwanda 49 out of 183 countries surveyed in 2011 in terms of corruption, an improvement from 66 outof 178 countries surveyed in 2010. A robust anti-corruption law and a strong anti-corruption agency, whichscore 100% and 81% on the 2009 Global Integrity scorecard respectively, are among the key drivers of theseimprovements, but the same Global Integrity report shows a “large” (20%) gap between the country’s legalframework and its actual implementation.
The audit report for the year ended in June 2010 indicated that the audit coverage has improved from 50% in2009 to 70% in 2010 showing satisfactory progress for an emerging PFM system. Nonetheless, the audit reportreveals several challenges, including a high incidence of repeater weaknesses at 47% of all challenges identified,weak internal audit capacity and weaknesses in local-government financial management systems.
Natural Resource Management & EnvironmentRwanda integrated environmental targets into the EDPRS and subsequently adopted an Environment andNatural Resources Sector Plan (2009-2013) – “Towards a Green, Clean, Healthy and Wealthy Rwanda” – toguide the sustainable management of environmental and natural resources. Key outputs from this plan includerehabilitating wetlands and ecosystems in the Nyabarongo-Akagera river network and mainstreamingenvironment and climate change in planning and budgeting processes for key sectors such as agriculture,infrastructure and manufacturing. In addition, the land area protected to maintain biodiversity increased from9.2% in 2009/10 to 10.13% in 2010/11, while national forest cover increased from 21.4% to 22.4% during thisperiod.
In October 2011, the cabinet approved the National Strategy on Climate Change and Low Carbon Development,which is expected to guide the pursuit of carbon-friendly infrastructure-development strategies, in particular theuse of renewable energy sources. The strategy will also complement ongoing reforestation efforts andprogrammes aimed at reducing dependence on wood for fuel.
Nonetheless, Rwanda’s Environmental Performance Index ranking deteriorated slightly from 131st in 2008 to135th out of 163 countries surveyed in 2010. More funding and expertise in standards development arerequired to facilitate the implementation of key interventions such as the Integrated Water ResourcesManagement programme.
Political ContextRwanda’s political-governance reforms during the decade ending in 2010 have been driven by the need tofoster national reconciliation and to empower local communities to participate in political and developmentprocesses, through decentralisation in particular. For instance, the country’s 2003 constitution’s power-sharingprovisions require that the president, prime minister and speaker of the senate come from different politicalparties.
Several reforms to improve political stability, civil liberties and political rights have been developed andimplemented in the course of the past decade. For instance, instruments have been designed to assessperformance and inform improvements in various aspects of political rights and civil liberties. These include the
African Economic Outlook 2012 11 | © AfDB, OECD, UNDP, UNECA
Community Score Card & Citizen Report Card, Joint Governance Assessment, Governance Perception Analysis,the Justice, Reconciliation, Law and Order Sector Strategy, and the Justice Sector User Perception andVictimisation Study. Rwanda’s ratification in 2010 of the African Charter on Democracy, Elections andGovernance, and bills to govern the activities of religious communities and the functioning and powers of thenational police are expected to support further improvements in Rwanda’s civil liberties.
African Economic Outlook 2012 12 | © AfDB, OECD, UNDP, UNECA
Social Context & Human Development
Building Human ResourcesThe government has continued to prioritise health-sector spending with the share of public expenditure onhealth (including donor support) increasing from 10.2% in 2009/10 to 16.1% in 2010/11. This has resulted inseveral improvements in health-sector outcomes including a reduction in the infant mortality rate from 62 perthousand live births in 2008 to 50 in 2010. Under-five mortality declined from 103 per 1 000 live births in 2008to 76 per 1 000 in 2010. Maternal mortality also decreased from 750 per 100 000 live births in 2005 to 540 per100 000 live births in 2010, but still short of the Millennium Development Goal (MDG) target of 325 per 100 000live births. Community-integrated management of childhood illnesses, an approach developed by the WorldHealth Organization to provide holistic child health care, is now being implemented in all villages and hasgreatly contributed to a reduction in infant mortality.
The Community-Based Health Insurance (CHBI) scheme, introduced in 1999, has contributed to increased accessto health services. CHBI coverage has increased from 35% of the population in 2006 to 89% in 2010/11, 1percentage point short of the target for 2010/11.
Key education indicators, including school completion rates and education quality, have improved. The primary-school completion rate increased from 76% in 2009/10 to 79% in 2010/11 with the completion rate for girlsincreasing from 81% to 82% during this period. The qualified teacher-to-pupil ratio at the primary-school levelimproved to 58:1 in 2010/11 from 63:1 the previous fiscal year.
The free nine-year basic-education programme has contributed to an increase in the gross enrolment rate forsecondary education from 20.7% in 2008 to 31.5% in 2010, with the share of higher education students inscience and technology increasing from 21% to 41.4% during the same period. The free 12-year basic-educationprogramme will be implemented starting in 2012/13 to accommodate the increasing number of studentsgraduating from lower secondary levels. About 25% of students eligible for tertiary education are offered agovernment scholarship, and student loans are also provided to poor students who do not qualify forgovernment scholarships. The average annual tuition costs for secondary and tertiary education areRWF 111 916 (USD 187) and RWF 1 059 559 (USD 1 765) respectively. The increase in the number ofvocational training centres from 61 in 2010 to 98 in 2011 has allowed a 50% increase in student enrolment to11 315 students in 2011, 39% of whom are female. More needs to be done, however, to ensure that theTechnical and Vocational Education and Training (TVET) curriculum is aligned with job-market demands.
The 2010 Demographic Health Survey indicates that awareness about the various modes of HIV/AIDStransmission is high, with 91% of women and 92% of men aged between 15 and 49 reporting that they havebeen made aware of HIV/AIDS prevention. Significant achievements have also been made in the treatment ofHIV/AIDS. For instance, 83% of all health facilities currently provide Voluntary Counselling and Testing /Prevention of Mother to Child Transmission (VCT/PMTCT) services allowing 98% of all pregnant women accessto PMTCT services. Moreover, 87% of all HIV-infected children under the age of 15 were receivingantiretroviral treatment by June 2011. Malaria morbidity has declined from 11% in 2009/10 to 3.4% in 2010/11thanks to the government’s strategy of universal distribution of insecticide-treated bed nets and increasedaccess to anti-malarial treatment.
Poverty Reduction, Social Protection & LabourThe 2010/11 household living conditions survey (EICV 3 – Enquête Intégrale sur les Conditions de Vie 3) dataindicate that the proportion of the population below the poverty line has declined to 44.9% from 56.7% in2005/06 but is still short of the 30% MDG target. Income inequality as measured by the Gini coefficientdeteriorated slightly from 0.53 in 2006 to 0.58 in 2011. Poverty rates remain lowest in Kigali city and high inrural areas. Several factors have contributed to this reduction in poverty, including a renewed policy focus onpoverty reduction under the EDPRS, more remunerating non-farm employment opportunities, and increasedagricultural production and commercialisation.
The EDPRS explicitly identifies clear interventions to improve the productive capacities of the poor, notably bypromoting co-operatives and SME development. The budget share allocated to improving productive capacities,including in the agriculture sector, increased from 10% in 2009/10 to 14% in 2010/11, while the budget sharefor human development and social sectors remained unchanged at 31% during this period. The UmurengeSACCO initiative has also been designed both as a tool for improving access to credit and as a strategic initialstep to increase economic inclusion for the poor, women and youth.
EDPRS priorities are contextualised via three flagship programmes: Sustainable Growth for Jobs and Exports;Vision 2020 Umurenge (VUP); and Governance. The flagship programmes serve as a vehicle for prioritising thegovernment’s actions so as to sustain progress towards the MDGs and Rwanda Vision 2020. The second EDPRS
African Economic Outlook 2012 13 | © AfDB, OECD, UNDP, UNECA
flagship programme, VUP, emphasises shared growth and the creation of opportunities for the poorest and mostvulnerable Rwandans through public-works programmes, credit packages for co-operatives and SMEs, and socialservices and assistance to landless families.
The percentage of eligible households granted direct support under the VUP remained at 100% in both 2009/10and 2010/11 while the percentage of eligible households benefiting from public-works programmes increasedfrom 91% to 100%. The number of vulnerable households accessing credit and savings facilities increased from55 675 to 58 218 during the same period. These achievements have contributed to a reduction in extremepoverty from 35.8% in 2005/06 to 24.1% in 2010/11.
A new labour law was ratified in May 2009 and contains provisions to ensure the protection of basic labourstandards while enhancing flexibility in hiring and firing of workers. These legislative enhancements havecontributed to an improvement in Rwanda’s Global Competitiveness Index ranking on labour-market efficiencyfrom 9th out of 139 countries surveyed in 2010 to 8th out of 140 countries in 2011.
Gender EqualitySuccessful implementation of key policies and strategies such as the Girls’ Education Policy, the National GenderPolicy and the Girls’ Education Strategic Plan (2008-12) have improved girls’ enrolment, retention andcompletion, particularly in science fields at secondary and tertiary levels of education. As a result, Rwanda hasachieved the MDG target on parity between boys and girls in primary education with a net primary-schoolenrolment rate in 2010 slightly higher for girls (95.8%) than for boys (94.7%). Moreover, 52.7% of all studentsin private universities are women. A gender action plan is being mainstreamed into existing TVET plans andstructures.
The EDPRS includes gender as a cross-cutting theme in all sectors and clear interventions and indicators havebeen developed to ensure gender-responsive monitoring and accountability as well as budget allocations at bothcentral and local government levels. More needs to be done, however, to address the longstanding inequalitiesin economic participation. For instance, fewer than 30% of all registered entrepreneurs are female whilefemale-headed households accounted for 47% of the poor in 2010/11.
In response to these inequalities, several programmes aimed at poverty reduction with particular emphasis onwomen have been implemented both by the government and other stakeholders. These include training andcapacity building in entrepreneurship for women by the co-operative movement and the “Ubudehe” and HIMO(Haute Intensité de Mains d’Oeuvres) programme, which promote job creation through rural infrastructuredevelopment.
Rwanda’s constitution espouses strong women’s representation in decision making, in particular a 30% minimumrepresentation in policy making and public-sector management. This has contributed to an increase in thenumber of parliamentary seats held by women from 17% in 1994 to 56% in 2010, making Rwanda the firstcountry in the world to have a majority of women in parliament. Moreover, demographic health surveys andgender profiles are conducted periodically to inform evidence-based policy making for enhanced genderequality.
African Economic Outlook 2012 14 | © AfDB, OECD, UNDP, UNECA
Thematic analysis: Promoting Youth Employment
The National Employment Policy (NEP) was adopted in 2007 and, subsequently, a five-year action plan (2007-11) was developed for youth employment promotion in Rwanda, where “youth” refers to the 16-35 age cohort,with age 16 being the minimum working age, unlike other international definitions that define the youth cohortas the 15-24-year age group. The five-year youth action plan comprises several programmes such as those forcareer-education advisory services, youth employment and entrepreneurship services, services in access to job-market information and internships.
The Career Education Advisory Services centres, designed to promote youth employment through thedevelopment of employability skills for private-sector growth, were launched in 2009 by the RwandaDevelopment Board in collaboration with tertiary education institutions. These centres assist students to makeinformed choices on their field of study, link students to prospective employers and develop students’ job-seeking and interview skills. The Rwanda Youth Internship Programme is intended to ease the transitionbetween school and the workforce by supporting the placement of interns in public and private institutions forperiods not exceeding six months. This programme is currently targeting university graduates but plans areunderway to extend its coverage to other Rwandan youth, in particular through the business developmentcentres.
Business development centres have been developed in each district to support business and job creation forRwandans, including youth. These centres promote and nurture entrepreneurship by offering entrepreneurialtraining in core business competencies and other services necessary to support successful business growth. Anyeconomic operator is eligible for these services although SMEs are prioritised.
There is no systematic interlinkage, however, between these various initiatives designed to promote youthemployment and employability, and their coverage remains limited. The Ministry of Public Service and Labour iscurrently conducting an evaluation of the National Employment Policy to identify key achievements andshortfalls so as to inform further policy and strategic reforms. Inclusion of youth in economic activities thereforeremains a major impediment to achieving inclusive growth. Over 42% of youth are either unemployed orunderemployed in subsistence agriculture, and urgent measures are required to redress youth unemploymentholistically through skills development and job creation. Strong policy frameworks for skills development and jobcreation for both urban and rural areas, and also accommodating gender specificities, are already in place.These include, among others, the Education Sector Strategic Plan (2008-12; 2010-2015), ICT Policy; the RwandaLabour Policy (2009), the Non-Formal Education Policy (2005), the TVET Policy (2008), the NationalIndustrialisation Policy, the National Export Policy, the National Agriculture Policy and the Action Plan forWomen Employment (2007-11). Effective implementation remains critical, however. In addition, measures needto be taken to generate data and other information on education levels, skills-mix and mismatch as well as otherimpediments to youth employment and employability, in order to design effective policy responses.
The National Employment Policy reports that at least 70% of job seekers are not qualified for the kinds of jobsthey seek or the standards demanded by employers. Data from the National Higher Education Council revealthat the majority of 2010 university graduates (12 717) are in natural sciences (29%) and humanities and arts(26%) with only 9% in engineering and ICT respectively. The National Skills Audit conducted in 2009 reports anaverage 40% skills deficit and severe skills gaps in some categories such as technicians, with current demandexceeding supply by 60% across the public, private and not-for-profit sectors. Thus, a reform of the educationsystem to develop human resources that are consistent with the country’s labour-market requirements remainsa key priority.
The causes of youth unemployment in Rwanda can be found in both the supply side and the demand side. Onthe supply side, skills mismatch is identified by the 2009 National Skills Audit as a major contributor to youthunemployment.
The priority of the Education Sector Strategic Plan 2010-15 is the development of a post-basic education systemthat is better suited to meet labour-market needs, in part by the development of curricula in collaboration withsector ministries and the private sector. A 2011 survey of employers by the Private Sector Federation focusedon five sectors – hospitality and tourism, construction, ICT, automotive and agro-processing – indicates,however, that employers do not feel sufficiently involved in the design of TVET programmes. The surveyedemployers recommended a comprehensive industry-driven training system that is also flexible and genderresponsive. The government has taken measures to reform the current TVET system by establishing, amongothers, Integrated Polytechnic Regional Centres to improve the quality and relevance of TVET education, andthe Workforce Development Authority, which performs a regulatory role and is responsible for the managementof TVET qualifications framework, national occupational standards, national TVET examination and certification,labour-market information system and business incubation.
In spite of the marked improvements in labour-market efficiency, the number of jobs created in Rwanda
African Economic Outlook 2012 15 | © AfDB, OECD, UNDP, UNECA

annually, estimated at 74 000, has not expanded in tandem with the number of job seekers joining the labourmarket each year (approximately 200 000). This explains the high youth unemployment rates. The EICV 3reports that 370 000 waged jobs were created in the non-farm sector between 2005/06 and 2010/11. Limitedvalue addition in the agriculture sector and the inability of the private sector to respond to the improvedinvestment climate by creating remunerating activities outside the agriculture sector are key factors thatperpetuate high unemployment, especially among youth.
African Economic Outlook 2012 16 | © AfDB, OECD, UNDP, UNECA