Embed Size (px)
Citation preview

Human Cancer Biology
MAGE-A Inhibits Apoptosis in Proliferating Myeloma Cells throughRepression of Bax and Maintenance of Survivin
Tricia Nardiello1, Achim A. Jungbluth2, Anna Mei1, Maurizio DiLiberto3, Xiangao Huang3, Ania Dabrowski1,Val�eria C.C. Andrade1, Rebecca Wasserstrum1, Scott Ely3, Ruben Niesvizky4, Roger Pearse4, Morton Coleman4,David S. Jayabalan3, Nina Bhardwaj1, Lloyd J. Old2, Selina Chen-Kiang3, and Hearn Jay Cho1
AbstractPurpose: The type I Melanoma Antigen GEnes (MAGEs) are commonly expressed in cancers, fueling
speculation that theymay be therapeutic targets with oncogenic potential. They form complexes with RING
domain proteins that have E3 ubiquitin ligase activity and promote p53 degradation. MAGE-A3 was
detected in tumor specimens from patients with multiple myeloma and its expression correlated with
higher frequencies of Ki-67þmalignant cells. In this report, we examine the mechanistic role of MAGE-A in
promoting survival of proliferating multiple myeloma cells.
Experimental Design: The impact of MAGE-A3 expression on survival and proliferation in vivo was
examined by immunohistochemical analysis in an independent set of tumor specimens segregated into
two groups: newly diagnosed, untreated patients and patients who had relapsed after chemotherapy. The
mechanisms of MAGE-A3 activity were investigated in vitro by silencing its expression by short hairpin RNA
interference in myeloma cell lines and primary cells and assessing the resultant effects on proliferation and
apoptosis.
Results:MAGE-A3 was detected in a significantly higher percentage of relapsed patients compared with
newly diagnosed, establishing a novel correlation with progression of disease. Silencing of MAGE-A
showed that it was dispensable for cell cycling, but was required for survival of proliferating myeloma cells.
Loss of MAGE-A led to apoptosis mediated by p53-dependent activation of proapoptotic Bax expression
and by reduction of survivin expression through both p53-dependent and -independent mechanisms.
Conclusions: These data support a role for MAGE-A in the pathogenesis and progression of multiple
myeloma by inhibiting apoptosis in proliferating myeloma cells through two novel mechanisms. Clin
Cancer Res; 17(13); 4309–19. �2011 AACR.
Introduction
The type IMelanoma AntigenGEnes (MAGE-A, B, andC)belong to the cancer-testis antigen (CTAg) group of tumor-associated genes. CTAg are expressed in a broad range ofhuman cancers, but their normal expression is restricted toimmunologically "privileged" tissues, including develop-ing germ cells and trophoblastic tissue such as placenta (1).For these reasons, CTAg have been investigated as targetsfor therapeutic tumor vaccines (2). Their widespread
expression in cancer also suggests that CTAg may haveoncogenic activity and may be a novel class of therapeutictargets amenable to pharmacologic intervention. We pre-viously reported that MAGE-A3 and CT7 (MAGE-C1) weredetected in more than 70% of tumor specimens frompatients with stage III (Durie-Salmon staging) multiplemyeloma (MM; ref. 3), an incurable malignancy of plasmacells that is the second most common hematologic cancer(4). The patients in this study were a heterogeneous group,including newly diagnosed, relapsed, and refractory cases.Expression of these type I MAGEs correlated with higherfrequencies of Ki-67þ cells, a marker for proliferating cells,and with advanced stage of disease. The exceptionally highfrequencies of expression and clinical correlations sug-gested that type I MAGEs play a role in the pathogenesisor progression of MM by promoting survival of proliferat-ing cells.
Emerging data support the concept that type I MAGEspromote tumor cell survival. Type I MAGEs were shown tointeract with the tumor suppressor p53 in sarcoma andnon–small cell lung cancer cell lines, inhibiting p53 trans-activation activity and conferring resistance to etoposide-induced apoptosis (5). In this setting, MAGE-A2 did not
Authors' Affiliations: 1New York University Cancer Institute, New YorkUniversity School of Medicine; 2The Ludwig Institute for Cancer Research,New York Branch; and Departments of 3Pathology and Laboratory Med-icine and 4Medicine, Division of Hematology and Medical Oncology, WeillMedical College of Cornell University, New York, New York
Note: Supplementary data for this article are available at Clinical CancerResearch Online (http://clincancerres.aacrjournals.org/).
Corresponding Author: Hearn Jay Cho, NYU Cancer Institute, Smilow1304, 522 First Avenue, New York, NY 10016. Phone: 212-263-9274; Fax:212-263-9350; E-mail: [email protected]
doi: 10.1158/1078-0432.CCR-10-1820
�2011 American Association for Cancer Research.
ClinicalCancer
Research
www.aacrjournals.org 4309
Research. on July 12, 2018. © 2011 American Association for Cancerclincancerres.aacrjournals.org Downloaded from
Published OnlineFirst May 12, 2011; DOI: 10.1158/1078-0432.CCR-10-1820

seem to regulate transcription of the p53 gene itself. How-ever, Yang and colleagues reported that MAGE proteinsinteracted with the RING domain protein TRIM28/Kap1and suppressed transcription of p53 in human and mousemelanoma cell lines, and that silencing of type I MAGEsalso induced apoptosis (6). Silencing of MAGE-A3 or CT7expression by siRNA transfection seemed to reduce viabilityin human myeloma cell lines (HMCL; ref. 7), but theunderlying mechanism was not explored. More recently,Doyle and colleagues used biochemical methods to showthat MAGE/RING domain protein complexes function asE3 ubiquitin (Ub) ligases (8). Several MAGE proteinsassociated with TRIM28/Kap1, and the MAGE-A2 and-C2 complexes were capable of polyubiquitinylating p53,targeting it for proteasomal degradation. This report of abiochemical function for MAGE was a groundbreakingrevelation; however, it remains to be determined whetherthis activity is responsible for the effects of type I MAGE onsurvival and whether p53 is the sole or dominant targetsubstrate in myeloma cells.
To investigate the role of type I MAGEs in the pathogen-esis and progression of MM, we examined their expressionby immunohistochemistry (IHC) in an independent set ofsamples from 2 critical clinical milestones: newly diag-nosed, untreated patients and patients who had relapsedafter chemotherapy. Our data revealed that both the num-ber of patients expressing MAGE-A3 in their tumor cellsand the percentage of MAGE-A3–positive tumor cellsincreased with progression of disease and correlated withhigher frequencies of Ki-67þ myeloma cells. Silencing ofMAGE-A in HMCL and primary patient cells did not impaircell-cycle regulation, but it did result in apoptosis throughp53-dependent activation of Bax and Bak genes and byrepression of survivin through p53-dependent and -inde-pendent mechanisms. We propose that MAGE-A plays a
critical role in the survival of proliferating MM cellsthrough regulation of antiapoptotic mechanisms.
Materials and Methods
Patient samplesSpecimens from patients diagnosed with MM (9) were
obtained at the Weill-Cornell Medical Center or New YorkUniversity Clinical Cancer Center under InstitutionalReview Board–approved sample collection protocols(WCMC IRB #1000-422 and NYU IRB #06-523) in accor-dance with the Declaration of Helsinki.
Immunohistochemical analysisIHC of bone marrow biopsies was carried out as
described previously (10). Briefly, primary antibodies wereas follows: M3H67 (MAGE-A3), CT7-33 (CT7), CT10(CT10), MA454 (MAGE-A1), 57B (MAGE-A4), and E978(NY-ESO-1), all provided by the Ludwig Institute for Can-cer Research. Slides were blinded to the pathologist inregards to newly diagnosed versus relapsed status. Imageswere acquired as JPEG format files with a Nikon Coolpix990 digital camera. Minor adjustments of brightness, con-trast, and color solely for the purpose of legibility weremade with Adobe Photoshop 7.0 for Windows (AdobeSystems Inc.).
Plasma cell proliferation index assayPlasma cell proliferation index (PCPI) assay was carried
out as previously described (11). To compute the PCPI, 500cells with a positive membranous CD138 signal werecounted; each of these cells was scored as proliferating(containing a brown Ki-67þ nucleus) or nonproliferating(containing a blue, counter-stained, Ki-67–negativenucleus). The PCPI was reported as a percentage.
Cell linesMM.1r and H929 were from ATCC. ARP-1 was provided
by S. Chen-Kiang. Cells were cultivated at 37�C, 5% CO2 inR10 media [RMPI-1640 (Mediatech Cellgro), 10% heat-inactivated FBS (Sigma-Aldrich), 1% 1mol/L HEPES buffer(Mediatech Cellgro) and 20 mg/mL gentamycin (InvitrogenGibco)].
Primary myeloma cellsPatient 1 (Pt #1) cells were cultivated in X-VIVO 15
medium (Lonza Walkersville, Inc.) supplemented with10% heat-inactivated pooled human AB serum (OmegaScientific, Inc.), 20 mg/mL gentamicin, and 1 mg/mL recom-binant human interleukin-6 (R&D Systems) at 37�C, 5%CO2. These cells were greater than 90% CD138þ by flowcytometry. Experiments were conducted on cells betweenpassages 3 and 5 in tissue culture.
Genomic p53 sequencingGenomic DNA was isolated from Pt #1 cells by using
the DNAeasy Blood and Tissue kit (Qiagen) according tothe manufacturer’s instructions. TP53 exons 2–11 were
Translational Relevance
Multiple myeloma is an incurable blood cancer.MAGE-A3 is a cancer-associated gene that is commonlyexpressed in multiple myeloma and correlates withhigher frequencies of proliferating malignant cells.The results presented here show that expression ofMAGE-A3 in patient specimens also correlated torelapse of multiple myeloma, suggesting a pathogenicrole in progression of disease. Silencing of MAGE-A3in myeloma cell lines and patient cells resulted inactivation of intrinsic apoptosis due to regulation ofBax and survivin by p53-dependent and -independentmechanisms. MAGE-A3 seemed to contribute to pro-gression of disease by promoting resistance to apop-tosis in proliferating multiple myeloma cells. Therefore,MAGE-A3 is a promising therapeutic target in multiplemyeloma, and strategies targeting it, such as MAGE-A3-specific tumor vaccines currently in clinical trials,may result in myeloma cell apoptosis and preventrelapse.
Nardiello et al.
Clin Cancer Res; 17(13) July 1, 2011 Clinical Cancer Research4310
Research. on July 12, 2018. © 2011 American Association for Cancerclincancerres.aacrjournals.org Downloaded from
Published OnlineFirst May 12, 2011; DOI: 10.1158/1078-0432.CCR-10-1820

amplified and sequenced by using the International Agencyfor Cancer Research (IARC) direct sequencing protocol:http://www-p53.iarc.fr/Download/TP53_DirectSequen-cing_IARC.pdf. Amplified exons were sequenced at theNew York University Sequencing Core Facility.
Lentiviral short hairpin RNA transductionLentiviral short hairpin RNA (shRNA) construct particles
targeting MAGE-A3 (shMA, TRCN0000128375 andTRCN0000129750; Sigma Aldrich), nontarget (shNT) con-trol (SHC002V) containing a scrambled sequence, and aconstruct encoding green fluorescent protein (GFP;SHC003V) were used for these experiments. Briefly, cellswerediluted to105 cells/mL inR10and incubatedovernightat 37�C. Cells were then harvested and resuspended in R10media without antibiotics supplemented with 8 mg/mLpolybrene (hexadimethrine bromide; Sigma-Aldrich) andaliquoted into a 96-well round bottom plate at 30,000 cellsper well. Lentivirus particles were added at amultiplicity-of-infection (MOI) of 5� for MM.1R and a MOI of 15� forARP-1 and Pt #1. Untreated cells were included as addi-tional negative controls. Cells were incubated for 18 hoursat 37�C, then the cells were washed 3 timeswith prewarmedR10 media without antibiotics to remove excess virus andpolybrene. Incubations were continued until the timepoints noted in individual experiments. Transduction effi-ciency typically exceeded 60% as measured at 24 and 48hours by flowcytometry forGFP fluorescence. For apoptosisanalysis, cells were treated with 10 mmol/L quinoline-Val-Asp-difluorophenoxymethylketone (Q-VD-OPh) pan-cas-pase inhibitor (R&D Systems) or dimethyl sulfoxide(DMSO)vehicle control at 24hours, and annexinV stainingwas assessed at 48 hours. For substrate-specific Ub assay,cells were treated with 40 nmol/L MG132 (Calbiochem) orDMSO vehicle control 8 hours prior to harvest.
5-Bromo-2-deoxyuridine labelingProliferation was analyzed with the 5-bromo-2-deoxyur-
idine (BrdU) flow kit from BD Biosciences (catalog559619) according to the manufacturer’s instructions.
Annexin V stainingLentivirus-transduced and control cells were resus-
pended in a small volume (�100 mL) of 1� binding buffer(BD Bioscience), and incubated with Annexin V-PE (BDBiosciences) and 5 mL of 7-Aminoactinomycin D (7-AAD;BD Biosciences) at room temperature, protected from lightfor 20minutes. Untreated cells stained with annexin V onlyor 7-AAD only served as single color controls. Cells werethen fixed in 100 mL of 4% paraformaldehyde (Sigma-Aldrich) and analyzed by flow cytometry.
RNA isolationRNA isolation was done as previously described (3).
Quantitative real-time RT-PCRQuantitative real-time RT-PCR (qRT-PCR) was carried
out as previously described (3). Taqman primer sets
(Applied Biosystems Inc.) for the genes of interest in theseexperiments were as follows: b-actin (Hs00181698_m1),cyclophilin B (Hx00168719_m1), p53 (Hs01034249_m1),p21 (Hs99999142_m1), cyclin B1 (Hs01030103_m1), p27(Hs00153277_m1), survivin (Hs03063352_s1), MAGE-A3(Hs00366532_m1), MAGE-A1 (Hs00607097_m1), CT7(Hs00193821_m1), cyclin B2 (Hs00270424_m1), cyclin-dependent kinase 1 (CDK1; Hs00938777_m1), CDK2(Hs01548894_m1), cyclin E2 (Hs01051894_m1), cyclinA2 (Hs00996789_g1). Relative expression was calculatedagainst the geometric mean of the reference primers(b-actin and cyclophilin B) by using the formula: relativeexpression ¼ 2�[DCt(sample) � DCt(reference)], where DCt ¼Ct(test) � Ct(reference control), the control is untreatedcells, and Ct is the cycle threshold to reach a thresholdfluorescence intensity of 0.2. Results were normalized tothe shNT control in each set of samples and depicted as themean of triplicate samples � SEM.
Western blottingProtein lysates were prepared by freeze-thawing cells in
lysis buffer [350 mmol/L NaCl, 20 mmol/L HEPES (pH7.9), 0.2% NP-40, 1 mmol/L MgCl2, 1 mmol/L DTT, 20%glycerol, 2 mmol/L sodium orthovanadate, 10 mmol/Lb-glycerol phosphate (all from Sigma-Aldrich), 1� pro-tease inhibitor (Calbiochem)]. Protein concentration wasdetermined by Bradford assay (Bio-Rad) according to themanufacturer’s instructions. Lysate (10–20 mg) was run onan SDS-PAGE gel and transferred to a polyvinylidenedifluoride membrane (Millipore). Blocking and antibodydilutions were all done in 5% nonfat dry milk (NFDM) inTBS-T [10 mmol/L Tris base, 150 mmol/L NaCl, 0.01% (v/v) Tween 20; Sigma-Aldrich), with the exception of the pRbblots, for which 5% bovine serum albumin (BSA) þ 0.4%NFDM in TBS-T was used for blocking, 1% BSA in TBS-T forprimary antibody dilution, and 1% BSAþ 0.4% NFDM forsecondary antibody dilution. Blots were visualized withSupersignal West Femto Substrate (Thermo Scientific).
Antibodies for these experiments were as follows: p27(catalog 610242; BD Pharmingen); Bcl-xl (2763), Bim(2819), Bid (2002), Mcl-1 (4572), Rb (9309), pRb(9308), p21 (2947; Cell Signaling Technology); Bcl-2(M0887; Dako); Bax (sc-493), p53 (sc-126), MAGE-A(sc-20034) survivin (sc-17779; Santa Cruz Biotechnology,Inc.); Bak (AM03; EMD Biosciences); b-actin (MS-1295-P0), goat anti-mouse IgG-HRP conjugate (1858413),goat anti-rabbit IgG-HRP conjugate (1858415; ThermoScientific).
ImmunoprecipitationFor substrate-specific ubiquitination, 25 mg lysate was
incubated with 0.5 mg p53-specific monoclonal antibody(mAb) or IgG isotype control on ice for 1 hour, thencoincubated with Protein A Sepharose beads (Pearse) thathad been blocked for 1 hour with 10% BSA (Sigma-Aldrich) at room temperature. Immune complexes weretumbled overnight at 4�C, then the beads were washed 4times with ice-cold radioimmunoprecipitation assay buffer
MAGE-A Inhibits Apoptosis in Myeloma Cells
www.aacrjournals.org Clin Cancer Res; 17(13) July 1, 2011 4311
Research. on July 12, 2018. © 2011 American Association for Cancerclincancerres.aacrjournals.org Downloaded from
Published OnlineFirst May 12, 2011; DOI: 10.1158/1078-0432.CCR-10-1820
[0.05% Tris (pH 7.4), 0.15 mol/L NaCl, 1% (w/v) NaDeoxycholate (Sigma-Aldrich), 1% (v/v) Triton X-100,0.1% (w/v) SDS (MP Biomedical)]. Immunoprecipitationproducts were analyzed by Western blot with p53 or Ub(MMS-264R; Covance) mAb.
Statistics and data presentationStatistical analysiswas carriedoutwithExcel 2008 forMac
(Microsoft Corporation) and with Prism 5.0 (GraphPadSoftware) for Mac OSX (Apple Inc.). Figures were preparedwith Prism 5.0, Adobe Photoshop CS3, and Illustrator CS3(Adobe Systems Inc.) for Mac OSX (Apple Inc.). Densito-metry of Western blots was carried out with ImageJ 1.44o(Wayne Rasband). Photo images were not altered in pre-paration except for the survivinWestern blot image for Pt #1in Figure 5C, which was enhanced for contrast only.
Results
MAGE-A3 expression correlates with progression ofdisease in MM patients
Expression of MAGE-A3 and other CTAg proteins wasassessed by IHC in bone marrow biopsy specimens from 2critical clinical milestones: newly diagnosed, untreatedMMpatients (n ¼ 46) and patients who relapsed after che-motherapy (n ¼ 35; Fig. 1A). Demographic data (age andsex distribution) and clinical characteristics were similarbetween the 2 groups andwere representative of the generalMM patient population (Table 1). Karyotypic abnormal-ities were detected by either conventional cytogenetics orFISH inmore than half of each group. High-risk cytogeneticabnormalities, including chromosome 13 abnormalities, t
(4;14), and complex cytogenetics, accounted for approxi-mately one third of the tested patients in each group.
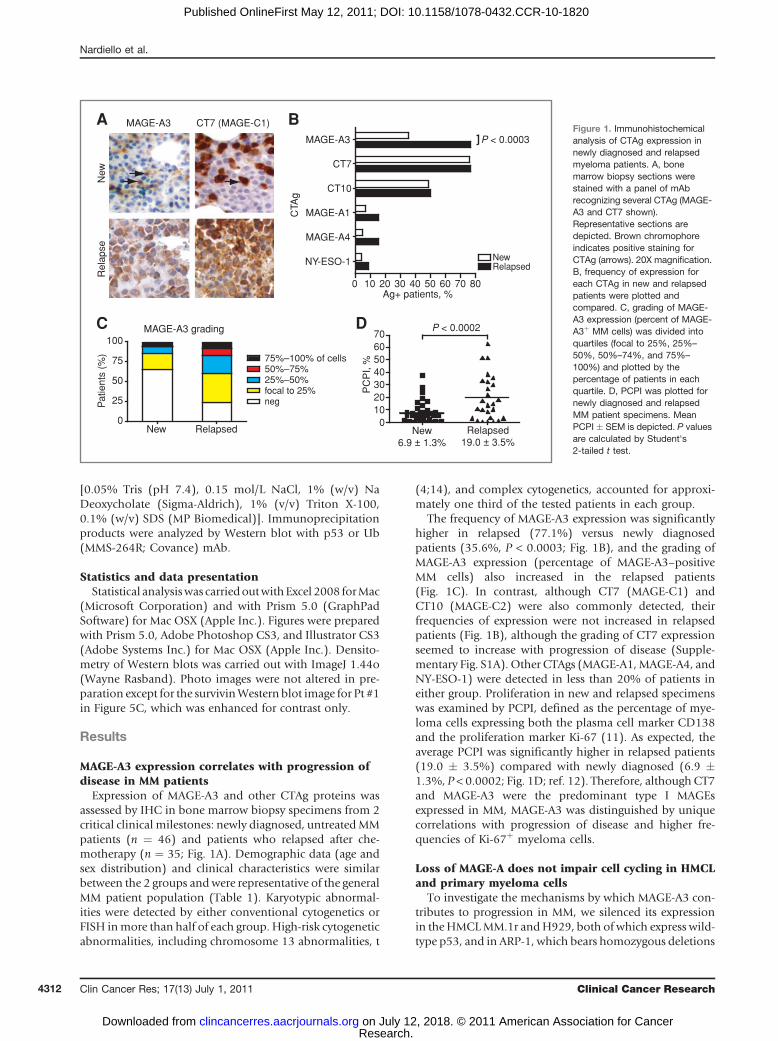
The frequency of MAGE-A3 expression was significantlyhigher in relapsed (77.1%) versus newly diagnosedpatients (35.6%, P < 0.0003; Fig. 1B), and the grading ofMAGE-A3 expression (percentage of MAGE-A3–positiveMM cells) also increased in the relapsed patients(Fig. 1C). In contrast, although CT7 (MAGE-C1) andCT10 (MAGE-C2) were also commonly detected, theirfrequencies of expression were not increased in relapsedpatients (Fig. 1B), although the grading of CT7 expressionseemed to increase with progression of disease (Supple-mentary Fig. S1A). Other CTAgs (MAGE-A1,MAGE-A4, andNY-ESO-1) were detected in less than 20% of patients ineither group. Proliferation in new and relapsed specimenswas examined by PCPI, defined as the percentage of mye-loma cells expressing both the plasma cell marker CD138and the proliferation marker Ki-67 (11). As expected, theaverage PCPI was significantly higher in relapsed patients(19.0 � 3.5%) compared with newly diagnosed (6.9 �1.3%, P < 0.0002; Fig. 1D; ref. 12). Therefore, although CT7and MAGE-A3 were the predominant type I MAGEsexpressed in MM, MAGE-A3 was distinguished by uniquecorrelations with progression of disease and higher fre-quencies of Ki-67þ myeloma cells.
Loss of MAGE-A does not impair cell cycling in HMCLand primary myeloma cells
To investigate the mechanisms by which MAGE-A3 con-tributes to progression in MM, we silenced its expressionin theHMCLMM.1r andH929, both of which express wild-type p53, and in ARP-1, which bears homozygous deletions
New
Rel
apse
CT7 (MAGE-C1)MAGE-A3
New6.9 ± 1.3%
Relapsed19.0 ± 3.5%
010203040506070
PC
PI,
%
P < 0.0002
A BP < 0.0003
0 10 20 30 40 50 60 70 80
NY-ESO-1
MAGE-A4
MAGE-A1
CT10
CT7
MAGE-A3
NewRelapsed
Ag+ patients, %C
TAg
New Relapsed0
25
50
75
100
negfocal to 25%25%–50%50%–75%75%–100% of cells
Pat
ient
s (%
)
MAGE-A3 gradingC D
Figure 1. Immunohistochemicalanalysis of CTAg expression innewly diagnosed and relapsedmyeloma patients. A, bonemarrow biopsy sections werestained with a panel of mAbrecognizing several CTAg (MAGE-A3 and CT7 shown).Representative sections aredepicted. Brown chromophoreindicates positive staining forCTAg (arrows). 20X magnification.B, frequency of expression foreach CTAg in new and relapsedpatients were plotted andcompared. C, grading of MAGE-A3 expression (percent of MAGE-A3þ MM cells) was divided intoquartiles (focal to 25%, 25%–
50%, 50%–74%, and 75%–
100%) and plotted by thepercentage of patients in eachquartile. D, PCPI was plotted fornewly diagnosed and relapsedMM patient specimens. MeanPCPI � SEM is depicted. P valuesare calculated by Student's2-tailed t test.
Nardiello et al.
Clin Cancer Res; 17(13) July 1, 2011 Clinical Cancer Research4312
Research. on July 12, 2018. © 2011 American Association for Cancerclincancerres.aacrjournals.org Downloaded from
Published OnlineFirst May 12, 2011; DOI: 10.1158/1078-0432.CCR-10-1820

of the TP53 loci on chromosome 17. We also used poly-clonal primary cells (Pt #1) that had a monoallelic deletionof TP53 by FISH, and sequencing of the other TP53 allelerevealed a loss-of-function mutation in the DNA-bindingregion of exon 7, rendering them p53-null (SupplementaryFig. S2A and B). MAGE-A3 was silenced with targetedlentiviral shRNA constructs (Supplementary Fig. S1B) thatshowed high transduction efficiency and low backgroundtoxicity. Two distinct constructs (shMA 129750 and128375) silenced MAGE-A3 mRNA and protein expressioncompared with nontarget shRNA-transduced (shNT) anduntreated negative control (Con) cells (Fig. 2A and B).Subsequent experiments were conducted with shMA128375. This construct also silenced MAGE-A1 (Supple-mentary Fig. S1C), most likely due to the high degree ofsequence conservation among theMAGE-A family (13, 14).CT7mRNA levels in ARP-1 and Pt #1 cells were not affectedby shMA 128375 (Supplementary Fig. S1D). Because thepotential activity of MAGE-A1 and other MAGE-A familymembers could not be formally excluded in these shRNAexperiments, the target genes will be referred to collectivelyas "MAGE-A." However, it should be noted that MAGE-A1was detected in less than 20% of patient samples by IHC(Fig. 1B).
MAGE-A may contribute to myeloma progression bypromoting cell cycling, cell survival, or both. To investigatethe role of MAGE-A in cell-cycle regulation, we labeledreplicating DNA in MAGE-A–silenced and control cellswith BrdU for 30 minutes. BrdU uptake and total DNAcontent per cell were then assessed by flow cytometry. Shortpulses of BrdU provided a "snapshot" of cells in S-phase ata given time without skewing the distribution of cells ineach phase of the cycle due to death. Silencing of MAGE-Aled to a drastic decrease in the percentage of live cells by 72hours in MM1.r, H929, and Pt #1 cells and by 96 hours inARP-1 cells (Fig. 2C, red arrows). Of note, the reduction ofviable MM1.r and H929 cells was accompanied by adecrease in the percentage of S-phase cells (Fig. 2C, greenarrows), but this selective loss of S-phase cells was notobserved in ARP-1 or Pt #1 cells.
The loss of MM.1r and H929 cells in S-phase was notaccompanied by an increase in G1 cells (Fig. 2D), suggestingthat the loss was due to cell death rather than a block inprogression through theG1 cell-cycle checkpoints.Corrobor-ating thisobservation, silencingofMAGE-A inMM.1rdidnotperturb the ratioofCDK4/CDK6-specific phosphorylationofRb to total Rb compared with controls at 48 hours (Supple-mentary Fig. S3A), indicating that cell-cycle progressionthrough mid-G1 was intact. Total Rb protein was reducedinMAGE-A–silenced cells, possibly reflecting the decrease inoverall cell viability. Thus, although dysregulation of G1
progression via overexpression of CDK4 or CDK6 is centralto loss of cell-cycle control in myeloma (13), these dataconfirmed that MAGE-A is not required for cell-cycle pro-gression through G1. The CDK inhibitors p21Cip1 andp27Kip1 can act in both G1 and G2–M to mediate cell-cyclearrest. The expressionof p21 and p27 proteins also remainedunchangedupon silencingofMAGE-A, despite an increase in
Table 1. Demographic and staging data for MMpatients in this study
Newlydiagnosed(n ¼ 46)
Relapsed(n ¼ 35)
Age, y 62.0 � 1.5 57.7 � 1.5Sex
Male 27 20Female 19 15
Heavy chain isotypeIgG 26 18IgA 10 3IgM 1 1IgG þ IgA 1IgD 1Light chain only 8 7Oligosecretory 4
Light chain isotypeKappa 31 23Lambda 15 11Not done 1
CytogeneticsNormal 32 18Del(20q) 1Complex 7Complex includingt(5;13)(q31;q14)
1
Inv(2) 1Inv(9) 2 1Y(�) 2Complex t(1;8);t(11;14); t(12;27)
1
Not done 7 8FISH
Normal 15 19Del (13q14) 4t(11;14) 2
Complex incl.del(13q14)
7
Del(13) 2t(11;14) 4t(4;14) 1Trisomy 11 1Trisomy 11 þ del(13q14) 1Trisomy/tetrasomy 11 5Trisomy 11/trisomy 17 1Complex 1 1Not done 8 9
Serum b2-microglobulin,mg/dL
4.8 � 0.6 4.7 � 0.7
Serum albumin, mg/dL 3.6 � 0.1 3.5 � 0.1Hemoglobin, g/dL 10.4 � 0.4 10.2 � 0.3Serum creatinine, mg/dL 1.5 � 0.2 2.2 � 0.4
MAGE-A Inhibits Apoptosis in Myeloma Cells
www.aacrjournals.org Clin Cancer Res; 17(13) July 1, 2011 4313
Research. on July 12, 2018. © 2011 American Association for Cancerclincancerres.aacrjournals.org Downloaded from
Published OnlineFirst May 12, 2011; DOI: 10.1158/1078-0432.CCR-10-1820

p21 mRNA (Supplementary Fig. S3B and C). Collectively,these data showed that MAGE-A is required to maintainmyeloma cell survival, particularly survival of S-phase cellsin the presence of p53, but is dispensable for cell cycling.
Silencing of MAGE-A triggers the intrinsic apoptosispathway in proliferating myeloma cells
This led us to investigate the mechanisms by whichsilencing MAGE-A induced cell death. We first assessedapoptotic versus necrotic cell death in this system. Silencingof MAGE-A with shMA 128375 (Fig. 3A) or 129750 (Sup-plementary Fig. S1E) in HMCL and Pt #1 cells was asso-ciated with an increased number of apoptotic cells(annexin V–positive) in the total acquisition population,compared with controls. Analysis of the kinetics of celldeath showed an inverse correlation between live cells andannexin V–positive cells (Fig. 3B), indicating that the lossof viable cells was due to apoptosis. Furthermore, apoptosisin MAGE-A-silenced HMCL and primary cells was charac-terized by increased mitochondrial depolarization(decreased MitoTracker Red staining; Fig. 3C) suggestingthat it triggered the intrinsic apoptosis pathway. Apoptosisin MAGE-A–silenced cells was reversed by coincubationwith the pan-caspase inhibitor Q-VD-OPh (Fig. 4D), indi-cating that it was caspase dependent. In fact, silencing ofMAGE-A lead to cleavage of caspase-3 (Fig. 3E). Caspase-9cleavage/activation was also evident after MAGE-A silen-cing in p53þ/þ MM.1r but not in p53�/� ARP-1, and verylittle caspase-9 was detected in p53mut/� Pt #1 cells. Thesedata showed that MAGE-A inhibits intrinsic apoptosis inboth p53þ/þ and p53-null myeloma cells.
MAGE-A regulates Bax and survivin throughp53-dependent mechanisms
Having shown that MAGE-A antagonized intrinsicapoptosis in MM.1r, we investigated expression of
pro- and antiapoptotic Bcl-2 genes in these cells.MAGE-A silencing in MM.1r lead to increased mRNAexpression of proapoptotic Bax and Bak (Fig. 4A).Increased expression of Bax protein was also evident,but Bak protein was not significantly changed underthese conditions (Fig 4B). Other Bcl-2 proteins (Bid,Bim, Mcl-1, Bcl-2, and Bcl-xl) similarly showed verylittle changes compared with controls. Bax is a targetof p53 transcriptional activation, so we next examinedp53 expression. Silencing of MAGE-A in MM.1rincreased p53 protein without affecting mRNA expres-sion (Fig. 4C). MAGE-A posttranslational regulation ofp53 was confirmed by substrate-specific Ub assay, whichshowed loss of Ub-p53 (70 kD band; Fig. 4D) aftersilencing of MAGE-A compared with controls. Silencingof p53 by shRNA lentiviral transduction in addition toMAGE-A in MM.1r reverted Bax and Bak mRNA tocontrol levels, indicating that MAGE-A repressed theirexpression by inhibiting p53 transactivation (Fig. 4B).We then examined survivin, a multifunctional proteinthat plays critical roles in survival and cell division innormal and cancer cells (15, 16). It can be transcrip-tionally repressed by p53 (17, 18). Silencing of MAGE-Ain MM.1r resulted in a marked reduction in survivinmRNA and protein (Fig. 4A and B). Survivin mRNA waspartly restored by silencing of p53 in addition to MAGE-A. Collectively, these findings showed that MAGE-Ainhibits Bax transcription through inhibition of p53and promotes survivin expression in part throughp53-dependent mechanisms.
MAGE-A promotes expression of survivin byp53-independent mechanisms
Because silencing of MAGE-A also induced apoptosis inp53-null ARP-1 and Pt #1, we investigated p53-indepen-dent mechanisms of MAGE-A inhibition of apoptosis by
Con shNT shMABAM
AG
E-A
3 m
RN
A
(rel
ativ
e un
its)
24 48 720.0
0.5
1.0
1.5
2.0
shMA 128375shMA 129750
shNTCon MAGE-A3
β-Actin
MAGE-A3
β-Actin
MAGE-A3
β-Actin
MM.1r
ARP-1
Pt #1Time (h)
1.000.83 0.41
1.10 1.00 0.17
1.84 1.00 0.19
rel OD
Figure 2. Silencing ofMAGE-A does not directly affect proliferation inMMcells.MM.1r and ARP-1 HMCL and Pt #1 cells were transducedwithMAGE-A–targeted(shMA 128375 and 129750) or nontarget (shNT) shRNA lentiviral particles and samples were harvested at the indicated time points. A, MAGE-A3 mRNA inMM.1r cells was assessed by semiquantitative RT-PCR. Results were normalized to shNT control at each time point. Error bars depict SEM for triplicates of eachsample. Control (Con), untreated negative control cells. B, HMCLandPt #1 cells were treatedwith shMA128375or controls andMAGE-A3protein expressionwasassessed by Western blot at 48 hours. Relative optical density (rel OD) was normalized to matched b-actin and expressed as a fraction of shNT control.
Nardiello et al.
Clin Cancer Res; 17(13) July 1, 2011 Clinical Cancer Research4314
Research. on July 12, 2018. © 2011 American Association for Cancerclincancerres.aacrjournals.org Downloaded from
Published OnlineFirst May 12, 2011; DOI: 10.1158/1078-0432.CCR-10-1820

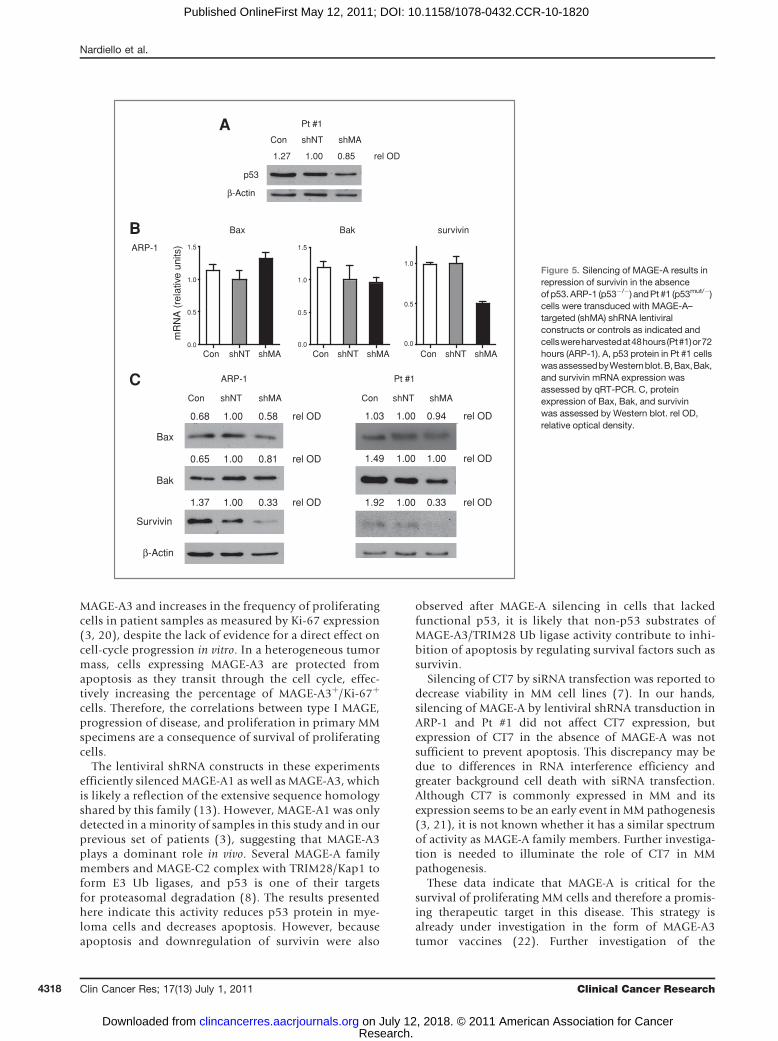
examined expression of Bax, Bak, and survivin in thesecells. MAGE-A silencing did not stabilize mutant p53 in Pt#1 cells (Fig. 5A). Bax and Bak mRNA or protein did notincrease upon silencing of MAGE-A (Fig. 5B and C). Incontrast, MAGE-A silencing resulted in marked decreases insurvivin protein. The expression of survivin mRNA paral-leled that of protein in ARP-1 cells. These data indicate that
MAGE-A also promoted survivin protein expressionthrough p53-independent mechanisms in myeloma cells.
Discussion
These results showed that MAGE-A inhibited apoptosisin proliferating MM cells through at least 2 novel mechan-
25
14.3
46.871.8
32.8
17
39.376
31.2
20.2
37.373.6
24.4 26.2
42.282.8
28.8 29
33.984.9
29.5 37.5
25.177
41.7 31.8
19.673.5
45.3 29.5
18.272.4
46.9 31.5
12.841
24 h 48 h 72 h
96 h48 h
Brd
UC
D
shMA
Con
MM.1r
ARP-1
72 h
7-AAD
57.2 5.9
21.4
17.542.8 11
4064.5
49 8.8
24
50.936.913.9
40.172.7
41.78.1
39
67.5
56.59.0
21.9
43.9
41.88.4
37.5
69.3
47.2 8.8
27
51.939.113.5
38.668.7
G1=50.2G2–M=9.1
S=29.7
35.6 18.6
27.3
37 31.6
5.3
74.1
54.8 26.2
9.685.1 18.6
81.8 Live Gate
50.7 21.9
23.168.2
43.5 18.4
22.7
80.8
41.3 12
27.6
80.2
39.2 23.9
23.2
81.7
50.4 21.8
21.158.7shNT
33.5 17.4
43.8
45.1 14.9
27.5
41.7 15.4
32.830.7
44.6 13.7
29.1
49.2 13.5
28.2
43.5 14.2
34
71.3
69.5
69.1
44.3 16
33.9
37.7 14.4
4163.1
59.6
53.6
41.7 16.6
35.8
69.1
62.1
shMA
Con
shNT
Pt #1
24 h 48 h 72 h
Brd
U
7-AAD
24 h 48 h 72 h
H929
Figure 2. (Continued) C, shMA-transduced and control cells were pulsed for 30 minutes with 10 mmol/L BrdU at the indicated time points. Proliferation wasassessed by intracellular staining for BrdU and 7-AAD, followed by flow cytometry. Acquisition populations were gated on viable cells in forward versus sidescatter plots (Live Gate, insets) and the gated events plotted by 7-AAD (total DNA content) versus fluorescein isothiocyanate (BrdU incorporation)fluorescence, resulting in segregation into the G1, S, and G2–M populations as labeled in the first panel.
MAGE-A Inhibits Apoptosis in Myeloma Cells
www.aacrjournals.org Clin Cancer Res; 17(13) July 1, 2011 4315
Research. on July 12, 2018. © 2011 American Association for Cancerclincancerres.aacrjournals.org Downloaded from
Published OnlineFirst May 12, 2011; DOI: 10.1158/1078-0432.CCR-10-1820

Con
shNT
shMA
0
25
50
75
100
0
25
50
75
100
0
25
50
75
100
Live GateAnnexin V
MM.1r ARP-1
Cel
ls/1
00 e
vent
s
B Pt #1
24 48 72 9648 72
Time (h)
24 48 72
39.124.119
Eve
nts
FL3:MitoTracker
shMAshNTControlC
25.5 28.1 45.3
MM.1r
ARP-1
Pt #1
51.638.234.7
0
10
20
30
4045 DMSO
Q-VD-OPh
D
0
10
20
30
40
Ann
exin
V+ (
%)
Con shNT shMA
MM.1r
ARP-1
Pt #1
0
10
20
30
4045
Con shNT shMAE
ARP-1
MM.1r
Csp-9
β-Actin
Csp-3
46 kD
35 kD
Csp-9
β-Actin
Csp-3
46 kD
35 kD
35 kD
46 kD
35 kD
Csp-9
β-Actin
Csp-3
Pt #1
1.000.97 0.10
1.65 1.00 0.41
0.67 1.00 0.28
0.66 1.00 0.48
1.64 1.00 0.01
1.37 1.00 0.73
rel OD
rel OD
rel OD
rel OD
rel OD
rel OD
1.2 33
30.135.7
1.42 13.1
19.266.3
0.6 11.2
15.572.7
29.5
29.52.6
38.4
27.5
12.61.6
58.3
27.2
8.31.8
62.8
0.2 49.4
19.331.2
0.6 7.5
9.782.2
1.2 7.7
12.878.3
Annexin V
7-A
AD
MM.1r, 72 h ARP-1, 96 h Pt #1, 72 hCon
shNT
shMA
A0.8 6.4
3.489.3
1.0 5.9
4.289
2.2 33.3
14.150.4
H929, 72 h
Figure 3. Silencing of MAGE-A results in activation of intrinsic apoptosis. HMCL and Pt #1 cells were transduced shMA or controls as previously describedand apoptosis was assessed by staining with annexin V. A, total (ungated) acquisition populations at 72 or 96 hours were plotted by Annexin V-PE (apoptosis)vs. 7-AAD (necrosis) fluorescence. B, the percentages of viable cells (Live Gate as described in Fig. 2, solid circles) and annexin Vþ cells in the ungatedacquisition population (solid squares) were plotted over time for the MAGE-A–silenced and control groups. C, HMCL and Pt #1 cells were stained withMitoTracker Red, which is fixed in mitochondria with intact membrane polarization, and analyzed by flow cytometry. Total (ungated) events were plotted byMitoTracker Red fluorescence and mitochondrial depolarization was assessed by decreased fluorescence (bars). D, lentivirus-transduced cells wereincubated with 10 mmol/L Q-VD-OPh or DMSO vehicle control for 72 hours and apoptosis was assessed by staining with annexin V. E, caspase-3 andcaspase-9 were analyzed by Western blot in at 48 hours for MM.1r and Pt #1 and 72 hours for ARP-1 cells.
Nardiello et al.
Clin Cancer Res; 17(13) July 1, 2011 Clinical Cancer Research4316
Research. on July 12, 2018. © 2011 American Association for Cancerclincancerres.aacrjournals.org Downloaded from
Published OnlineFirst May 12, 2011; DOI: 10.1158/1078-0432.CCR-10-1820

isms: inhibition of p53-dependent upregulation of Baxand maintenance of survivin expression by p53-depen-dent and -independent mechanisms. These mechanismswere active in cell lines and primary MM cells. Further-more, MAGE-A3 expression was unique among the CTAgscharacterized in that it was specifically correlated withprogression of disease. Identification of these apoptoticmechanisms provides long-sought insight into the role ofMAGE-A in the pathogenesis and progression of MM andvalidates them as functional therapeutic targets in thisdisease.Silencing of MAGE-A resulted in loss of p53 ubiquitina-
tion and stabilization of p53 protein, increased expressionof Bax, and apoptosis in p53þ/þ MM.1r cells. Progressionthrough G1 and entry into S-phase seemed intact even asthe majority of cells became apoptotic. Therefore, apopto-sis in the S-phase population of MM.1r cells was likely aconsequence of p53-dependent upregulation of Bax afterloss of MAGE-A, because disproportionate S-phase apop-tosis was not observed in p53-null ARP-1 or Pt #1 cells.These results strongly suggest that MAGE-A is an antagonist
of p53-dependent proapoptotic transcriptional regulationin MM cells.
Survivin was downregulated in HMCL and primaryMM cells after MAGE-A silencing regardless of p53status. This is the first evidence of a functional linkbetween type I MAGE and survivin and suggests thatsurvivin is a principal mediator of MAGE-dependentresistance to apoptosis in MM. Interestingly, high levelsof survivin mRNA in primary MM specimens from newlydiagnosed patients were correlated with poor prognosis(19). Survivin expression is at its lowest in G1 andincreases throughout the cycle, peaking in G2–M whereit regulates the mitotic spindle checkpoint (15). There-fore, it is unlikely that loss of survivin made a significantcontribution to S-phase apoptosis observed in MM.1rcells after MAGE-A silencing.
These results support a model in which MAGE-Apromotes survival in proliferating MM cells through atleast 2 distinct mechanisms that may act at differentphases of the cycle: Bax in S-phase and survivin in G2–M.This model also reconciles the correlation between
0.0
0.5
1.0
0.0
0.5
1.0
1.5
2.0
2.5
3.0
3.5
Con shNT shMA shp53 shMA/shp53
0.0
0.5
1.0
1.5
2.0
2.5
3.0
3.5
Con shNT shMA shp53 shMA/shp53
Con shNT shMA shp53 shMA/shp53
mR
NA
, rel
ativ
e un
its
SurvivinBak BaxA
B
Con shNT shMA
β-Actin
p53
p53
mR
NA
(rel
ativ
e un
its)
0.5
1.0
Con shNT shMA0.0
Con shNT shMA
Bax
Survivin
β-Actin
C
Bak
Bim
Bid
Bcl-2
Bcl-xl
Mcl-1
β-Actin
38 kD
29 kD
Con shNT shMA0.88 1.00 1.70
0.75 1.00 1.19
1.59 1.00 0.06
rel OD
rel OD
rel OD
2.15 1.00 6.71rel OD
Con shNT shMA
IP: p53WB: Ub
IP: p53WB: p53
70 kD
55 kD
Diso
55 kD
Figure 4. Silencing of MAGE-A induces p53-dependent Bax/Bak expression and repression of survivin. MM.1r cells were transduced with MAGE-A–targeted(shMA) or p53-targeted (shp53) shRNA lentiviral constructs, both targeted constructs, or controls as indicated and cells were harvested at 48 hours.A, Bax, Bak, and survivin mRNA expression was assessed by qRT-PCR. B, protein expression of Bcl-2 proteins and survivin was assessed by Westernblot. C, p53 mRNA expression was assessed by qRT-PCR and protein expression by Western blot. D, cells were incubated with 40 nmol/L MG132prior to harvest and lysates were immunoprecipitated (IP) with p53-specific mAb or isotype control mu IgG (iso). Ubiquitinylation of p53 was assessedby Western blot (WB). rel OD, relative optical density.
MAGE-A Inhibits Apoptosis in Myeloma Cells
www.aacrjournals.org Clin Cancer Res; 17(13) July 1, 2011 4317
Research. on July 12, 2018. © 2011 American Association for Cancerclincancerres.aacrjournals.org Downloaded from
Published OnlineFirst May 12, 2011; DOI: 10.1158/1078-0432.CCR-10-1820
MAGE-A3 and increases in the frequency of proliferatingcells in patient samples as measured by Ki-67 expression(3, 20), despite the lack of evidence for a direct effect oncell-cycle progression in vitro. In a heterogeneous tumormass, cells expressing MAGE-A3 are protected fromapoptosis as they transit through the cell cycle, effec-tively increasing the percentage of MAGE-A3þ/Ki-67þ
cells. Therefore, the correlations between type I MAGE,progression of disease, and proliferation in primary MMspecimens are a consequence of survival of proliferatingcells.
The lentiviral shRNA constructs in these experimentsefficiently silenced MAGE-A1 as well as MAGE-A3, whichis likely a reflection of the extensive sequence homologyshared by this family (13). However, MAGE-A1 was onlydetected in a minority of samples in this study and in ourprevious set of patients (3), suggesting that MAGE-A3plays a dominant role in vivo. Several MAGE-A familymembers and MAGE-C2 complex with TRIM28/Kap1 toform E3 Ub ligases, and p53 is one of their targetsfor proteasomal degradation (8). The results presentedhere indicate this activity reduces p53 protein in mye-loma cells and decreases apoptosis. However, becauseapoptosis and downregulation of survivin were also
observed after MAGE-A silencing in cells that lackedfunctional p53, it is likely that non-p53 substrates ofMAGE-A3/TRIM28 Ub ligase activity contribute to inhi-bition of apoptosis by regulating survival factors such assurvivin.
Silencing of CT7 by siRNA transfection was reported todecrease viability in MM cell lines (7). In our hands,silencing of MAGE-A by lentiviral shRNA transduction inARP-1 and Pt #1 did not affect CT7 expression, butexpression of CT7 in the absence of MAGE-A was notsufficient to prevent apoptosis. This discrepancy may bedue to differences in RNA interference efficiency andgreater background cell death with siRNA transfection.Although CT7 is commonly expressed in MM and itsexpression seems to be an early event in MM pathogenesis(3, 21), it is not known whether it has a similar spectrumof activity as MAGE-A family members. Further investiga-tion is needed to illuminate the role of CT7 in MMpathogenesis.
These data indicate that MAGE-A is critical for thesurvival of proliferating MM cells and therefore a promis-ing therapeutic target in this disease. This strategy isalready under investigation in the form of MAGE-A3tumor vaccines (22). Further investigation of the
0.0
0.5
1.0
0.5
1.0
1.5
0.0
0.5
1.0
1.5
0.0
Con shNT shMA Con shNT shMA Con shNT shMA
mR
NA
(re
lativ
e un
its)ARP-1
Con shNT shMA Con shNT shMA
ARP-1 Pt #1
survivinBak Bax
Bax
Survivin
β-Actin
Bak
C
B
1.37 1.00 0.33
0.68 1.00 0.58
0.65 1.00 0.81
rel OD
rel OD
rel OD 1.92 1.00 0.33
1.03 1.00 0.94
1.49 1.00 1.00
rel OD
rel OD
rel OD
Pt #1
Con shNT shMA
p53
β-Actin
A
1.27 1.00 0.85 rel OD
Figure 5. Silencing of MAGE-A results inrepression of survivin in the absenceof p53.ARP-1 (p53�/�) andPt #1 (p53mut/�)cells were transduced with MAGE-A–targeted (shMA) shRNA lentiviralconstructs or controls as indicated andcellswereharvestedat48hours(Pt#1)or72hours (ARP-1). A, p53 protein in Pt #1 cellswasassessedbyWesternblot.B,Bax,Bak,and survivin mRNA expression wasassessed by qRT-PCR. C, proteinexpression of Bax, Bak, and survivinwas assessed by Western blot. rel OD,relative optical density.
Nardiello et al.
Clin Cancer Res; 17(13) July 1, 2011 Clinical Cancer Research4318
Research. on July 12, 2018. © 2011 American Association for Cancerclincancerres.aacrjournals.org Downloaded from
Published OnlineFirst May 12, 2011; DOI: 10.1158/1078-0432.CCR-10-1820

mechanisms of MAGE-A3 inhibition of p53 and promo-tion of survivin expression in MM may reveal noveltherapeutic targets that will be amenable to pharmaco-logic agents. These may be combined with vaccines inmultitargeted, MAGE-specific therapy designed to induceapoptosis in proliferating MM cells or make them moresusceptible to chemotherapy-induced apoptosis, resultingin durable remission of this currently incurable disease.Proof of principle in MMmay lead to broader applicationin other cancers that express type I MAGE. These includelung, breast, prostate, and skin cancers, among the lead-ing causes of cancer death.
Disclosure of Potential Conflict of Interest
No potential conflicts of interest were disclosed.
Acknowledgment
The authors thank Wayne Austin and Hasina Outtz for their technicalcontributions.
Grant Support
V.C.C. Andrade is supported by scholarship 200024/2009-4 from Con-selho Nacional de Desenvovimento Cientifico e Tecnologico (CNPq) ofBrazil. H.J. Cho is supported by K01-CA115917 from the NIH/NCI and agrant from the Multiple Myeloma Working Group Initiative of the CancerResearch Institute.
The costs of publication of this article were defrayed in part by thepayment of page charges. This article must therefore be hereby markedadvertisement in accordance with 18 U.S.C. Section 1734 solely to indicatethis fact.
Received July 8, 2010; revised April 7, 2011; accepted May 6, 2011;published OnlineFirst May 12, 2011.
References1. Simpson AJ, Caballero OL, Jungbluth A, Chen YT, Old LJ. Cancer/
testis antigens, gametogenesis and cancer. Nat Rev Cancer 2005;5:615–25.
2. Scanlan MJ, Gure AO, Jungbluth AA, Old LJ, Chen YT. Cancer/testisantigens: an expanding family of targets for cancer immunotherapy.Immunol Rev 2002;188:22–32.
3. Jungbluth AA, Ely S, DiLiberto M, Niesvizky R, Williamson B, FrosinaD, et al. The cancer-testis antigens CT7 (MAGE-C1) and MAGE-A3/6are commonly expressed in multiple myeloma and correlate withplasma-cell proliferation. Blood 2005;106:167–74.
4. Kyle RA, Rajkumar SV. Multiple myeloma. Blood 2008;111:2962–72.5. Monte M, Simonatto M, Peche LY, Bublik DR, Gobessi S, Pierotti MA,
et al. MAGE-A tumor antigens target p53 transactivation functionthrough histone deacetylase recruitment and confer resistance to che-motherapeutic agents. Proc Natl Acad Sci U S A 2006;103:11160–5.
6. Yang B, O’Herrin SM, Wu J, Reagan-Shaw S, Ma Y, Bhat KM, et al.MAGE-A, mMage-b, and MAGE-C proteins form complexes withKAP1 and suppress p53-dependent apoptosis in MAGE-positive celllines. Cancer Res 2007;67:9954–62.
7. Atanackovic D, Hildebrandt Y, Jadczak A, Cao Y, Luetkens T, MeyerS, et al. Cancer-testis antigens MAGE-C1/CT7 and MAGE-A3 pro-mote the survival of multiple myeloma cells. Haematologica 2010;95:785–93.
8. Doyle JM, Gao J, Wang J, Yang M, Potts PR. MAGE-RING proteincomplexes comprise a family of E3 ubiquitin ligases. Molecular cell2010;39:963–74.
9. The International Myeloma Working Group. Criteria for the classifica-tion of monoclonal gammopathies, multiple myeloma and relateddisorders: a report of the International Myeloma Working Group. BrJ Haematol 2003;121:749–57.
10. Jungbluth AA, Chen YT, Stockert E, Busam KJ, Kolb D, Iversen K,et al. Immunohistochemical analysis of NY-ESO-1 antigen expressionin normal and malignant human tissues. Int J Cancer 2001;92:856–60.
11. Ely SA, Chadburn A, Dayton CM, Cesarman E, Knowles DM. Telo-merase activity in B-cell non-Hodgkin lymphoma. Cancer 2000;89:445–52.
12. Kumar SK, Therneau TM, Gertz MA, Lacy MQ, Dispenzieri A, Rajku-mar SV, et al. Clinical course of patients with relapsed multiplemyeloma. Mayo Clin Proc 2004;79:867–74.
13. Chomez P, De Backer O, BertrandM, De Plaen E, Boon T, Lucas S. Anoverview of the MAGE gene family with the identification of all humanmembers of the family. Cancer Res 2001;61:5544–51.
14. De Plaen E, Arden K, Traversari C, Gaforio JJ, Szikora JP, De Smet C,et al. Structure, chromosomal localization, and expression of 12 genesof the MAGE family. Immunogenetics 1994;40:360–9.
15. Li F, Ambrosini G, Chu EY, Plescia J, Tognin S, Marchisio PC, et al.Control of apoptosis and mitotic spindle checkpoint by survivin.Nature 1998;396:580–4.
16. Mita AC, Mita MM, Nawrocki ST, Giles FJ. Survivin: key regulator ofmitosis and apoptosis and novel target for cancer therapeutics. ClinCancer Res 2008;14:5000–5.
17. Hoffman WH, Biade S, Zilfou JT, Chen J, Murphy M. Transcriptionalrepression of the anti-apoptotic survivin gene by wild type p53. J BiolChem 2002;277:3247–57.
18. Mirza A, McGuirk M, Hockenberry TN, Wu Q, Ashar H, Black S, et al.Human survivin is negatively regulated by wild-type p53 and partici-pates in p53-dependent apoptotic pathway. Oncogene 2002;21:2613–22.
19. Romagnoli M, S�eveno C, Wuill�eme-Toumi S, Amiot M, Bataille R,Minvielle S, et al. The imbalance between Survivin and Bim mediatestumour growth and correlates with poor survival in patients withmultiple myeloma. Br J Haematol 2009;145:180–9.
20. ChngWJ, Kumar S, Vanwier S, Ahmann G, Price-Troska T, HendersonK, et al. Molecular dissection of hyperdiploid multiple myeloma bygene expression profiling. Cancer Res 2007;67:2982–9.
21. Atanackovic D, Arfsten J, Cao Y, Gnjatic S, Schnieders F, Bartels K,et al. Cancer-testis antigens are commonly expressed in multiplemyeloma and induce systemic immunity following allogeneic stemcell transplantation. Blood 2007;109:1103–12.
22. Brichard VG, Lejeune D. GSK's antigen-specific cancer immunother-apy programme: pilot results leading to Phase III clinical development.Vaccine 2007;25 Suppl 2:B61–71.
MAGE-A Inhibits Apoptosis in Myeloma Cells
www.aacrjournals.org Clin Cancer Res; 17(13) July 1, 2011 4319
Research. on July 12, 2018. © 2011 American Association for Cancerclincancerres.aacrjournals.org Downloaded from
Published OnlineFirst May 12, 2011; DOI: 10.1158/1078-0432.CCR-10-1820

2011;17:4309-4319. Published OnlineFirst May 12, 2011.Clin Cancer Res Tricia Nardiello, Achim A. Jungbluth, Anna Mei, et al. through Repression of Bax and Maintenance of SurvivinMAGE-A Inhibits Apoptosis in Proliferating Myeloma Cells
Updated version
10.1158/1078-0432.CCR-10-1820doi:
Access the most recent version of this article at:
Material
Supplementary
http://clincancerres.aacrjournals.org/content/suppl/2011/05/12/1078-0432.CCR-10-1820.DC1Access the most recent supplemental material at:
Cited articles
http://clincancerres.aacrjournals.org/content/17/13/4309.full#ref-list-1
This article cites 22 articles, 10 of which you can access for free at:
Citing articles
http://clincancerres.aacrjournals.org/content/17/13/4309.full#related-urls
This article has been cited by 6 HighWire-hosted articles. Access the articles at:
E-mail alerts related to this article or journal.Sign up to receive free email-alerts
SubscriptionsReprints and
To order reprints of this article or to subscribe to the journal, contact the AACR Publications
Permissions
Rightslink site. (CCC)Click on "Request Permissions" which will take you to the Copyright Clearance Center's
.http://clincancerres.aacrjournals.org/content/17/13/4309To request permission to re-use all or part of this article, use this link
Research. on July 12, 2018. © 2011 American Association for Cancerclincancerres.aacrjournals.org Downloaded from
Published OnlineFirst May 12, 2011; DOI: 10.1158/1078-0432.CCR-10-1820