Embed Size (px)
Citation preview

Originally published as: Maghsoudi, S., Cesca, S., Hainzl, S., Kaiser, D., Becker, D., Dahm, T. (2013): Improving the estimation of detection probability and magnitude of completeness in strongly heterogeneous media, an application to acoustic emission (AE). - Geophysical Journal International, 193, 3, pp. 1556—1569. DOI: http://doi.org/10.1093/gji/ggt049
Geophysical Journal InternationalGeophys. J. Int. (2013) 193, 1556–1569 doi: 10.1093/gji/ggt049Advance Access publication 2013 March 08
GJI
Sei
smol
ogy
Improving the estimation of detection probability and magnitude ofcompleteness in strongly heterogeneous media, an application toacoustic emission (AE)
Samira Maghsoudi,1 Simone Cesca,1,2 Sebastian Hainzl,2 Diethelm Kaiser,3 Dirk Becker4
and Torsten Dahm2
1Institute of Earth and Environmental Sciences, University of Potsdam, Germany. E-mail: [email protected] Potsdam, Germany3BGR Hannover, Germany4University of Hamburg, Germany
Accepted 2013 February 5. Received 2013 February 4; in original form 2012 March 01
S U M M A R YReliable estimations of magnitude of completeness (Mc) are essential for a correct interpre-tation of seismic catalogues. The spatial distribution of Mc may be strongly variable anddifficult to assess in mining environments, owing to the presence of galleries, cavities, frac-tured regions, porous media and different mineralogical bodies, as well as in consequenceof inhomogeneous spatial distribution of the seismicity. We apply a 3-D modification of theprobabilistic magnitude of completeness (PMC) method, which relies on the analysis of net-work detection capabilities. In our approach, the probability to detect an event depends on itsmagnitude, source–receiver Euclidian distance and source–receiver direction. The suggestedmethod is proposed for study of the spatial distribution of the magnitude of completenessin a mining environment and here is applied to a 2-months acoustic emission (AE) data setrecorded at the Morsleben salt mine, Germany. The dense seismic network and the large dataset, which includes more than one million events, enable a detailed testing of the method. Thismethod is proposed specifically for strongly heterogeneous media. Besides, it can also be usedfor specific network installations, with sensors with a sensitivity, dependent on the directionof the incoming wave (e.g. some piezoelectric sensors). In absence of strong heterogeneities,the standards PMC approach should be used. We show that the PMC estimations in minesstrongly depend on the source–receiver direction, and cannot be correctly accounted using astandard PMC approach. However, results can be improved, when adopting the proposed 3-Dmodification of the PMC method. Our analysis of one central horizontal and vertical sectionyields a magnitude of completeness of about Mc ≈ 1 (AE magnitude) at the centre of thenetwork, which increases up to Mc ≈ 4 at further distances outside the network; the best de-tection performance is estimated for a NNE–SSE elongated region, which corresponds to thestrike direction of the low-attenuating salt body. Our approach provides us with small-scaledetails about the capability of sensors to detect an earthquake, which can be linked to thepresence of heterogeneities in specific directions. Reduced detection performance in presenceof strong structural heterogeneities (cavities) is confirmed by synthetic waveform modellingin heterogeneous media.
Key words: Seismic attenuation; Statistical seismology.
I N T RO D U C T I O N
A first outcome of seismic monitoring is the compilation of seismiccatalogues for the monitored region. The assessment of earthquakecatalogue completeness is essential for statistical analysis of seis-micity and to understand the capabilities of recording networks
(Schorlemmer & Woessner 2008). The completeness of a cataloguedepends on several factors, including network geometry, instrumen-tation, magnitude and spatiotemporal distribution of seismicity andattenuation of the seismic signals. The magnitude of completeness(Mc) is defined as the lowest magnitude for which all earthquakeswith higher magnitudes can be detected (Rydelek & Sacks 1989;
1556 C© The Authors 2013. Published by Oxford University Press on behalf of The Royal Astronomical Society.
Detection probability in strongly heterogeneous media 1557
Woessner & Wiemer 2005). A reliable Mc determination is vital fornumerous seismicity and hazard-related studies, such as analysisof rate changes, calculation and mapping of seismicity parame-ters, static and dynamic triggering, probabilistic seismic hazard as-sessment and earthquake forecasting. If the frequency–magnitudedistribution (FMD) of earthquake catalogues obeys the Gutenberg–Richter law (Gutenberg & Richter 1944), Mc can be defined as theminimum magnitude at which the cumulative FMD departs fromthe linear trend (Zuniga & Wyss 1995).
Seismic networks in mines are located in complex observa-tional volumes, which contain different geological units and cav-ities. The static and dynamic properties in mines vary strongly inspace (Cichowicz et al. 1988; Milev & Spottiswoode 2002). Localheterogeneities influence the seismic wave field in mines signifi-cantly and the very high frequency signals, which are monitored(Maxwell & Young 1998). In mining environments, Mc may there-fore show strong spatial variations. A number of statistical tech-niques are available to compute Mc, most of them assuming the va-lidity of the Gutenberg–Richter law and are based on catalogue data.These methods include goodness-of-fit test—GFT (Wiemer & Wyss2000), Mc-estimation based on the b-value stability—MBS (Cao &Gao 2002), entire magnitude range (EMR) approach (Woessner &Wiemer 2005), maximum curvature technique (MAXC; Wyss et al.1999; Wiemer & Wyss 2000) and median-based analysis of thesegment slope (MBASS; Amorese 2007).
The determination of Mc for larger regions using catalogue-basedmethods, and neglecting small-scale heterogeneities, may lead to er-roneous estimations. Better estimations could be obtained by com-puting Mc for smaller regions. However, this will decrease the num-ber of available events, and the estimation of Mc may get less accu-rate or even will be impossible for those cells where the number ofevents is too small. Furthermore, the application of all these exist-ing approaches relies on several assumptions. Beside the validity ofGutenberg–Richter power-law distribution, which does not alwayshold, the completeness should be constant within earthquake sam-ples and temporal variations can be neglected, which is both oftennot true in mining environments (for more details see Schorlemmer& Woessner 2008).
Given these limitations for inhomogeneous catalogues, Schor-lemmer & Woessner (2008) proposed an alternative method, namelythe probability-based magnitude of completeness (PMC), whichuses the phase data, station information and network attenuation re-lations to estimate earthquake detection probabilities. This methoddoes not assume a power-law behaviour of earthquake magnitudes.It has been applied to different regional networks to assess the spa-tial distribution of the magnitude of completeness. The proposedPMC method was first applied to assess the spatial distribution ofMc using the southern California seismic network (Schorlemmer& Woessner 2008), and later to different regions and seismic net-works (Schorlemmer 2009; Nanjo et al. 2010; Schorlemmer et al.2010; Gentili et al. 2011). However, the PMC approach is basedon the assumption that the probability of detecting an event is onlydependent on its magnitude and distance to the sensor. In miningenvironments, as well as in other regions characterized by strongattenuation anomalies and structural heterogeneities, the expectedsignal amplitudes and the sensor detection thresholds may signifi-cantly vary depending on the direction of the incoming wave front.
Plenkers et al. (2011) first applied the PMC analysis to studydetection probabilities and completeness in a gold mine, using anetwork of 8 AE sensors combined with one triaxial accelerometer.The authors proposed to define probability of detection at each sen-sor, based on magnitude, Euclidian distance, depth and azimuth, and
showed that the probability of detection depends on ray paths andis influenced by local heterogeneities. They apply a coarser binningwhen calculating the 3-D completeness distribution and divide thecatalogue into subcatalogues that represent areas of homogeneouscompleteness.
We propose a different extension of the standard PMC approach,applicable to study strongly heterogeneous environments in largermine networks, and show its application to an appropriate data set,which allows a detailed comparison and test of the methodology. Weanalyse the acoustic emission (AE) catalogue from the MorslebenMine, Saxony-Anhalt, Germany, consisting of more than one mil-lion events recorded during 2 months. Given the large data set, weare able to consider six preferential directions at each sensor, whichhave been chosen according to the galleries geometry. We show thatthe detection probabilities are strongly direction-dependent and thatthe corresponding Mc estimations are significantly influenced by thisfact. Our study demonstrates the importance of taking account of3-D effects in strongly heterogeneous environments such as minesto get reliable Mc estimations based on PMC network methodology.
A E C ATA L O G U E , M O R S L E B E N S A LTM I N E
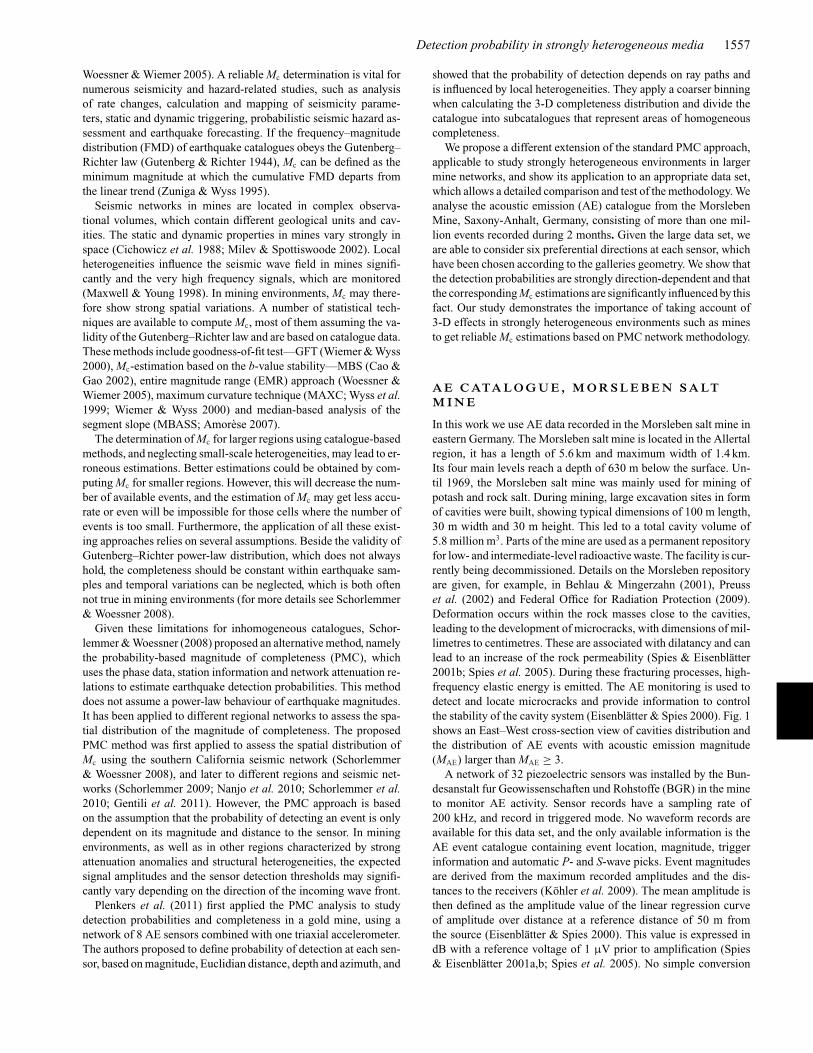
In this work we use AE data recorded in the Morsleben salt mine ineastern Germany. The Morsleben salt mine is located in the Allertalregion, it has a length of 5.6 km and maximum width of 1.4 km.Its four main levels reach a depth of 630 m below the surface. Un-til 1969, the Morsleben salt mine was mainly used for mining ofpotash and rock salt. During mining, large excavation sites in formof cavities were built, showing typical dimensions of 100 m length,30 m width and 30 m height. This led to a total cavity volume of5.8 million m3. Parts of the mine are used as a permanent repositoryfor low- and intermediate-level radioactive waste. The facility is cur-rently being decommissioned. Details on the Morsleben repositoryare given, for example, in Behlau & Mingerzahn (2001), Preusset al. (2002) and Federal Office for Radiation Protection (2009).Deformation occurs within the rock masses close to the cavities,leading to the development of microcracks, with dimensions of mil-limetres to centimetres. These are associated with dilatancy and canlead to an increase of the rock permeability (Spies & Eisenblatter2001b; Spies et al. 2005). During these fracturing processes, high-frequency elastic energy is emitted. The AE monitoring is used todetect and locate microcracks and provide information to controlthe stability of the cavity system (Eisenblatter & Spies 2000). Fig. 1shows an East–West cross-section view of cavities distribution andthe distribution of AE events with acoustic emission magnitude(MAE) larger than MAE ≥ 3.
A network of 32 piezoelectric sensors was installed by the Bun-desanstalt fur Geowissenschaften und Rohstoffe (BGR) in the mineto monitor AE activity. Sensor records have a sampling rate of200 kHz, and record in triggered mode. No waveform records areavailable for this data set, and the only available information is theAE event catalogue containing event location, magnitude, triggerinformation and automatic P- and S-wave picks. Event magnitudesare derived from the maximum recorded amplitudes and the dis-tances to the receivers (Kohler et al. 2009). The mean amplitude isthen defined as the amplitude value of the linear regression curveof amplitude over distance at a reference distance of 50 m fromthe source (Eisenblatter & Spies 2000). This value is expressed indB with a reference voltage of 1 µV prior to amplification (Spies& Eisenblatter 2001a,b; Spies et al. 2005). No simple conversion
1558 S. Maghsoudi et al.
Figure 1. Overview of the study region in the mine and the AE receiver network. East–west cross-section view shows the distribution of cavities (grey and redoutlines), the locations of the AE receivers (black triangles) and the distribution of AE activity with a magnitude MAE ≥ 3.
to commonly used magnitudes like Mw or ML is possible. Scalingrelations for these magnitudes are only valid for large or moder-ate events (Hanks & Boore 1984; Ben-Zion & Zhu 2002), whileKwiatek et al. (2011) showed that scaling relations are preserveddown to at least magnitude −4.1, when using AE sensors.
Cox & Meredith (1993) suggested that the examination of thedistribution of AE event amplitudes may be described by a power lawsuch as the Gutenberg–Richter distribution proposed for earthquakecatalogues.
log10(N ) = a − bM, (1)
where N is the cumulative number of earthquakes with magni-tudes larger than M (which is a logarithmic scale of instrumentallyrecorded amplitudes) and a and b are constants. To produce thesame form of the FMD for AE events, amplitudes reported in dBwere divided by 20, due to the fact that the AE peak amplitudeis measured in dB whereas the earthquake magnitude used in theGutenberg–Richter distribution is defined in terms of the logarithmof maximum amplitudes. This is a common approach to calculateb-values of AE events which is dimensionless and independent ofinstrumental sensitivity (e.g. Cox & Meredith 1993; Becker et al.2010).
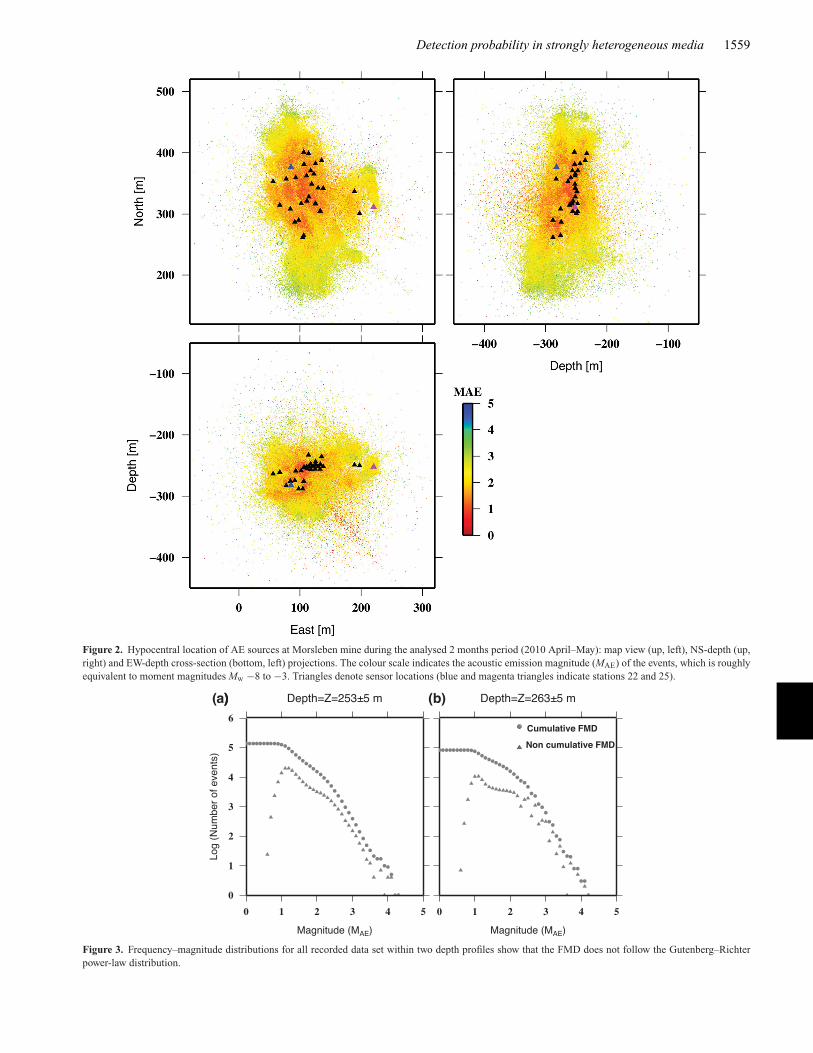
For our analysis, we use a catalogue of AE-events recorded during2 months (2010 April–May). During this period, 100 5927 eventswere detected. Fig. 2 shows the distribution of events which areconcentrated close to the network and at the depth range 250–270 m with MAE in the range 0–5. Assuming empirical energyrelations (Eisenblatter & Spies 2000), these MAE values result inmoment magnitudes ∼Mw −8 up to −3. In this study we derivethe 3-D detection probability for each sensor in the network (as afunction of magnitude, distance and source-sensor preferential di-rections) and combine the results from the single sensors to derive3-D maps of the detection probability and the magnitude of com-pleteness. We focus for visualization on two profiles (a horizontallayer in the depth range of Z = 253 ± 5 m and a cross-section atEW X = 85 ± 5 m), where most sensors are located and the numberof recorded events is highest.
Application of most catalogue-based methods needs the assump-tion that the FMD follows the Gutenberg–Richter law (eq. 1).
We analysed the FMD of the whole data set and for differentdepth profiles, finding in some cases significant deviations fromthe Gutenberg–Richter power-law distribution. In particular someFMDs show characteristic kinks (see Fig. 3). Therefore, we firstinvestigated whether the anomaly in the FMD distribution might bea consequence of temporal changes in the recording network. How-ever, when considering only events recorded in time periods, witha homogeneous network configuration, we still observe anoma-lous FMDs. Therefore, we conclude that the deviation from theGutenberg–Richter law does not stem from temporal changes in thenetwork configuration. We also considered the possibility that thedeviations from the Gutenberg–Richter law might result from thesuperposition of different regions with varying b-values and/or com-pleteness magnitudes. For that purpose, we analysed the FMDs forsubvolumes, finding out that the kinks appear only in some cells.Multimodal FMDs have been often observed in mining environ-ments (e.g. Gibowicz & Kijko 1994), who suggested some physicalreasons to explain these features. A reasonable hypothesis is thatthey are the results of strong structural inhomogeneities, such ascavities or different geological bodies, which affect the small-scaledistribution of the medium properties, local stresses and stress rates.In our case, the observation of kinks in the FMDs would suggestthat the spatial scale of these anomalies is smaller than our resolu-tion power. Because of the deviations from the Gutenberg–Richterdistribution, which is observed for many cells, the application ofcatalogue-based approach for the whole mine cannot provide re-liable estimations of Mc in our case. The Gutenberg–Richter lawmay be satisfied for smaller cells, but this would reduce the numberof events per cell and thus limit the application of catalogue-basedmethods.
N E T W O R K - B A S E D M E T H O D T OE S T I M AT E Mc
The probabilistic magnitude of completeness (PMC) method wasdeveloped to analyse detection probability of seismic networks andspatial variations of completeness with high resolution (Schorlem-mer & Woessner 2008). This method is based on the analysisof detection probabilities of seismic events and does not assume
Detection probability in strongly heterogeneous media 1559
Figure 2. Hypocentral location of AE sources at Morsleben mine during the analysed 2 months period (2010 April–May): map view (up, left), NS-depth (up,right) and EW-depth cross-section (bottom, left) projections. The colour scale indicates the acoustic emission magnitude (MAE) of the events, which is roughlyequivalent to moment magnitudes Mw −8 to −3. Triangles denote sensor locations (blue and magenta triangles indicate stations 22 and 25).
Figure 3. Frequency–magnitude distributions for all recorded data set within two depth profiles show that the FMD does not follow the Gutenberg–Richterpower-law distribution.
1560 S. Maghsoudi et al.
a Gutenberg–Richter distribution of the earthquake catalogues.The analysis is performed in different steps (full details are givenin Schorlemmer & Woessner 2008): first, the probability of detec-tion is derived for each station in the network; then, the detectionprobabilities for different stations are combined into a probabilityof detection for the whole seismic network. In a last step, the spatialdistributions of network detection probabilities are used to derivea map of completeness. This analysis was originally developed forregional seismic networks, covering an extension of hundreds ofkilometres and being composed of surface stations (Schorlemmer& Woessner 2008; Nanjo et al. 2010) and depends only on magni-tude, distance and time.
The PMC method uses the phase data, including earthquake cat-alogues, stations information and attenuation relations to determinemagnitudes in the network. According to Schorlemmer and Woess-ner the detection probability PD,i(M,L) at a given station i is definedas a function of magnitude M and source–receiver distance L, asthe ratio of the number of located events picked at this station overthe overall number of events located by the network. The detectionprobability for a given earthquake with magnitude M at location xand for time t can be defined for a given station i as PD,i(M,x(L),t),where the effects of source–receiver geometry are only accountedby means of a distance L. Then, the detection probability of an eventwith magnitude M and given location x can be defined for the wholenetwork, as the joint probability that a minimum number of stationshave detected this event:
PE (M, x, t) = f (PD,i (M, x(L), t)) . (2)
The minimum number of stations must be adjusted to the trig-gering conditions of the network. The probabilistic magnitude ofcompleteness (MP) at location x and time t is derived by searching
the smallest magnitude M that represents the desired probability ofdetection level (Schorlemmer & Woessner 2008):
MP (M, x, t) = min M |PE (M, x, t) = 1 − Q , (3)
where Q is the complementary probability that an event will bemissed.
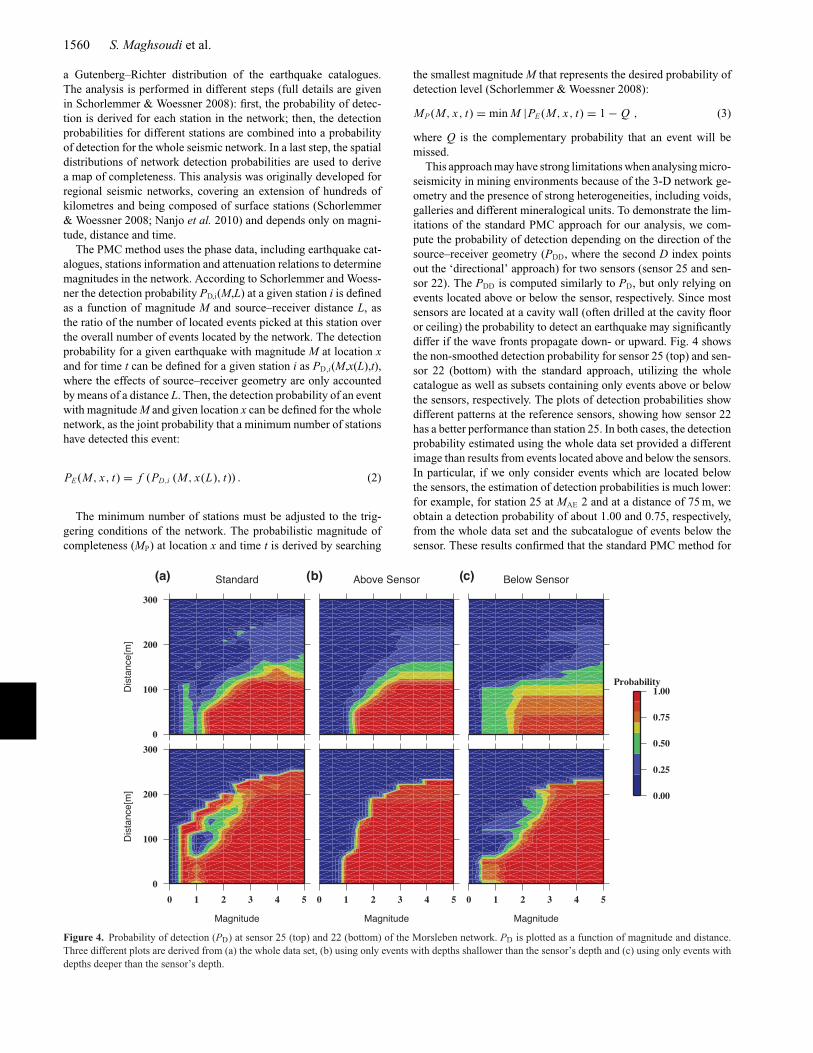
This approach may have strong limitations when analysing micro-seismicity in mining environments because of the 3-D network ge-ometry and the presence of strong heterogeneities, including voids,galleries and different mineralogical units. To demonstrate the lim-itations of the standard PMC approach for our analysis, we com-pute the probability of detection depending on the direction of thesource–receiver geometry (PDD, where the second D index pointsout the ‘directional’ approach) for two sensors (sensor 25 and sen-sor 22). The PDD is computed similarly to PD, but only relying onevents located above or below the sensor, respectively. Since mostsensors are located at a cavity wall (often drilled at the cavity flooror ceiling) the probability to detect an earthquake may significantlydiffer if the wave fronts propagate down- or upward. Fig. 4 showsthe non-smoothed detection probability for sensor 25 (top) and sen-sor 22 (bottom) with the standard approach, utilizing the wholecatalogue as well as subsets containing only events above or belowthe sensors, respectively. The plots of detection probabilities showdifferent patterns at the reference sensors, showing how sensor 22has a better performance than station 25. In both cases, the detectionprobability estimated using the whole data set provided a differentimage than results from events located above and below the sensors.In particular, if we only consider events which are located belowthe sensors, the estimation of detection probabilities is much lower:for example, for station 25 at MAE 2 and at a distance of 75 m, weobtain a detection probability of about 1.00 and 0.75, respectively,from the whole data set and the subcatalogue of events below thesensor. These results confirmed that the standard PMC method for
Figure 4. Probability of detection (PD) at sensor 25 (top) and 22 (bottom) of the Morsleben network. PD is plotted as a function of magnitude and distance.Three different plots are derived from (a) the whole data set, (b) using only events with depths shallower than the sensor’s depth and (c) using only events withdepths deeper than the sensor’s depth.
Detection probability in strongly heterogeneous media 1561
mining networks, with detection probability only defined as a func-tion of magnitude and distance, cannot provide stable estimationsfor probability of detection and magnitude of completeness. Be-cause of these differences, and given the observed sensitivity to thedirection of observation, we will further modify the PMC methodbased on the event magnitude, source–receiver distance and direc-tion.
P RO B A B I L I T Y O F D E T E C T I O N F O RM I N I N G E N V I RO N M E N T S
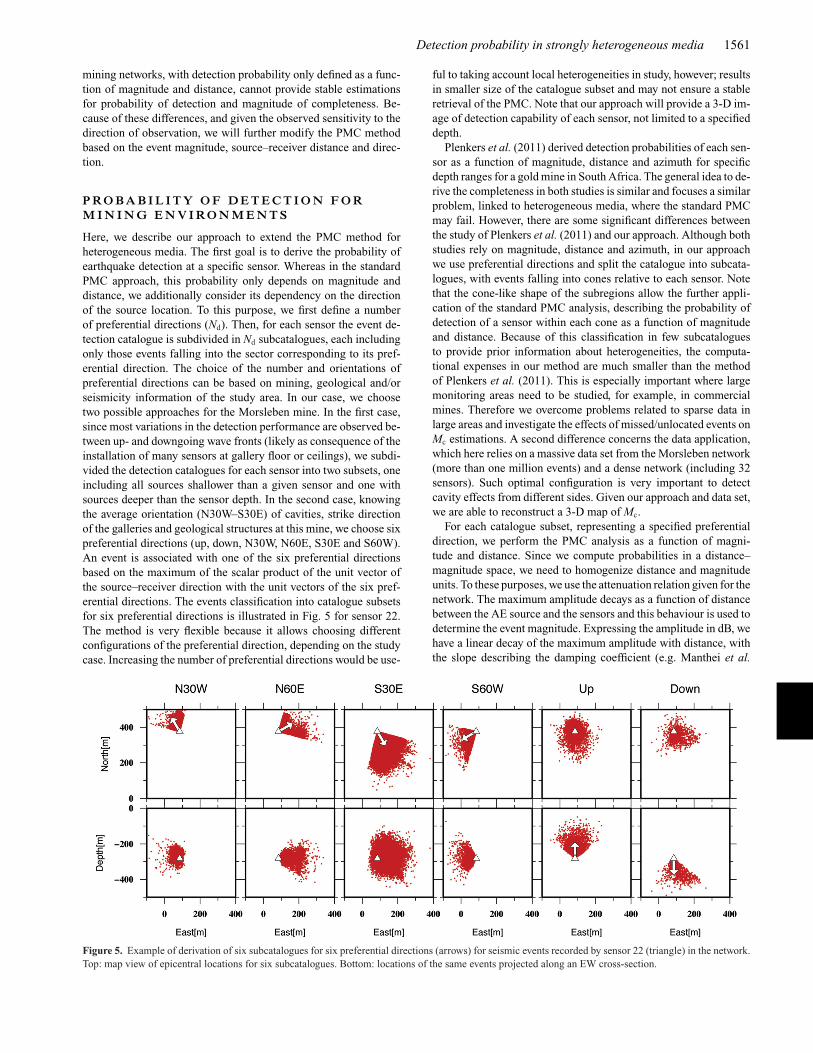
Here, we describe our approach to extend the PMC method forheterogeneous media. The first goal is to derive the probability ofearthquake detection at a specific sensor. Whereas in the standardPMC approach, this probability only depends on magnitude anddistance, we additionally consider its dependency on the directionof the source location. To this purpose, we first define a numberof preferential directions (Nd). Then, for each sensor the event de-tection catalogue is subdivided in Nd subcatalogues, each includingonly those events falling into the sector corresponding to its pref-erential direction. The choice of the number and orientations ofpreferential directions can be based on mining, geological and/orseismicity information of the study area. In our case, we choosetwo possible approaches for the Morsleben mine. In the first case,since most variations in the detection performance are observed be-tween up- and downgoing wave fronts (likely as consequence of theinstallation of many sensors at gallery floor or ceilings), we subdi-vided the detection catalogues for each sensor into two subsets, oneincluding all sources shallower than a given sensor and one withsources deeper than the sensor depth. In the second case, knowingthe average orientation (N30W–S30E) of cavities, strike directionof the galleries and geological structures at this mine, we choose sixpreferential directions (up, down, N30W, N60E, S30E and S60W).An event is associated with one of the six preferential directionsbased on the maximum of the scalar product of the unit vector ofthe source–receiver direction with the unit vectors of the six pref-erential directions. The events classification into catalogue subsetsfor six preferential directions is illustrated in Fig. 5 for sensor 22.The method is very flexible because it allows choosing differentconfigurations of the preferential direction, depending on the studycase. Increasing the number of preferential directions would be use-
ful to taking account local heterogeneities in study, however; resultsin smaller size of the catalogue subset and may not ensure a stableretrieval of the PMC. Note that our approach will provide a 3-D im-age of detection capability of each sensor, not limited to a specifieddepth.
Plenkers et al. (2011) derived detection probabilities of each sen-sor as a function of magnitude, distance and azimuth for specificdepth ranges for a gold mine in South Africa. The general idea to de-rive the completeness in both studies is similar and focuses a similarproblem, linked to heterogeneous media, where the standard PMCmay fail. However, there are some significant differences betweenthe study of Plenkers et al. (2011) and our approach. Although bothstudies rely on magnitude, distance and azimuth, in our approachwe use preferential directions and split the catalogue into subcata-logues, with events falling into cones relative to each sensor. Notethat the cone-like shape of the subregions allow the further appli-cation of the standard PMC analysis, describing the probability ofdetection of a sensor within each cone as a function of magnitudeand distance. Because of this classification in few subcataloguesto provide prior information about heterogeneities, the computa-tional expenses in our method are much smaller than the methodof Plenkers et al. (2011). This is especially important where largemonitoring areas need to be studied, for example, in commercialmines. Therefore we overcome problems related to sparse data inlarge areas and investigate the effects of missed/unlocated events onMc estimations. A second difference concerns the data application,which here relies on a massive data set from the Morsleben network(more than one million events) and a dense network (including 32sensors). Such optimal configuration is very important to detectcavity effects from different sides. Given our approach and data set,we are able to reconstruct a 3-D map of Mc.
For each catalogue subset, representing a specified preferentialdirection, we perform the PMC analysis as a function of magni-tude and distance. Since we compute probabilities in a distance–magnitude space, we need to homogenize distance and magnitudeunits. To these purposes, we use the attenuation relation given for thenetwork. The maximum amplitude decays as a function of distancebetween the AE source and the sensors and this behaviour is used todetermine the event magnitude. Expressing the amplitude in dB, wehave a linear decay of the maximum amplitude with distance, withthe slope describing the damping coefficient (e.g. Manthei et al.
Figure 5. Example of derivation of six subcatalogues for six preferential directions (arrows) for seismic events recorded by sensor 22 (triangle) in the network.Top: map view of epicentral locations for six subcatalogues. Bottom: locations of the same events projected along an EW cross-section.

1562 S. Maghsoudi et al.
Figure 6. Probability of detection for sensor six (top) and sensor 22 (bottom) of Morsleben network, as a function of distance and magnitude, following thestandard PMC approach. (a) Unprocessed results, (b) smoothed results according to Schorlemmer & Woessner (2008) and (c) smoothed results according tothis study. (d) Probability as a function of distance for a magnitude MAE = 2 (dashed black lines on the left plots), using the standard smoothing (red lines) andthe smoothing proposed in this study (blue dashed lines). This figure shows the effects of different smoothing approaches: the method adopted in the standardPMC approach can hide anomalous distance-dependent detection pattern, which might be related to cavities and/or structural heterogeneities.
2006). Kohler et al. (2009) estimated a slope of (−0.26) dB m−1.The event magnitude would then be defined from the amplitude ex-pected for a reference distance of 50 m. According to the discussionon eq. (1), we use a fixed ratio of 20 to scale amplitudes to AEmagnitudes. We can finally infer that a distance variation of 100 m,would imply an amplitude increase of 26 dB, and thus is equivalentto a magnitude variation of 1.3. This relation is used to define aEuclidian distance in the magnitude–distance space, and to convertdata triplets to detection probabilities, according to Schorlemmer &Woessner (2008).
We define PDD,ij(M, L) as the detection probability for magnitudeM and distance L at station i from preferential direction j. PDD foreach station and preferential direction will be defined consistently asin standard PMC, as the ratio between the number of triggers and thenumber of events. To derive the detection probabilities for events ofgiven magnitude, distance and given preferential direction to sensor,we apply the same criterion as used in the standard PMC method bySchorlemmer & Woessner (2008). Because of the extremely highnumber of recorded events, we changed the original assumptionfor the sufficient number of events per bin and set it to 100. Thisleads to a more conservative and robust estimation of probabilities.Following our modifications, the detection probability for a givenearthquake with magnitude M at location x (and for time t) will bedefined for a given station i as PDD, ij(x) (M, x(L),t). Now, the effectsof source–receiver geometry are considered in the choice of theclosest preferential direction j and the distance L.
Schorlemmer & Woessner (2008) suggested two simple physicalconstraints to obtain a smoothed distribution for the probability ofdetection: the detection probability cannot decrease (1) at smaller
distances for the same magnitude and (2) for larger magnitudesat the same distance. This smoothing algorithm was proposed toremove artefacts due to sparse data, and relies on reasonable as-sumptions, when dealing with seismic waveforms propagating inhomogeneous media. However, this approach may hide featuresstemming from heterogeneities and cavity effects. For some sen-sors at the Morsleben mine, the probability of detection showssome anomalies with respect to this expected behaviour. For ex-ample, regions of low detection probabilities can be seen, in fewcases, within regions of higher probabilities (Fig. 6). Following thesmoothing approach, these features would be removed. However,in the case of mining networks, we believe they may be related tocavities and/or structural heterogeneities. Thus, we prefer to im-plement a different smoothing approach, which assumes that thedetection probability cannot increase for smaller magnitude at thesame distance, but does not assume that the detection probabilitymust decrease with distance. An increment of detection probabilitywith distance may occur, if a large cavity is present between thesource and the receiver, in the region behind a cavity. This effectis discussed in the synthetic modelling section. Fig. 6 shows theexamples of the detection probabilities for two sensors (six and 22)and the smoothed distributions resulting from both approaches. Thedifferences among smoothed probabilities indicate that our choiceis more conservative, because it accounts for the possible effectsassociated to structural heterogeneities or cavities. The problem isfurther discussed in the synthetic waveform modelling section.
In the second step, sensor detection probabilities are computedfor a given magnitude at a given location for all sensors. This processis similar to the one proposed by Schorlemmer & Woessner (2008),
Detection probability in strongly heterogeneous media 1563
but it also relies on the sensor detection probabilities for differentpreferential directions. We can compute a detection probability mapfor the network, for a given magnitude. First, for each gridpoint, wecompute the distance and direction to each sensor, and extract theprobability of detection PDD,ij for the given magnitude, distance andpreferential direction (closest to the sensor–grid vector). Then, theprobabilities at all sensors are merged to estimate the network de-tection probability (PED). This step takes into account the minimumnumber of triggers, which are needed for the detection of an event(in the case of the Morsleben data set five station triggers are neededfor event detection). The repeated computation for a full range ofmagnitudes (here 0 ≤ MAE ≤ 5) provides a description of detec-tion probabilities for each grid cell and magnitude. These detectionprobabilities are used to derive the magnitude of completeness, bysearching the smallest magnitude that reflects earthquake detectionwith the desired probability. The choice of Q reflects the desiredaccuracy. Since the choice of Q value is arbitrary, we test differentQ values, and choose Q = 0.001 to obtain conservative estimates.
R E S U LT S
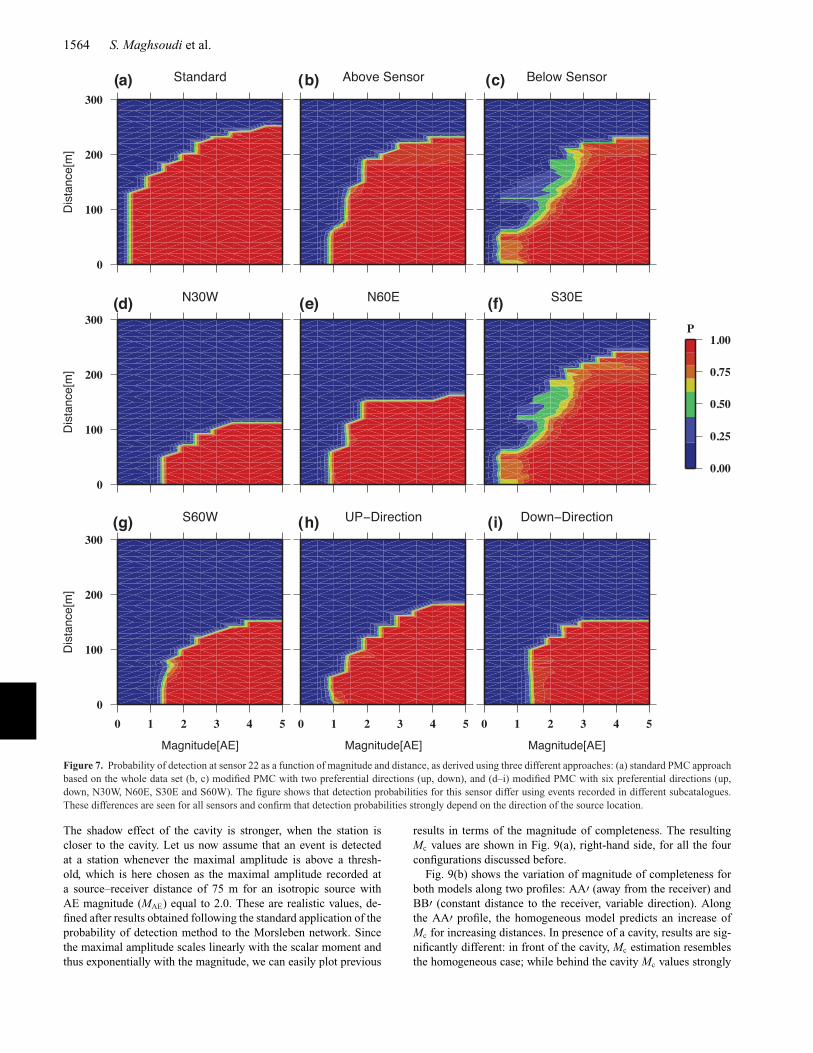
In the following, we estimate the spatial distribution of detectionprobabilities and magnitude of completeness for the Morslebennetwork using 10 m grid spacing in North and East at a horizontaldepth section profile (z = 253 ± 5 m) and an EW cross-section(x = 85 ± 5 m) where the seismicity is more concentrated. First,we obtain the probability of detection at each station. Fig. 7 showsthe detection probabilities for sensor 22 following the standardPMC approach and considering two (above and below the sensor)and six preferential directions. The differences observed betweendetection probabilities in different directions confirm once more thedirectional dependency of PED; for example, detection probabilitiesof this sensor are larger for events located towards South and abovethe sensor, rather than towards North and below it. The standardPMC tends, in this case, to overestimate the probability that eventsare detected; for example, an event with MAE = 3 at 200 m distancehas a detection probability of 92 per cent, whereas probabilitiesare always below 10 per cent, in our modified approach, except forevents located towards S30E (71 per cent).
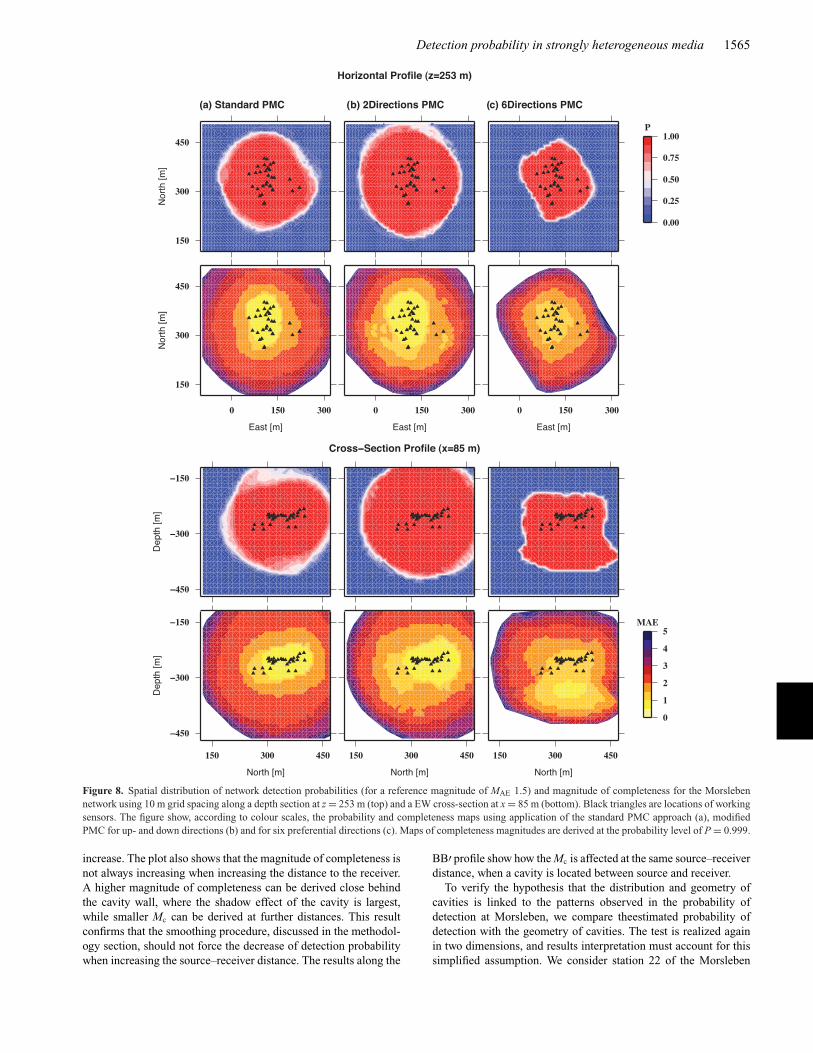
The results of the detection probabilities and magnitudes of com-pleteness for the entire network (30 sensors are used, sensor 10and 21 were removed due to a very low detection capability) areillustrated in Fig. 8, where detection probabilities are shown forMAE 1.5, for one map view and a cross-section profile. Detectionprobabilities extracted from the standard approach of PMC andtwo-directions PMC show similar spatial distributions, althoughthe second approach tends to identify a region of high probabili-ties more extend in North–South direction rather than East–Westdirection. The magnitude of completeness is plotted in Fig. 8 for adetection probability of 0.999. Standard and two-directional PMCapproaches indicate a magnitude of completeness of Mc ≈ 0.5 in acentral region elongated in North–South direction; the magnitudeof completeness rises (faster for the standard PMC than for the two-direction approach) when moving far from the network. In general,since detection probabilities and magnitude of completeness de-pend on the Euclidian distance between sensors and source, theirestimations for different source depths will change.
Completeness distributions computed from PMC analysis con-sidering six preferential directions for two profiles show a differentpattern. Assuming again a reference magnitude of MAE 1.5, for thedepth section, high detection probabilities are only predicted for
a small region, close to the network, compared to the two otherapproaches (standard PMC, depth-dependent PMC). The Mc esti-mate in the centre of the network is about Mc ≈ 1 and increasesup to Mc ≈ 4 at the boundaries of the study region. At about150 m from the centre of the network, the detection probability,even for the largest magnitude events in the catalogue, cannot reachthe chosen threshold of 0.999. The cross-section plot illustrates thatthe detection probability is highest in a small region around thecentre of the network and elongated below the sensors. Estimationof the completeness distribution along the EW cross section using a10 m grid shows this region with high probabilities of detection andlow magnitudes of completeness (Mc ≈ 0.5) below the centre ofthe network. The small number of events (Fig. 2, right) recorded inthis region may significantly affect the completeness estimation. Mc
reaches up to about 1 at the centre of the network; Mc variations areminor along the NW–SE direction (Mc ≈ 0.5–2.5), compared to theNE–SW direction (Mc ≈ 1–4).
These results show that the detection performance of theMorsleben network changes strongly, when considering differenthypocentral regions. Highest detection probabilities and lowestmagnitudes of completeness are somehow confined to a smallerregion, which extends along a NNW–SSE direction, rather than N–S; the NNW–SSE orientation corresponds to the strike of the saltstructure in the region (e.g. Best 1996). A similar analysis at differ-ent depths consistently indicates such general pattern, with a regionof low Mc elongated according to the salt body geometry.
E F F E C T S O F A C AV I T Y O N S Y N T H E T I CWAV E F O R M S A N D D E T E C T I O NP RO B A B I L I T Y
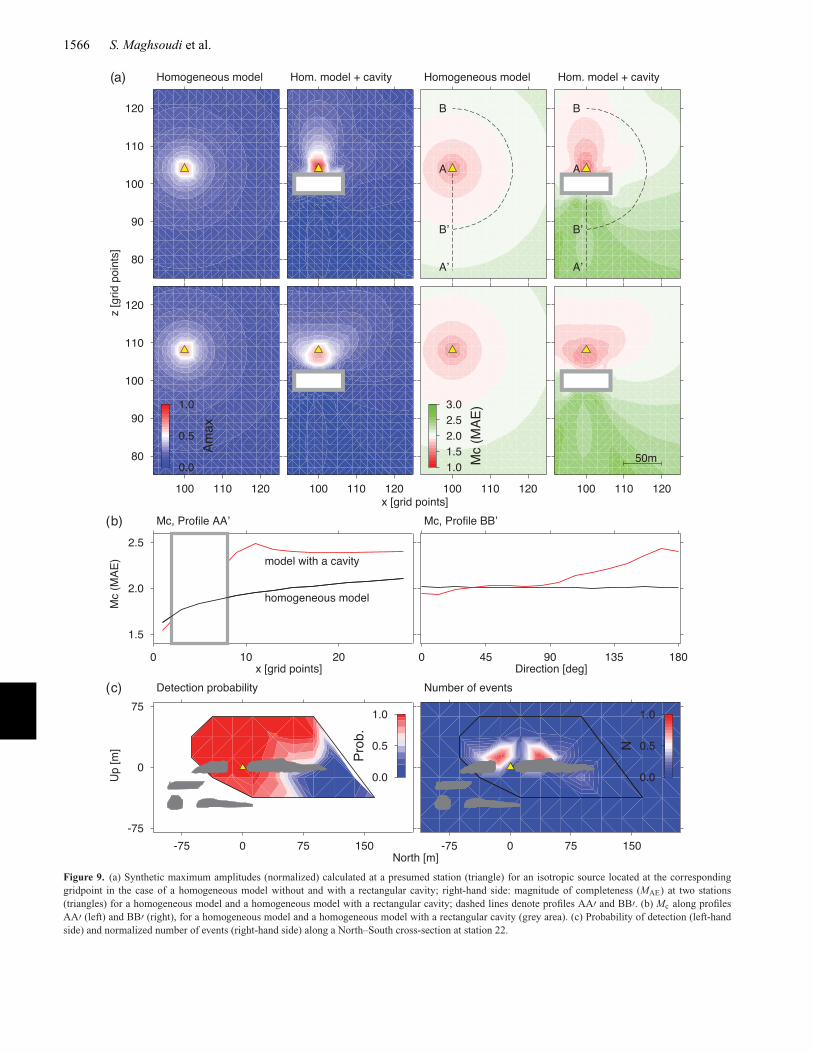
In this section we investigate the effects of the presence of cavities,in terms of detection probability and magnitude of completeness,with the simplified synthetic tests. In these simulations, we focuson the forward modelling in two dimensions. Qualitative resultscan be extrapolated to the 3-D case. Synthetic seismograms havebeen computed using the E3D code (Larsen & Grieger 1998). First,we consider a homogeneous 2-D medium (Vp = 4.7 km s−1, Vs =2.7 km s−1, 2.5 g cm−3), choose a station location and iterativelyestimate the maximal velocity for isotropic sources located at eachpossible location in the model. The entire model has a spatial ex-tension of 1 × 1 km, with a grid step of 5 m. Synthetic velocityseismograms in the radial direction are estimated assuming an ex-plosive point source. Results are shown for two different stationlocations in Fig. 9(a), where the scale refers to normalized ampli-tudes. In the case that the model is homogeneous, the amplitudedecay is only dependent on the geometrical spreading and attenu-ation, and therefore the maximal amplitudes decay symmetricallyin each direction away from the station. The maximal amplitudedepends here only on the source–receiver distance.
In the second case, we include a rectangular cavity of 50 ×25 m. The cavity is located below the stations; the distances be-tween the closest boundary and the two stations are 10 and 30 m.The patterns of the maximal amplitudes recorded at the two sta-tions are highly affected by the presence of the cavity (Fig. 9a,right). While the cavity acts as a barrier for sources located belowit, which are shadowed by its presence, the interference of direct andcavity reflected phase’s increases the maximal amplitudes recordedfor stations above the cavity. Such effect, however, is strictly re-lated to the radiation pattern of the isotropic source we chose, andmay significantly change when using a different focal mechanism.
1564 S. Maghsoudi et al.
Figure 7. Probability of detection at sensor 22 as a function of magnitude and distance, as derived using three different approaches: (a) standard PMC approachbased on the whole data set (b, c) modified PMC with two preferential directions (up, down), and (d–i) modified PMC with six preferential directions (up,down, N30W, N60E, S30E and S60W). The figure shows that detection probabilities for this sensor differ using events recorded in different subcatalogues.These differences are seen for all sensors and confirm that detection probabilities strongly depend on the direction of the source location.
The shadow effect of the cavity is stronger, when the station iscloser to the cavity. Let us now assume that an event is detectedat a station whenever the maximal amplitude is above a thresh-old, which is here chosen as the maximal amplitude recorded ata source–receiver distance of 75 m for an isotropic source withAE magnitude (MAE) equal to 2.0. These are realistic values, de-fined after results obtained following the standard application of theprobability of detection method to the Morsleben network. Sincethe maximal amplitude scales linearly with the scalar moment andthus exponentially with the magnitude, we can easily plot previous
results in terms of the magnitude of completeness. The resultingMc values are shown in Fig. 9(a), right-hand side, for all the fourconfigurations discussed before.
Fig. 9(b) shows the variation of magnitude of completeness forboth models along two profiles: AA′ (away from the receiver) andBB′ (constant distance to the receiver, variable direction). Alongthe AA′ profile, the homogeneous model predicts an increase ofMc for increasing distances. In presence of a cavity, results are sig-nificantly different: in front of the cavity, Mc estimation resemblesthe homogeneous case; while behind the cavity Mc values strongly
Detection probability in strongly heterogeneous media 1565
Figure 8. Spatial distribution of network detection probabilities (for a reference magnitude of MAE 1.5) and magnitude of completeness for the Morslebennetwork using 10 m grid spacing along a depth section at z = 253 m (top) and a EW cross-section at x = 85 m (bottom). Black triangles are locations of workingsensors. The figure show, according to colour scales, the probability and completeness maps using application of the standard PMC approach (a), modifiedPMC for up- and down directions (b) and for six preferential directions (c). Maps of completeness magnitudes are derived at the probability level of P = 0.999.
increase. The plot also shows that the magnitude of completeness isnot always increasing when increasing the distance to the receiver.A higher magnitude of completeness can be derived close behindthe cavity wall, where the shadow effect of the cavity is largest,while smaller Mc can be derived at further distances. This resultconfirms that the smoothing procedure, discussed in the methodol-ogy section, should not force the decrease of detection probabilitywhen increasing the source–receiver distance. The results along the
BB′ profile show how the Mc is affected at the same source–receiverdistance, when a cavity is located between source and receiver.
To verify the hypothesis that the distribution and geometry ofcavities is linked to the patterns observed in the probability ofdetection at Morsleben, we compare theestimated probability ofdetection with the geometry of cavities. The test is realized againin two dimensions, and results interpretation must account for thissimplified assumption. We consider station 22 of the Morsleben
1566 S. Maghsoudi et al.
Figure 9. (a) Synthetic maximum amplitudes (normalized) calculated at a presumed station (triangle) for an isotropic source located at the correspondinggridpoint in the case of a homogeneous model without and with a rectangular cavity; right-hand side: magnitude of completeness (MAE) at two stations(triangles) for a homogeneous model and a homogeneous model with a rectangular cavity; dashed lines denote profiles AA′ and BB′. (b) Mc along profilesAA′ (left) and BB′ (right), for a homogeneous model and a homogeneous model with a rectangular cavity (grey area). (c) Probability of detection (left-handside) and normalized number of events (right-hand side) along a North–South cross-section at station 22.
Detection probability in strongly heterogeneous media 1567
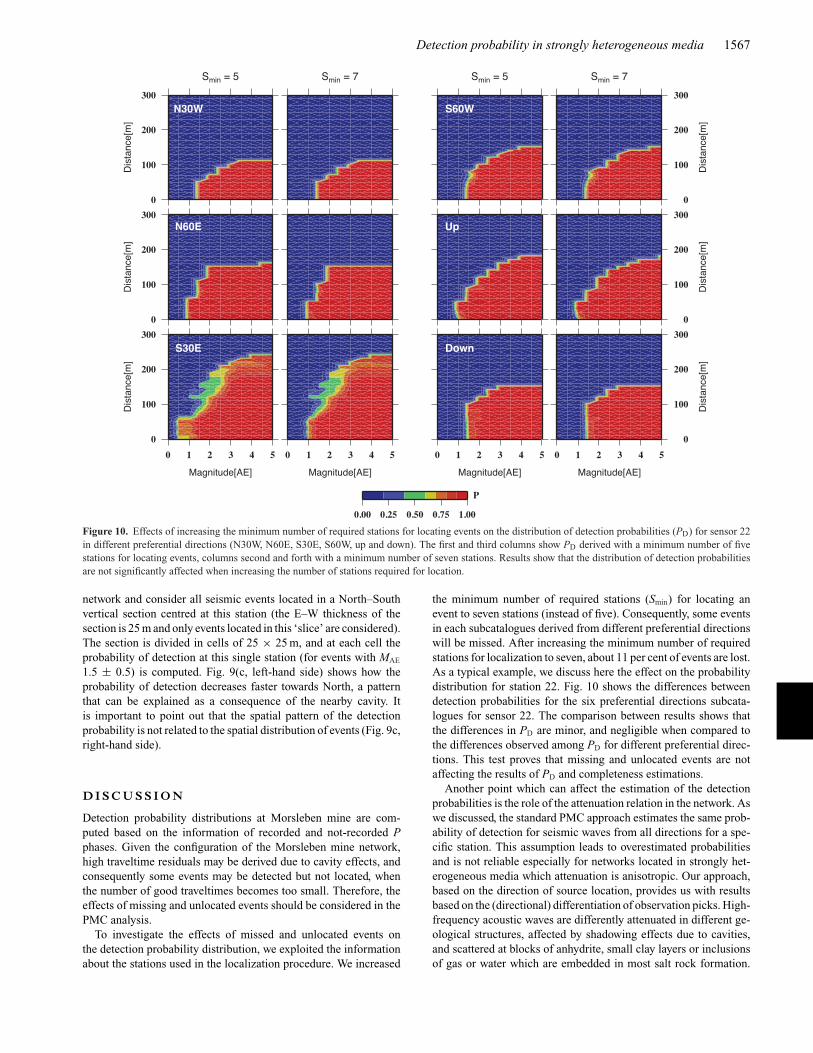
Figure 10. Effects of increasing the minimum number of required stations for locating events on the distribution of detection probabilities (PD) for sensor 22in different preferential directions (N30W, N60E, S30E, S60W, up and down). The first and third columns show PD derived with a minimum number of fivestations for locating events, columns second and forth with a minimum number of seven stations. Results show that the distribution of detection probabilitiesare not significantly affected when increasing the number of stations required for location.
network and consider all seismic events located in a North–Southvertical section centred at this station (the E–W thickness of thesection is 25 m and only events located in this ‘slice’ are considered).The section is divided in cells of 25 × 25 m, and at each cell theprobability of detection at this single station (for events with MAE
1.5 ± 0.5) is computed. Fig. 9(c, left-hand side) shows how theprobability of detection decreases faster towards North, a patternthat can be explained as a consequence of the nearby cavity. Itis important to point out that the spatial pattern of the detectionprobability is not related to the spatial distribution of events (Fig. 9c,right-hand side).
D I S C U S S I O N
Detection probability distributions at Morsleben mine are com-puted based on the information of recorded and not-recorded Pphases. Given the configuration of the Morsleben mine network,high traveltime residuals may be derived due to cavity effects, andconsequently some events may be detected but not located, whenthe number of good traveltimes becomes too small. Therefore, theeffects of missing and unlocated events should be considered in thePMC analysis.
To investigate the effects of missed and unlocated events onthe detection probability distribution, we exploited the informationabout the stations used in the localization procedure. We increased
the minimum number of required stations (Smin) for locating anevent to seven stations (instead of five). Consequently, some eventsin each subcatalogues derived from different preferential directionswill be missed. After increasing the minimum number of requiredstations for localization to seven, about 11 per cent of events are lost.As a typical example, we discuss here the effect on the probabilitydistribution for station 22. Fig. 10 shows the differences betweendetection probabilities for the six preferential directions subcata-logues for sensor 22. The comparison between results shows thatthe differences in PD are minor, and negligible when compared tothe differences observed among PD for different preferential direc-tions. This test proves that missing and unlocated events are notaffecting the results of PD and completeness estimations.
Another point which can affect the estimation of the detectionprobabilities is the role of the attenuation relation in the network. Aswe discussed, the standard PMC approach estimates the same prob-ability of detection for seismic waves from all directions for a spe-cific station. This assumption leads to overestimated probabilitiesand is not reliable especially for networks located in strongly het-erogeneous media which attenuation is anisotropic. Our approach,based on the direction of source location, provides us with resultsbased on the (directional) differentiation of observation picks. High-frequency acoustic waves are differently attenuated in different ge-ological structures, affected by shadowing effects due to cavities,and scattered at blocks of anhydrite, small clay layers or inclusionsof gas or water which are embedded in most salt rock formation.
1568 S. Maghsoudi et al.
These effects may lead to higher attenuation for regions close to thecavities and weaker AE signals, with respect to those attenuated byundisturbed rock salt (Manthei et al. 2006). Considering differentattenuation relations for signals recorded in different settings canimprove the magnitude uncertainty in the analysis and consequentlyimprove detection probabilities. However, considering the unknownboundaries of the attenuation anomalies, and the combined effectsof different bodies (e.g. salt rock and anhydrite) and cavities, it iscurrently not possible to account for them in our approach. Theycould be considered by including a large number of preferentialdirections (e.g. ignoring any a priori information on the geome-try of the mine), or following the approach proposed by Plenkerset al. (2011). Since most events are recorded in the direction of thesalt body, one velocity model (consistent with the salt body) andone attenuation relation is used towards magnitude determinationin the network. In the modified PMC method the effect of cavitiesand highly attenuating bodies is reflected in the decrease of thedetection probability in the specific direction to a sensor. Anotherfactor which may affect the detection probability of an AE sensoris its orientation and coupling with the hosting rock. On one side,piezoelectric sensor amplification is dependent on the direction ofthe incoming seismic wave and detection performance may changedepending on the sensor orientation (Manthei et al. 2001). Also, thesensor coupling with the rock surface may affect the average detec-tion rate, as confirmed by significant variations of the performanceof adjacent sensors. However, according to Plenkers et al. (2011),effects related to sensors orientation may not have a strong influ-ence on the detection probability, when compared to the influenceof structural heterogeneities.
C O N C LU S I O N S
Reliable estimations of the magnitude of completeness, especiallyfor networks in heterogeneous environments, provide valuableknowledge about earthquake statistics and allow a correct inter-pretation of seismic catalogues. In this work, we studied the spatialdistribution of the magnitude of completeness at the Morslebensalt mine by adapting the PMC approach to account for differentsource–receiver directions. A first attempt in this direction has beendone by Plenkers et al. (2011) for a significantly smaller data set ina South African gold mine. We extended this approach and testedit for the much larger data set of the Morsleben mine. Our methodstill relies on the detection capability of each single seismic sensorof a seismic network as the standard PMC, which was proposed forregional surface networks monitoring regions with minor structuralheterogeneities. While the standard PMC approach can provide anoverall detection capability for each sensor and the whole seismicnetwork, it cannot account for effects related to structural hetero-geneities and cavities. These effects are considered in our modifiedapproach, and their importance is confirmed by the observation ofsignificant variations in the detection probability when consideringseismic events located in different directions to the same sensor.The modified PMC approach is suggested for large data sets, withstrong heterogeneities and different geological structures, as they af-fect the wave attenuations to different stations and in along differentpaths. The information on anomalous detection performance couldbe used to infer the geometry of cavities or geological structureunits. The suggested method could also be applied to larger scalesettings where blocks with strongly different attenuation propertiesare in close contact as, for example, at some transform boundariesor in the case of a border between igneous and sedimentary rocks. A
second application to tectonic events could be at subduction zones:deep and shallow events at the same distance to the sensors presentvery different waveforms, and thus the detection performance canchange significantly. However, due to the introduction of subcat-alogues representing the different preferential directions, a muchlarger data set than in the original approach is needed and thus thestandard PMC will remain the method of choice whenever homo-geneous or only moderately heterogeneous regions are studied. Asynthetic test using waveform modelling confirms that the patternsobserved in the detection analysis can be explained as consequenceof heterogeneities and cavities near the sensors.
The modified PMC approach is flexible and can be adapted andapplied to different mines based on the geometry of mining opera-tions and structural details. The modified PMC method can providean image of the spatial distribution of the magnitude of complete-ness. In addition, the method can be used to judge the networkperformance and evaluate future network configurations. The re-sults of the modified PMC approach find that the region of lowestMc at Morsleben mine extends along a NNW–SSE direction, con-sistently with the elongation of the salt body exhibiting low signalattenuation.
Temporal completeness variations can affect different data setsand this can be extremely important in mining environments. Tem-poral changes reflect a time-dependent ability of the network todetect events. A variation of the network configuration and thenumber of sensors can have a strong influence on the overall detec-tion performance. Seismic noise has also an effect on the detectionperformance, and the reduced anthropogenic noise from workingactivity in the mine can explain the larger number of detections (forMAE below 1) at Morsleben during weekends. In consequence ofsome activities in mining environments, for example, following ex-cavations, refilling, blasting and mass shifts, the mine structure canchange with time. Such activities (which were not performed forthe time period discussed in this work) strongly change the miningstructure and should be reflected in a variation of the network de-tection performance. The proposed modified PMC analysis couldbe iteratively repeated for different time intervals, to investigatepossible changes in the mine structures.
A C K N OW L E D G E M E N T S
We are thankful to the BGR and BfS for providing access to theAE data catalogues and monitoring information, and to Dr. J.Philipp for providing information on the acquisition system anddata processing. We are grateful to Dr. K. Plenkers, Dr. G. Kwiatek,Dr. J. Woessner and an anonymous reviewer for useful commentsand suggestions. Thanks to Mr. M. Powers, who kindly revised theEnglish text. This project is funded by the MINE research project.The project MINE is part of the R&D Programme GEOTECH-NOLOGIEN and is funded by the German Ministry of Educationand Research (BMBF), grant of project BMBF03G0737A.
R E F E R E N C E S
Amorese, D., 2007. Applying a change-point detection method onfrequency-magnitude distributions, Bull. seism. Soc. Am., 97, 1742–1749.
Becker, D., Cailleau, B., Dahm, T., Shapiro, S. & Kaiser, D., 2010. Stresstriggering and stress memory observed from acoustic emission records ina salt mine, Geophys. J. Int., 182, 933–948.
Behlau, J. & Mingerzahn, G., 2001. Geological and tectonic investigationsin the former Morsleben salt mine (Germany) as a basis for the safetyassessment of a radioactive waste repository, Eng. Geol., 61, 83–97.
Detection probability in strongly heterogeneous media 1569
Ben-Zion, Y. & Zhu, L., 2002. Potency-magnitude scaling relations forSouthern California earthquakes with 1.0 < ML < 7.0, Geophys. J. Int.,148, F1–F5.
Best, G., 1996. Raft tectonics in Northern Germany: First results of theseismic investigations at the salt structure Oberes Allertal, Z. dt. Geol.Ges, 147, 455–465.
Cao, A.M. & Gao, S.S., 2002. Temporal variations of seismic b-valuesbeneath northeastern japan island arc, Geophys. Res. Lett., 29, 48, 1–3.
Cichowicz, A., Green, R. & Brink, A.v.Z., 1988. Coda polarization prop-erties of high-frequency micro seismic events, Bull. seism. Soc. Am., 78,1297–1318.
Cox, S.J.D. & Meredith, P.G., 1993. Microcrack formation and materialsoftening in rock measured by monitoring acoustic emissions, Int. J. RockMech. Min. Sci. Geomech. Abstr., 30, 11–24.
Eisenblatter, J. & Spies, T., 2000. Ein Magnitudenmass fur Schallemyssions-analyse und Mikroakustik, Deutsche Gesellschaft fur ZerstorungsfreiePrufung, 12. Kolloquium Schallemission, pp. 29–41, Jena, (in German).
Federal Office for Radiation Protection, 2009. EndlagerMorsleben: Stilllegung des Endlagers fur radioaktive AbfalleMorsleben, Bundesamt fur Strahlenschutz (BfS), Available at:http://www.bfs.de/en/endlager/endlager_morsleben (2012).
Gentili, S., Sugan, M., Peruzza, L. & Schorlemmer, D., 2011. Probabilisticcompleteness assessment of the past 30 years of seismic monitoring innortheastern Italy, Phys. Earth planet. Inter., 186, 81–96.
Gibowicz, S.J. & Kijko, A., 1994. An Introduction to Mining Seismology,Academic Press, San Diego, CA, 399 p.
Gutenberg, B. & Richter, C.F., 1944. Frequency of earthquakes in California,Bull. seism. Soc. Am., 34, 185–188.
Hanks, T.C. & Boore, D.M., 1984. Moment-magnitude relations in theoryand practice, J. geophys. Res., 89, 6229–6235.
Kohler, N., Spies, T. & Dahm, T., 2009. Seismicity patterns and variation ofthe frequency-magnitude distribution of microcracks in salt, Geophys. J.Int., 179, 489–499.
Kwiatek, G., Plenkers, K. & Dresen, G., 2011. Source parameters of pico-seismicity recorded at Mponeng deep gold mine, South Africa: implica-tions for scaling relations, Bull. seism. Soc. Am., 6, 2592–2608.
Larsen, S. & Grieger, J., 1998. Elastic modeling initiative: III, 3D com-putational modeling, Soc. Explor. Geophys. Conference Proceeding, 68,1803–1806.
Manthei, G., Eisenblatter, J. & Dahm, T., 2001. Moment tensor evaluation ofacoustic emission sources in salt rock, Constr. Build. Mater., 15, 297–309.
Manthei, G., Eisenblatter, J. & Spies, T., 2006. Experience on acoustic wavepropagation in rock salt in the frequency range 1–100 kHz and conclusionswith respect to the feasibility of a rock salt dome as neutrino detector, Int.J. Modern Phys. A, 21, 30–34.
Maxwell, S. & Young, R.P., 1998. Propagations effects of an undergroundexcavation, Tectonophysics, 289, 17–30.
Milev, A.M. & Spottiswoode, S.M., 2002. Effect of the rock propertieson mining induced seismicity around the Ventersdorp Contact Reef,Witwatersrand Basin, South Africa, Pure appl. Geophys., 159, 165–177.
Nanjo, K.Z., Schorlemmer, D., Woessner, J., Wiemer, S. & Giardini, D.,2010. Earthquake detection capability of the Swiss Seismic Network,Geophys. J. Int., 181, 1713–1724.
Plenkers, K., Schorlemmer, D. & Kwiatek, G. the JAGURAS Group, 2011.On the probability of detecting Picoseismicity, Bull. seism. Soc. Am., 101,2539–2591.
Preuss, J., Eilers, G. & Mauke, R., 2002. Post Closure Safety of theMorsleben Repository, WM’02 Conference, February 24–28, 2002, Tuc-son, AZ.
Rydelek, P.A. & Sacks, I.S., 1989. Testing the completeness of earthquakecatalogs and the hypothesis of self-similarity, Nature, 337, 251–253.
Schorlemmer, D., 2009. Probabilistic seismic network completeness: The-ory, application and results (abstract), Seismol. Res. Lett., 80, 298.
Schorlemmer, D. & Woessner, J., 2008. Probability of detecting an earth-quake, Bull. seism. Soc. Am., 98, 2103–2117.
Schorlemmer, D., Mele, F. & Marzocchi, W., 2010b. A completeness anal-ysis of the national seismic network of italy, J. Geophys. Res., 115,B04308, doi:10.1029/2008JB006097.
Spies, T. & Eisenblatter, J., 2001a. Acoustic emission investigation of mi-crocrack generation at geological boundaries, Eng. Geol., 61, 181–188.
Spies, T. & Eisenblatter, J., 2001b. Acoustic emission monitoring of closelyspaced excavations in an underground repository, J. acoust. Emission.,19, 153–161.
Spies, T., Hesser, J., Eisenblatter, J. & Eilers, J., 2005. Measurements ofacoustic emission during backfilling of large excavations, in Proceedingsof the 6th Symposium on Rock Bursts and Seismicity in Mines, pp. 379–384, eds Potvin, Y. & Hudyman, M., Perth, Australia.
Wiemer, S. & Wyss, M., 2000. Minimum magnitude of completeness inearthquake catalogs: examples from Alaska, the Western United States &Japan, Bull. seism. Soc. Am., 90, 859–869.
Woessner, J. & Wiemer, S., 2005. Assessing the quality of earthquake cat-alogues: estimating the magnitude of completeness and its uncertainty,Bull. seism. Soc. Am., 95, 684–698.
Wyss, M., Hasegawa, A., Wiemer, S. & Umino, N., 1999. Quantitativemapping of precursory seismic quiescence before the 1989, M 7.1 off-Sanriku earthquake, Japan, Ann. Di Geofis., 42, 851–869.
Zuniga, R. & Wyss, M., 1995. Inadvertent changes in magnitude reportedin earthquake catalogs: influence on b-value estimates, Bull. seism. Soc.Am., 85, 1858–1866.


![CDM - HAINZL · 2014-09-16 · CreepDrive Motor CDM 170-050 POCLAIN HYDRAULICS Chassis mounting Chassis mounting S mm [in] Ra V μm [μin] Class N.m [lb.ft] Side 0.2 [0.01] 12.5 [0.49]](https://img.pdfslide.net/doc/110x75/5f97f8f55b2bfd5c8534282c/cdm-hainzl-2014-09-16-creepdrive-motor-cdm-170-050-poclain-hydraulics-chassis.jpg)