Embed Size (px)
Citation preview
Contents lists available at ScienceDirect
Journal of the Mechanical Behavior ofBiomedical Materials
journal homepage: www.elsevier.com/locate/jmbbm
Magnetic resonance elastography of the brain: A comparison between pigsand humans
Johannes Weickenmeiera,1, Mehmet Kurtb,1, Efe Ozkayab, Max Wintermarkc, Kim Butts Paulyc,Ellen Kuhld,⁎
a Department of Mechanical Engineering, Stanford University, Stanford CA 94305, USAb Department of Mechanical Engineering, Stevens Institute of Technology, Hoboken, NJ, USAc Department of Radiology Stanford University, Stanford CA 94305, USAd Departments of Mechanical Engineering and Bioengineering, Stanford University, Stanford CA 94305, USA
A R T I C L E I N F O
Keywords:Magnetic resonance elastographyHuman brainPorcine brainStorage and loss moduliViscoelasticity
A B S T R A C T
Magnetic resonance elastography holds promise as a non-invasive, easy-to-use, in vivo biomarker for neuro-degenerative diseases. Throughout the past decade, pigs have gained increased popularity as large animalmodels for human neurodegeneration. However, the volume of a pig brain is an order of magnitude smaller thanthe human brain, its skull is 40% thicker, and its head is about twice as big. This raises the question to whichextent established vibration devices, actuation frequencies, and analysis tools for humans translate to largeanimal studies in pigs. Here we explored the feasibility of using human brain magnetic resonance elastography tocharacterize the dynamic properties of the porcine brain. In contrast to humans, where vibration devices inducean anterior-posterior displacement recorded in transverse sections, the porcine anatomy requires a dorsal-ventraldisplacement recorded in coronal sections. Within these settings, we applied a wide range of actuation fre-quencies, from 40 Hz to 90 Hz, and recorded the storage and loss moduli for human and porcine brains.Strikingly, we found that optimal actuation frequencies for humans translate one-to-one to pigs and reliablygenerate shear waves for elastographic post-processing. In a direct comparison, human and porcine storage andloss moduli followed similar trends and increased with increasing frequency. When translating these frequency-dependent storage and loss moduli into the frequency-independent stiffnesses and viscosities of a standard linearsolid model, we found human values of =μ 1.3 kPa1 , =μ 2.1 kPa2 , and =η 0.025 kPa s and porcine values of
=μ 2.0 kPa1 , =μ 4.9 kPa2 , and =η 0.046 kPa s. These results suggest that living human brain is softer and lessviscous than dead porcine brain. Our study compares, for the first time, magnetic resonance elastography inhuman and porcine brains, and paves the way towards systematic interspecies comparison studies and ex vivovalidation of magnetic resonance elastography as a whole.
1. Motivation
Magnetic resonance elastography was first proposed two decadesago (Muthupillai et al., 1995; Muthupillai and Ehman, 1996) and israpidly gaining popularity as a non-invasive tool to measure the me-chanical properties of living biological tissues (Mariappan et al., 2010).To date, it remains the only in vivo measurement technique to char-acterize the mechanical properties of the living brain (Kruse et al.,2008). As such, it holds promise as a biomarker for the early onset ofneurodegenerative diseases including multiple sclerosis (Streitbergeret al., 2012) and Alzheimer's disease (Murphy et al., 2011). Several
studies have used magnetic resonance elastography in small animalsincluding rodents (Atay et al., 2008; Schregel et al., 2012; Feng et al.,2016) and ferrets (Feng et al., 2013). However, its application to largeranimals remains challenging due to design constraints of the actuatorand limited space inside the scanner. Despite its increasing interest andwidespread use, magnetic resonance elastography is far from beingfully validated. For example, recent studies have shown that its resultsare highly sensitive to the actuation frequency (Kurt et al., 2017; Sacket al., 2009). Yet, the precise impact of tissue actuation on stiffnessrecordings remains insufficiently understood. In general, magnetic re-sonance elastography is based on three principles (Mariappan et al.,
http://dx.doi.org/10.1016/j.jmbbm.2017.08.029Received 15 May 2017; Received in revised form 23 August 2017; Accepted 23 August 2017
⁎ Corresponding author.
1 These authors contributed equally to this work.
E-mail address: [email protected] (E. Kuhl).URL: http://biomechanics.stanford.edu (E. Kuhl).
Journal of the Mechanical Behavior of Biomedical Materials 77 (2018) 702–710
Available online 26 August 20171751-6161/ © 2017 Elsevier Ltd. All rights reserved.
MARK
2010): tissue actuation, the generation of shear waves through an ex-ternal actuator; image acquisition, the recording of in vivo displace-ment fields based on a magnetic resonance sequence with motion-en-coding gradients; and elastogram generation, the post-processing ofphase-sensitive magnetic resonance images to create stiffness maps(Kruse et al., 2008). The objectives of this study are to use magneticresonance elastography to characterize the viscoelastic properties of theporcine brain and to explore to which extent our recently developedprotocols (Kurt et al., 2017; Chartrain et al., 2017) for tissue actuation,image acquisition, and elastogram generation translate from humans topigs.
Tissue actuation. Most tissue actuators induce body waves thatconsist of compression and shear waves. While compression wavespropagate at speeds of 1500 m/s, shear waves are significantly slowerand range from 1 to 10 m/s (Green et al., 2008). Current imaging se-quences are fast enough to resolve the propagation of shear waves insoft tissues with wavelengths in the sub-millimeter to centimeter range(Kruse et al., 2008). Specialized magnetic resonance scanner-compa-tible actuators have been developed to characterize the stiffnesses ofdifferent organs under in vivo, in vitro, and ex vivo conditions. Whilethe actual actuation device varies from study to study, the general setupaims at transmitting a low-frequency acoustic wave with frequenciessmaller than 1 kHz using a sinusoidal mechanical source (Doyley,2012). Frequency and wave source aim at inducing shear waves capableof penetrating the whole organ of interest and generating measurablewave amplitudes. Given the large variation in experimental setups andmaterial properties, the optimal physiological range of vibration fre-quencies remains poorly understood (Laksari et al., 2015; Kurt et al.,2017). Especially in the case of the brain–a membrane-surrounded ul-trasoft organ with multiple tissue interfaces and large local stiffnessgradients (Weickenmeier et al., 2016)–the vibration frequency has asignificant effect on wave reflection and interference, which can reducedisplacement amplitudes and trigger wave dispersion (Atay et al.,2008).
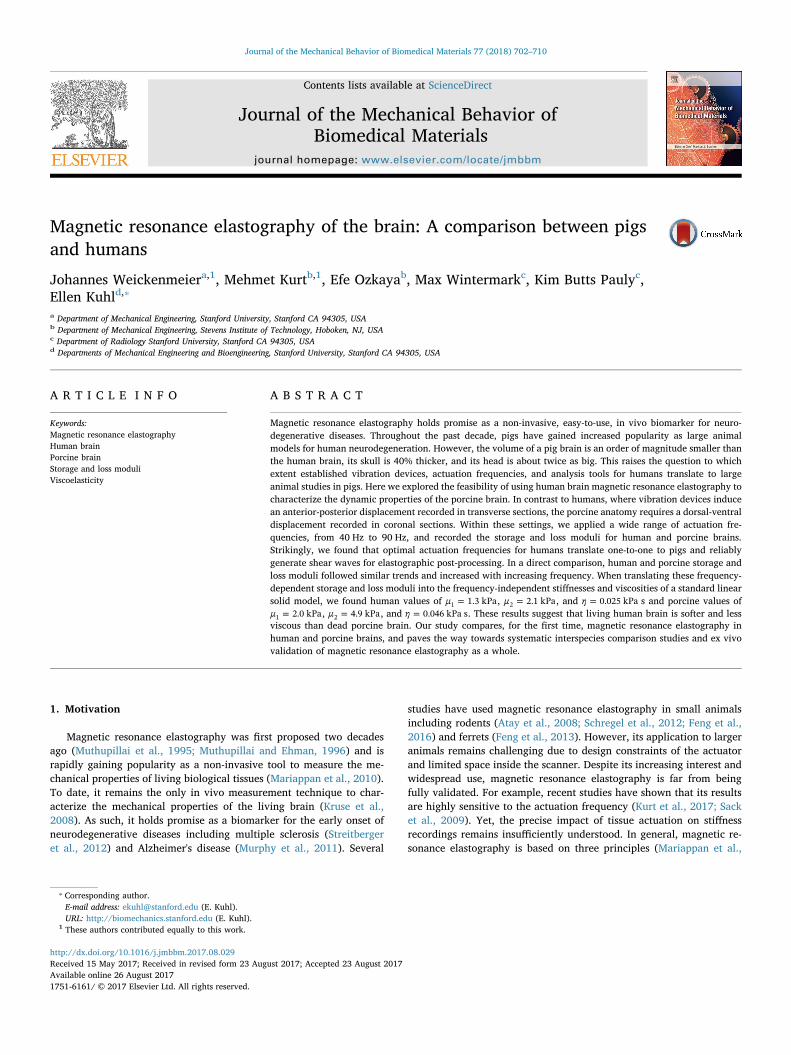
Image acquisition. Magnetic resonance elastography is a phase-con-trast based imaging technique (Muthupillai et al., 1995). It is based onthe magnetic resonance imaging of shear wave propagation throughspecialized imaging sequences as illustrated in Fig. 1. The underlyingparadigm is to synchronize a cyclic, gradient-based, oscillating mag-netic field with the mechanical activation (Muthupillai and Ehman,1996). This causes spin packets, which move with the shear wave fieldinside the brain, to accrue phase during image acquisition. During eachexcitation period, we prescribe a locally varying gradient field. In-dividual spin packets move within this varying magnetic field and
accumulate a different amount of phase (Mariappan et al., 2010). Mo-tion-encoding gradients cause the individual nuclear spin packets toaccrue phase based on the local magnetic field strength as they oscillatewith the gradients. As a result, the phase image of the data exhibitscontrast proportional to displacement (Atay et al., 2008). The phaseshift of each position is received in the nuclear magnetic resonancesignal and is aggregated in individual phase-sensitive magnetic re-sonance images. By introducing a synchronization delay between me-chanical activation and motion-encoding gradient, we can capturedisplacement fields at distinct time points throughout each excitationperiod. Acquiring an image slice throughout several wave cycles allowsus to accrue more phase and to determine an average tissue response ata local resolution of up to 100 nm (Kruse et al., 2008). By applyingoscillating gradients of constant amplitude, frequency, and duration inthree orthogonal directions, we can obtain the vector of motion-in-duced phase at each voxel in the image space and reconstruct the three-dimensional deformation field of the shear wave (Atay et al., 2008).
Elastogram generation. In linear elastic materials, harmonic elasto-graphy reconstructs the shear stiffness directly from shear speed esti-mates via the wave equation: The elastic shear modulus =G ρ v isproportional to the tissue density ρ and the propagation speed =v f λ,the product of the actuation frequency f and the local wavelength λ ofthe propagating shear wave (Kruse et al., 2008). Assuming the densityof the brain is equal to water, =ρ 1 g/cm3, knowing the actuation fre-quency f, and measuring the local wavelength λ would allow us to di-rectly extract the elastic modulus G. In more complex organs, however,measuring shear speed can be quite challenging. Using the Navier-Stokes equations (Papazoglou et al., 2008), we can properly account forcomplex geometries and edge reflections given an appropriate dis-cretization of the solution domain (Plewes et al., 2000). After acquiringphase-sensitive images in the region of interest, we can infer the dis-placement field based on a direct proportional relationship betweenphase and displacement magnitude. However, the ill-conditioned gov-erning equations of displacements and material properties generatenon-unique solutions, especially in the presence of experimental noise(Plewes et al., 2000). In addition, most soft tissues exhibit a frequency-dependent mechanical response (Kurt et al., 2017), and often behavelike nonlinear, anisotropic (Böl et al., 2015), viscoelastic (Budday et al.,2017) or poroelastic (Franceschini et al., 2006) solids. Following in-itially introduced simple, first-order direct inversion methods(Muthupillai et al., 1995; Oliphant et al., 2001), several groups havenow introduced more accurate but computationally expensive con-tinuum-model-based inversion schemes (Doyley, 2012), including thetime-of-arrival technique (McCracken et al., 2005), sub-zone re-construction (Van Houten et al., 2003), and coupled harmonic oscillatorsimulations (Sack et al., 2002). Anisotropic inversion schemes remainchallenging, but first efforts are underway to incorporate directionalityof brain tissue stiffness into existing inversion algorithms (Andersonet al., 2016).
2. Materials and methods
2.1. Subjects and samples
This study was approved by the Research Compliance Office atStanford University and complies with IRB and Animal Care and Useguidelines. We received a 55 kg American Yorkshire pig 16 h post-mortem, which had been cooled over night at 4 °C. We removed theanimal from the refrigerator three hours prior to scanning to minimizetissue degradation and changes in brain microstructure while allowingfor the carcass to reach room temperature by the time of the scan. Wecompared the pig scan against our normal adult magnetic resonanceelastography dataset obtained by using the same multi-frequencymagnetic resonance elastography protocol (Kurt et al., 2017). Thisdataset contains a total number of n = 51 adult brains, 24 male and 27female, aged between 18–80, with an average age of 44.5 years.
Fig. 1. Magnetic resonance elastography is a phase-contrast based imaging technique thatuses specialized sequences to image shear waves propagation. Synchronization of tissueactivation through radio frequency (RF) pulses and motion-encoding gradients, slice-se-lection (SS), phase-encoded (PE), and frequency-encoded (FE) localization methodsduring image acquisition converts tissue motion into phase-sensitive images. A syn-chronization delay or phase shift θ between tissue activation and motion-encoding gra-dients allows us to capture tissue motion at distinct time points.
J. Weickenmeier et al. Journal of the Mechanical Behavior of Biomedical Materials 77 (2018) 702–710
703

2.2. Magnetic resonance imaging
Magnetic resonance imaging scans were performed on a 3T researchscanner (GE Healthcare, Waukesha, WI) at the Richard M. Lucas Centerfor Imaging at Stanford University. Humans and the pig were scannedin the supine position, as shown in Fig. 2A. The anatomical orientationof the brains inside the scanner generated different scanning planes–-transverse for humans and coronal for pigs–as illustrated in Fig. 2C. Forthe human brain, we used a 32-channel head coil and acquired 48 sliceswith 3 mm thickness at a matrix size of 128 × 128 with 1.875 mmresolution. For the porcine brain, we used a single-channel split headcoil to accommodate the larger head and acquired 60 slices with1.5 mm thickness at a matrix size of 128 × 128 with 1.25 mm re-solution. Our scanning sequence designed for this study involved a T1-weighted anatomical scan, 3D-Bravo. Figs. 3A and 4A show re-presentative transverse, coronal, and sagittal slices of the human andpig brains.
2.3. Magnetic resonance elastography
Magnetic resonance elastography was performed using commer-cially available hardware and software in combination with the acti-vation pillow developed and provided by courtesy of the Mayo Clinic(Mayo Clinic, Rochester, MN). An acoustic passive driver was placedunderneath the subject's head, as shown in Fig. 2B. The driver wasconnected to an external acoustic active driver through a plastic tube.Continuous vibrations at a chosen frequency were generated by theactive driver and delivered by the tube to the passive driver. Thesevibrations were then transmitted to the skull to induce shear wavesinside the brain. We used a two-dimensional gradient echo (GRE)magnetic resonance elastography pulse sequence with repetition time(TR) 2 s, echo time (TE) min full, matrix size 128 × 128, and field ofview (FOV) 160 × 160 mm. Motion-sensitizing gradients encode themotion in the brain tissue into the phase of the magnetic resonancesignal in three directions. We repeated the sequence eight times andacquired two phase images per location. To calculate the elastogramsfrom the magnetic resonance elastography data, we used a two-
dimensional direct inversion technique (Oliphant et al., 2001). Wechose four different vibration frequencies of the magnetic resonanceelastography actuator, 40, 60, 80, and 90 Hz. In each scan, we set thefrequency of the motion encoding gradient equal to the actuation fre-quency for synchronization. For each actuation frequency, we de-termined maps of the storage and loss moduli.
Figs. 3C and 4C show magnetic resonance measurements of thestorage and loss moduli across a representative transverse slice in hu-mans and coronal slice in pigs. The vibration pillow used in this study,together with the shape of the porcine head, only allows for tissue ac-tivation in the coronal plane. The triangular porcine skull provides an
Fig. 2. Magnetic resonance elastography. A. Human and porcine subjects are scanned inthe supine position. B. The skull is accelerated through an active driver that is connectedvia a plastic tube to the passive driver pillow underneath the subject's head. C. The supineposition of both subjects results in different imaging planes– transverse slices for humansand coronal slices for pigs.
Fig. 3. Human brain. A. Semi-automatic segmentation of the cerebrum and the cere-bellum in transverse, coronal, and sagittal slices of the T1-weighted structural scan. B.Three-dimensional, lateral, and axial views of the volumetric reconstruction. C. Storageand loss moduli across a selected transverse section.
Fig. 4. Porcine brain. A. Semi-automatic segmentation of the cerebrum and the cere-bellum in transverse, coronal, and sagittal slices of the T1-weighted structural scan. B.Three-dimensional, lateral, and axial views of the volumetric reconstruction. C. Storageand loss moduli across a selected coronal section.
J. Weickenmeier et al. Journal of the Mechanical Behavior of Biomedical Materials 77 (2018) 702–710
704

effective surface to induce tissue motion on the superior side of thehead. In the supine position, the pig's head can be aligned well with thevibration pillow as shown in Fig. 2A.
2.4. Anatomical reconstruction of the brain
Anatomic reconstruction was performed using Simpleware(Synopsys, Mountain View, USA). From the T1-weighted magnetic re-sonance images, we reconstructed the anatomy and created three-di-mensional models. Based on greyscale thresholding for an initial ap-proximation of both structures, we applied manual segmentation andvolumetric Gaussian smoothing to create the final three-dimensionalmodels.
Figs. 3B and 4B illustrate the volumetric representation of an adultmale human brain and the pig brain. Human and porcine brains dis-played distinct anatomic differences including the alignment of cere-brum and cerebellum and the shape and orientation of the brainstem.The human cerebral volume was eight times larger than the porcinecerebral volume; the human cerebellar volume was nine times largerthan the porcine cerebellar volume.
2.5. Storage and loss moduli
To calculate average storage and loss moduli, we analyzed mid-coronal slices of the porcine brain. To capture average moduli, we se-lected gray and white matter regions as regions of interest and recordedthe corresponding mean storage and loss moduli. For humans, we usedsegmentation templates that allow for an automated, region-specificparameter extraction (Kurt et al., 2017). For the pig, we manuallysegmented the corpus callosum and the internal capsule from the T1-weighted magnetic resonance images, see Fig. 2. We report the meansand standard deviations of the storage and loss moduli ′G and ″G for allfour actuation frequencies, at 40, 60, 80, and 90 Hz.
2.6. Viscoelastic models
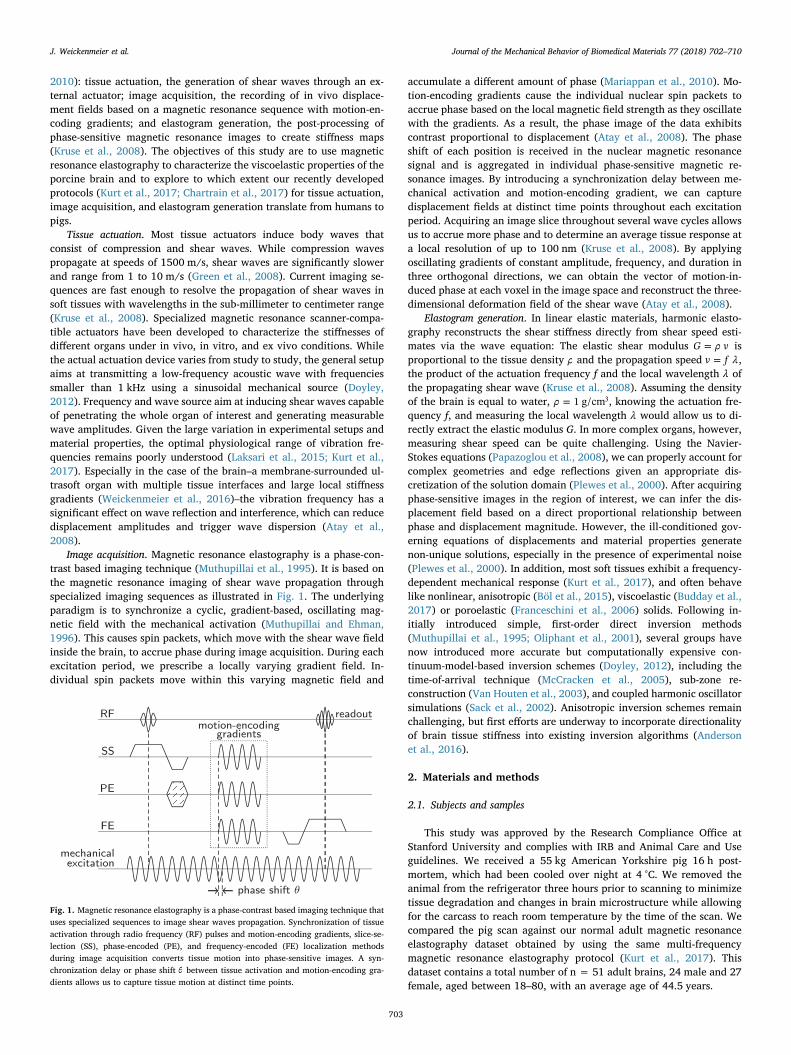
To correlate the frequency-dependent storage and loss moduli ′Gand ″G to frequency-independent material parameters, we consider fourcommonly used viscoelastic models: the Maxwell model, the Voigtmodel, the spring-damper model, and the standard linear solid model.For each model, we express the model parameters in terms of the dy-namic shear modulus = ′ + ″G G i G . The Maxwell model mimics theserial arrangement of a spring and a damper with a stiffness μ and aviscosity η, which are related to the dynamic shear modulus as
= +G i ω η μ μ i ω η( )/( ). The Voigt model mimics the parallel ar-rangement of a spring and a damper with a stiffness μ and a viscosity η,which are related to the dynamic shear modulus as = +G μ i ω η. Thespring-damper model represents a combination of springs and damperswith a stiffness κ and an exponent α related to the dynamic shearmodulus as =G κ iω( )α. The standard linear solid model consists of aspring with a stiffness μ1 arranged parallel to a spring and damper witha stiffness μ2 and a viscosity η related to the dynamic shear modulus as
= + + +G μ μ i ω η μ μ μ i ω η( ( ))/( )1 2 1 2 2 . Fig. 5 illustrates the relationsbetween the frequency-independent elastic shear stiffness μ1, viscoe-lastic shear stiffness μ2, and viscosity η and the frequency-dependentstorage and loss moduli ′G and ″G for the standard linear solid model.For all four viscoelastic models, in each region of interest, we mini-mized the objective function
∑ ⎜ ⎟ ⎜ ⎟= ⎡
⎣⎢
⎛
⎝
′ − ′′
⎞
⎠+ ⎛
⎝
″ − ″″
⎞
⎠
⎤
⎦⎥
=
ΦG G
GG G
G18
,i
i i
i
i i
i1
4 exp mod
exp
2 exp mod
exp
2 1/2
as the normalized root mean square error between the experimentallymeasured storage and loss moduli ′Gi
exp and ″Giexp and the storage and
loss moduli of ′Gimod and ″Gi
mod of the corresponding model summedover all four driver frequencies, =i 40, 60, 80, 90 Hz, using the Nelder-
Mead method. To verify the robustness of the parameter identification,we screened the physically-motivated parameter space and performedthe optimization with 17,500 different initial conditions for stiffnesseswithin the range of = −μ 0.5 8.0 kPa and viscosities of
= −η 0.01 1.00 kPa s.
3. Results
3.1. Human and porcine loss and storage moduli ′G and ″G
Table 1 summarizes the means and standard deviations of the sto-rage and loss moduli ′G and ″G for the human and porcine brains at allfour driver frequencies of 40, 60, 80, and 90 Hz. In general, our mea-surements were highly robust with low standard deviations rangingfrom 5% to 18%, with the exception of two loss moduli that displayedstandard deviations of 35% and 40%. Both human and porcine modulidisplayed similar trends and increased with increasing frequency. In theinterval from 40 Hz to 90 Hz, the average human storage modulus in-creased from ′ = ±G 1.182 0.127 kPa to ′ = ±G 2.224 0.160 kPa and theaverage porcine storage modulus increased from ′ = ±G 1.727 0.093 kPato ′ = ±G 3.757 0.264 kPa. At all four frequencies, the dead porcinebrain was stiffer than the living human brain: The average porcinestorage and loss moduli were 53% and 123% larger than their humancounterparts.
Fig. 6 shows the frequency-dependent, region-specific storage andloss moduli ′G and ″G for the porcine and human brains. In addition tothe average brain values from Table 1 in Fig. 6A, we also summarize theregional moduli of two characteristic deeper brain structures, thecorpus callosum in Fig. 6B and the internal capsule in Fig. 6C. Bothhuman and porcine storage and loss moduli of the corpus callosum andthe internal capsule displayed similar trends to the overall brain
Fig. 5. Standard linear solid model. Relations between frequency-independent elasticshear stiffness μ1, viscoelastic shear stiffness μ2, and viscosity η and frequency-dependentstorage and loss moduli ′G and ″G . The storage modulus is ′ =G μ1 for frequencies →ω 0and ′ = +G μ μ1 2 for frequencies → ∞ω . The loss modulus ″G is largest at the frequencyω associated with the inverse relaxation time =τ μ η1/ /2 .
Table 1Storage and loss moduli ′G and ″G for human and porcine brains at varying driver fre-quencies. Means and standard deviations from averaging over all n = 51 human brainsand over all pixels across the pig brain.
J. Weickenmeier et al. Journal of the Mechanical Behavior of Biomedical Materials 77 (2018) 702–710
705

average in Fig. 6A. Human and porcine storage moduli in all three re-gions increased with increasing frequency from 40 Hz to 80 Hz. Coun-terintuitively, in the corpus callosum and the internal capsule, bothhuman and porcine storage moduli decreased from 80 Hz to 90 Hz.Overall, all three graphs in Fig. 6 confirm the general trend of Table 1:In all three regions, both storage and loss moduli of the dead porcinebrain were markedly larger than the storage moduli of the living humanbrain.
3.2. Comparison of viscoelastic models
Table 2 summarizes the rheological models, the functional relations,and the parameters of our four viscoelastic models, Maxwell, Voigt,spring-damper, and standard linear solid, for three regions, brainaverage, corpus callosum, and internal capsule of the porcine brain. Foreach model and region, we also report the normalized root mean squareerror between the experimental moduli ′G exp and ″G exp and the modulipredicted by the model ′G mod and ″G mod . For the Maxwell, Voigt, andspring-damper models, the parameter identification robustly identifiedthe same minimizing parameter sets for varying initial conditions. Forthe standard linear solid model, the parameter identification was
sensitive to the set of initial conditions, particularly because of thelimited number of frequencies tested in this study. Eventually, we se-lected the parameter set with the lowest normalized root mean squareerror. In summary, all four models performed well with errors smallerthan 33% in any of the three regions. Shear stiffnesses generally rangedfrom =μ 2.0 kPa to =μ 6.3 kPa, with smaller values for the overallbrain average and larger values for the corpus callosum and the internalcapsule. Of all three regions, all models displayed the largest error forthe corpus callosum, most likely caused by the unexpected sudden re-duction in storage modulus from 80 to 90 Hz, see Fig. 6B. Of all fourrheological models, the Maxwell model displayed the largest relativeerrors, 11% for brain average, 33% for the corpus callosum, and 15%for the internal capsule, suggesting that it is poorly suited to char-acterize the viscoelastic behavior of brain tissue. The standard linearsolid model displayed the smallest relative error, 7% for the internalcapsule. Of all four models, the standard linear solid model is the onlymodel that features an instantaneous stiffness at vanishing frequenciesand a non-linear frequency dependency at a non-zero steady state. Wetherefore selected the standard linear solid model for a direct com-parison between the viscoelastic parameters of human and porcinebrains.
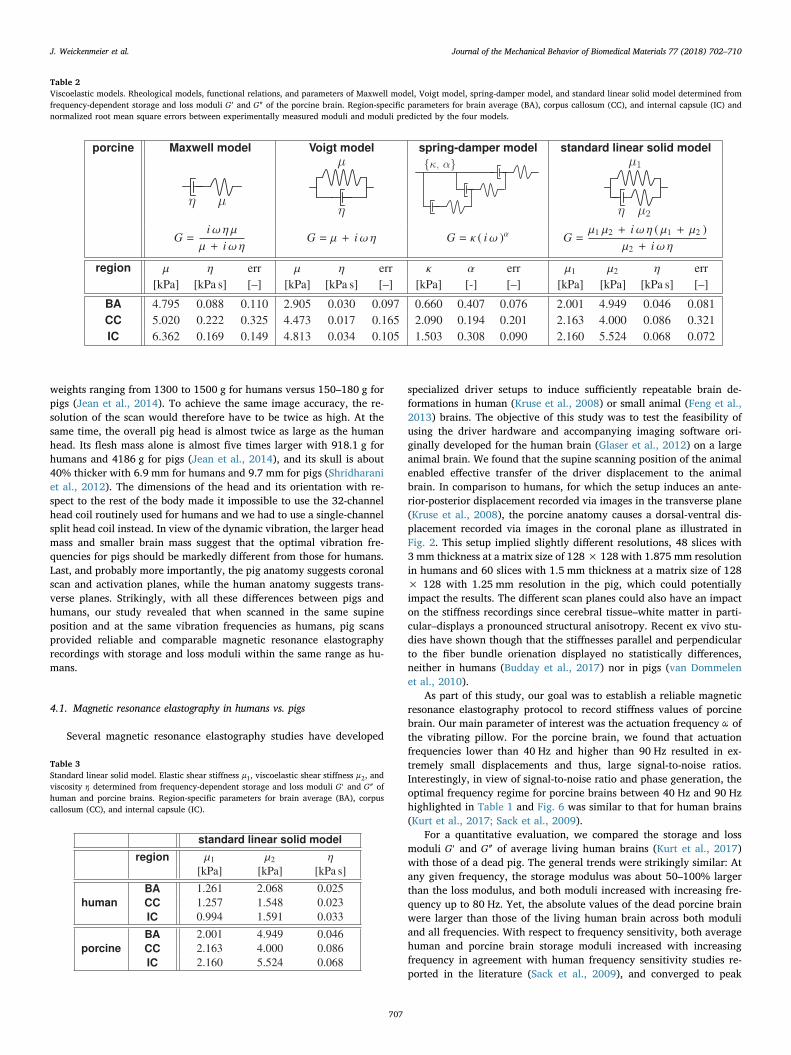
3.3. Human and porcine stiffnesses μ1 and μ2 and viscosities η
Table 3 compares the elastic and viscoelastic shear moduli μ1 and μ2and the viscosity η of the standard linear solid model according to Fig. 5of human and porcine brains. The frequency-independent parametersfor the brain average, corpus callosum, and internal capsule displayedmarked differences between the living human and dead pig brain.Overall, the parameters of the porcine brain were about twice as largeas those of the human brain. The elastic stiffness of the porcine brain
=μ 2.001 kPa1 was by a factor 1.6 larger than the elastic stiffness of thehuman brains =μ 1.261 kPa when averaged over the entre brain, and itwas 1.7 times larger in the corpus callosum and 2.2 times larger in theinternal capsule. The viscoelastic stiffness μ2 was also larger in all re-gions of the porcine brain than in the human brain, by a factor 2.4 forbrain average, 2.6 in the corpus callosum, and 3.5 in the internalcapsule. The viscosity η was also larger in all regions of the porcinebrain than in the human brain, by a factor 1.8 for brain average, 3.7 inthe corpus callosum, and 2.1 in the internal capsule. The average re-laxation time =τ η μ/ 2 of the living human brain of =τ 12.1 ms wascomparable to the average relaxation time of the dead porcine brainwith =τ 9.3 ms.
4. Discussion
Magnetic resonance elastography is rapidly gaining popularity as anon-invasive, easy-to-use, in vivo technology to characterize regionalstiffness variations across the living human brain. Yet, to be fully ap-plicable for broad clinical use, the technique could benefit from a morethorough calibration and validation, both against other methods andagainst other species. To increase our confidence in the recordings,enable a comparison of measurements and experimental data, and ca-librate and validate the technology, it seems intuitive to ask, how well itperforms when applied to animal models. While several studies haveapplied magnetic resonance elastography to small animal models, in-cluding rats (Vappou et al., 2007) and ferrets (Feng et al., 2013), thetechnique has never been applied to large animal models comparable tohumans. Here we demonstrate, for the first time, the feasibility ofmagnetic resonance elastography to characterize the storage and lossmoduli of a porcine brain in situ.
Scanning pigs presents several differences as compared to standardhuman scans. The dimensions of a porcine brain are about half of thoseof a human brain which implies that its volume and mass are an orderof magnitude smaller than in humans. Our human brain was eight timeslarger in volume than the porcine brain, which agrees well with brain
Fig. 6. Storage and loss moduli ′G and ″G for human and porcine brains at varying driverfrequencies. Region-specific moduli for A. brain average, B. corpus callosum, and C. in-ternal capsule. Dashed lines indicate mean pig moduli, solid lines indicate mean humanmoduli averaged over n = 51 adult brains, and shaded regions indicate their standarddeviations.
J. Weickenmeier et al. Journal of the Mechanical Behavior of Biomedical Materials 77 (2018) 702–710
706
weights ranging from 1300 to 1500 g for humans versus 150–180 g forpigs (Jean et al., 2014). To achieve the same image accuracy, the re-solution of the scan would therefore have to be twice as high. At thesame time, the overall pig head is almost twice as large as the humanhead. Its flesh mass alone is almost five times larger with 918.1 g forhumans and 4186 g for pigs (Jean et al., 2014), and its skull is about40% thicker with 6.9 mm for humans and 9.7 mm for pigs (Shridharaniet al., 2012). The dimensions of the head and its orientation with re-spect to the rest of the body made it impossible to use the 32-channelhead coil routinely used for humans and we had to use a single-channelsplit head coil instead. In view of the dynamic vibration, the larger headmass and smaller brain mass suggest that the optimal vibration fre-quencies for pigs should be markedly different from those for humans.Last, and probably more importantly, the pig anatomy suggests coronalscan and activation planes, while the human anatomy suggests trans-verse planes. Strikingly, with all these differences between pigs andhumans, our study revealed that when scanned in the same supineposition and at the same vibration frequencies as humans, pig scansprovided reliable and comparable magnetic resonance elastographyrecordings with storage and loss moduli within the same range as hu-mans.
4.1. Magnetic resonance elastography in humans vs. pigs
Several magnetic resonance elastography studies have developed
specialized driver setups to induce sufficiently repeatable brain de-formations in human (Kruse et al., 2008) or small animal (Feng et al.,2013) brains. The objective of this study was to test the feasibility ofusing the driver hardware and accompanying imaging software ori-ginally developed for the human brain (Glaser et al., 2012) on a largeanimal brain. We found that the supine scanning position of the animalenabled effective transfer of the driver displacement to the animalbrain. In comparison to humans, for which the setup induces an ante-rior-posterior displacement recorded via images in the transverse plane(Kruse et al., 2008), the porcine anatomy causes a dorsal-ventral dis-placement recorded via images in the coronal plane as illustrated inFig. 2. This setup implied slightly different resolutions, 48 slices with3 mm thickness at a matrix size of 128 × 128 with 1.875 mm resolutionin humans and 60 slices with 1.5 mm thickness at a matrix size of 128× 128 with 1.25 mm resolution in the pig, which could potentiallyimpact the results. The different scan planes could also have an impacton the stiffness recordings since cerebral tissue–white matter in parti-cular–displays a pronounced structural anisotropy. Recent ex vivo stu-dies have shown though that the stiffnesses parallel and perpendicularto the fiber bundle orienation displayed no statistically differences,neither in humans (Budday et al., 2017) nor in pigs (van Dommelenet al., 2010).
As part of this study, our goal was to establish a reliable magneticresonance elastography protocol to record stiffness values of porcinebrain. Our main parameter of interest was the actuation frequency ω ofthe vibrating pillow. For the porcine brain, we found that actuationfrequencies lower than 40 Hz and higher than 90 Hz resulted in ex-tremely small displacements and thus, large signal-to-noise ratios.Interestingly, in view of signal-to-noise ratio and phase generation, theoptimal frequency regime for porcine brains between 40 Hz and 90 Hzhighlighted in Table 1 and Fig. 6 was similar to that for human brains(Kurt et al., 2017; Sack et al., 2009).
For a quantitative evaluation, we compared the storage and lossmoduli ′G and ″G of average living human brains (Kurt et al., 2017)with those of a dead pig. The general trends were strikingly similar: Atany given frequency, the storage modulus was about 50–100% largerthan the loss modulus, and both moduli increased with increasing fre-quency up to 80 Hz. Yet, the absolute values of the dead porcine brainwere larger than those of the living human brain across both moduliand all frequencies. With respect to frequency sensitivity, both averagehuman and porcine brain storage moduli increased with increasingfrequency in agreement with human frequency sensitivity studies re-ported in the literature (Sack et al., 2009), and converged to peak
Table 2Viscoelastic models. Rheological models, functional relations, and parameters of Maxwell model, Voigt model, spring-damper model, and standard linear solid model determined fromfrequency-dependent storage and loss moduli ′G and ″G of the porcine brain. Region-specific parameters for brain average (BA), corpus callosum (CC), and internal capsule (IC) andnormalized root mean square errors between experimentally measured moduli and moduli predicted by the four models.
Table 3Standard linear solid model. Elastic shear stiffness μ1, viscoelastic shear stiffness μ2, andviscosity η determined from frequency-dependent storage and loss moduli ′G and ″G ofhuman and porcine brains. Region-specific parameters for brain average (BA), corpuscallosum (CC), and internal capsule (IC).
J. Weickenmeier et al. Journal of the Mechanical Behavior of Biomedical Materials 77 (2018) 702–710
707

values of ′ =G 2.2 kPa for humans and ′ =G 3.6 kPa for the pig ataround 80 Hz.
In excellent agreement with the literature, we recorded averagehuman brain storage and loss moduli of ′ = −G 1.18 2.22 kPa and
″ = −G 0.63 0.99 kPa for frequencies ranging from 40 to 90 Hz com-pared to previously reported values of ′ = −G 1.1 2.0 kPa and
″ = −G 0.48 0.80 kPa for slightly lower frequencies ranging from 25 to62.5 Hz (Sack et al., 2009). Our average human brain storage and lossmoduli of ′G = 2.28 kPa and ″ =G 1.14 kPa at 80 Hz agree well withpreviously reported storage and loss moduli of ′ =G 2.41 kPa and
′ =G 2.34 kPa for white matter and ″ =G 1.21 kPa and ″ =G 1.11 kPa forgray matter (Zhang et al., 2011). Our average pig brain storage and lossmoduli of ′ = −G 1.73 3.86 kPa and ″ = −G 1.23 2.53 kPa for fre-quencies ranging from 40 to 90 Hz were 53% and 123% larger than inhumans, but not as high as the reported values of ′ =G 8.45 kPa and
″ =G 7.14 kPa for a frequency of 180 Hz recorded in rats (Vappou et al.,2007) and ′ = −G 3 7 kPa and ″ = −G 1 2 kPa for frequencies rangingfrom 400 Hz to 800 Hz recorded in ferrets (Feng et al., 2013). Un-fortunately, these small animal stiffnesses are difficult to compare toour large animal model values since we were unable to record reliabledata for activation frequencies higher than 80 Hz due to limited ex-citation.
4.2. Comparison of viscoelastic models
In agreement with previous studies, our study confirms that thestorage and loss moduli ′G and ″G acquired through magnetic resonanceelastography increase with increasing frequency (Feng et al., 2013; Kurtet al., 2017). To convert these frequency-dependent parameters intofrequency-independent parameters, we analyzed four common viscoe-lastic models (Sack et al., 2009): the Maxwell model with an elasticspring and a viscous damper arranged in series, the Voigt model with aspring and damper arranged in parallel, the spring-damper model withseveral Maxwell models in parallel, and the standard linear solid modelwith an elastic spring in parallel to a Maxwell model. In general, thatdata from only four frequencies provides a rather limited information toidentify the two or even three material parameters of these viscoelasticmodels. Nonetheless, our least square parameter identification wasrobust and stable and generally identified the same parameter set forvarying initial values. The shear stiffnesses of all four models variedbetween = −μ 2.0 4.8 kPa for the dead porcine brain and were abouttwice as large as their human brain counterparts. Of the four viscoe-lastic models, the Voigt model predicted a constant, frequency-in-dependent storage modulus; the Maxwell and spring-damper modelspredicted a vanishing storage modulus under quasi-static conditions. Ofall four models, only the standard linear solid model displayed a non-zero stiffness under quasi-static conditions and a non-linear frequencydependency. In the finite hyper-viscoelastic setting, the standard linearsolid model generalizes to the popular multiplicative decompositionmodel with one viscoelastic mode (de Rooij and Kuhl, 2016). Ourstiffness values for the standard linear solid model of =μ 1.3 kPa1 and
=μ 2.1 kPa2 in humans and =μ 2.0 kPa1 and =μ 4.9 kPa2 in the pigagree well with the stiffnesses previously reported for human brains of
=μ 1.0 kPa1 and =μ 1.5 kPa2 (Sack et al., 2009); however, our visc-osities of =η 0.025 kPa and =η 0.046 kPa s were slightly higher thanthe previously reported value of =η 0.004 Pa s. Our in vivo humanbrain stiffnesses of the standard linear solid model of =μ 1.3 kPa1 and
=μ 2.1 kPa2 were of the same order as our previously reported ex vivohuman brain stiffnesses of the finite hyper-viscoelastic model of
=μ 0.7 kPa1 and =μ 2.1 kPa2 ; however, our in vivo viscosity of=η 0.025 kPa s was markedly lower than the ex vivo viscosity of=η 20.0 kPa s (Budday et al., 2017).
4.3. Storage and loss moduli in vivo, in situ, and ex vivo
Soft biological tissues are highly sensitive to environmental factors
and immediately change when diseased, dead, excised, or processed forexperimental testing (Mezer et al., 2013). Especially the brain, whichconsumes an essential part of the body's energy, is one of the mostperfused organs, and constantly pressurized, is likely to undergo tissuedegradation in terms of autolytic processes, completion of rigor mortis,and osmotic swelling after death. When comparing the short-termstiffness of living porcine brain in vivo of 1.88 kPa to the stiffnessshortly after death in situ of 2.80 kPa, and to the excised stiffness invitro of 1.36 kPa, studies found an initial stiffness increase of 49% postmortem followed by a stiffness decrease of 49% upon excitation (Gefenand Margulies, 2004). These findings agree with findings in rats, forwhich the storage modulus ′G increased significantly by up to 100%immediately after death but returned to its initial value after 24 h postmortem. At the same time, the loss modulus ″G remained the sameimmediately after death, but decreased by about 50% after 24 h(Vappou et al., 2008). For longer post mortem times of up to 6 h (Garoet al., 2007), 15 h (McElhaney et al., 1973), 48 h (Nicolle et al., 2004),and 100 h (Budday et al., 2015), the storage modulus of porcine brainsremained virtually constant with variations of 5% and less. These ob-servations could explain why our average in situ human brain stiff-nesses of =μ 1.26 kPa1 and =μ 2.07 kPa2 were larger than our pre-viously measured in vitro human brain stiffnesses of
= −μ 0.13 0.74 kPa1 and = −μ 0.91 1.60 kPa2 (Budday et al., 2017).Similarly, our average in situ pig brain storage and loss moduli of
′ = −G 1.73 3.86 kPa and ″ = −G 1.23 2.53 kPa for frequencies rangingfrom 40 to 90 Hz were larger than the average in vitro moduli of
′ = −G 1.15 1.22 kPa and ″ = −G 0.91 1.07 kPa for frequencies rangingfrom 80 Hz to 140 Hz recorded for isolated pig brains (Vappou et al.,2007). Structural differences between living and dead tissues couldexplain why our recorded shear stiffness of the dead porcine brain insitu of =μ 2.001 kPa1 was almost twice as large as the reported shearstiffness of the living brain in vivo of =μ 1, 080 kPa (Miller et al.,2000). Our porcine model is a valuable model system that would allowus to elaborate the origin of these discrepancies in more detail bymaking a direct comparison between living and dead tissue in one andthe same brain.
4.4. Challenges and limitations
Our study demonstrates that established human magnetic resonanceelastography protocols (Kurt et al., 2017) can be directly applied todomestic pigs. Our findings are limited, however, by a number of as-pects. First, our study was based on a single animal, scanned 16 h post-mortem. Both factors have affected the magnitude of the recordedstorage and loss moduli and impeded a direct comparison with thereported human data. Second, we chose similar imaging parameters forboth human and pig which resulted in a coarser resolution for thesmaller pig brain. Although three-dimensional digital brain atlases fordomestic pigs exist (Saikali et al., 2010), there are no automated seg-mentation tools for porcine brains. The reduced in-plane resolutioncomplicated the semi-automatic segmentation and the selection of in-dividual regions when determining region-specific storage and lossmoduli. Third, for the lack of better knowledge, we have simplyadapted existing inversion techniques for human brains to generatestorage and loss moduli maps across the porcine brain. Previous humanbrain elastograms have revealed distortions at the dural folds and at thebrain-skull interface (Clayton et al., 2012), characteristic anatomic lo-cations which are likely different in pigs. Fourth, by their very nature,the elastogram construction and parameter identification are based onthe assumption of a linear material behavior. There is a general con-sensus that brain tissue is a hyper-viscoelastic material (Bilston, 2011;Miller, 2011). It is also well accepted that the brain is stiffer in com-pression than in extension (Miller and Chinzei, 2002). While braintissue displays a significant nonlinear response under moderate de-formations (Budday et al., 2017; Prevost et al., 2011; Li and Cao, 2017),our measured displacement fields were on the order of 10 µm, which
J. Weickenmeier et al. Journal of the Mechanical Behavior of Biomedical Materials 77 (2018) 702–710
708
agrees well with the displacement range reported in the literature(Badachhape et al., 2017). Besides these small deformations, our elas-tography imaging sequence currently limits us to linear inversionschemes when calculating our elastograms. This suggests that a lineartheory symmetric in tension and compression represents a reasonablefirst approximation for our current acceleration parameters and enablesthe identification of meaningful linear viscoelastic material parameters.
4.5. Clinical implications
Pigs have shown promising results as realistic animal models forneurodegenerative disorders and can provide insight into the patho-physiology of brain diseases including dementia (Holm et al., 2016).Their similarity with humans in view of anatomy, myelination, gyr-ification, development, and quantifiable behavior traits promotes pigsas valuable animal models (Sauleau et al., 2009). Most small animalmodels lack fundamental biochemical or genetic manifestations ofneurodegenerative diseases in human, and are therefore insufficient tofully study these diseases. The porcine brain is currently explored as amore realistic alternative to test novel diagnostic tools and exploretreatment strategies in neurodegeneration (Eaton and Wishart, 2017).Towards these goals, our current study provides a first step to establishreliable data acquisition protocols and validate magnetic resonanceelastography as a non-invasive biomarker for stiffness changes in livinghuman and porcine brains in vivo.
Acknowledgements
Johannes Weickenmeier and Ellen Kuhl were supported by the NSFgrant CMMI 1727268 Understanding Neurodegeneration across theScales. Mehmet Kurt was supported by the Stanford Child HealthResearch Institute and the Thrasher Research Foundation Early CareerAward. We thank Richard L. Ehman from the Mayo Clinic Rochester forproviding the activation device and acknowledge his support throughthe NIH grant EB001981. We acknowledge Karla Epperson, KevinEpperson, and Anne M. Saywer from the Richard M. Lucas Center forImaging at Stanford University for their support during the carcassmeasurements and John Martinez from Stevens Institute of Technologyfor his contributions to the data analysis. Scanning of human volunteerswas supported by General Electric Healthcare Tiger Team funding.
References
Anderson, A.T., Van Houten, E.E., McGarry, M.D., Paulsen, K.D., Holtrop, J.L., Sutton,B.P., Georgiadis, J.G., Johnson, C.L., 2016. Observation of direction-dependent me-chanical properties in the human brain with multi-excitation mr elastography. J.Mech. Behav. Biomed. Mater. 59, 538–546.
Atay, S.M., Kroenke, C.D., Sabet, A., Bayly, P.V., 2008. Measurement of the dynamicshear modulus of mouse brain tissue in vivo by magnetic resonance elastography. J.Biomech. Eng. 130 (2), 021013.
Böl, M., Ehret, A.E., Leichsenring, K., Ernst, M., 2015. Tissue-scale anisotropy and com-pressibility of tendon in semi-confined compression tests. J. Biomech. 48 (6),1092–1098.
Badachhape, A.A., Okamoto, R.J., Durham, R.S., Efron, B.D., Nadell, S.J., Johnson, C.L.,Bayly, P.V., 2017. The relationship of three-dimensional human skull motion to braintissue deformation in magnetic resonance elastography studies. J. Biomed. Eng. 139.
Bilston, L.E., 2011. Neural Tissue Biomechanics. Springer, Berlin Heidelberg.Budday, S., Nay, R., de Rooij, R., Steinmann, P., Wyrobek, T., Ovaert, T.C., Kuhl, E., 2015.
Mechanical properties of gray and white matter brain tissue by indentation. J. Mech.Behav. Biomed. Mater. 46, 318–330.
Budday, S., Sommer, G., Langkammer, C., Hayback, J., Kohnert, J., Bauer, M., Paulsen, F.,Steinmann, P., Kuhl, E., Holzapfel, G., 2017. Mechanical characterization of humanbrain tissue. Acta Biomater. 48, 319–340.
Budday, S., Sommer, G., Hayback, J., Steinmann, P., Holzapfel, G., Kuhl, E., 2017.Rheological characterization of human brain tissue. Acta Biomater. 60, 315–329.
Chartrain, A.G., Kurt, M., Yao, A., Feng, R., Nael, K., Mocco, J., Bederson, J.B.,Balchandani, P., Shrivastava, R.K., 2017. Utility of preoperative meningioma con-sistencymeasurement with magnetic resonance elastography (MRE): a review. WorldNeurosurg. http://dx.doi.org/10.1007/s10143–017–0862–8.
Clayton, E.H., Genin, G.M., Bayly, P.V., 2012. Transmission, attenuation and reflection ofshear waves in the human brain. J. R. Soc. Interface 9 (76), 2899–2910.
de Rooij, R., Kuhl, E., 2016. Constitutive modeling of brain tissue: current perspectives.
Appl. Mech. Rev. 68 (1), 010801.Doyley, M., 2012. Model-based elastography: a survey of approaches to the inverse
elasticity problem. Phys. Med. Biol. 57 (3), R35.Eaton, S., Wishart, T., 2017. Bridging the gap: large animal models in neurodegenerative
research. Mamm. Genome 1–14.Feng, Y., Clayton, E., Chang, Y., Okamoto, R., Bayly, P., 2013. Viscoelastic properties of
the ferret brain measured in vivo at multiple frequencies by magnetic resonanceelastography. J. Biomech. 46 (5), 863–870.
Feng, Y., Clayton, E., Okamoto, R., Engelbach, J., Bayly, P., Garbow, J., 2016. A long-itudinal magnetic resonance elastography study of murine brain tumors followingradiation therapy. Phys. Med. Biol. 61 (16), 6121.
Franceschini, G., Bigoni, D., Regitnig, P., Holzapfel, G.A., 2006. Brain tissue deforms si-milarly to filled elastomers and follows consolidation theory. J. Mech. Phys. Solids54, 2592–2620.
Garo, A., Hrapko, M., Van Dommelen, J., Peters, G., 2007. Towards a reliable char-acterisation of the mechanical behaviour of brain tissue: the effects of post-mortemtime and sample preparation. Biorheology 44 (1), 51–58.
Gefen, A., Margulies, S.S., 2004. Are in vivo and in situ brain tissues mechanically si-milar? J. Biomech. 37 (9), 1339–1352.
Glaser, K.J., Manduca, A., Ehman, R.L., 2012. Review of MR elastography applicationsand recent developments. J. Magn. Reson. Imaging 36 (4), 757–774.
Green, M.A., Bilston, L.E., Sinkus, R., 2008. In vivo brain viscoelastic properties measuredby magnetic resonance elastography. NMR Biomed. 21, 755–764.
Holm, I.E., Alstrup, A.K.O., Luo, Y., 2016. Genetically modified pig models for neuro-degenerative disorders. J. Pathol. 238 (2), 267–287.
Jean, A., Nyein, M.K., Zheng, J.Q., Moore, D.F., Joannopoulos, J.D., Radovitzky, R., 2014.An animal-to-human scaling law for blast-induced traumatic brain injury risk as-sessment. Proc. Natl. Acad. Sci. 111 (43), 15310–15315.
Kruse, S.A., Rose, G.H., Glaser, K.J., Manduca, A., Felmlee, J.P., Jack, C.R., Ehman, R.L.,2008. Magnetic resonance elastography of the brain. Neuroimage 39 (1), 231–237.
Kurt, M., Lv, H., Laksari, K., Wu, L., Epperson, K., Epperson, K., Sawyer, A.M., Camarillo,D.B., Butts Pauly, K., Wintermark, M., 11–14 October, 2017. In vivo multi-frequencymagnetic resonance elastography of the human brain: Which frequencies matter? In:Biomedical Engineering Society Annual Meeting. Phoenix, AZ, USA.
Laksari, K., Wu, L.C., Kurt, M., Kuo, C., Camarillo, D.C., 2015. Resonance of human brainunder head acceleration. J. R. Soc. Interface 12 (108), 20150331.
Li, G.-Y., Cao, Y., 2017. Mechanics of ultrasound elastography. Proc. R. Soc. A 473,20160841.
Mariappan, Y.K., Glaser, K.J., Ehman, R.L., 2010. Magnetic resonance elastography: areview. Clin. Anat. 23 (5), 497–511.
McCracken, P.J., Manduca, A., Felmlee, J., Ehman, R.L., 2005. Mechanical transient-based magnetic resonance elastography. Magn. Reson. Med. 53 (3), 628–639.
McElhaney, J.H., Melvin, J.W., Roberts, V.L., Portnoy, H.D., 1973. Dynamic character-istics of the tissues of the head. Perspect. Biomed. Eng. 215–222.
Mezer, A., Yeatman, J.D., Stikov, N., Kay, K.N., Cho, N.-J., Dougherty, R.F., Perry, M.L.,Parvizi, J., Hua, L.H., Butts Pauly, K., Wandell, B.A., 2013. Quantifying the localtissue volume and composition in individual brains with magnetic resonance ima-ging. Nat. Med. 19 (12), 1667–1672.
Miller, K., Chinzei, K., 2002. Mechanical properties of brain tissue in tension. J. Biomech.35, 483–490.
Miller, K., Chinzei, K., Orssengo, G., Bednorz, P., 2000. Mechanical properties of braintissue in-vivo: experiment and computer simulation. J. Biomech. 33, 1369–1376.
Miller, K., 2011. Biomechanics of the Brain. Springer, New York.Murphy, M.C., Huston, J., Jack, C.R., Glaser, K.J., Manduca, A., Felmlee, J.P., Ehman,
R.L., 2011. Decreased brain stiffness in Alzheimer's disease determined by magneticresonance elastography. J. Magn. Reson. Imaging 34 (3), 494–498.
Muthupillai, R., Ehman, R., 1996. Magnetic resonance elastography. Nat. Med. 2 (5),601–603.
Muthupillai, R., Lomas, D., Rossman, P., Greenleaf, J.F., Greenleaf, J., Ehman, R., 1995.Magnetic resonance elastography by direct visualization of propagating acousticstrain waves. Science 269 (5232), 1854–1857.
Nicolle, S., Lounis, M., Willinger, R., 2004. Shearproperties of brain tissue over a fre-quency range relevant for automotive impact situations: new experimental results.Stapp Car Crash J. 48, 239.
Oliphant, T.E., Manduca, A., Ehman, R.L., Greenleaf, J.F., 2001. Complex-valued stiffnessreconstruction for magnetic resonance elastography by algebraic inversion of thedifferential equation. Magn. Reson. Med. 45 (2), 299–310.
Papazoglou, S., Hamhaber, U., Braun, J., Sack, I., 2008. Algebraic Helmholtz inversion inplanar magnetic resonance elastography. Phys. Med. Biol. 53 (12), 3147–3158.
Plewes, D.B., Bishop, J., Samani, A., Sciarretta, J., 2000. Visualization and quantificationof breast cancer biomechanical properties with magnetic resonance elastography.Phys. Med. Biol. 45 (6), 1591–1610.
Prevost, T.P., Jin, G., De Moya, M.A., Alam, H.B., Suresh, S., Socrate, S., 2011. Dynamicmechanical response of brain tissue in indentation in vivo, in situ and in vitro. ActaBiomater. 7 (12), 4090–4101.
Sack, I., Bernarding, J., Braun, J., 2002. Analysis of wave patterns in mr elastography ofskeletal muscle using coupled harmonic oscillator simulations. Magn. Reson. Imaging20 (1), 95–104.
Sack, I., Beierbach, B., Wuerfel, J., Klatt, D., Hamhaber, U., Papazoglou, S., Martus, P.,Braun, J., 2009. The impact of aging and gender on brain viscoelasticity. Neuroimage46 (3), 652–657.
Saikali, S., Meurice, P., Sauleau, P., Eliat, P.-A., Bellaud, P., Randuineau, G., Vérin, M.,Malbert, C.-H., 2010. A three-dimensional digital segmented and deformable brainatlas of the domestic pig. J. Neurosci. Methods 192 (1), 102–109.
Sauleau, P., Lapouble, E., Val-Laillet, D., Malbert, C.-H., 2009. The pig model in brainimaging and neurosurgery. Animal 3 (08), 1138–1151.
J. Weickenmeier et al. Journal of the Mechanical Behavior of Biomedical Materials 77 (2018) 702–710
709
Schregel, K., Wuerfel, E., Garteiser, P., Gemeinhardt, I., Prozorovski, T., Aktas, O., Merz,H., Petersen, D., Wuerfel, J., Sinkus, R., 2012. Demyelination reduces brain par-enchymal stiffness quantified in vivo by magnetic resonance elastography. Proc. Natl.Acad. Sci. 109 (17), 6650–6655.
Shridharani, J.K., Wood, G.W., Panzer, M.B., Capeart, B.P., Nyein, M.K., Radovitzky, R.A.,Bass, C.R., 2012. Porcine head response to blast. Front. Neurol. 3, 70.1–70.12.
Streitberger, K.-J., Sack, I., Krefting, D., Pfüller, C., Braun, J., Paul, F., Wuerfel, J., 2012.Brain viscoelasticity alteration in chronic-progressive multiple sclerosis. PloS One 7(1), e29888.
van Dommelen, J.A.W., van der Sande, T.P.J., Hrapko, M., Peters, G.W.M., 2010.Mechanical properties of brain tissue by indentation: interregional variation. J. Mech.Behav. Biomed. Mater. 3 (2), 158–166.
Van Houten, E.E., Doyley, M.M., Kennedy, F.E., Weaver, J.B., Paulsen, K.D., 2003. Initial
in vivo experience with steady-state subzone-based mr elastography of the humanbreast. J. Magn. Reson. Imaging 17 (1), 72–85.
Vappou, J., Breton, E., Choquet, P., Goetz, C., Willinger, R., Constantinesco, A., 2007.Magnetic resonance elastography compared with rotational rheometry for in vitrobrain tissue viscoelasticity measurement. Magn. Reson. Mater. Phys. Biol. Med. 20(5), 273–278.
Vappou, J., Breton, E., Choquet, P., Willinger, R., Constantinesco, A., 2008. Assessment ofin vivo and post-mortem mechanical behavior of brain tissue using magnetic re-sonance elastography. J. Biomech. 41 (14), 2954–2959.
Weickenmeier, J., de Rooij, R., Budday, S., Steinmann, P., Ovaert, T., Kuhl, E., 2016.Brain stiffness increases with myelin content. Acta Biomater. 42, 265–272.
Zhang, J., Green, M.A., Sinkus, R., Bilston, L.E., 2011. Viscoelastic properties of humancerebellum using magnetic resonance elastography. J. Biomech. 44 (10), 1909–1913.
J. Weickenmeier et al. Journal of the Mechanical Behavior of Biomedical Materials 77 (2018) 702–710
710