Embed Size (px)
Citation preview
INTRODUCTION
Soft tissue masses are frequently encountered in thepodiatric physician’s practice. Most are relatively commonand the presumed diagnosis is made on the basis of thehistory and clinical findings. Definitive diagnosis is madeonly with pathologic examination. Soft tissue masses thathave been present for longer periods of time with slowprogression in size can be presumed to be benign. Suchcommon masses are plantar fibromas, ganglion cysts, andintermetatarsal neuromas. These soft tissue masses are socommonly encountered that magnetic resonance imaging(MRI) would be rarely indicated. Of course, if these have anunusual presentation by history or examination, anMRImaybe helpful.
Soft tissue masses that have an unclear etiology, shortduration, rapid growth, or physical changes, and do nothave typical findings on clinical examination shouldundergo an MRI examination. Plantar masses notconsistent with plantar fibromas, and dorsal soft tissuemasses not consistent with ganglion cysts may require MRIevaluation. AlthoughMRI may be best suited in evaluationof soft tissue masses, it is only suggestive of potentialdiagnoses. A definitive diagnosis can not be made until anincisional or excisional biopsy has been performed.
OTHER IMAGING MODALITIES
Standard radiographs should be obtained in new patientspresenting with reports of pain without obvious structuraldeformity and with obvious soft tissue masses. Standardradiographs have generally poor soft tissue visualization,but are obtained in soft tissue masses to evaluate forunderlying bony changes or involvement, foreign bodies,soft tissue outlines, and any changes in density associatedwith the soft tissue mass.
Ultrasound can be useful in determining the locationand size of soft tissue masses. They are generally non-specific but with clinical knowledge of the characteristics ofsoft tissue masses can be more predictive. Ultrasound hassignificant benefit in needle-guided biopsy, drainage, orinjection of soft tissue masses.
Computed tomography (CT) imaging has poor softtissue visualization. It is best utilized when examination ofjoint surfaces, cortical margins, and subtle changes withinthe osseous structures is desired. CT can confirm thepresence of fat and calcifications within a soft tissue mass.
Proton emission tomography (PET) scanning has notbeen proven to characterize soft tissue masses morespecifically than MRI. It is best utilized in full bodyscanning identifying metastasis of malignancies.Combining PET scanning with CT imaging improves theability to identify musculoskeletal neoplasm.
MRI EVALUATION
Magnetic resonance imaging is still the study of choice forevaluation of soft tissue masses. The signal characteristicsand the location of the soft tissue mass will helppotentially identify the mass. Still at best, MRI offers onlysuggestive diagnoses. MRI can define the tumors marginsand location. It is best for assisting in developing asurgical plan for excision or biopsy of a soft tissue mass.MRI is best at distinguishing between a benign versus apotentially malignant soft tissue mass. Gadoliniumenhancement may also improve the ability of an MRI indifferentiating a malignant lesion from other benigncystic structures.
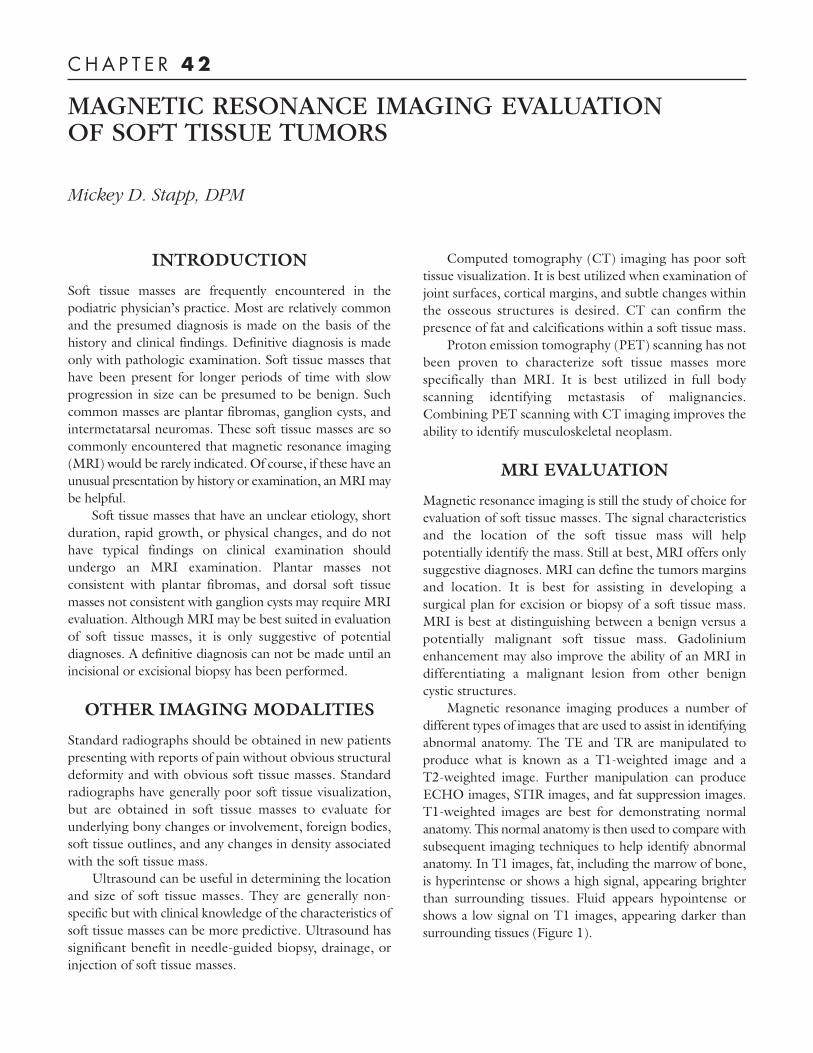
Magnetic resonance imaging produces a number ofdifferent types of images that are used to assist in identifyingabnormal anatomy. The TE and TR are manipulated toproduce what is known as a T1-weighted image and aT2-weighted image. Further manipulation can produceECHO images, STIR images, and fat suppression images.T1-weighted images are best for demonstrating normalanatomy. This normal anatomy is then used to compare withsubsequent imaging techniques to help identify abnormalanatomy. In T1 images, fat, including the marrow of bone,is hyperintense or shows a high signal, appearing brighterthan surrounding tissues. Fluid appears hypointense orshows a low signal on T1 images, appearing darker thansurrounding tissues (Figure 1).
MAGNETIC RESONANCE IMAGING EVALUATIONOF SOFT TISSUE TUMORS
Mickey D. Stapp, DPM
C H A P T E R 42
CHAPTER 42 247
On T2-weighted images, fat now appears hypointenseand fluid appears hyperintense. Therefore the fat, includingthe marrow of bone, becomes dark much like thesurrounding cortical bone. In the T1-weighted image, thecortical bone, due to its relatively low percentage of water,appears hypointense. Fluid, such as in cystic structures,edema, abscesses, and that associated with inflammation willappear hyperintense, or brighter than surrounding tissues onT2-weighted imaging (Figure 2). Fat suppression or STIRimages will suppress fat, making it much more hypointense,and accentuates fluid. This is generally utilized in fattytumors or soft tissue masses within areas of fat.
NON-NEOPLASTICSOFT TISSUE LESIONS
Non-neoplastic soft tissue lesions are not tumors but lesionsthought to arise from some traumatic or inflammatoryorigin or are proliferations of synovial tissue. Traumatic orinflammatory originated lesions include ganglions, bursas,intermetatarsal neuromas, rheumatoid nodules, epidermoidcysts, and foreign body granulomas. Synovial proliferativelesions include pigmented villonodular synovitis (PVNS) andgiant cell tumors.
Ganglion cysts are the most common soft tissue mass.They represent a mucoid cystic degeneration of soft tissuenear or communicating with a joint or tendon sheath.They are believed to be a result of repetitive trauma. Mostganglion cyst appear on the dorsum of the foot and ankleand occasionally on the medial or lateral borders of thefoot or ankle. Rarely do the cystic structures appear on theplantar surface of the foot. On MRI evaluation, ganglioncysts are well defined but may be lobulated or septated.
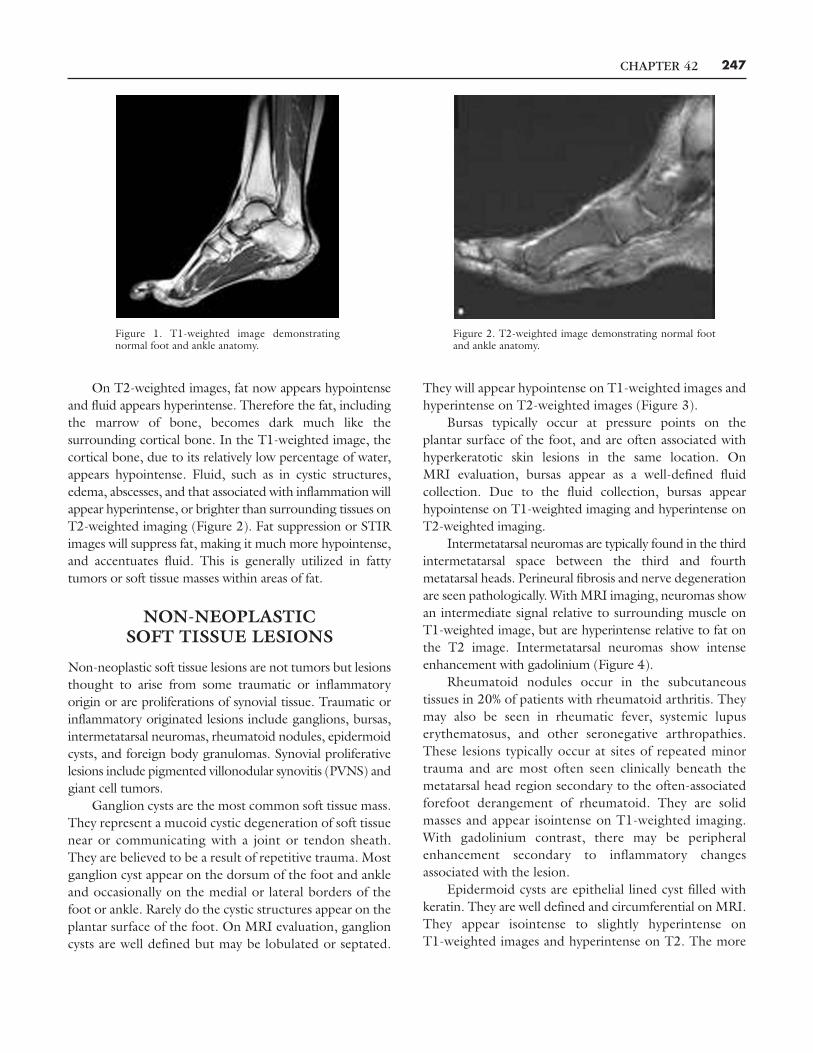
They will appear hypointense on T1-weighted images andhyperintense on T2-weighted images (Figure 3).
Bursas typically occur at pressure points on theplantar surface of the foot, and are often associated withhyperkeratotic skin lesions in the same location. OnMRI evaluation, bursas appear as a well-defined fluidcollection. Due to the fluid collection, bursas appearhypointense on T1-weighted imaging and hyperintense onT2-weighted imaging.
Intermetatarsal neuromas are typically found in the thirdintermetatarsal space between the third and fourthmetatarsal heads. Perineural fibrosis and nerve degenerationare seen pathologically. WithMRI imaging, neuromas showan intermediate signal relative to surrounding muscle onT1-weighted image, but are hyperintense relative to fat onthe T2 image. Intermetatarsal neuromas show intenseenhancement with gadolinium (Figure 4).
Rheumatoid nodules occur in the subcutaneoustissues in 20% of patients with rheumatoid arthritis. Theymay also be seen in rheumatic fever, systemic lupuserythematosus, and other seronegative arthropathies.These lesions typically occur at sites of repeated minortrauma and are most often seen clinically beneath themetatarsal head region secondary to the often-associatedforefoot derangement of rheumatoid. They are solidmasses and appear isointense on T1-weighted imaging.With gadolinium contrast, there may be peripheralenhancement secondary to inflammatory changesassociated with the lesion.
Epidermoid cysts are epithelial lined cyst filled withkeratin. They are well defined and circumferential on MRI.They appear isointense to slightly hyperintense onT1-weighted images and hyperintense on T2. The more
Figure 2. T2-weighted image demonstrating normal footand ankle anatomy.
Figure 1. T1-weighted image demonstratingnormal foot and ankle anatomy.
CHAPTER 42248
dense the cyst or the more calcifications present, the morelikely scattered foci of hypointensity will be noted. Thesecysts are only mildly enhanced with gadolinium.
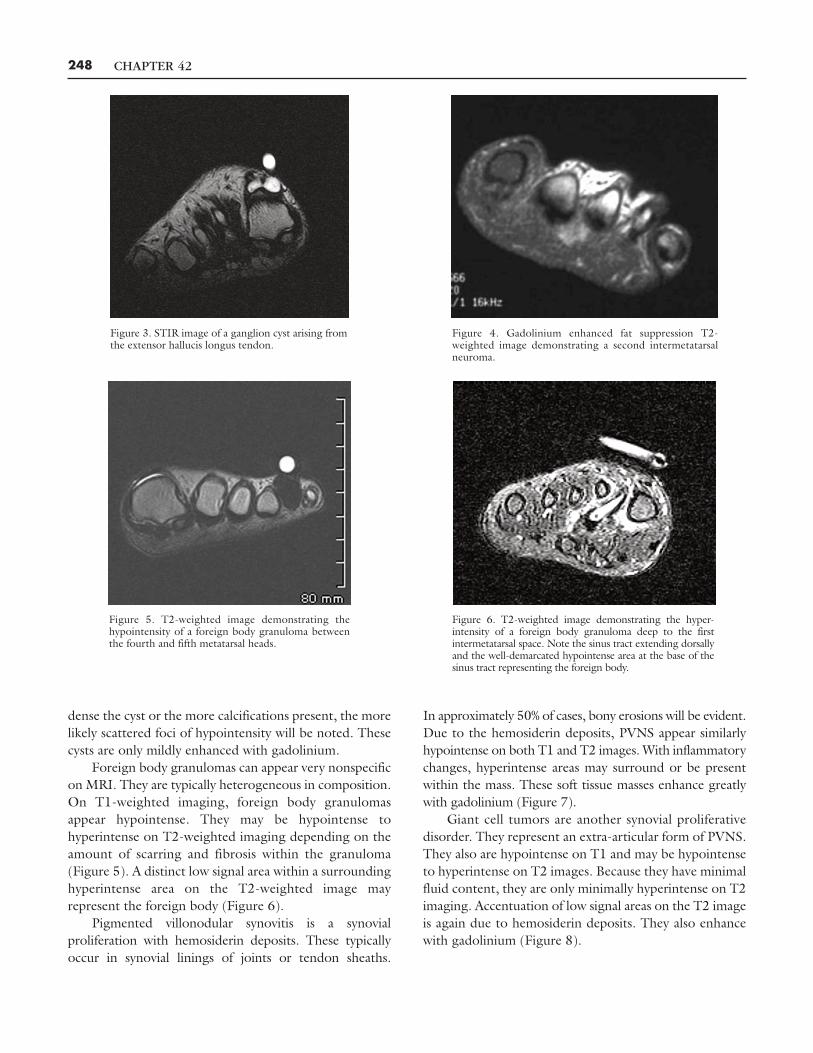
Foreign body granulomas can appear very nonspecificon MRI. They are typically heterogeneous in composition.On T1-weighted imaging, foreign body granulomasappear hypointense. They may be hypointense tohyperintense on T2-weighted imaging depending on theamount of scarring and fibrosis within the granuloma(Figure 5). A distinct low signal area within a surroundinghyperintense area on the T2-weighted image mayrepresent the foreign body (Figure 6).
Pigmented villonodular synovitis is a synovialproliferation with hemosiderin deposits. These typicallyoccur in synovial linings of joints or tendon sheaths.
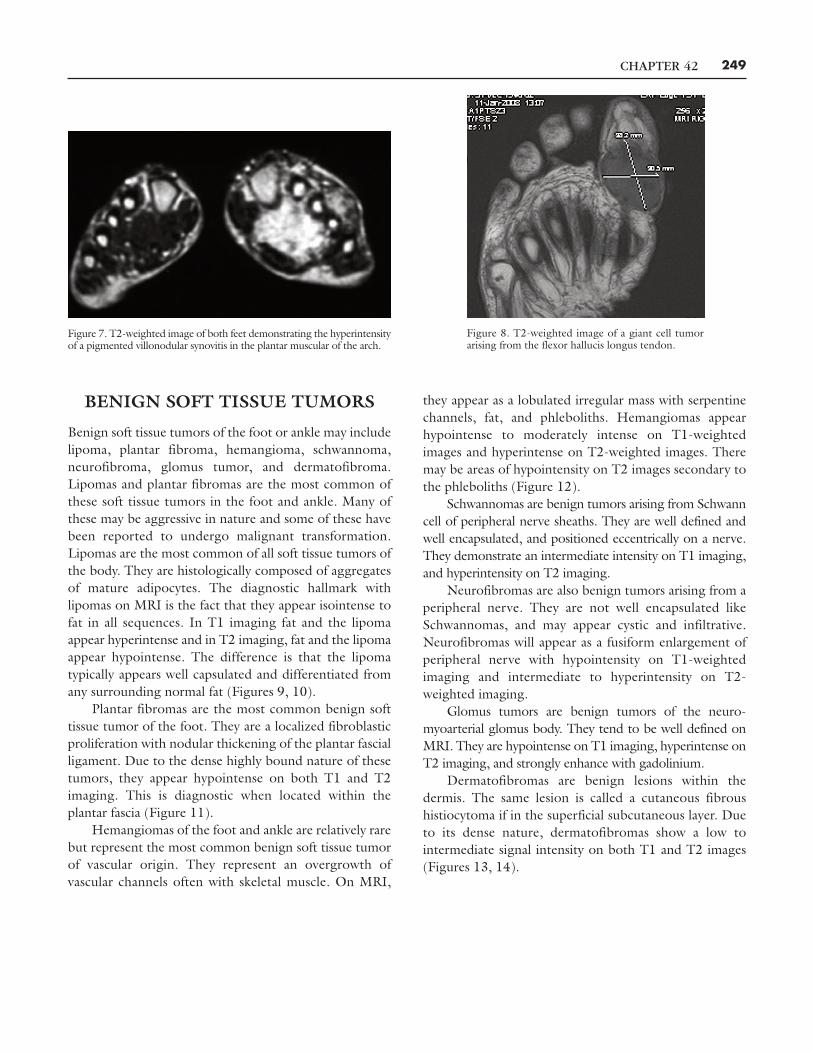
In approximately 50% of cases, bony erosions will be evident.Due to the hemosiderin deposits, PVNS appear similarlyhypointense on both T1 and T2 images. With inflammatorychanges, hyperintense areas may surround or be presentwithin the mass. These soft tissue masses enhance greatlywith gadolinium (Figure 7).
Giant cell tumors are another synovial proliferativedisorder. They represent an extra-articular form of PVNS.They also are hypointense on T1 and may be hypointenseto hyperintense on T2 images. Because they have minimalfluid content, they are only minimally hyperintense on T2imaging. Accentuation of low signal areas on the T2 imageis again due to hemosiderin deposits. They also enhancewith gadolinium (Figure 8).
Figure 3. STIR image of a ganglion cyst arising fromthe extensor hallucis longus tendon.
Figure 4. Gadolinium enhanced fat suppression T2-weighted image demonstrating a second intermetatarsalneuroma.
Figure 5. T2-weighted image demonstrating thehypointensity of a foreign body granuloma betweenthe fourth and fifth metatarsal heads.
Figure 6. T2-weighted image demonstrating the hyper-intensity of a foreign body granuloma deep to the firstintermetatarsal space. Note the sinus tract extending dorsallyand the well-demarcated hypointense area at the base of thesinus tract representing the foreign body.
CHAPTER 42 249
BENIGN SOFT TISSUE TUMORS
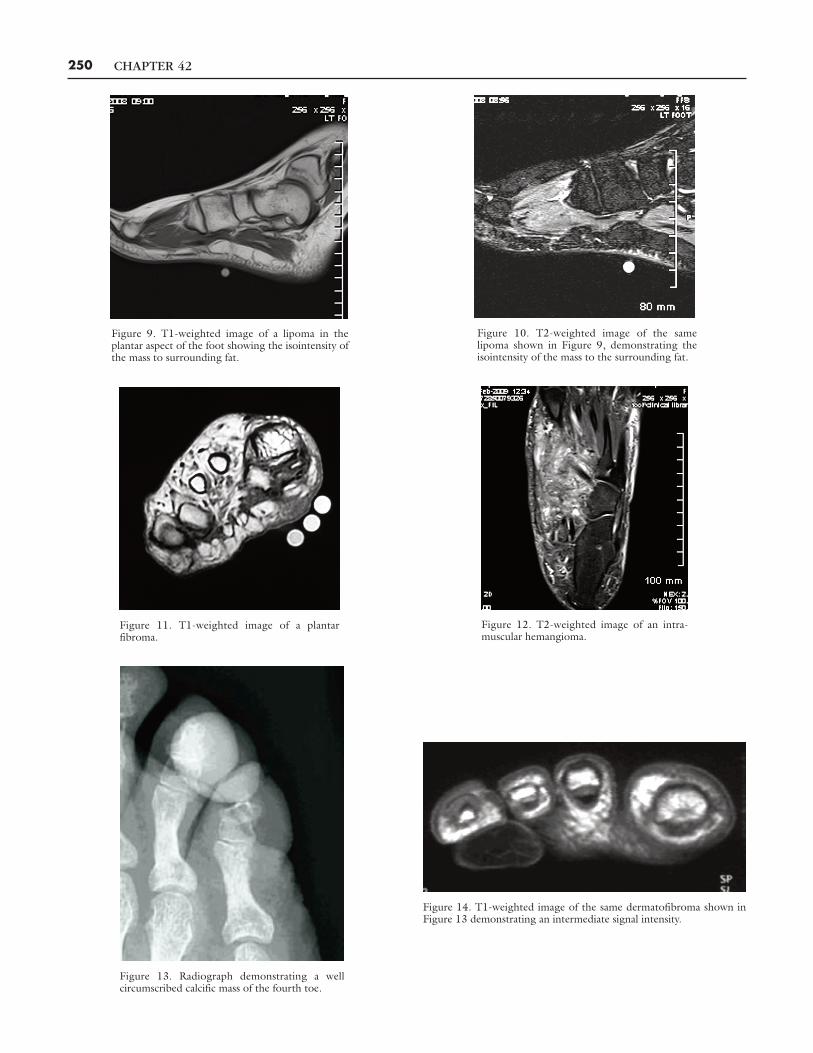
Benign soft tissue tumors of the foot or ankle may includelipoma, plantar fibroma, hemangioma, schwannoma,neurofibroma, glomus tumor, and dermatofibroma.Lipomas and plantar fibromas are the most common ofthese soft tissue tumors in the foot and ankle. Many ofthese may be aggressive in nature and some of these havebeen reported to undergo malignant transformation.Lipomas are the most common of all soft tissue tumors ofthe body. They are histologically composed of aggregatesof mature adipocytes. The diagnostic hallmark withlipomas on MRI is the fact that they appear isointense tofat in all sequences. In T1 imaging fat and the lipomaappear hyperintense and in T2 imaging, fat and the lipomaappear hypointense. The difference is that the lipomatypically appears well capsulated and differentiated fromany surrounding normal fat (Figures 9, 10).
Plantar fibromas are the most common benign softtissue tumor of the foot. They are a localized fibroblasticproliferation with nodular thickening of the plantar fascialligament. Due to the dense highly bound nature of thesetumors, they appear hypointense on both T1 and T2imaging. This is diagnostic when located within theplantar fascia (Figure 11).
Hemangiomas of the foot and ankle are relatively rarebut represent the most common benign soft tissue tumorof vascular origin. They represent an overgrowth ofvascular channels often with skeletal muscle. On MRI,
they appear as a lobulated irregular mass with serpentinechannels, fat, and phleboliths. Hemangiomas appearhypointense to moderately intense on T1-weightedimages and hyperintense on T2-weighted images. Theremay be areas of hypointensity on T2 images secondary tothe phleboliths (Figure 12).
Schwannomas are benign tumors arising from Schwanncell of peripheral nerve sheaths. They are well defined andwell encapsulated, and positioned eccentrically on a nerve.They demonstrate an intermediate intensity on T1 imaging,and hyperintensity on T2 imaging.
Neurofibromas are also benign tumors arising from aperipheral nerve. They are not well encapsulated likeSchwannomas, and may appear cystic and infiltrative.Neurofibromas will appear as a fusiform enlargement ofperipheral nerve with hypointensity on T1-weightedimaging and intermediate to hyperintensity on T2-weighted imaging.
Glomus tumors are benign tumors of the neuro-myoarterial glomus body. They tend to be well defined onMRI. They are hypointense on T1 imaging, hyperintense onT2 imaging, and strongly enhance with gadolinium.
Dermatofibromas are benign lesions within thedermis. The same lesion is called a cutaneous fibroushistiocytoma if in the superficial subcutaneous layer. Dueto its dense nature, dermatofibromas show a low tointermediate signal intensity on both T1 and T2 images(Figures 13, 14).
Figure 8. T2-weighted image of a giant cell tumorarising from the flexor hallucis longus tendon.
Figure 7. T2-weighted image of both feet demonstrating the hyperintensityof a pigmented villonodular synovitis in the plantar muscular of the arch.
CHAPTER 42250
Figure 9. T1-weighted image of a lipoma in theplantar aspect of the foot showing the isointensity ofthe mass to surrounding fat.
Figure 10. T2-weighted image of the samelipoma shown in Figure 9, demonstrating theisointensity of the mass to the surrounding fat.
Figure 11. T1-weighted image of a plantarfibroma.
Figure 14. T1-weighted image of the same dermatofibroma shown inFigure 13 demonstrating an intermediate signal intensity.
Figure 13. Radiograph demonstrating a wellcircumscribed calcific mass of the fourth toe.
Figure 12. T2-weighted image of an intra-muscular hemangioma.
CHAPTER 42 251
MALIGNANT SOFTTISSUE LESIONS
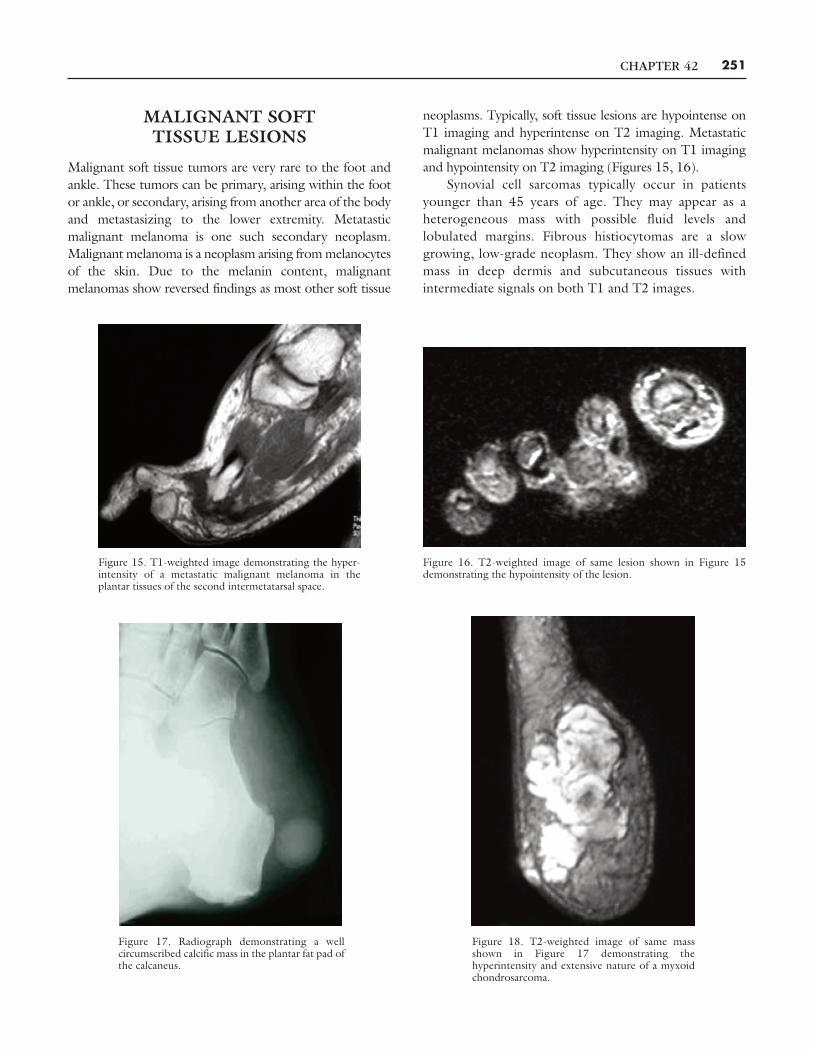
Malignant soft tissue tumors are very rare to the foot andankle. These tumors can be primary, arising within the footor ankle, or secondary, arising from another area of the bodyand metastasizing to the lower extremity. Metatasticmalignant melanoma is one such secondary neoplasm.Malignant melanoma is a neoplasm arising frommelanocytesof the skin. Due to the melanin content, malignantmelanomas show reversed findings as most other soft tissue
neoplasms. Typically, soft tissue lesions are hypointense onT1 imaging and hyperintense on T2 imaging. Metastaticmalignant melanomas show hyperintensity on T1 imagingand hypointensity on T2 imaging (Figures 15, 16).
Synovial cell sarcomas typically occur in patientsyounger than 45 years of age. They may appear as aheterogeneous mass with possible fluid levels andlobulated margins. Fibrous histiocytomas are a slowgrowing, low-grade neoplasm. They show an ill-definedmass in deep dermis and subcutaneous tissues withintermediate signals on both T1 and T2 images.
Figure 15. T1-weighted image demonstrating the hyper-intensity of a metastatic malignant melanoma in theplantar tissues of the second intermetatarsal space.
Figure 16. T2-weighted image of same lesion shown in Figure 15demonstrating the hypointensity of the lesion.
Figure 18. T2-weighted image of same massshown in Figure 17 demonstrating thehyperintensity and extensive nature of a myxoidchondrosarcoma.
Figure 17. Radiograph demonstrating a wellcircumscribed calcific mass in the plantar fat pad ofthe calcaneus.
CHAPTER 42252
Myoid chondrosarcomas are low-grade soft tissuesarcomas. They appear isointense to muscle on T1 imagesand hyperintense on T2 images. They may show centralareas of hypointensity due to calcifications. They willenhance markedly with gadolimium (Figures 17, 18).
CONCLUSION
Fortunately, soft tissue malignancies are very rare in thefoot and ankle. For soft tissue masses that do not appeartypical in clinical history or examination, MRI offers themost diagnostic assistance in determining the possibledifferential diagnoses and aiding in planning surgicalapproach to the soft tissue mass. For common soft tissuemasses such as neuromas and plantar fibromas, MRI isoften not necessary. If the mass is of short duration and/orshows rapid growth, then an MRI should be performed.Musculoskeletal radiologist should be consulted for reviewof the MRI whenever possible, and the diagnosis must beconfirmed through pathologic review.
BIBLIOGRAPHYAshman CF, Klecker RF, Yu JS. Forefoot pain involving the metatarsal
region: differential diagnosis with MR imaging. RadioGraphics2001;21:1425-40.
Bancroft LW, Peterson JJ, Kransdorf MJ. Imaging of soft tissue lesionsof the foot and ankle. Rad Clin N Am 2008;46:1093-103.
Jordan T, Bowman W, Ballinger C, Green D. Malignant Soft TissueLesions of the Foot and Ankle. In: Reconstructive Surgery of theFoot and Leg: Update 2006, Tucker (GA): The Podiatry Institute;2006.
Levey DS, Park YH, Sartoris DJ. Imaging of pedal soft tissue neoplasms.J Foot Ankle Surg 1995;34:411-9.
Llauger J, Palmer J, Monill JM, et al. MR imaging of benign soft-tissuemasses of the foot and ankle. RadioGraphics 1998;18:1481-98.
Pham H, Fessell DP, Femino JE, et al. Sonography and MR imaging ofselected benign masses in the ankle and foot. Am J Rad2003;180:99-107.
Roberts CC, Morrison WB, Liu PT. Imaging evaluation of foot and anklepathology: self-asseessment module. Am J Rad 2008;90:S18-22.
Waldt S, Rechl H, Rummeny EJ, Woertler K. Imaging of benign andmalignant soft tissue masses of the foot. Eur Radiol 2003;13:1125-36.