Embed Size (px)
Citation preview

Chapter One
INTRODUCTION TO THE INDUSTRY
HIGHLIGHTS:
History of the automobile industry
Status of the automobile industry in the world
Introduction to the automotive industry
Auto component manufacturers
1

Chapter One
HISTORY OF THE AUTOMOBILE INDUSTRY
Automobiles as we know them today are the product of centuries of tinkering and innovation.
Automobile production has grown from small companies making simple so-called horseless
carriages to international corporations that mass-produce advanced, reliable automobiles for
consumers.
Early automobile concept
In the 15th century, Italian inventor Leonardo da Vinci envisioned possibilities for
power-driven vehicles. By the late 17th century, English physicist Sir Isaac Newton had
proposed a steam carriage, and by the late 18th century French army captain Nicholas-Joseph
Cugnot had actually built one. By the mid-1800s, the popularity of steam vehicles began to
decline because they were dangerous to operate and difficult to maintain. At about the same
time, inventors became interested in the internal-combustion engine.
Robert Street of England filed a patent in 1794 that summarized how an internal-
combustion engine might work, but it was Belgian-born French inventor Jean-Joseph-Étienne
Lenoir who built the first commercially successful internal-combustion engine in 1859.
Lenoir’s engine had a carburetor that mixed liquid hydrocarbons, which formed a vapor. An
electric spark in a cylinder ignited the vapor. By 1876 German shop clerk Nikolaus August
Otto had improved on Lenoir's engine, and the Otto engine became the model of the internal-
combustion engines used today. Germans Gottlieb Daimler and Karl Benz attached motors to
tricycles and automobiles, building what are regarded as the first modern cars in 1885 and
1886 (DaimlerChrysler AG).
In America, lawyer George Baldwin Selden studied many of the European engines at the
Philadelphia Centennial Exposition of 1876, then redesigned what he considered to be the
best among them. He reduced the engine weight so it could power a light road vehicle.
2
Selden patented his engine, so he ultimately received a royalty, or small payment, for almost
every car made in the United States.
Charles Edgar Duryea and his brother Frank are credited with the first production
automobile made in the United States. Their small company produced 13 cars in 1896,
ushering in the automobile industry. Only a few more cars were sold in the following year,
and the brothers split up to follow separate interests.
Henry Ford and Mass Production
Several small automobile manufacturers were making cars in the early 1900s, but
American Henry Ford helped popularize the idea that anyone could own a car. Ford
successfully challenged the Selden patent in court, opening the door for increased automobile
manufacturing. Ford achieved initial success by making cars in large quantities to reduce
costs and by making them simple enough so many consumers could easily operate them.
Ford standardized parts and reorganized factory production to maximize efficiency.
Ford made the sturdy, black Model T using mass production, the most economical way
to make the maximum number of similar copies of the car. He understood that efficient mass
production would lower car prices, making cars affordable for the average person, thus
generating a huge market. From 1910 to 1924, Ford cars decreased steadily in price as they
improved in quality. The Ford Model F in 1904 weighed 630 kg (1,400 lb), had a two-
cylinder motor, and sold for $1,200. By 1924 the Ford Model T touring car was heavier at
680 kg (1,500 lb), had a more powerful four-cylinder motor, and included a top and
windshield—yet it sold for only $290. Ford made only minor changes to the Model T for
nearly two decades, and more than half of the cars sold in the United States were Model Ts
during many of those years.
Other Automakers
While Ford was perfecting his Model T, William C. Durant established the General Motors
Corporation (GM) in 1908. Durant combined the Buick, Oldsmobile, and Oakland
companies, and later Cadillac, to form GM. The firm started by Louis Chevrolet was added
in 1918. General Motors weathered numerous financial crises in its early years, finally
3

gaining stability when the du Pont family bought much GM stock (since divested) in 1920.
The invention by Charles Franklin Kettering of the electric self-starter in 1912 was a
benchmark in U.S. automotive development, but others quickly followed, including balloon
tires in 1921. Among other U.S. automotive pioneers were brothers John and Horace Dodge,
machinists and bicycle builders after whom the Dodge car is named, and Walter Percy
Chrysler, a railroad worker who later formed Chrysler Corporation. Ford, GM, and Chrysler,
known as the Big Three, eventually became the dominant automakers in America.
In 1914 Ford announced a generous, unprecedented $5 per day wage for workers who
were with the company more than six months, doubling the previous wage. He wanted
workers to be able to afford the cars they made, but he also wanted to stabilize his workforce,
which had high turnover due to the repetition of assembly-line work. U.S. assembly line
production satisfied the huge American market for vehicles and allowed American carmakers
to dominate early auto manufacturing. By 1916 annual U.S. auto production reached one
million units, a level not reached by any other country until England about 40 years later.
By 1920 Ford's success in building an inexpensive, durable car had produced a large
secondhand car market, which meant that new Fords had to compete with old Fords. In the
late 1920s and early 1930s General Motors Chairman Alfred Pritchard Sloan, Jr., decided to
follow a different strategy. He implemented the annual model and offered different lines of
cars at different prices, creating a ladder of consumption that consumers could climb. These
concepts helped GM challenge the dominance of Ford. In 1924 GM had about 19 percent of
U.S. new-car sales and Ford had just over 50 percent. Just two years later GM cut Ford’s lead
down to 35 percent and raised GM’s market share to 28 percent.
European and Japanese automakers were also growing in this new industry. In 1914 the
company that later became Nissan Motor Co., Ltd., completed its first car in Japan. Fiat
produced automobiles in Italy, and Daimler and Benz merged together in 1926 to begin
production of the Mercedes-Benz line of automobiles. In 1928 the German manufacturer
Bayerische Motoren Werke AG (BMW), also known as Bavarian Motor Works, began
building automobiles.
The Great Depression of 1930’s
4

Numerous automobile manufacturers, both big and small, existed during the early years of
the industry, but increased competition began to reduce the number of companies. The
economic depression in the United States following the 1929 stock market crash brought
even more consolidation and competition to the auto industry. Many carmakers, such as
Duesenberg with its stylish models, disappeared during the depression. Consolidation and
sheer size, as well as innovation, helped the Big Three automakers survive. Thinking that
farmers might gain by producing crops that could be turned into fuel or raw materials, Ford
built a soybean processing plant. Soon two pounds of every Ford were made from soy
products. General Motors survived and thrived with the standard volume concept, a financial
strategy that has endured. GM set its prices to produce a 20 percent return on investment
based on what it sold in an average year. Profits soared when sales were above average, and
GM would still profit during leaner years.
Status of Automobile Industry in World
Automobile industry that produces automobiles and other gasoline-powered vehicles, such as
buses, trucks, and motorcycles. The automobile industry is one of the most important
industries in the world, affecting not only the economy but also the cultures of the world. It
provides jobs for millions of people, generates billions of dollars in worldwide revenues, and
provides the basis for a multitude of related service and support industries. Automobiles
revolutionized transportation in the 20th century, changing forever the way people live,
travel, and do business.
The automobile has enabled people to travel and transport goods farther and faster, and
has opened wider market areas for business and commerce. The auto industry has also
reduced the overall cost of transportation by using methods such as mass production (making
several products at once, rather than one at a time), mass marketing (selling products
nationally rather than locally), and globalization of production (assembling products with
parts made worldwide). From 1886 to 1898, about 300 automobiles were built, but there was
no real established industry. A century later, with automakers and auto buyers expanding
globally, auto making became the world's largest manufacturing activity, with nearly 58
million new vehicles built each year worldwide.
5

As a result of easier and faster transportation, the United States and world economies have
become dependent on the mobility that automobiles, trucks, and buses provide. This mobility
allowed remote populations to interact with one another, which increased commerce. The
transportation of goods to consumers and consumers to goods has become an industry in
itself. The automobile has also brought related problems, such as air pollution, the emission
of greenhouse gases that contribute to global warming, congested traffic, and highway
fatalities. Nevertheless, the automobile industry continues to be an important source of
employment and transportation for millions of people worldwide.
Economic Importance
Automobile manufacturers are among the largest companies in the world. These corporations
are often multinational, meaning they have subsidiaries and manufacturing plants in many
different countries. These companies often share parts, use parts made in foreign factories, or
assemble entire cars in foreign countries. The three major automobile manufacturers in the
United States—General Motors Corporation, Ford Motor Company, and Chrysler, formerly
DaimlerChrysler AG—provide much of the industry's total direct employment in the United
States, but increasingly foreign automakers, such as Toyota Motor Corporation and Nissan
Motor Co., Ltd., are building automobile assembly plants in the United States.
Foreign automakers are taking advantage of tax incentives and laws that discourage union
organization in the Southern United States, in particular. Eleven foreign-owned auto plants
operated in the United States in 1993. By 2007 that number had grown to 28. Many of these
plants were located in such states as Alabama, Mississippi, South Carolina, Tennessee, and
Texas.
Automotive parts manufacturers are another large section of the U.S. auto industry,
comprising about 5,000 firms, including Japanese, European, and Canadian companies.
These firms supply the original equipment market (for manufacture) and the replacement
parts market (for maintenance and repair). By some estimates, for every job created in the
automobile assembly industry, three to four jobs are created in the automotive parts industry.
Numerous other industries support the automobile industry. These include the insurance,
security, petroleum, and roadway design and construction industries. Still other industries,
6

such as motels, drive-in theaters, and fast-food restaurants, owe their existence to the
mobility provided by the automobile.
Domestic Impact
The automobile industry directly influences the economies of the United States and other
countries around the world. In a typical year, the U.S. automobile industry generates between
12 and 14 percent of manufacturers’ shipments of durable goods (products designed to last at
least three years). Automobile production consumes large amounts of iron, steel, aluminum,
and natural rubber. The automobile industry also consumes more copper, glass, zinc, leather,
plastic, lead, and platinum than any other U.S. industry.
Rising imported car sales in the United States during the 1980s threatened the economic
strength of U.S. automakers. Domestic sales rebounded in the 1990s, but as the 21st century
began, foreign carmakers resumed making inroads in U.S. car sales. Ford saw its car and
truck market share in North America fall to about 17 percent in 2005, returning to its
percentage share in the 1980s, and General Motors saw its North American market share
drop to 26 percent in 2005. In July 2007 foreign automakers outsold U.S. car companies in
the United States for the first time ever, taking 51.9 percent of the market in cars and light
trucks, including sport utility vehicles (SUVs). In the first quarter of 2007 Toyota overtook
GM as the largest car seller worldwide.
Foreign Trade
Sales of U.S. motor vehicles to Americans are expected to remain near the same level in the
future, with about 1 to 2 percent growth per year, while foreign markets are expanding at
rates that are two, three, and even ten times faster. Because exports will be essential to
expanding the auto and auto parts industries, U.S. trade officials have negotiated trade
agreements such as the Memorandum of Understanding with Korea (1993), the North
American Free Trade Agreement (NAFTA, 1994), and the U.S.-Japan Automotive
Framework Agreement (1995). These and other agreements have increased automobile and
other exports to Japan, Mexico, and Korea many times over.
7

In 1994 the United States successfully promoted the Uruguay Round of the General
Agreement on Tariffs and Trade (GATT), which helped American auto export potential
because it improved access to both major and developing markets. These initiatives have
helped the U.S. automotive industry achieve the highest level of exports on record.
Introduction of Automotive industry
The automotive industry designs, develops, manufactures, markets, and sells the world's
motor vehicles. In 2008, more than 70 million motor vehicles, including cars and commercial
vehicles were produced worldwide.
In 2007, a total of 71.9 million new automobiles were sold worldwide: 22.9 million in
Europe, 21.4 million in Asia-Pacific, 19.4 million in USA and Canada, 4.4 million in Latin
America, 2.4 million in the Middle East and 1.4 million in Africa. The markets in North
America and Japan were stagnant, while those in South America and Asia grew strongly. Of
the major markets, Russia, Brazil, India and China saw the most rapid growth.
About 250 million vehicles are in use in the United States. Around the world, there were
about 806 million cars and light trucks on the road in 2007; they burn over 260 billion
gallons of gasoline and diesel fuel yearly. The numbers are increasing rapidly, especially in
China and India. In the opinion of some, urban transport systems based around the car have
proved unsustainable, consuming excessive energy, affecting the health of populations, and
delivering a declining level of service despite increasing investments. Many of these negative
impacts fall disproportionately on those social groups who are also least likely to own and
drive cars. The sustainable transport movement focuses on solutions to these problems.
In 2008, with rapidly rising oil prices, industries such as the automotive industry are
experiencing a combination of pricing pressures from raw material costs and changes in
consumer buying habits. The industry is also facing increasing external competition from the
public transport sector, as consumers re-evaluate their private vehicle usage. Roughly half of
the US's fifty one light vehicle plants are projected to permanently close in the coming years
8

with the loss of another 200,000 jobs in the sector, on top of the 560,000 jobs lost this
decade.
Auto Component Manufacturers
The next big thing to happen in India after software, textiles, pharmaceuticals and BPO
would undoubtedly be the auto component manufacturing industry.
The global automotive component manufacturing industry is estimated to have a market size
of around $1trillion. Ford Motors, Delphi Corporation, Caterpillar, Cummins, International
Truck and Engine Corporation and last but not the least General Motors (GM) are some of
the leading global automobile components manufacturers of the world. With importations of
components worth $69 billion a year, the US stands at the top of all the auto component
markets the world.
Auto Component Manufacturing Hubs
The main automobile components manufacturing hubs in India are situated in Chennai, Pune
and Gurgaon. The magnitude of the Indian auto component manufacturing industry stands at
Rs 25,000 crore ($5 mn approx.). Though relatively small, the Indian automotive component
manufacturing industry due to a huge talent pool of skilled automotive engineers and access
to the latest technologies has a great potential to emerge as a big player in the near future.
Used Car Component Manufacturers: Those customers eager to buy used cars can revamp
their car with used car components. Used car components include Engine Parts, Steering
Parts, Suspension and Brake Parts and Electrical Parts. There are a number ways to sell a
used car i.e. through car owners, car dealerships, car agents, car rental companies at nominal
rates.
ACMA
According to the Automotive Component Manufacturers' Association of India (ACMA), the
domestic Indian auto component manufacturing industry is heading for a whopping 18%
growth in the coming years compared to the export market which is estimated to reach $2.7
bn by the year 2010.
9

Lacking the required infrastructure, the Indian auto component manufacturing industry
falls way behind the major global players in terms of production capacities. Due to this fact,
it also lags behind other nations in getting large manufacturing orders. Or even if it manages
to get one, it ranges below the $100 mn mark, which is considered a mere figure as per the
automotive industry standards. Though striving to better its standards, the Indian auto
component manufacturing industry has registered a robust growth in the recent past. The
three main factors providing impetus to this industry are the ever increasing domestic
automobile industry (two-wheelers, commercial vehicles and passenger cars), the aftermarket
sales and servicing industry and the outsourcing of component manufacturing to India and
China by the global titans to cut down on their cost of productivity and thereby laughing all
the way to the banks. To improve upon the auto component industry in India, the need of the
hour is to focus on its competitiveness, learn the best manufacturing practices, be quality
conscious and at the same time inculcate a prompt delivery culture.
The automotive component industry is an important sector of the Indian economy and a
major foreign exchange earner for the country. There are around 400 major players in the
auto component sector. Most of them are distributed in the north, south, and, western parts of
India around major Automotive Vehicle Manufacturers (AVMs). These AVMs contributed
largely towards the development of component suppliers through technical and or financial
collaborations.
The automotive component industry manufactures a wide range of parts including castings,
forgings, finished, semi-finished components, assemblies, and subassemblies for all types of
vehicles produced in India.
Presently, the Indian automotive component industry is highly fragmented. This industry can
be divided into the organized and the unorganized categories of manufacturers. The
organized component manufacturers supply components to at least one of the Original
Equipment (OE) vehicle manufacturers. They also have access to technology due to their tie-
ups with some of the foreign collaborators or through associate AVM. The unorganized
sector predominantly caters to the
10

The OE market is predominantly catered to by the organized sector. The 400 odd
organized producers contribute around 80 percent to this market. Presently, these
manufacturers have grown in size and numbers beyond the control of OE manufacturers.
They control about 65 percent of the aftermarket
There are 402 medium and large key players in auto components in the organized sector
along with 6000 ancillary units. However in the unorganized sector there are approximately
5000 SSIs. The direct employment generated by the medium and large firms in the organized
sector is 2, 50,000. No figures are available for unorganized sector.
The geographical spread of medium and large companies as per records of Automotive
Component Manufacturers Association of India (ACMA) is as under
North region 161
Western region 123
Southern region 91
Eastern region 27
Tamilnadu current annual output in the automotive sector is estimated to be $3-3.5
billion with an estimated share of 25 per cent in the Indian automotive Industry and its
contribution to the State's Gross State Domestic Product is 7-8 per cent. Tamilnadu’s auto
components sector constitutes 35 per cent of India’s auto component production that is
produced in units situated in Chennai. The Tamilnadu State government plans to transform
the state into one of the top three manufacturing hubs for automotive and auto ancillary in
Asia by 2015.
There are 107 key players in Tamilnadu’s Auto Component Industry with an investment of
about Rs.36000 million ($ 800 million). The output is US $ 1,2 billion out of which the
exports are US $ 140 million. The auto component industry in Tamilnadu provides
employment to about 45,000 people. More than 50% of the companies are ISO certified
while 26% are QS certified. The Key OEM customers of auto component industry in
11

Tamilnadu are GM, Ford, Daimler Chrysler, BMW, Volvo, Nissan, Piaggio and New
Holland. Kerala, however, is not having a very well developed auto components industry.
So all those people who are crazy about speed, automobile are indeed a prized
possession for them. With the increased number of car and two wheeler loans and finance
schemes available in today's market, it is not that difficult to purchase the same. However, if
you have already decided to purchase a vehicle, then before the act of purchase, do get to
know something about the key players who dominate this market.
This section covers the key facts about major players operating in the Asian automotive
industry, such as General Motors, Toyota, Ford, Nissan Motor Company Ltd., Honda and
Hyundai.
12

CHAPTER TWO
INTRODUCTION TO THE COMPANY
HIGHLIGHTS:Inception of the companyNature of businessProduct profileMission of the companyVision of the company
13

Improvement Initiatives
14

Chapter 2
Inception of Ashok Kumar Minda Group
Founded in 1958 by Shri S. L. Minda in Delhi, the Minda Group today is one of the leading
manufacturer of automobile components with a turnover of Rs. 1375 Crores ($ 275 million)
for 2008-09 and employs more than 7000 people India-wide & Overseas.
The group is a major supplier to OEM's both in India and overseas. The group companies are
accredited with quality and environment certification and have collaborations and strategic
alliances with international manufacturers. Ashok Minda Group manufactures different lines
of automobile parts that broadly fall under the following categories:
Automobile Security Systems
Connective Systems
Instrument Panels
Die Casting
Polymer
Business Philosophy
Customer support
Focus on Technology to create World Class Products
Value for Money
Continuous Improvement
Organization & Management
To ensure product specialization and optimization of capacity, businesses are
managed professional & independently by various companies in the Ashok Minda
Group by Group Chairman: Mr. Ashok Minda
15

Company Profile:
For over five decades, MINDA has been a major presence in India's automobile industry.
These fifty years have been interspersed by a number of technological innovations that have
gone on to become industry standards.
For the technological edge, we have a dedicated R&D facility and collaborations with the
pioneers and leaders of the Automobile Industry.
For assimilating the latest technologies, Minda has entered into strategic alliances and
technical collaborations with leading international companies. This has provided Minda with
the cutting edge in product design and technology to meet strict international quality
standards.
The Groups' companies are accredited with QS 9000 and ISO-14001 certification from
TUV, GERMANY. MINDA are one of India's leading manufacturers of Security systems,
wiring harnesses, Couplers & Terminals and Instrument Clusters, Die Casting, Polymers
catering to all major two & four wheeler vehicles manufacturer in India. The products are
well accepted worldwide both with O.E.M's and the after market.
GROUP COMPANIES
Minda Management Services Ltd.
Minda Valeo Security Systems Pvt. Ltd.
Minda Corporation Ltd.
Minda SAI Ltd.
Minda Stoneridge Instruments Ltd.
Minda Furukawa Electric Pvt. Ltd.
Minda Silca Engineering Ltd.
KTSN
Minda Autocare Ltd.
PT Minda ASEAN
16

Minda Schenk Plastic Solutions
The red coloured points represent the location of Ashok Minda Group in India.
17

Red dotted area represents the location of Ashok Minda Group through world wide.
NOIDA PLANT ( MINDA CORPORATION LIMITED)
18

Minda Corporation Ltd being one of India’s leading automobile industry is now
spreading its wings in USA, Japan, Korea and many more countries and its new
manufacturing unit is developing connective systems.
Minda products are exported to all major foreign markets. A global standard in quality
and environment, constant innovation and collaboration with major global suppliers has
given Minda the technology and expertise to access manufactures abroad. The most
important foreign markets are Europe and ASEAN.
About the history Minda Corporation Ltd was known Minda Huff Ltd in 1997 as Minda
was Indian company any Huff was a Germany company there were in collaboration for
almost years and then they separated to from Minda Corporation Limited.
Export to major market
Collaboration with Global Suppliers
Maintain Global Standards
19

Hierarchy of Minda Group
Level 1 Unskilled Employees
Level 2 Semi Skilled Employees Assembly
Level 3 Skilled Employees
Level 4 Staff Supervisors
Level 5 Officer / Engineer
Level 6 Deputy Manager
Level 7 Manager
Level 8 DGM, Deputy General Manager
Level 9 General Manager
20
Level 10 Vice President
Level 11 President / Managing Director
Major Customers Domestic
Customers Models Share of Business
Bajaj Auto Ltd.
Honda Motorcycle & Scooter India
JCB India
Kinetic Engineering Ltd.
Kinetic Motor Co. Ltd.
LML Ltd.
Suzuki Motorcycle India
TVS Motor Company Ltd.
Yamaha Motor India (P) Ltd.
Motorcycles
Scooters
3DX
Scooters & Mopeds Motorcycles
Scooters
Motorcycles Scooters
Motorcycle
Scooters & MopedsMotorcycles
Motorcycles
100%
50%
100%
100% 100%
100%
70%100%
100%
40%.
100%
21

Major Customers - Exports
Customers Country Vehicle Category
Aprilia
Derby
Kawasaki
Peugeot
Piaggio
Pollak
Suzuki
Suzuki
Suzuki
Triumph Motorcycles Ltd.
Yamaha-MBK
Yamaha
Yamaha
Italy
Spain
Japan
France
Italy
U.S.
Spain
Thailand, Indonesia
Philippines
United Kingdom
France
Spain
Indonesia, Malaysia
Scooter
Scooter
Motorcycle
Scooter
2 & 4 Wheeler
Off Road Vehicle
Scooter
Scooter / Motorcycle
Scooter / Motorcycle
Motorcycle
Motorcycle
Motorcycle
Scooter / Motorcycle
PRODUCT PROFILE
Security Systems
Noida & Pune based Minda Corporation Ltd and Minda Valeo Security Systems Pvt. Ltd. manages the manufacturing and products include mechanical and electronic security systems like door handles, fuel tank locks and remote operated immobilizers and alarms amongst others.
Driver Information System
22

Manufactured at Pune by Minda Stoneridge Instruments Ltd, the products include:
Instrument Clusters, Speedometers, Odometers, Fuel gauge, Temperature gauge,
Sensors, Tank Units and Indicators
Connective Systems
With the merger of Minda Wire links (P) Ltd. and Minda SAI Ltd we now produce all
types of Wiring Harnesses, Wiring Sets and Components
Die Casting
Pressured Die Casted Components: Zinc & Aluminum
Mechanical Product Range
23

Electronics Product Range
Mechanical Product Range Key Systems
Locksets / Key Sets
Fuel Tank Cap
Window Regulator
Steering Column Locks
Polymer
Electronics Product Range Remote Control Systems ( Radio Frequency/Infra Red)
Immobilizer
MISSION OF THE COMPANYTo design and manufacture vehicle security and access system to world class
standards with state of the art technology and to market them to the right place
and at the right quality to the customer’s satisfaction.
To maximum value to the shareholders and provide value enhancement to the
customers, employees and the company served.
VISION OF THE COMPANY
To be the world class company, known for very high customer base.
To be internationally renowned organization, much sought after by both
customers and suppliers.
To be a company, known for nurturing and developing human resources for
organizational excellence
24

New Improvement Initiatives in Ashok Minda Group
MINDA CLUSTER The Improvement Journey started in Ashok Minda Group from January 2001. The
journey began with Minda Huf Ltd, Noida joining ACT-CII Cluster in Jan 2001.
These cluster activities continued till December 2003. The learning in the cluster
covered most of the practices of Lean Manufacturing or Toyota Production Systems
(TPS). This learning laid foundation for launching a group level improvement
initiative programmes.
Taking the inputs from the learning of ACT-CII project, the Minda Cluster was stared in
June 2003 to propagate the Lean Manufacturing Practices across the companies in the group.
The first cycle of Minda Cluster followed a common Roadmap for a period of 2 years. The
Cluster focused more on the review of results achieved by each company and less on the
process adopted in achieving the results
At the end of 1st cycle of Minda Cluster, the MRM organization as well as contents was
reviewed and following changes were made.
Two Clusters have been created based on geographical location of companies / units – one in
North and another in West / South.
The MRM will be held once in 45 days and every 3rd MRM will be a CRM.
The review would focus on process and changes made in the process leading to
results.
Accordingly the MRM contents were revised and categorized into 4 Sections : DWM
Control, Value / Flow Improvement , People Related & Product / Process
Technology.
25

So far, 10 Regional MRMs and 4 CRMs have been held. The Road Map of Minda Cluster 2
is given below:
Quality Circles Convention
The quality circle movement was initiated in the group companies in April 2004. . After
about a year of practice the first quality circles convention was organized in March 2005 with
a view to foster this activity through internal competition. It was also decided to have the
convention as a regular activity and include in the annual calendar of TQM Cell. The last
convention – 3rd Quality Circles Convention was held on 18th & 19th March 2007 at Minda
Stoneridge Instruments Ltd, Pune.
The winners of the 3rd convention are given below:
Winner : JOSH Quality Circle from MSL-Noida
First Runner up : LAKSHAY Quality Circle from MHL-Noida
Second Runner up : ANKUSH Quality Circle from MSIL- Pune
26

Minda Technical Conference – MTC
During this TQM journey a need was felt for a platform where the Technical Teams of AKM
Group for knowing each other and sharing their experiences and concerns. Hence, it was
decided to organize a group technical conference which has been named as Minda Technical
Conference – MTC. The first conference of MTC was held in December 2005 at MHL,
Noida. The conference covered individual presentations from group companies and
presentations on selected topics of business interest by four empowered teams. In the
subsequent review of MTC, it was decided to conduct focused conferences on selected
technical areas as prioritized by group companies. The technical areas selected are Tooling,
Manufacturing Engineering (ME), Maintenance and Supply Chain.
Training
the training needs related to TQM of group companies are mostly provided by internal
faculties or by our external counselors like Dr Sumit Roy and Mr. Ram Mohan. Unit /
Company specific trainings are provided during counseling of units and needs common to
group companies are provided centrally in a selected location.
Problem Solvers: In order to promote problem solving skills in group companies, a
training program “Development of Problem Solvers “was organized at MHL, Noida. The
training was conducted by Dr Sumit Roy. On a long term basis they would be developing
problem solvers at the following 3 levels:
Level 1 – Conceptual understanding of problem solving techniques and isolated applications.
Level 2 – Regularly apply the techniques in own areas and achieve sustainable results.
Level 3 – Regularly apply the techniques in all relevant areas of the organization and
achieve good, sustainable results.
At the end of the training, the trainees have selected problems of priority based on business
needs under the guidance of their HOD and Unit Heads. They would solve the problems thus
selected by them and submit the same as project reports. Monthly review of these projects by
27

Dr Sumit Roy is conducted to support the problem solvers and monitor the progress of the
projects.
Based on successful completion of project and passing of written examination (minimum of
60% marks), the trainees are certified as Problem Solvers. In the first batch, 11 candidates
got certified as Problem Solvers, Level -1
The training for second batch of problem solvers was conducted. The batch consisted of 20
participants from group companies.
Value Engineering
The training on Value Engineering (VE) was conducted on 8th & 9th May 07 at MCL,Noida.
In all, 26 engineers from group companies participated in the 2 day workshop conducted by
Dr Sumit Roy. The team from each company has selected a project on the basis of their
Unit’s priority. The teams are expected to complete their project work within 90 days and
submit to Corp. TQM. The completed projects will be posted on TQM Website for reference.
DISHA
Minda have been driving operational excellence through Minda Cluster and TQM activity. A
review of the results achieved by these processes revealed that we need to focus on
improvement of backend managerial processes as well. Thus, a new initiative named DISHA
started in June 2005. Key activities under DISHA are:
Role clarity at Corporate, Business and Unit level
Institutionalize Process
Developing a mechanism for - Driving Priority
Changing style of Management- Leadership Role, Value System, Delegation &
Empowerment
Long term & Short term Strategic & Business Planning
Review, Assessment & Monitoring Initiatives at
o Group Corporate Level
28

o Business Unit Level
o Unit Level
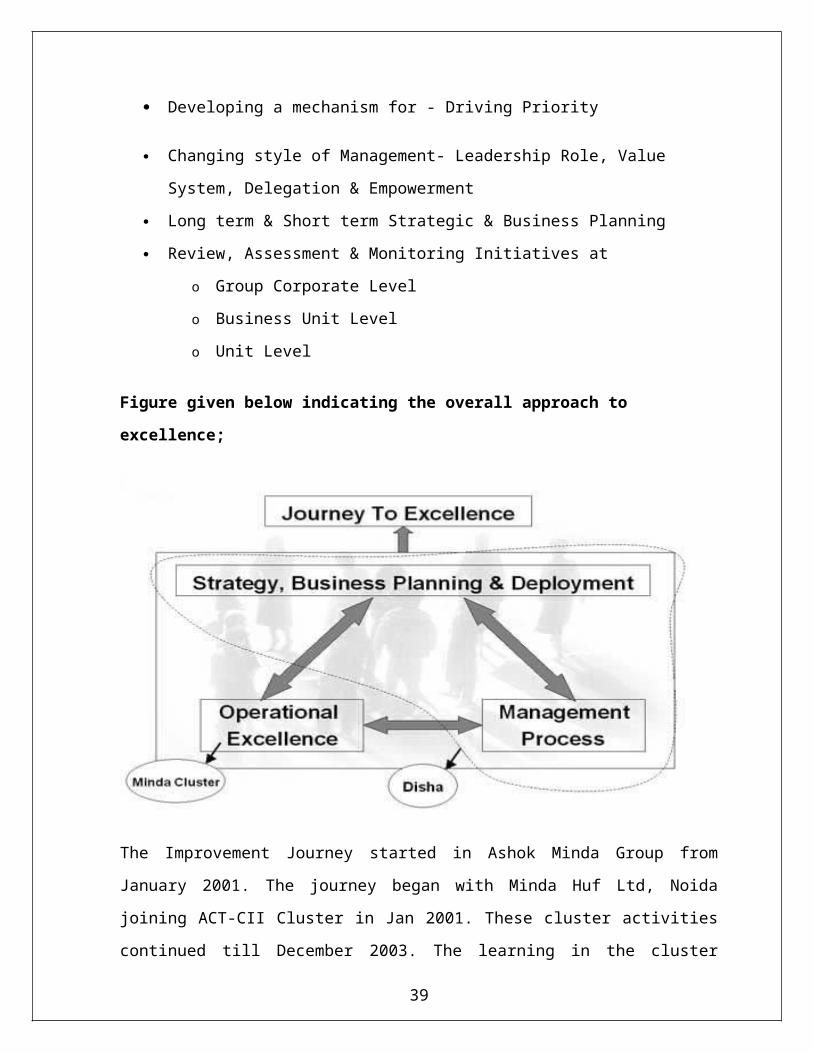
Figure given below indicating the overall approach to excellence;
The Improvement Journey started in Ashok Minda Group from January 2001. The journey
began with Minda Huf Ltd, Noida joining ACT-CII Cluster in Jan 2001. These cluster
activities continued till December 2003. The learning in the cluster covered most of the
practices of Lean Manufacturing or Toyota Production Systems (TPS).
This learning laid foundation for launching a group level improvement initiative
programmes.
Taking the inputs from the learning of ACT-CII project, the Minda Cluster was stared in June
2003 to propagate the Lean Manufacturing Practices across the companies in the group. The
first cycle of Minda Cluster followed a common Roadmap for a period of 2 years. The
Cluster focused more on the review of results achieved by each company and less on the
process adopted in achieving the results.
29

Award and Recognition
HUMAN RESOURCE MAPPING AT MINDA
The Structure
Keeping in pace with the recent changes, Minda Group has re-designed their Organizational
structure and has successfully introduced Lean Management system by adopting the
FUNCTIONAL STRUCTURE. While doing so, we have identified the Major FUNCTIONS
and related SUB-FUNCTIONS and assigned three tier Functional designations accordingly
to each Staff member viz, Head of Department, Group Leader and Members.
Manpower Planning
Based on the future business growth needs, we do the Manpower Planning and Profit center
budgeting every year. We follow a well laid down sequential and scientific method for
inducting prospective candidates. A set of Ideal Expectations expected from the Person
performing the specific function has been clearly documented in the form of Responsibility
and Authorities Manual.
People
Minda consider people as one of the most important resource and the same is reflected in
our Internalized Vision Statement “To be a company known for Nurturing and Developing
Human Resources for Organizational Excellence ".
30

We are a strong and professional team of more than 700 members dedicated towards
manufacturing world class products and high customer satisfaction rating.
Employee Communication
Open House gathering as a Feedback mechanism.
First Day Celebration
Birthday Display Board
Display Boards
Internal Newsletter
Given below flow- chart show the process of man power planning;
Continuous Improvement Tools
31

Minda have successfully adopted following continuous improvement tools:
Kaizen Movement
Work Place Management Through 5S
TPM
POKA YOKE
SMED
Kaizen is...
... a system of continuous improvement in quality, technology, processes, company
culture, productivity, safety and leadership.
We'll look at Kaizen by answering three questions: What is Kaizen? What are the benefits of
Kaizen? What do you need to do to get started using Kaizen principles?
What is Kaizen?
Kaizen was created in Japan following World War II. The word Kaizen means "continuous
improvement". It comes from the Japanese words 改 ("kai") which means "change" or "to
correct" and 善 ("zen") which means "good"
Kaizen is a system that involves every employee - from upper management to the cleaning
crew. Everyone is encouraged to come up with small improvement suggestions on a regular
basis. This is not a once a month or once a year activity. It is continuous. Japanese
companies, such as Toyota and Canon, a total of 60 to 70 suggestions per employee per year
are written down, shared and implemented.
In most cases these are not ideas for major changes. Kaizen is based on making little changes
on a regular basis: always improving productivity, safety and effectiveness while reducing
waste.
Suggestions are not limited to a specific area such as production or marketing. Kaizen is
based on making changes anywhere that improvements can be made. Western philosophy
may be summarized as, "if it ain't broke, don't fix it." The Kaizen philosophy is to "do it
32

better, make it better, and improve it even if it isn't broken, because if we don't, we can't
compete with those who do."
Kaizen in Japan is a system of improvement that includes both home and business life.
Kaizen even includes social activities. It is a concept that is applied in every aspect of a
person's life.
In business Kaizen encompasses many of the components of Japanese businesses that have
been seen as a part of their success. Quality circles, automation, suggestion systems, just-in-
time delivery, Kanban and 5S are all included within the Kaizen system of running a
business.
Kaizen involves setting standards and then continually improving those standards. To support
the higher standards Kaizen also involves providing the training, materials and supervision
that is needed for employees to achieve the higher standards and maintain their ability to
meet those standards on an on-going basis.
More information about Kaizen:
Benefits of Kaizen - What Kaizen can do for you. Read about how Kaizen helped Fleetwood
and Sony.
Getting Started With Kaizen - A brief overview describing how to start to use Kaizen in your
company.
5S - A 5S Program is often associated with Kaizen.
Lean Manufacturing - A case study at Mathers Controls.
What is Five S?
5S is a basic, fundamental, systematic approach for productivity, quality and safety
improvement in all type of business.
33

A Five S program is usually a part of, and the key component of establishing a Visual
Workplace. And is both a part of Kaizen -- a system of continual improvement -- which is a
component of lean manufacturing.
The Five S program focuses on having visual order, organization, cleanliness and
standardization. The results you can expect from a Five S program are: improved
profitability, efficiency, service and safety. The principles underlying a Five S program at
first appear to be simple, obvious common sense. And they are. But until the advent of Five S
programs many businesses ignored these basic principles.
What types of businesses benefit from a Five S program?
Everyone and all types of business benefit from having a Five S program. Manufacturing and
industrial plants come to mind first, as those are the business that can realize the greatest
benefits. However, any type of business, from a retail store to a power plant -- from hospitals
to television stations -- all types of businesses, and all areas within a business, will realize
benefits from implementing a Five S program.
What are the Five S's?
Use the following links to learn more about 5S
Sort - the first step in making things cleaned up and organized
Set In Order - organize, identify and arrange everything in a work area
Shine - regular cleaning and maintenance
Standardize - make it easy to maintain - simplify and standardize
Sustain -maintaining what has been accomplished
34

TOTAL PRODUCTIVE MAINTENANCE (TPM)
Total Productive Maintenance (TPM) is a maintenance program which involves a newly
defined concept for maintaining plants and equipment. The goal of the TPM program is to
markedly increase production while, at the same time, increasing employee morale and job
satisfaction. The TPM program closely resembles the popular Total Quality Management
(TQM) program. Many of the same tools such as employee empowerment, benchmarking,
documentation, etc. are used to implement and optimize TPM. This paper will define TPM in
some detail, evaluate its strengths and weaknesses as a maintenance philosophy, and discuss
implementation procedures. Examples of successfully implemented programs will be
presented.
Total Productive Maintenance (TPM) is a maintenance program concept. Philosophically,
TPM resembles Total Quality Management (TQM) in several aspects, such as (1)total
commitment to the program by upper level management is required, (2) employees must be
empowered to initiate corrective action, and (3) a long range outlook must be accepted as
TPM may take a year or more to implement and is an on-going process. Changes in
employee mind-set toward their job responsibilities must take place as well.
TPM brings maintenance into focus as a necessary and vitally important part of the
business. It is no longer regarded as a non-profit activity. Down time for maintenance is
scheduled as a part of the manufacturing day and, in some cases, as an integral part of the
manufacturing process. It is no longer simply squeezed in whenever there is a break in
material flow. The goal is to hold emergency and unscheduled maintenance to a minimum.
Implementation of TPM
To begin applying TPM concepts to plant maintenance activities, the entire work force must
first be convinced that upper level management is committed to the program. The first step in
this effort is to either hire or appoint a TPM coordinator. It is the responsibility of the
coordinator to sell the TPM concepts to the work force through an educational program. To
do a thorough job of educating and convincing the work force that TPM is just not another
"program of the month," will take time, perhaps a year or more.
35

Once the coordinator is convinced that the work force is sold on the TPM program and
that they understand it and its implications, the first study and action teams are formed. These
teams are usually made up of people who directly have an impact on the problem being
addressed. Operators, maintenance personnel, shift supervisors, schedulers, and upper
management might all be included on a team. Each person becomes a "stakeholder" in the
process and is encouraged to do his or her best to contribute to the success of the team effort.
Usually, the TPM coordinator heads the teams until others become familiar with the process
and natural team leaders emerge.
The action teams are charged with the responsibility of pinpointing problem areas,
detailing a course of corrective action, and initiating the corrective process. Recognizing
problems and initiating solutions may not come easily for some team members. They will not
have had experiences in other plants where they had opportunities to see how things could be
done differently. In well run TPM programs, team members often visit cooperating plants to
observe and compare TPM methods, techniques, and to observe work in progress. This
comparative process is part of an overall measurement technique called "benchmarking" and
is one of the greatest assets of the TPM program.
The teams are encouraged to start on small problems and keep meticulous records of their
progress. Successful completion of the team's initial work is always recognized by
management. Publicity of the program and its results are one of the secrets of making the
program a success. Once the teams are familiar with the TPM process and have experienced
success with a small problem, problems of ever increasing importance and complexity are
addressed.
As an example, in one manufacturing plant, one punch press was selected as a problem
area. The machine was studied and evaluated in extreme detail by the team. Production over
an extended period of time was used to establish a record of productive time versus
nonproductive time. Some team members visited a plant several states away which had a
similar press but which was operating much more efficiently. This visit gave them ideas on
how their situation could be improved. A course of action to bring the machine into a "world
class" manufacturing condition was soon designed and work was initiated. The work
involved taking the machine out of service for cleaning, painting, adjustment, and
36

replacement of worn parts, belts, hoses, etc. As a part of this process, training in operation
and maintenance of the machine was reviewed. A daily check list of maintenance duties to be
performed by the operator was developed. A factory representative was called in to assist in
some phases of the process.
After success has been demonstrated on one machine and records began to show how
much the process had improved production, another machine was selected, then another,
until the entire production area had been brought into a "world class" condition and is
producing at a significantly higher rate.
Note that in the example above, the operator was required to take an active part in the
maintenance of the machine. This is one of the basic innovations of TPM. The attitude of "I
just operate it!" is no longer acceptable. Routine daily maintenance checks, minor
adjustments, lubrication, and minor part change out become the responsibility of the
operator. Extensive overhauls and major breakdowns are handled by plant maintenance
personnel with the operator assisting. Even if outside maintenance or factory experts have to
be called in, the equipment operator must play a significant part in the repair process.
Training for TPM coordinators is available from several sources. Most of the major
professional organizations associated with manufacturing as well as private consulting and
educational groups have information available on TPM implementation. The Society of
Manufacturing Engineers (SME) and Productivity Press are two examples. Both offer tapes,
books, and other educational material that tell the story of TPM. Productivity Press conducts
frequent seminars in most major cities around the United States. They also sponsor plant
tours for benchmarking and training purposes.
POKA-YOKE
Learn how Poka-Yoke is used to prevent defects from occurring in a manufacturing process.
Shigeo Shingo introduced the concept of poka-yoke (pronounced POH-kah YOH-kay) in
1961, when he was an industrial engineer at Toyota Motor Corp. The initial term was baka-
yoke, which means fool proofing. In 1963, a worker at Arakawa Body Co. refused to use
baka-yoke mechanisms in her work area, because of the term’s dishonorable and offensive
37

connotation. Hence, the term was changed to poka-yoke, which means error proofing or
mistake proofing.
Mistake Proofing: Apply to the process to prevent mistakes from occurring, stop the error
from further processing, and warn that the error has occurred.
Error Proofing: Apply to design to prevent assembly errors.
However, most people use the terms interchangeably.
Poka-Yoke is a process improvement designed to prevent a specific defect from
occurring. It is a process improvement system that prevents personal injury, promotes job
safety and prevents faulty products and machine damage. Poka-yokes are mechanisms used
to mistake proof an entire process. Ideally, poka-yokes ensure that proper conditions exist
before actually executing a process step, preventing defects from occurring in the first place.
Where this is not possible, poka-yokes perform a detective function, eliminating defects in
the process as early as possible.
Many people think of poka-yokes as limit switches, optical inspection systems, guide pins or
automatic shutoffs that should be implemented by the engineering department. This is a very
narrow view. These mechanisms can be electrical, mechanical, procedural, visual, human or
any other form that prevents incorrect execution of a process step. Poka-yokes also can be
implemented in areas other than production such as sales, order entry, purchasing or product
development where the cost of mistakes is much higher than on the shop floor. The reality is
that defect prevention, or defect detection and removal, has widespread applications in most
organizations.
Mistake: The execution of a prohibited action, the failure to correctly perform a required
action or the misinterpretation of information essential to the correct execution of an action.
Poka-Yoke (Mistake/Error Proofing): The use of process or design features to prevent the
manufacture of nonconforming product.
38
Error Proofing Triangle
Operational Error proofing: involves making modifications or installing devices that
reinforce the correct procedure sequence.
Philosophical Error proofing: involves identifying situations that cause defects and doing
something about it—empowerment of workforce.
Physical Error proofing: involves installing components such as fixtures or sensors to
eliminate conditions that may lead to an error.
SMED
Single Minute Exchange of Die (SMED) is one of the many lean production methods for
reducing waste in a manufacturing process. It provides a rapid and efficient way of
converting a manufacturing process from running the current product to running the next
product. This rapid changeover is key to reducing production lot sizes and thereby improving
flow( Mura ( Japanese term)) The phrase “single minute” does not mean that all changeovers
and startups should take only one minute, but that they should take less than 10 minutes ( in
other words, “single digit minute”). Closely associated is a yet more difficult concept, One-
Touch Exchange of Die, (OTED), which says changeover can and should take less than 100
seconds.
39
CHAPTER THREE
INTRODUCTION TO THE PROBLEM
HIGHLIGHTS:
Meaning of recruitment and selection
40

Methods of recruitment and selection
Statement of the problem
Objective of the study
Scope of the study
CHAPTER THREE
Meaning of Recruitment
Recruitment is the process of locating and encouraging potential applicants to apply for
existing job openings. It is actually a linking function joining together those which jobs to fill
and those seeking job. The vacancy is initiated to the HR department by the concerned
technical department. Ensure that judgment of abilities, experience and qualifications is made
against the requirements of the position in question. Vacancy is known in two situations
(generally):
An employee leaves and there is vacancy created
Business Growth
Defining the Recruitment- Decide what vacancy you have. If you need to fill a new role
quickly you might find it helpful to adapt one of the models provides here:
41

Task analysis- Draw up a detailed list of tasks that the person will have to do.
This helps in determining the qualities and qualifications genuinely required for
the job.
Job Description- Produce an outline of the broad responsibilities (rather than
detailed tasks) involved in the job.
Person Specification- Decide what skills, experience, qualifications and attributes
someone will need to do the job as defined in the task analysis and job
description.
Methods of recruitment:
1. Internal method of recruitment: Promotion and Transfer, Job Posting, Employee Referral. 2. External method of recruitment: Campus recruitment, Advertisement, Consultancy, Employment exchange, Walk- Ins.
Alternatives of recruitment process Overtime
Hiring temporary employees
Outsourcing
Meaning of Selection
Selection is the process of placing the Right person in right place at right time. Choose the
person who best fits your person specification. This is the next step after recruitment. There
are various selection test which can be used in selection process-Intelligence Test, Aptitude
Test, Achievement Test, Interest Test, Personality Test, Situational Test, Polygraph Test,
Graphology Test.
Screening of application:
Short listing: Review applications on the basis of the person specification.
42

Ensure that you select for interview those who match the specifications,
regardless of age sex, race etc and that the specifications are not themselves
discriminatory.
Interviews: Interview your short listed candidates remembering that your job is
not only to assess the best candidate for the job, but also to create a great
impression of your organization.
1. Candidate assessments- The interview will provide you with some information but
check it out before offering a job.
Ask the candidate to show you the examples of previous work, do a
presentation, case study, some tests or full assessment. Test can be done
before the interview. It depends on the number of candidates being
interviewed and the type of the job.
You must have the specific permission of the applicant to do so, particularly if
you wish to contact employer. If you need them quickly, try phoning.
2. Making a job offer- If you think you have found the right candidate, it’s time to make
the job offer.
3. Induction- Help your new recruit to settle in quickly and become productive as soon
as possible.
The Recruitment Process:
The recruitment process begins when you need someone new in the Department, either
because an existing staff member has left, or because there is new work to be done. It
doesn’t finish until after the appointment has been made. The main stages of the
recruitment and selection process are identified in the below Flow Chart:
43
Identify VacancyIdentify Vacancy
Prepare job description and person specificationPrepare job description and person specification
Advertise/intimate to consultant to float biodatasAdvertise/intimate to consultant to float biodatas
Managing the response for consultantManaging the response for consultant

Pre-Interview
Preparation of recruitment/ selection document for the position
Advertisement
Preparing advertisement
Media selection
Positioning
Response Handling
Initial interview online or telephone
Short Listing for interviews
Interview arrangement
Sending emails or calling short listed candidates
Interview details to the short listed candidates
During Interview
HR Interview
44
Arrange interviewsArrange interviews
Conduct the interviewConduct the interview
Short ListingShort Listing
Reference CheckReference Check
Convey the DecisionConvey the Decision
Appointment Action/ Issue of letter intent indentininindentindentofintentAppointment Action/ Issue of letter intent indentininindentindentofintent

Technical interview
Conducting tests [aptitude / analytical etc.]
Reference check (if required)
Medical examination
Post Interview
Email or telephone call to successful candidates
HRM prepares a letter of appointment
Placement
Induction
Recruitment Cycle Time:
To bring in more effectiveness in the recruitment process, HR would follow a specific project
deadline of 38 days (from the day it had received the approved manpower requisition) to hire
a new employee.
The process specific schedule break-up is mentioned below:
Activities Time Frame
I
II
Role identification, Job description, CV sourcing & Initial
HR Short listing
Organizing the written Tests
Organizing the First Technical interviews
Organizing the Final Interview
Sessions to Take the Final Decisions
7 days
5 days
5 days4 days
3 days
III Preparing the Salary Proposal, Negotiate with the selected
candidates & offer closure6 days
45

In Minda Corporation Limited, Interviews are conducted by: Unit head
Department head
HR Head
Managing Director (for Senior positions)
46

STATEMENT OF THE PROBLEM
During my study I wished to know that whether there is an equal opportunity of placement
for experienced and non experienced candidates or not.
Preliminary findings: One thing that I observed about the company is that there is no
time management. I had also spent two days for getting training letter from the company.
Purpose of the study: The main purpose behind the study is to bridge the gap between
theoretical knowledge and practical aspect. Basically it is part and parcel of educational
curriculum.
OBJECTIVE OF THE STUDY
Every task is undertaken with an objective. Without any objective a task is rendered
meaningless. The main objectives for undertaking this project are:
To understand the internal Recruitment process of Minda Corporation Limited.
To know how the organization recruits people and make selection between different
employees with requisite skills, knowledge and experience in order to achieve goals
and perform the activities of the organization.
To know how recruitment logically aims at attracting a large number of qualified
applicants who are ready to take up the job if it is offered and also offering enough
information for unqualified persons to get selected.
To know how to pick individuals and make selection between them who have
relevant qualification to fill the jobs of organization.
To know how to choose the individuals who can most successfully perform the job,
from the pool of qualified candidates.
To identify areas where there can be scope for improvement and give suitable
recommendation to streamline the hiring process.
47

SCOPE OF THE STUDY
Different companies use different types of procedures for hiring employee so this study
conveys the information to the interested person about the recruitment and selection
procedure of Minda Corporation Limited.
This report could also create group of hypothesis that tends to further research on the
same or allied propositions.
The study can be applied to any other automotive industry.
The study can also be applicable in any other industry with some changes in
questionnaire and methodology.
48

CHAPTER FOUR
RESEARCH METHODOLOGY
HIGHLIGHTS:
Research design
Problem study plan
Data collection
Analytical model
49

CHAPTER FOUR
RESEARCH DESIGN
A research design is the arrangement of conditions for collection and analysis of data in a
manner that aims to combine relevance to the research purpose with economy in procedure.
In fact, the research design is the conceptual structure within which research is conducted; it
constitutes the blueprint for the collection, measurement and analysis of data.
Research is the systematic objective process of gathering, recording, and analyzing data
to aid in making business decisions. The research process steps are given below:
1. Systematical consisting of enunciating the problem
2. Formulating a hypothesis
3. Collecting the facts or data
4. Analyzing the facts
5. Reaching certain conclusions either in the form of solutions toward the concerned
problem or in certain generalization for some theoretical formulations.
Problem study plan
1. Preparation of questionnaire
2. Random distribution of questionnaire and feedback collection from the employee.
3. Personal interaction
4. Compilations of feedback
5. Correlation of feedback with information obtained through personal interaction
6. Analysis of the feedback
50

ACTION DETAILS
1. I firstly prepared a questionnaire for taking the employee’s feedback so that I could
interpret the actual problem.
2. After the preparation of questionnaire, I distributed them so as to collect the views of
employees regarding their selection process. The total employee strength in MCL is
more than 700. To get a fair statistical feedback, I distributed questionnaire to skilled
workers, supervisors and engineers. I haven’t considered unskilled and semi skilled
workers i.e. are more than 90% of total employee strength of MCL.
No. of unskilled and semi skilled worker = 90% of 700 = 700 X 90/100 = 630
No. of skilled workers, supervisors, engineers, managers, president = 700 – 630 = 70
After detecting the no. of managers and president, I take my sample size 50.
3. I interacted with employees to take feedback from them & also to crosscheck their
feedback.
4. Collected the questionnaires to compile the feedback for the analysis. The total data
of the feedback forms was compiled, categorized and analyzed.
5. The correlation between the feedback obtained through the questionnaire and the
direct feedback obtained through personal interaction was quite high.
6. Lastly interpreted the questionnaires and found out the analysis to improve the
selection process of candidates in Minda Corporation Limited.
DATA COLLECTION
Primary data
Data observed and recorded or collected directly from respondents, raw data is a term for
unprocessed data; it is also known as primary data. Raw data can be input to a computer
program or used in manual analysis procedures. Such as gathering statistics from a survey.
Information collected directly from the source through observation, conversation, and/or
participation. The degree of reliability, validity, and precision required depends on how
you intend to use the information.
51

Collection of Primary data:
In person interview
Telephone communication
Survey: To collect data through the mail, telephone, online, or through personal
interview. Survey is done trough,
Mail Survey
Telephone Survey
Online Survey
Personal Interview Survey
Sampling: is the process of selecting a small number of elements from a larger
defined target group of elements such that the information gathered from the small
group will allow judgments to be made about the larger groups
Internet
Observation : Researcher records the subjects’ overt behavior and takes notes on
the conditions and events
Experimentation
Experimentation: Researcher attempts to control certain variables while measuring
the effect of experimental variables.
Secondary data
Data complied both inside and outside the organization for some
purpose other than the current investigation. Data collected by someone other than the
user. Common sources of secondary data for social science include censuses, surveys, and
52

organizational records. It is the Pre-existing data not gathered for purposes of the current
research
Not ‘new’ data – ‘second hand’
Secondary data
‘Back up’ data – secondary in use
Types of Secondary Data:
Internal Data
Data that originate within the organization for which the research is being done.
External Data
Data that originate outside the organization for which the research is being done.
53

Searching for Secondary Data:
ANALYTICAL MODEL:
Research designDescriptive Research
Sample designConvenience Sampling
Sample size50
54
Area of operation (NCR/Delhi) Noida
Methods of Data collectionQuestionnaires
Tools of Data analysisChi-square Test
Descriptive Research
In descriptive as well as in diagnostics studies, the researcher must be able to define
clearly, what he wants to measure and must find adequate methods for measuring it
along with a clear cut definition of ‘population’ he wants to study. Since the aim is to
obtain complete and accurate information in the said studies, the procedure to be used
must be carefully planned.
Thus we can say, in descriptive data analysis, you want to ask questions such as
“What’s the distribution of my data?” or, “How did my respondents answer each
question?”
The goals of descriptive data analysis are to:
Summarize your data
Get an accurate description of the variables of interest
Convenience sampling:
Convenience sampling use when you are unable to access a wider population, for
example due to time or cost constraints. Convenience sampling is a type of non
probability sampling which involves the sample being drawn from that part of the
55

population which is close to hand. That is, a sample population selected because it is
readily available and convenient.
For example, if the interviewer was to conduct such a survey at a shopping center
early in the morning on a given day, the people that he/she could interview would be
limited to those given there at that given time, which would not represent the views of
other members of society in such an area, if the survey was to be conducted at different
times of day and several times per week. This type of sampling is most useful for pilot
testing.
Sample Size: I take my sample size is 50. In Minda Corporation Limited, there is
more than 700 employees but more than 90% employees are unskilled and semi
skilled. So I consider in my study only the left 10% employees that are skilled
employees, staff supervisors, engineers and officers.
Hypothesis: Ordinarily, when one talks about hypothesis, one simply means a mere
assumptions or some supposition to be proved or disproved. Quite often a research
hypothesis is a predictive statement, capable of being tested by scientific methods, that
relates an independent variable to some dependent variable.
Steps for hypothesis testing:
1. State Ho as well as Ha
2. Specify the level of significance
3. Decide the correct sampling distribution
4. Sample a random sample(s) and workout an appropriate value from the sample
data.
5. Calculate the probability that sample result would diverge as widely as it has
from expectations, if Ho were true.
6. Is the probability equal to or smaller than the value at level of significance?
7. If yes then reject Ho or not then accept Ho
56

CHAPTER FIVE
57

DATA INTERPRETATION AND ANALYSIS
HIGHLIGHTS:
Definition of Data Interpretation
Data tabulation
Hypothesis testing
SWOT analysis
CHAPTER FIVE
DATA INTERPRETATION
Interpretation refers to the task of drawing inferences from the collected facts after an
analysis and experimental study. In fact, it is a search for broader meaning of research
findings. The task of interpretation has two major aspects viz.,
58

1. The effort to establish continuity in research through liking the results of a given
study with those of another.
2. The establishment of some explanatory concepts.
PRIOR EXPERIENCE OF SURVEYED
RESPONDENTS
Prior Working
78%
22%
YES
NO
Analysis
From the above chart we find that 78% employees of Minda Corporation Limited
have prior experience and 22% employee have no prior experience in Minda
Corporation Limited.
DIFFERENT TYPE OF RECRUITMENT SOURCES USED IN MINDA CORPORATION LIMITED
59

Recruitment Sources
4% 4%
19%
29%
44%
Advertisement Employee Referral Consultant
Portals All of these
Analysis
From above chart we find that Minda Corporation Limited use four type of sources for hiring their employees. According to 44% employee they use consultant, according to 29% employee they use employee referral, according to19% employee they use advertisement, according to 4% employee they use portals and 4% employee said they use all of these resources.
POSITION OF INTERNAL JOINT POSTING SYSTEM i.e. INTERDEPARTMENT TRANSFERS AND PROMOTIONS
60

Internal Joint Posting System
78%
22%
Yes
No
Analysis
From above graph we clearly stated that according to 22% employee of Minda
Corporation Limited there is no internal joint posting system and according to 78%
Employee, Company do inter department transfers & promotions.
QUALITIES PREFERENCES OF CANDIDATE
SELECTION
10%12%
30%
40%
8%
Qualification Experience Skills
Personality Depend on Job
61

Analysis
From above pie chart, we find that in the selection process of Candidate Company should prefer employee’s qualification on the basis of 12% employee, employee’s experience on the basis of 30% employee, employee’s skills on the basis of 40% employee, employee’s personality on the basis of 8% employee. And according to the 10% employee qualities preferences depend on the job.
THE STAGES OF THE SELECTION PROCESS OF AN EMPLOYEE FOLLOWED BY MINDA CORPORATION LIMITED
Selection Process: Screening of application, Selection test, Interview, Reference check, Medical examination, etc
Selection Process
100%
0%
Yes
No
Analysis
From above chart we find that according to the all respondents Minda Corporation Limited followed all the stages of selection process.
BONDING PROCESS IN MINDA CORPORATION LIMITED
62

Enter into Bonds
0%
100%
Yes
No
Analysis
From the above pie chart we find that according to the all respondents, Minda Corporation Limited never asked their employees to enter into BONDS.
THE PROCESS OF PROVIDING PROPER FEEDBACK THROUGH HUMAN RESOURCE DEPARTMENT TO THE INTERVIEWING CANDIDATES UPON THEIR SELECTION OR REJECTION
Proper Feedback
14%
86%
Yes
NO
63

Analysis
From the above pie chart we find that according to the 14% employees of Minda Corporation Limited, human resource department provide proper feedback to the candidates upon their selection or rejection and according to the 86% employees there is not any process of providing proper feedback to the candidates upon their selection or rejection.
TIMING OF GETTING OFFER LETTER AFTER JOINING OF EMPLOYEE
19
15
10
5
0
5
10
15
20
Same Day
Within Week
Within Month
After Training
Analysis
From above Bar chart we find that according to the 19 respondents out of 49 they get offer letter same day of joining, according to the 15 respondents out of 49 they get offer letter within one week of joining, according to the 10 respondents out of 49 they get offer letter within one month of joining and according to the 5 respondents out of 49 they get offer letter after the training.
AGE GROUP OF SURVEYED RESPONDENTS
64

Age groups
28%
34%
8% 6%
24%
20-24
24-28
28-32
32-36
36-40
Analysis
From above pie chart we find that 28% respondents fall between the age group of 20 to 24, 34% respondents fall between the age group of 24 to 28, 24% respondents fall between the age group of 28 to 32, 8% respondents fall between the age group of 32 to 36 and 6% respondents fall between the age group of 36 to 40.
GENDER OF SURVEYED RESPONDENTS
Gender
78%
22%
Male
Female
Analysis
From the above pie chart we find that there is total 78% male respondents and 22% female respondents.
65

HYPOTHESIS – TESTING
Chi-Square test: Chi square is an important non-parametric test and as such no rigid assumptions are necessary in respect to the type of population. A chi-square can be used (a) as a test of goodness of fit and (b) as a test of independence.
As a test of goodness of fit, this test enables us to see how well the assumed theoretical distribution fits to be observed data.
As a test of independence, this test enables us to explain whether or not two attributes are associated. This test helps us in deciding this issue. In such situation, we proceed with the null hypothesis that two attributes. On this basis we first calculate the expected frequencies and then work out the value of chi-square. If the calculated value of chi-square is greater than the table value at certain level of significance for given degree of freedom, we conclude that null hypothesis does not hold good which means two attributes are associated and visa- versa.
Ho: Let us take the hypothesis that there is no difference between the opportunities of selection for experienced candidate and non experienced candidate i.e. selection process and candidate’s experience is independent.
Expectation of (AB) = (A) X (B)/N
Where, (A) represents experience and (B) represents selection process.
(A)/(B) Internal joint posting system (B)
employees who prefer experience as essential quality (b)
Total
Experienced candidate: (A)
30 15 45
Non experienced candidate ( a)
9 0 9
Total 39 15 N= 54
Now using the expectation of (AB), we can write the table of expected values as follows:
Internal joint posting system (B)
employees who prefer experience as essential quality (b)
Total
66

Experienced candidate: (A)
(AB)= 32.5 ( Ab) =12.5 45
Non experienced candidate ( a)
(Ba)=6.5 (ab) = 2.5 9
Total 39 15 54
Calculation of Chi-Square:
Group Observed frequency Oij
Expected frequency Eij
(Oij-Eij) (Oij-Eij)2 (Oij-Eij)2/Eij
AB 30 32.5 -2.5 6.25 0.19
Ab 15 12.5 +2.5 6.25 0.5
Ba 9 6.5 +2.5 6.25 0.96
ab 0 2.5 -2.5 6.25 2.5
Chi-Square = ∑ (Oij-Eij)2/ Eij = 4.15
Degree of freedom in this case= (r-1)(c-1) = (2-1)(2-1) = 1
The table value of Chi-Square for 1 degree of freedom at 5% level of significance is 3.841. The calculated value of Chi-Square is higher than this table value and hence the result of the experiment does not support the hypothesis. Thus candidate’s experience and selection process are not independent.
67

SWOT ANALYSIS
SWOT Analysis is a strategic planning method used to evaluate the Strengths, Weaknesses,
Opportunities, and Threats involved in a project or in a business venture. It is a systematic
identification of these factors and the strategy that reflects the best match between them. It is
based on the logic that an effective strategy maximizes a business’s strength and opportunity
but at the same time minimize its weakness and threats.
The overall evaluation of a company’s strengths, weakness, opportunities, and threats is
called SWOT analysis. It provides the information to identify key opportunities and threats in
the firm’s environment. They can be defined as follows:
STRENGTHS
Strength is a resource and advantage relative to competitors and the need of markets a firm
server or anticipates serving. Strength is distinctive competences that give the firm
competitive advantages in the marketplace.
WEAKNESS
It is a limitation in resources and capabilities that is a barrier which affect the performance.
Management skills and marketing skill etc are example of it.
68
OPPORTUNITY
An environmental opportunity is an area of buyers need and interest in which there is a high
probability that a company can profitably satisfy the need.
THREATS
An environmental threat is a challenge imposed by an unfavorable trend or development that
would lead, in the absence of defensive action, to lower sales profit.
SWOT ANALYSIS on the basis of my study
I have tried to focus on SWOT analysis of Minda Corporation Limited that about the strengths, weaknesses, opportunities and threats. Here are the findings:
Strengths
A good reputation of the company. Good services.
Working culture is very friendly and healthy.
Good compensation system.
More growth opportunities for employees.
Communication system is good between the management and employees.
All the employees are treated as same and given equal preferences.
Good training programmes
Good transportation facilities to the employee.
No bonding system.
.Weakness
Take too much time for interview process so time management is not good. Recruitment process is affected by socio, political and economic factors.
69

Not considering the whole talent, only considering experienced one.
Opportunities
A better information system can be developed to give the necessary information to the customer.
Mergers and acquisitions
Vast expansion and growth
Threats
Growing competition.
If the competitor hirer best talent that company going to neglect.
CHAPTER SIX
LIMITATIONS OF THE STUDY
70

CHAPTER SIX
LIMITATIONS
STATISTICAL
• The sample size is small because there is more than 90% employee are unskilled and
semi-skilled.
• Time allotted for this project work could be increased for more intensive research.
• As questionnaire method was used, only those responses, which were able to read
English, were taken into account.
ATTITUDINAL71
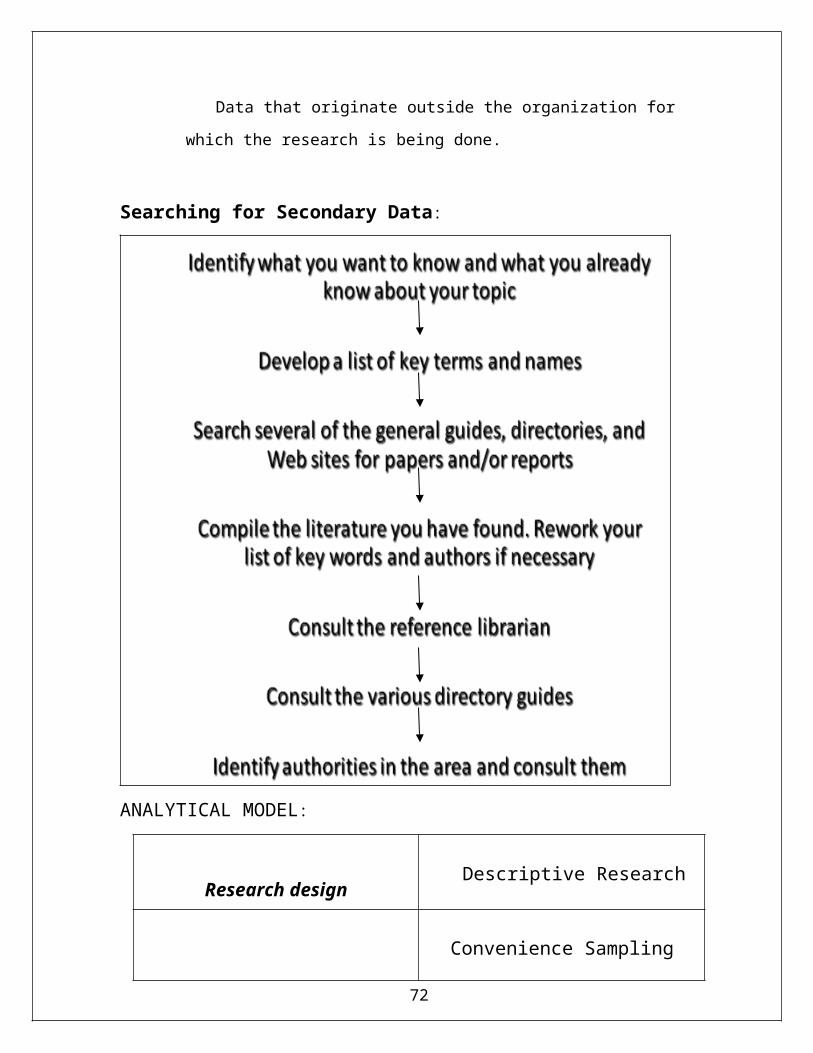
• The responses were taken in the period of when inflation in India just increasing day
by day, so it may difficult the mind set of respondents towards recruitment and
selection process.
• The respondents showed lukewarm response to some of the questions as they were
confidential in nature.
• Working hours of trainees were allotted two days in a week.
• Lack of research experience.
CHAPTER SEVEN
RECOMMENDATIONS TO THE COMPANY
72

CHAPTER SEVEN
RECOMDATIONS
Do not let employees to do over work. Because of work load productivity of employees decreases.
There should be good coordination between the members of different departments.
Time to time increment necessary according to employee’s performance.
Provide career growth opportunities to the employees.
Consider welfare of employees as necessary activity.
Provide feedback to the candidates who are unable to achieve success in selection process.
73

Human touch therapy: Organization should provide their employees psychological support and positive environment. So that they can build a perfect team and be emotionally attach with organization.
Time management should be proper i.e. keep exact time for interview.
Written test also include in selection process of candidate.
Give complete information about company’s profile in recruitment advertisement.
Recruitment and selection process should be transparent.
There should be not any type language barrier in recruitment and selection process.
Recruitment and selection process should be free from political, socio and economic factors.
Few students from some of the reputed institute should be recruited directly from campus interview.
CHAPTER EIGHT
CONCLUSIONS74

CHAPTER EIGHT
CONCLUSION
From the above hypothesis testing we can conclude that recruitment and selection process in Minda Corporation Limited depend on the employee’s experience. They select experienced candidate. Because of this reason selection criteria become limited and company becomes unable to hire most suitable talent for the job.
The main reason of neglecting fresher is, employers think that if company hire fresher and non experienced candidates then in starting company have to invest something on them and may be possible after getting experience, employee leave the company for better growth opportunities. In this case company unable to get more output from them. So company prefers experienced candidates. So that company gets more output in place of less input.
75

And we can also conclude that the recruitment and selection process affected by socio cultural and political factors because in company the ratio of women employee is so less in comparison to male employee.
CHAPTER NINE
76

APPENDIX
HIGHLIGHTS:
Employee’s expectations from HR department
Details of samples
Bibliography
Copy of questionnaire
EMPLOYEE’S EXPECTATIONS FROM HUMAN RESOURCE DEPARTMENT
The following expectations of employees of Minda Corporation Lmt. from their hr department are given below:
Arrange more training for motivation. Selection process should be quite easy
Change salary structure
Prefer Hindi language for interview
77

Cultural activities should be more
No salary negotiation
Timely appraisal
Time management should be proper
One day interview and final the candidate in one day
Questions asked during interview should be as per specific knowledge
Transportation and food facility should be free
Sunday always should be holiday
78
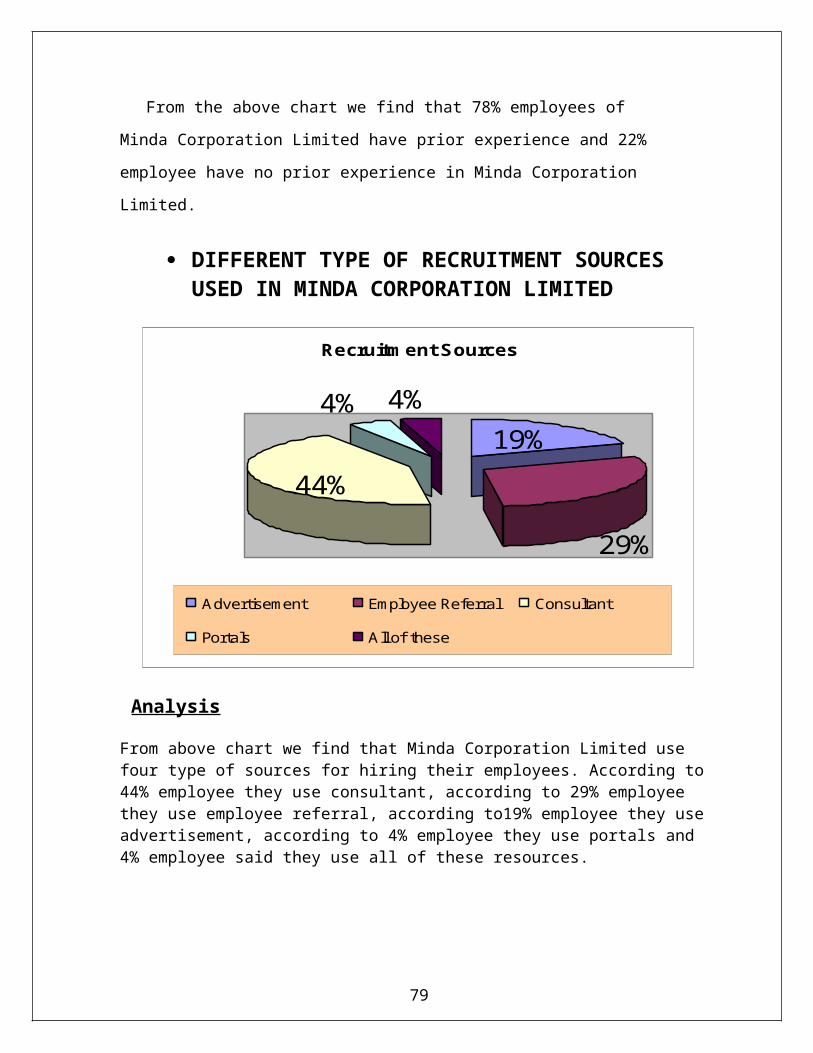
DETAILS OF SAMPLES
See annexure 1
BIBLIOGRAPHY
Books
79

Kothari, C.R., Research Methodology methods & Techniques, New Age
International publishers, New Delhi, 2008, ed.2nd.
Levin, R.I. & Rubin D.S., Statistics for Management, Pearson Education Prentice
Hall of India, 2008, ed. 7th
Rao, V.S.P., Human Resource Development.
Aswathappa, k., Human Resource Management, Tata McGraw-Hill Publishing
Company Limited, New Delhi, 2008, ed.5th.
Dessler, Gary., Human Resource Management, Pearson Education Prentice Hall of
India, 2008, ed. 10th
Magazines
March, 2009, MINDA Times.
Manuals of Minda Corporation Ltd. (composed by corporate office)
August, 2009, Human Factor.
Websites
www.minda.co.in
www.hr.guide.com
Newspaper: 11 October, 2009, Business Standard, Page no.16, Article- Resume frauds
rose abruptly in March.
QUESTIONNAIRE
Dear respondent,
80

This research is to study and analyze the Recruitment and Selection Process and it is incomplete without your valuable contribution. All the data collected from you will be used for the sole purpose of research only.
Q1. Do you have any prior working experience? If yes, please mention the total months.
a) Yes b) No Total Months…………….
Q2. What Recruitment Sources are used in this company?
a)Advertisement b) Employee Referral c) Consultant d) Portals e) All of these
Q3. Does this company adapt Internal Joint Posting System (Inter department transfers & promotions)?
a) Yes b) No
Q4. Rank the qualities in the order of your preference on the basis of candidate selection?
a) Qualification b) Experience c) Skills d) Personality e) Depends on Job
Q5. Does all the stages of the selection process of an employee been followed by your organization?
(Selection Process: Screening of application, Selection test, Interview, Reference check, Medical examination, etc.)
a) Yes b) No
Q6. Does this company ask candidates to enter into BONDS with them?
a) Yes b) No
If Yes then in what kind of Job or Department………………………….
Q7. Does the HR provide proper feedback to the interviewing candidates upon their selection or rejection?
a) Yes b) No
Q8. Within how many days you are been given your offer letter once you join?
a) Same day b) Within one week c) Within one month d) After the training
Q9. What are your three likings for Minda Corporation Lmt.?
81

a)b)c)
Q10. What are your three expectations from human resource department in MCL?
a)b)c)
Q11. What are your three key suggestions to improve overall recruitment and selection procedure of the company?
a)b)c)
Personal DetailsDesignation :Gender :Age :
Thanks for sparing your valuable time and sharing your views.
82

83


![Report Main[1]](https://img.pdfslide.net/doc/110x75/551eae364979592e5b8b4770/report-main1.jpg)