Embed Size (px)
Citation preview
Aggregate Revenue Requirement & Tariff Revision Petition
for FY 2008-09
Volume -1
Main Text and Formats
Submitted to
Punjab State Electricity Regulatory Commission
Chandigarh
By
PUNJAB STATE ELECTRICITY BOARD
The Mall, Patiala – 147001
January 2008
PSEB ARR Petition FY 08-09
Page 2 of 83
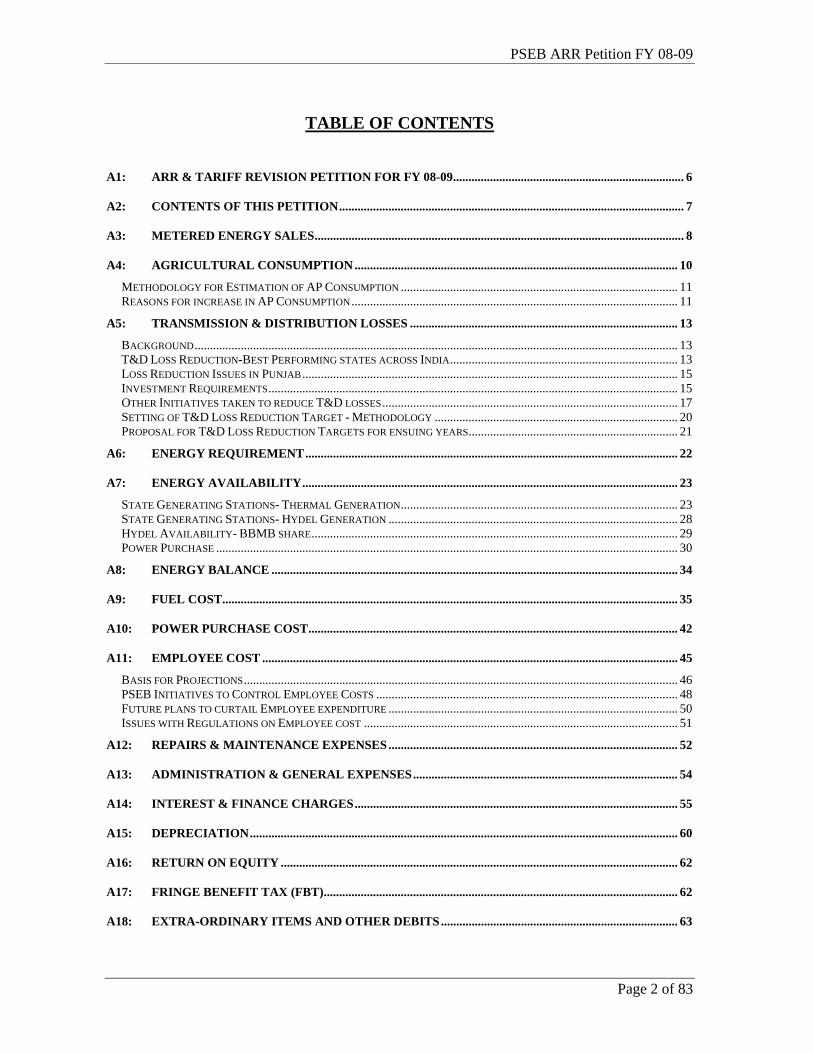
TABLE OF CONTENTS
A1: ARR & TARIFF REVISION PETITION FOR FY 08-09........................................................................... 6
A2: CONTENTS OF THIS PETITION................................................................................................................ 7
A3: METERED ENERGY SALES........................................................................................................................ 8
A4: AGRICULTURAL CONSUMPTION ......................................................................................................... 10 METHODOLOGY FOR ESTIMATION OF AP CONSUMPTION .......................................................................................... 11 REASONS FOR INCREASE IN AP CONSUMPTION.......................................................................................................... 11
A5: TRANSMISSION & DISTRIBUTION LOSSES ....................................................................................... 13 BACKGROUND............................................................................................................................................................. 13 T&D LOSS REDUCTION-BEST PERFORMING STATES ACROSS INDIA.......................................................................... 13 LOSS REDUCTION ISSUES IN PUNJAB.......................................................................................................................... 15 INVESTMENT REQUIREMENTS..................................................................................................................................... 15 OTHER INITIATIVES TAKEN TO REDUCE T&D LOSSES................................................................................................ 17 SETTING OF T&D LOSS REDUCTION TARGET - METHODOLOGY ............................................................................... 20 PROPOSAL FOR T&D LOSS REDUCTION TARGETS FOR ENSUING YEARS.................................................................... 21
A6: ENERGY REQUIREMENT......................................................................................................................... 22
A7: ENERGY AVAILABILITY.......................................................................................................................... 23 STATE GENERATING STATIONS- THERMAL GENERATION.......................................................................................... 23 STATE GENERATING STATIONS- HYDEL GENERATION .............................................................................................. 28 HYDEL AVAILABILITY- BBMB SHARE....................................................................................................................... 29 POWER PURCHASE ...................................................................................................................................................... 30
A8: ENERGY BALANCE .................................................................................................................................... 34
A9: FUEL COST.................................................................................................................................................... 35
A10: POWER PURCHASE COST........................................................................................................................ 42
A11: EMPLOYEE COST ....................................................................................................................................... 45 BASIS FOR PROJECTIONS............................................................................................................................................. 46 PSEB INITIATIVES TO CONTROL EMPLOYEE COSTS .................................................................................................. 48 FUTURE PLANS TO CURTAIL EMPLOYEE EXPENDITURE .............................................................................................. 50 ISSUES WITH REGULATIONS ON EMPLOYEE COST ...................................................................................................... 51
A12: REPAIRS & MAINTENANCE EXPENSES.............................................................................................. 52
A13: ADMINISTRATION & GENERAL EXPENSES...................................................................................... 54
A14: INTEREST & FINANCE CHARGES......................................................................................................... 55
A15: DEPRECIATION........................................................................................................................................... 60
A16: RETURN ON EQUITY ................................................................................................................................. 62
A17: FRINGE BENEFIT TAX (FBT)................................................................................................................... 62
A18: EXTRA-ORDINARY ITEMS AND OTHER DEBITS............................................................................. 63
PSEB ARR Petition FY 08-09
Page 3 of 83
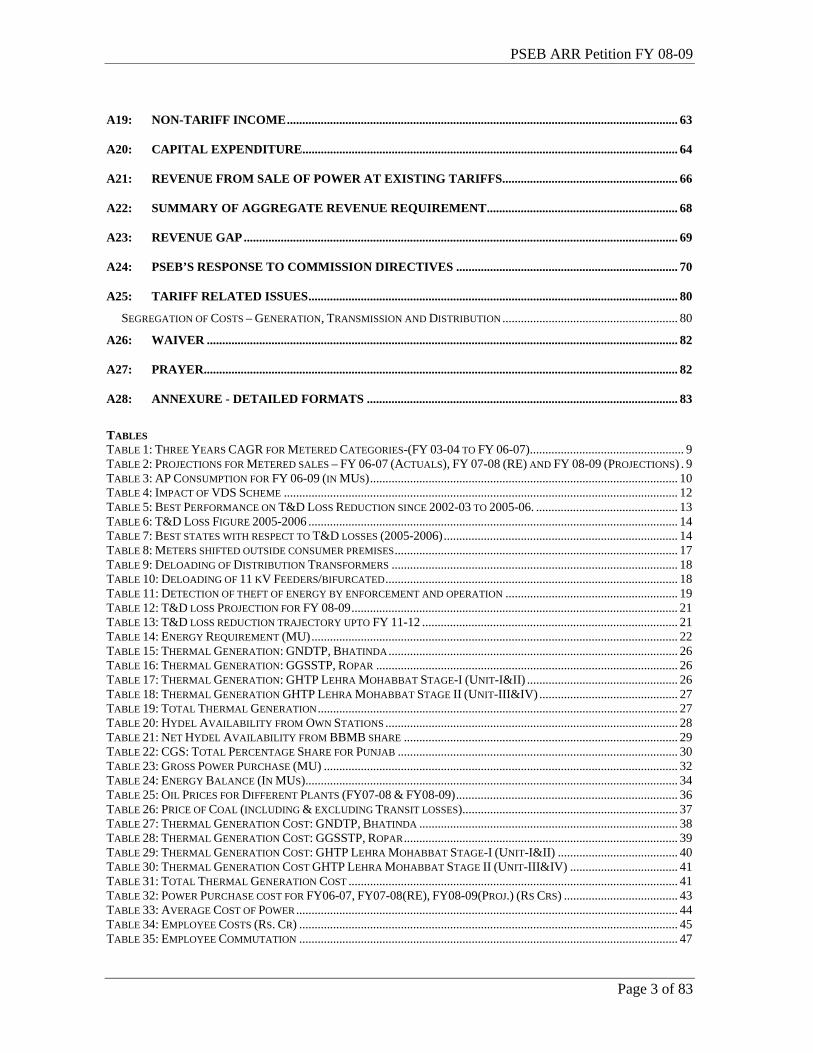
A19: NON-TARIFF INCOME............................................................................................................................... 63
A20: CAPITAL EXPENDITURE.......................................................................................................................... 64
A21: REVENUE FROM SALE OF POWER AT EXISTING TARIFFS......................................................... 66
A22: SUMMARY OF AGGREGATE REVENUE REQUIREMENT.............................................................. 68
A23: REVENUE GAP............................................................................................................................................. 69
A24: PSEB’S RESPONSE TO COMMISSION DIRECTIVES ........................................................................ 70
A25: TARIFF RELATED ISSUES........................................................................................................................ 80 SEGREGATION OF COSTS – GENERATION, TRANSMISSION AND DISTRIBUTION ......................................................... 80
A26: WAIVER ......................................................................................................................................................... 82
A27: PRAYER.......................................................................................................................................................... 82
A28: ANNEXURE - DETAILED FORMATS ..................................................................................................... 83 TABLES TABLE 1: THREE YEARS CAGR FOR METERED CATEGORIES-(FY 03-04 TO FY 06-07).................................................. 9 TABLE 2: PROJECTIONS FOR METERED SALES – FY 06-07 (ACTUALS), FY 07-08 (RE) AND FY 08-09 (PROJECTIONS) . 9 TABLE 3: AP CONSUMPTION FOR FY 06-09 (IN MUS).................................................................................................... 10 TABLE 4: IMPACT OF VDS SCHEME ................................................................................................................................ 12 TABLE 5: BEST PERFORMANCE ON T&D LOSS REDUCTION SINCE 2002-03 TO 2005-06. .............................................. 13 TABLE 6: T&D LOSS FIGURE 2005-2006 ........................................................................................................................ 14 TABLE 7: BEST STATES WITH RESPECT TO T&D LOSSES (2005-2006)............................................................................ 14 TABLE 8: METERS SHIFTED OUTSIDE CONSUMER PREMISES............................................................................................ 17 TABLE 9: DELOADING OF DISTRIBUTION TRANSFORMERS ............................................................................................. 18 TABLE 10: DELOADING OF 11 KV FEEDERS/BIFURCATED............................................................................................... 18 TABLE 11: DETECTION OF THEFT OF ENERGY BY ENFORCEMENT AND OPERATION ........................................................ 19 TABLE 12: T&D LOSS PROJECTION FOR FY 08-09.......................................................................................................... 21 TABLE 13: T&D LOSS REDUCTION TRAJECTORY UPTO FY 11-12 ................................................................................... 21 TABLE 14: ENERGY REQUIREMENT (MU)....................................................................................................................... 22 TABLE 15: THERMAL GENERATION: GNDTP, BHATINDA.............................................................................................. 26 TABLE 16: THERMAL GENERATION: GGSSTP, ROPAR .................................................................................................. 26 TABLE 17: THERMAL GENERATION: GHTP LEHRA MOHABBAT STAGE-I (UNIT-I&II) ................................................. 26 TABLE 18: THERMAL GENERATION GHTP LEHRA MOHABBAT STAGE II (UNIT-III&IV) ............................................. 27 TABLE 19: TOTAL THERMAL GENERATION..................................................................................................................... 27 TABLE 20: HYDEL AVAILABILITY FROM OWN STATIONS ............................................................................................... 28 TABLE 21: NET HYDEL AVAILABILITY FROM BBMB SHARE ......................................................................................... 29 TABLE 22: CGS: TOTAL PERCENTAGE SHARE FOR PUNJAB ........................................................................................... 30 TABLE 23: GROSS POWER PURCHASE (MU) ................................................................................................................... 32 TABLE 24: ENERGY BALANCE (IN MUS)......................................................................................................................... 34 TABLE 25: OIL PRICES FOR DIFFERENT PLANTS (FY07-08 & FY08-09)........................................................................ 36 TABLE 26: PRICE OF COAL (INCLUDING & EXCLUDING TRANSIT LOSSES)...................................................................... 37 TABLE 27: THERMAL GENERATION COST: GNDTP, BHATINDA .................................................................................... 38 TABLE 28: THERMAL GENERATION COST: GGSSTP, ROPAR......................................................................................... 39 TABLE 29: THERMAL GENERATION COST: GHTP LEHRA MOHABBAT STAGE-I (UNIT-I&II) ....................................... 40 TABLE 30: THERMAL GENERATION COST GHTP LEHRA MOHABBAT STAGE II (UNIT-III&IV) ................................... 41 TABLE 31: TOTAL THERMAL GENERATION COST ........................................................................................................... 41 TABLE 32: POWER PURCHASE COST FOR FY06-07, FY07-08(RE), FY08-09(PROJ.) (RS CRS) ..................................... 43 TABLE 33: AVERAGE COST OF POWER............................................................................................................................ 44 TABLE 34: EMPLOYEE COSTS (RS. CR) ........................................................................................................................... 45 TABLE 35: EMPLOYEE COMMUTATION ........................................................................................................................... 47
PSEB ARR Petition FY 08-09
Page 4 of 83
TABLE 36: INCREASE IN GRATUITY................................................................................................................................. 47 TABLE 37: SAVING DUE TO RETIREMENT ........................................................................................................................ 48 TABLE 38: SAVING DUE TO REDUCTION IN INCENTIVE................................................................................................... 49 TABLE 39: EMPLOYEE PRODUCTIVITY ............................................................................................................................ 50 TABLE 40: PROJECTED EMPLOYEE PRODUCTIVITY ........................................................................................................ 50 TABLE 41: GFA & ADDITION IN THE ASSETS .................................................................................................................. 52 TABLE 42: REPAIRS & MAINTENANCE EXPENSES........................................................................................................... 53 TABLE 43: ADMINISTRATIVE & GENERAL EXPENSES ..................................................................................................... 54 TABLE 44: INTEREST & FINANCE CHARGES.................................................................................................................... 55 TABLE 45: NORMATIVE INTEREST ON WORKING CAPITAL............................................................................................. 57 TABLE 46: INTEREST COST ON SHORT TERM LOANS ........................................................................................................ 59 TABLE 47: DEPRECIATION (IN RS.CR)............................................................................................................................ 61 TABLE 48: RETURN ON EQUITY (IN RS.CR) .................................................................................................................... 62 TABLE 49: NON-TARIFF INCOME (IN RS.CR) .................................................................................................................. 63 TABLE 50: CAPITAL INVESTMENT PLAN (SCHEME-WISE) (RS. CRS.) ............................................................................. 64 TABLE 51: INVESTMENT PLAN (YEAR WISE) APPROVED OUTLAY (RS. IN CR) .............................................................. 66 TABLE 52: REVENUE FROM SALE OF POWER AT EXISTING TARIFFS FOR FY07-08 ......................................................... 66 TABLE 53: REVENUE FROM SALE OF POWER AT EXISTING TARIFFS FOR FY 08-09 ........................................................ 67 TABLE 54: AGGREGATE REVENUE REQUIREMENT (RS. CRS) ......................................................................................... 68 TABLE 55: REVENUE GAP (IN RS. CRS.).......................................................................................................................... 69 TABLE 56: APPORTIONMENT OF COSTS AMONG VARIOUS FUNCTIONS ........................................................................... 80
PSEB ARR Petition FY 08-09
Page 5 of 83
BEFORE THE PUNJAB STATE ELECTRICITY REGULATORY COMMISSION
CHANDIGARH
Filing No…………
Case No…………
IN THE MATTER OF: Filing of the petition for determination of Aggregate Revenue Requirement (ARR) and Retail Tariff for the financial year 2008-09 under Sections 62,64 and 86 of the Electricity Act, 2003 read with the relevant regulations and guidelines of the Commission for the Electricity business of Punjab State Electricity Board
AND
IN THE MATTER OF Punjab State Electricity Board (hereinafter referred to as "PSEB" or "The Board") The Mall, Patiala – 147001 - Applicant
The Applicant respectfully submits as under: -
PSEB ARR Petition FY 08-09
Page 6 of 83
A1: ARR & TARIFF REVISION PETITION FOR FY 08-09
1.1 The Punjab State Electricity Board (“Board” or “PSEB”) is a statutory body constituted under Section 5 of the Electricity (Supply) Act, 1948 and has been engaged in the electricity generation, transmission, distribution and related activities in the State of Punjab. The PSEB is filing the current petition for approval of Annual Revenue Requirement (ARR) & determination of tariff for financial year 2008-09 and revised ARR estimate for FY2007-08 and actual figures of FY2006-07 for truing up.
1.2 In order to meet the requirement of the Electricity Act 2003, Government of Punjab is in the process of restructuring PSEB in terms of Section 172 read with Section 131 of the Electricity Act, 2003.
1.3 Government of Punjab, Department of Power vide its notification no. 1/36/07 – EB (PR)/1975 dated 7th December 2007 has directed that PSEB shall continue to function as a State Transmission Utility and a Licensee for a further period up to 29th February, 2008. The notification has been attached as a separate annexure on the last page of this petition. PSEB is awaiting further directions from the Govt. of Punjab. Meanwhile the Board is in the process of segregating the costs for the Generation, Transmission and Distribution.
1.4 This Petition details the Board’s Aggregate Revenue Requirement (ARR) for the Financial Year 2008-09 as a vertically integrated utility. PSEB would submit the respective costs and revenues for segregated businesses for the Commission’s approval as and when the businesses are segregated based on the restructuring decisions of the State Government.
1.5 The PSEB has complied with the requirements of the Terms and Conditions for determination of tariff issued by the Commission vide its notification dated 21st November, 2005 to the extent it has been possible for PSEB to undertake in the facts and circumstances prevalent in the State. PSEB submits that it has certain reservations to certain clauses of the Regulations pertaining to the following:
(a) The Basis for Approving Operation and Maintenance expenses specifically, employee cost and R&M expenses.
(b) Transmission and Distribution Loss Trajectory
(c) Computation of Working Capital
(d) Norms for determining Fuel Cost
(e) Basis for approving Auxiliary consumption of own thermal/hydel power stations.
1.6 PSEB’s response/compliance of various directives listed in Chapter 10 of the Order dated September 17, 2007 is given in chapter A24:of the petition.
PSEB ARR Petition FY 08-09
Page 7 of 83
1.7 Auditor General, Punjab (Audit), Chandigarh has conducted the audit of the Annual Accounts of the Board for 2006-07. The Audit Report / Certificate are yet to be received by the Board. In the meantime, seven copies of the annual accounts are enclosed herewith for Commissions’ Record.
A2: CONTENTS OF THIS PETITION
2.1 This Petition covers in detail the basis, assumptions and projections of individual elements constituting the determination of ARR for FY 08-09. The petition also covers the revised estimates for FY 2007-08 and the actuals for FY 2006-07. The petition comprises of the following sections:
(a) Metered Energy Sales
(b) Agriculture Energy Sales
(c) T&D Losses
(d) Energy Requirement
(e) Energy Availability-Generation from Owned & Shared stations and Power Purchase from various sources to meet the Energy Requirement
(f) Energy Balance
(g) Determination of cost components of ARR
(i) Fuel Cost
(ii) Power Purchase Cost
(iii) Employee Cost
(iv) Repairs & Maintenance Cost
(v) Administration & General Cost
(vi) Interest Cost
(vii) Depreciation
(viii) Other Costs
(ix) Reasonable return
(x) Non-Tariff Income
PSEB ARR Petition FY 08-09
Page 8 of 83
(h) Capital Investment Plan for Generation, Transmission, Rural Electrification & Distribution
(i) Revenues at existing tariffs
(j) Summary of Aggregate Revenue Requirement
(k) Determination of Gap between Revenue at existing Tariff & annual expenditure.
A3: METERED ENERGY SALES
Revised estimate of metered energy Sale for FY 07-08
3.1 The Energy Sales to Metered categories for FY 07-08 has been re-estimated on the following basis:
(a) Actual figures of first 6 months (till Sep’07)
(b) For the next six months (Oct’07 – March’08) the projections for each of the consumer categories have been done based on category wise half yearly CAGR of the second half year for the period FY 03-04 to FY 06-07. This category wise CAGR rates have been applied to the corresponding actual category wise sales figures of second half of FY 06-07 (i.e. Oct’06 – Mar’07) to arrive at metered sales projections for each category for the second half year in FY 07-08.
Projection of metered energy sale for FY 08-09
3.2 The metered energy sales figures for FY 2008-09 have been projected based on 3 year category-wise annual CAGR as per the methodology adopted by the Hon’ble Commission. The 3 year CAGR has been applied to all metered consumption categories except for Railway Traction. The 3 year category-wise CAGR has been calculated from actual audited metered sales figures for each of the categories for the period FY 2003-04 to FY 2006-07. The category-wise CAGR thus calculated has been applied on revised estimates of FY 2007-08 metered sales figures of respective categories to arrive at the category wise metered energy sales projection for FY 2008-09.
3.3 The Board has proposed not to apply the CAGR method in case of Railway Traction category since the 3 year CAGR for this category is 14.81% owing to unusual growth in the consumption between the period FY 2003-04 to FY 2006-07. The Board does not foresee the demand for this category to increase at such rates, so the sale to Railway Traction for FY 2008-09 has been kept at the same level as the revised estimates of FY 2007-08.

PSEB ARR Petition FY 08-09
Page 9 of 83
3.4 The Compounded Annual Growth Rate (FY’04 to FY’07) of the metered categories is depicted in the table given below:
Table 1: Three Years CAGR for Metered Categories-(FY 03-04 to FY 06-07)
Category 3 Year CAGR (FY’04-FY’07) 1 Domestic 2.77% 2 Commercial 8.64% 3 Public Lighting 8.26% 4 Industrial Supply (Small Power) -0.28% 5 Industrial Supply (Medium Power) 0.24% 6 Industrial Supply (Large Power) 5.83% 7 Bulk Supply 2.16%
3.5 The Sales to common pool for FY 2007-08 and FY 2008-09 has been projected based on the actual figures of sales to common pool for FY 2006-07. The Board does not foresee any change in the sales to common pool and hence the projection figures have been kept at the same level as actual sales of FY 06-07.
3.6 The table given below summarizes the actual metered sales(MU) figures of FY 06-07, revised estimates of metered sales for FY 07-08 and the projections for FY 08-09:
Table 2: Projections for Metered sales – FY 06-07 (Actuals), FY 07-08 (RE) and FY 08-09 (Projections)
S.No Metered Energy Sales (MU)
FY 2006-07 (Actual)
FY 2007-08 (RE)
FY 2008-09 (Projected)
% Growth (FY07- FY08)
1 Domestic 5710 6302 6476 10.37% 2 Commercial 1641 1877 2039 14.38% 3 Public Lighting 129 141 153 9.30% 4 Industrial Supply a Small Power 713 736 734 3.23% b Medium Supply 1490 1568 1571 5.23%
c Large Supply 7975 8877 9394 11.31% 5 Bulk Supply 456 475 485 4.17% 6 Railway Traction 106 110 110 3.77% 7 Total Metered Sales 18220* 20085 20963 10.24%
* Does not include 161.9 MU on account of theft detection
3.7 The revised estimates for FY 2007-08 of the Domestic, Commercial and Large Supply Categories have increased significantly over the corresponding actual sales of FY 2006-07 owing mainly to the increased actual sales in the first half (i.e. Apr’07- Sep’07) of FY 2007-08.
3.8 The actual sales figures of first 6 months (Apr’07 – Sep’07) for the Categories- Domestic, Commercial and Large Supply have increased at a rate of 16.3%, 19.3% and 15.5% respectively over the sale figures registered for the same period in FY 2006-07.
PSEB ARR Petition FY 08-09
Page 10 of 83
3.9 Outside State sales for first half of FY 07-08 are based on actuals and the estimates for second half year are based on the committed sales on account of open access transactions and sale/banking through traders. The Board has estimated the Outside State sales for FY 08-09 envisaging a similar pattern to that of FY 07-08.
A4: AGRICULTURAL CONSUMPTION
Revised estimate of Agriculture consumption for FY 2007-08:
4.1 The Agricultural consumption for FY 07-08 has been re-estimated on the following basis:
(a) Actual consumption of first 6 months (till Sep’07) based on sample meters
(b) For the next six months (Oct’07 – Mar’08) the projections are based on a normative growth rate of 5% as approved by the Commission in the Tariff Order for FY 07-08. This growth rate has been applied to the corresponding actual sales figures of second half of FY 06-07 (i.e. Oct’06 – Mar’07) to arrive at sales projections for the second half year in FY 07-08.
Projection of Agriculture Consumption for FY 08-09
4.2 The Projections for FY 08-09 have also been made based on the 5% growth rate approved by the Commission in the Tariff Order for FY 07-08. This growth rate has been applied on revised estimates of FY 07-08 sales figures to arrive at energy sales projection for AP category for FY 08-09.
4.3 Presently, agriculture consumption is being assessed on the basis of actual consumption of 53433 (as on Sept’07) tube well connections as measured by sample meters installed all over the state on representative basis. The total size of sample metering for assessment of AP Consumption is about 5.5% corresponding to total AP connections, as against the 2% sample metering as per the directive of the Hon’ble Commission.
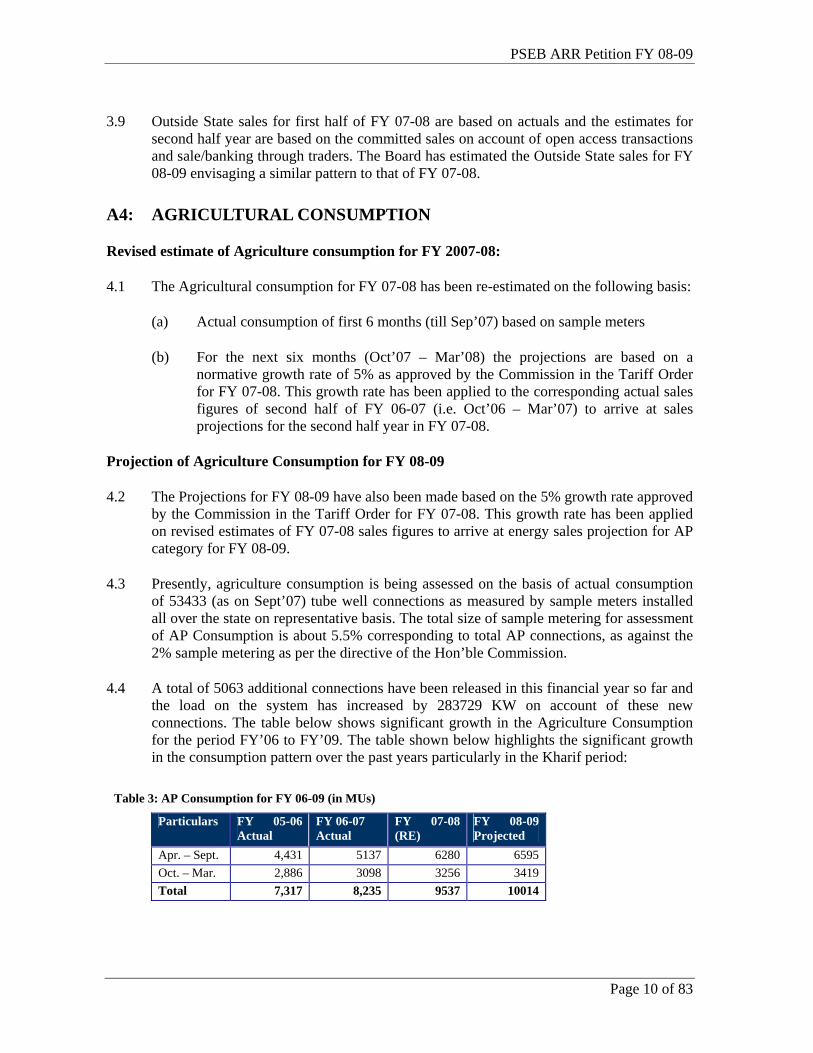
4.4 A total of 5063 additional connections have been released in this financial year so far and the load on the system has increased by 283729 KW on account of these new connections. The table below shows significant growth in the Agriculture Consumption for the period FY’06 to FY’09. The table shown below highlights the significant growth in the consumption pattern over the past years particularly in the Kharif period:
Table 3: AP Consumption for FY 06-09 (in MUs)
Particulars FY 05-06 Actual
FY 06-07 Actual
FY 07-08 (RE)
FY 08-09 Projected
Apr. – Sept. 4,431 5137 6280 6595 Oct. – Mar. 2,886 3098 3256 3419 Total 7,317 8,235 9537 10014
PSEB ARR Petition FY 08-09
Page 11 of 83
Methodology for Estimation of AP Consumption
4.5 The AP Consumption is estimated on the basis of the sample metering by taking the readings of the representative sample meters in each of the divisions to get the AP Consumption factors for each of the divisions which are used to compute the aggregate consumption for each division. The consumption of all divisions is summed up to find the consumption of each circle & then zone and subsequently the total consumption of Punjab is computed.
4.6 The Board submits that the above is fairly accurate & reliable method of assessing AP consumption. In the hearing given to the Board by PSERC regarding ARR/Tariff for 2007-08, wherein Secy/Power was also present as representative of the State Govt it was categorically stated by the Board that, in case the present method of assessing the AP consumption by sample metering is not acceptable to the state govt. or PSERC, the PSERC or the state govt. may appoint any agency or put in place any mechanism for assessing/measuring AP consumption & full cost of the same will be borne by PSEB. The Board submits that it stands by its proposal.
4.7 The Board further submits that as per the Commitment made in the meeting with Hon’ble Chief Minister, Punjab on 5.12.2007 for commissioning of AMR (Automatic Meter Reading) of sample meter installed before the start of next paddy season, an open tender enquiry has been floated by the Board on 3.1.2008 which is scheduled to be opened shortly. Tentatively, the work shall be allotted to the eligible bidder by March 2008.
4.8 The Board is of the view that once this scheme is implemented, it will bring in more transparency and remove any doubts on the veracity of the data submitted on AP consumption by the Board.
Segregation of AP feeders
4.9 The segregation of feeders is essential to assess AP consumption as well as the Agriculture related losses in an accurate manner. It is pertinent to note that due to longer feeder lengths extended to feed rural areas, the technical losses could be on a higher side.
4.10 The segregation shall assist the Board to verify more accurately the agriculture consumption in the state. The segregation of all AP feeders is complete except for 3 phase 4 wire rural feeders. For 3 phase 4 wire feeders, the segregation work stands completed but the separate feeding lines for tubewells and general loads have been proposed to be erected in the project which will cover 2607 villages by spending Rs. 90 Crores.
Reasons for increase in AP Consumption
4.11 The increase in the consumption can be attributed to various reasons. The reasons apart from release of new connections due to which the Agriculture Consumption has increased considerably in FY 07-08 are discussed below.
PSEB ARR Petition FY 08-09
Page 12 of 83
Impact of Rainfall
4.12 The Board would like to reiterate that there has been a significant decrease of rainfall in the past 3 to 4 years resulting in increase in temperature. The deficit in rainfall this year has been about 22%.
4.13 Despite the lack of rainfall, the state has recorded a growth of 1.86% in farming which points to the fact that the dependence of farmers on drawing water from tubewells has been increasing significantly. It is evident that to make up for the shortfall in rain, the farmers have been making excessive use of tubewells which has made it possible to achieve higher ‘yield per hectare’ and that is one of the major reason for the increased consumption patterns, particularly in the Kharif season in the AP category.
4.14 The rice production in the state has now touched 5.8 tonnes per hectare. Under dry conditions, rice needs to be irrigated 24 to 28 times, constituting 37% of the total water demand of Punjab. Over 70% of the tubewells in the state are in the central districts and about 85% of the land is used for rice during kharif season.
4.15 The growth in agricultural consumption can therefore be correlated to the increased shortage in the quantity of rainfall and increasing crop production activity during the kharif season in the State.
4.16 The above salient aspects need to be factored in deciding on the AP consumption by the Hon’ble Commission.
Impact of VDS scheme
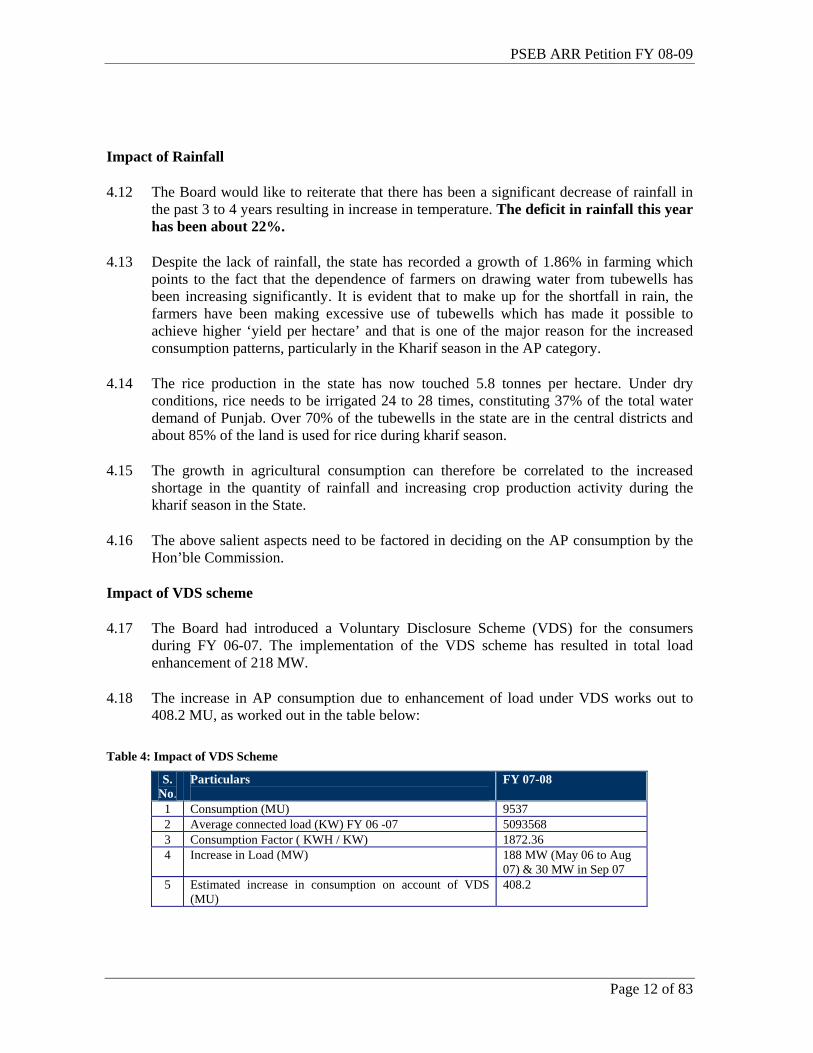
4.17 The Board had introduced a Voluntary Disclosure Scheme (VDS) for the consumers during FY 06-07. The implementation of the VDS scheme has resulted in total load enhancement of 218 MW.
4.18 The increase in AP consumption due to enhancement of load under VDS works out to 408.2 MU, as worked out in the table below:
Table 4: Impact of VDS Scheme
S. No.
Particulars
FY 07-08
1 Consumption (MU) 9537 2 Average connected load (KW) FY 06 -07 5093568 3 Consumption Factor ( KWH / KW) 1872.36 4 Increase in Load (MW) 188 MW (May 06 to Aug
07) & 30 MW in Sep 07 5 Estimated increase in consumption on account of VDS
(MU) 408.2
PSEB ARR Petition FY 08-09
Page 13 of 83
Use of Submersible Monoblock Pumps
4.19 Another reason for the considerable increase in AP consumption has been an increase in the use of Submersible Monoblock pumps by the AP consumers, primarily due to gradual depletion of the water table over the past few years. The Submersible Monoblock pumps consume more power which affects the consumption.
4.20 The Board would like to request the Commission to consider the reasons for the increase in AP consumption and accordingly approve AP consumption at 9537 MU for FY 2007-08 and 10014 MU as projected for FY 2008-09.
A5: TRANSMISSION & DISTRIBUTION LOSSES
Background
5.1 The Hon’ble Commission in its Tariff Order FY 07-08 has set a T&D loss level target for FY 07-08 at 19.5%. Considering the actual T&D loss levels recorded for FY 06-07 i.e. 23.91%, the target implied a reduction of 4.41% in FY 07-08 from the actual levels in FY 06-07, which was impossible to achieve.
5.2 Considering the performance with respect to the reduction in T&D losses by other states which are operating at the T&D loss level of above 30% or between 20%-30% in recent years, then it would be evident that no state has achieved T&D loss reductions to this extent in any one year.
5.3 The above clearly signifies the impracticality of achieving the loss levels of 19.5% in the year 2007-08 considering the actual loss level in FY 06-07, as it would have needed massive investment for loss reduction which is not practicable to be made in a single year and further no utility been able to achieve a reduction to the tune of 4.41% in a single year at a loss level of 23-24%.
T&D Loss Reduction-Best Performing states across India
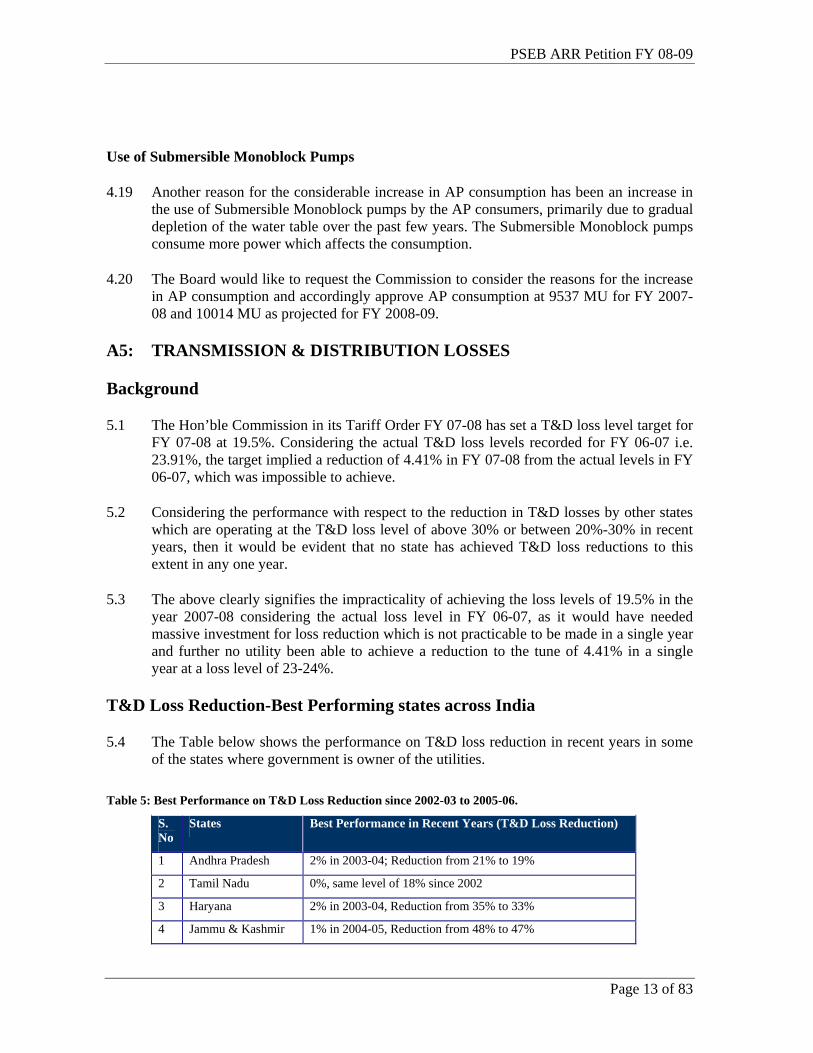
5.4 The Table below shows the performance on T&D loss reduction in recent years in some of the states where government is owner of the utilities.
Table 5: Best Performance on T&D Loss Reduction since 2002-03 to 2005-06.
S. No
States Best Performance in Recent Years (T&D Loss Reduction)
1 Andhra Pradesh 2% in 2003-04; Reduction from 21% to 19%
2 Tamil Nadu 0%, same level of 18% since 2002
3 Haryana 2% in 2003-04, Reduction from 35% to 33%
4 Jammu & Kashmir 1% in 2004-05, Reduction from 48% to 47%
PSEB ARR Petition FY 08-09
Page 14 of 83
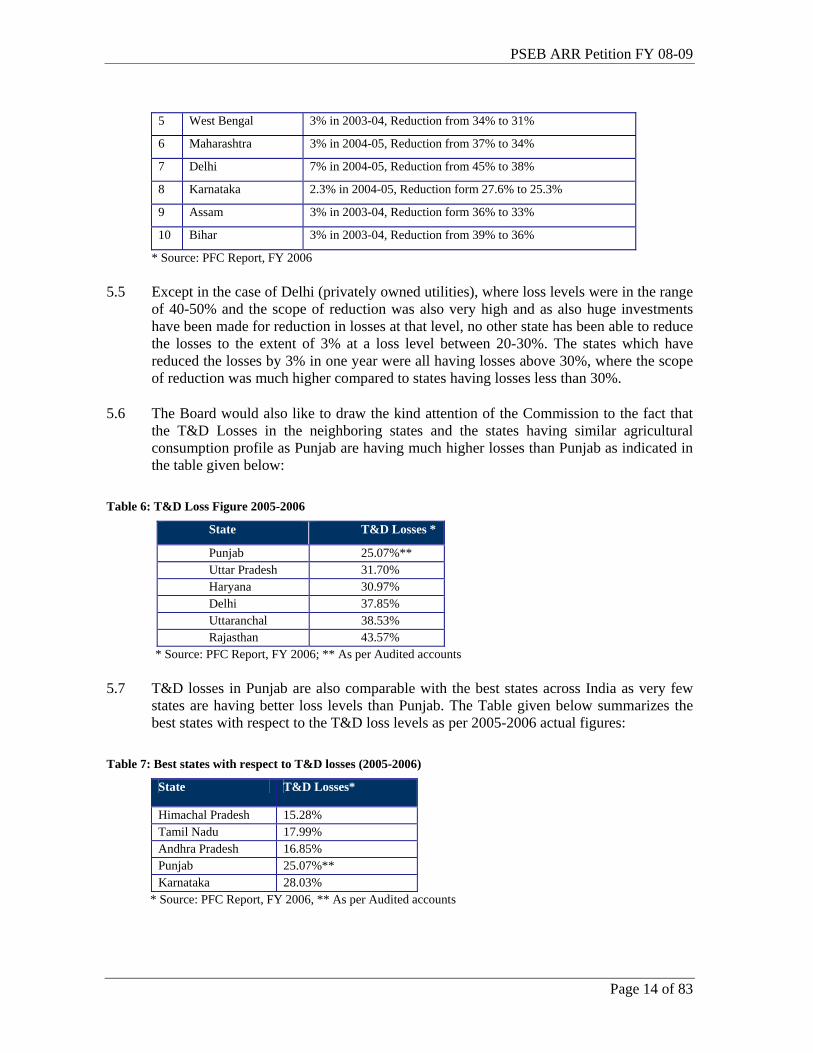
5 West Bengal 3% in 2003-04, Reduction from 34% to 31%
6 Maharashtra 3% in 2004-05, Reduction from 37% to 34%
7 Delhi 7% in 2004-05, Reduction from 45% to 38%
8 Karnataka 2.3% in 2004-05, Reduction form 27.6% to 25.3%
9 Assam 3% in 2003-04, Reduction form 36% to 33%
10 Bihar 3% in 2003-04, Reduction from 39% to 36%
* Source: PFC Report, FY 2006
5.5 Except in the case of Delhi (privately owned utilities), where loss levels were in the range of 40-50% and the scope of reduction was also very high and as also huge investments have been made for reduction in losses at that level, no other state has been able to reduce the losses to the extent of 3% at a loss level between 20-30%. The states which have reduced the losses by 3% in one year were all having losses above 30%, where the scope of reduction was much higher compared to states having losses less than 30%.
5.6 The Board would also like to draw the kind attention of the Commission to the fact that the T&D Losses in the neighboring states and the states having similar agricultural consumption profile as Punjab are having much higher losses than Punjab as indicated in the table given below:
Table 6: T&D Loss Figure 2005-2006
State T&D Losses *
Punjab 25.07%** Uttar Pradesh 31.70% Haryana 30.97% Delhi 37.85% Uttaranchal 38.53% Rajasthan 43.57%
* Source: PFC Report, FY 2006; ** As per Audited accounts
5.7 T&D losses in Punjab are also comparable with the best states across India as very few states are having better loss levels than Punjab. The Table given below summarizes the best states with respect to the T&D loss levels as per 2005-2006 actual figures:
Table 7: Best states with respect to T&D losses (2005-2006)
State T&D Losses*
Himachal Pradesh 15.28% Tamil Nadu 17.99% Andhra Pradesh 16.85% Punjab 25.07%** Karnataka 28.03%
* Source: PFC Report, FY 2006, ** As per Audited accounts
PSEB ARR Petition FY 08-09
Page 15 of 83
Loss Reduction Issues in Punjab
5.8 The Board submits that the targets for loss reduction set by the Hon’ble Commission in the past years had been ambitious and the Board has not been able to achieve the same. The Board has been penalized more than once for underachievement in a year. It is most respectfully submitted that the Hon’ble Commission may revisit the setting of T&D losses considering the actual Loss level prevalent and provide for loss reduction percentage on more reasonable manner to avoid the cascading effect of the past.
5.9 The Board is also constrained in its efforts to achieve the T&D loss reduction levels due to financial constraints and non-availability of funds on account of disallowance of expenses under various heads by the Commission in the past years.
5.10 The Board has accordingly underlined the issues in reduction of T&D loss levels and the Board’s plans for reduction of T&D losses over the next five years in this section. The Board hereby requests the Commission to consider the same in finalising the target T&D Loss level for FY 2008-09.
5.11 The analysis on the trends in AP consumption and the T&D losses in detail in the past has resulted in deduction that there is a strong positive correlation between the AP Consumption and T&D Losses. The T&D losses tend to increase during the Kharif period in comparison to the off-season. It is pertinent to mention that more than 90% of the agriculture consumption is unmetered and restricting the AP consumption as well as the losses pertaining to the agriculture category is not entirely controllable for the Board.
5.12 Despite the fact that the AP Consumption has been on a rise in the State, the Board has been able to reduce the T&D loss to 23.91% during FY 2006-07, a reduction of 1.16% over the actual figures of 25.07% of FY 2005-06 (though the specified target was 20.75% fixed by the Commission).
5.13 The Board submits that considering the current loss levels in the State and the energy mix of metered to unmetered agriculture category, reduction of losses by a reasonable level requires concrete measures and investments, for which the Board has developed a detailed road map and has already initiated action on the same.
Investment Requirements
5.14 The reduction in loss levels is also directly proportional to investments put in the system. The amount of investments required would increase exponentially when the loss levels become lower and lower. It is important to note that loss reduction of 2% or more requires huge investments especially when the losses are in the range of 25% and below.
5.15 The Board has drawn up an investment plan in line with the NTP targets of reduction of T&D loss levels to 15% by 2012. However considering the historical cycle times for financial tie-ups and the constraints the Board faced in executing the projects, the Board is currently proposing a plan of reduction of T&D losses to target levels of 17% by 2012. It is submitted that such reduction in losses is much better than what the Utilities in many other States have achieved and have proposed to achieved.
PSEB ARR Petition FY 08-09
Page 16 of 83
5.16 To achieve such significant loss reduction requires extensive capital investment in strengthening network, process reviews and redesign, organisational restructuring and manpower deployment, training, implementing IT solutions, etc. The results of which will accrue gradually to PSEB.
5.17 The investment plan prepared by the Board includes for such schemes and the plan’s total outlay is Rs. 5000 Cr over the next five years. The cost estimates for the plan have been prepared based on costs prevailing during the financial year 2006-07, the figures would undergo a change once the cots estimates are prepared based on current rates.
Status of Implementation of T&D Road Map
5.18 The Board has prepared a road map for undertaking/executing the activities/works related to T&D loss reduction to bring down losses to around 17% by FY 2011-12. The detail of the road map has already been submitted to the Commission in the previous ARR for FY 2007-08. The same has again been attached in Volume II.
5.19 The salient features of the road map are as given below:
(a) HVDS in AP - already started giving new connection on HVDS.
(b) LT less or less LT system in industrial and general service connections
(c) Providing meters outside the consumer premises
(d) Earthing of the Grid Substations and Distribution Transformers
(e) Providing capacitors at all Agricultural supply consumers and on the 11kV lines also
(f) Introduction of IT in distribution services to bring about transparency & to minimize employee intervention
5.20 The Board had submitted 46 schemes to REC for availing loan for HVDS in AP with a total outlay of Rs. 2387 Cr. REC has approved all the 46 schemes. Out of the 46 schemes approved, the Board has already initiated the work order for 6 schemes amounting to Rs. 571 Cr for conversion of 81253 AP tubewells to HVDS in the first phase.
5.21 The Expression of interest for conversion of 443603 AP connections to HVDS has been issued for which pre-bid conference has already been held on 21.12.2007. The DPRs for the conversion of remaining 426668 AP connections being fed from 3 phase 4 wire feeders are being prepared. Such DPRs of 6 no. distribution circles out of 19 distribution circles stand already submitted to REC panchkula.
5.22 The Board is taking initiative to segregate technical and commercial losses as per the methodology approved by CEA. It is also in the process of formulating a strategy for zone-wise T&D loss reduction.
PSEB ARR Petition FY 08-09
Page 17 of 83
5.23 New Medium Supply Industrial Connections having connected load above 50 KW are being released by providing independent 63/100/200 KVA Transformers. The connections between 21 to 50 KW are also being released by providing independent Transformers with zero LT but with metering on LT side.
5.24 For implementing HVDS in DS/NRS connections, transformers spared from AP under HVDS are being installed in posh/planned colonies to cater to a cluster of 4/5 to 8/10 houses depending on load and meters are being installed in pillar boxes/MCBs. Similar strategy for planned shopping centres/malls in case of NRS connections is being adopted.
Other Initiatives taken to reduce T&D losses
5.25 The Board has taken a number of steps / measures to reduce T&D losses. Some of the major steps are as follows:
Installation of Meters outside Premises
5.26 Under the T&D loss reduction roadmap Board has started shifting energy meter outside the premises of the consumers by installing these outside in “Meter Pillar Boxes” or in standard Meter cups Board on the outer walls of the consumer Premises/poles. The outcome of this exercise has been encouraging. Some of the positive results of this exercise are
(a) Decrease in Input units
(b) Increase in Units billed & consequent increase in revenue
(c) Decrease in Overall demand of the feeder
(d) Decrease in T&D losses
(e) Improvement in quality of supply due to decrease in load on the system
(f) Improvement in voltage profile
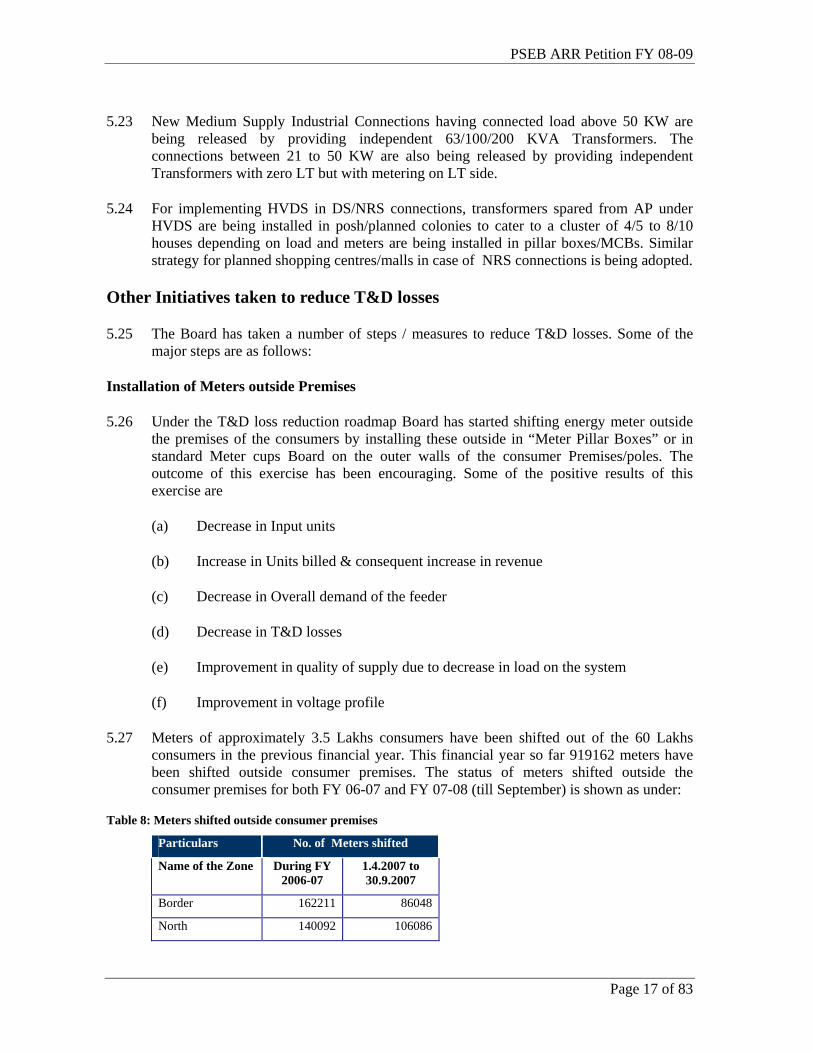
5.27 Meters of approximately 3.5 Lakhs consumers have been shifted out of the 60 Lakhs consumers in the previous financial year. This financial year so far 919162 meters have been shifted outside consumer premises. The status of meters shifted outside the consumer premises for both FY 06-07 and FY 07-08 (till September) is shown as under:
Table 8: Meters shifted outside consumer premises
Particulars No. of Meters shifted
Name of the Zone During FY 2006-07
1.4.2007 to 30.9.2007
Border 162211 86048
North 140092 106086
PSEB ARR Petition FY 08-09
Page 18 of 83
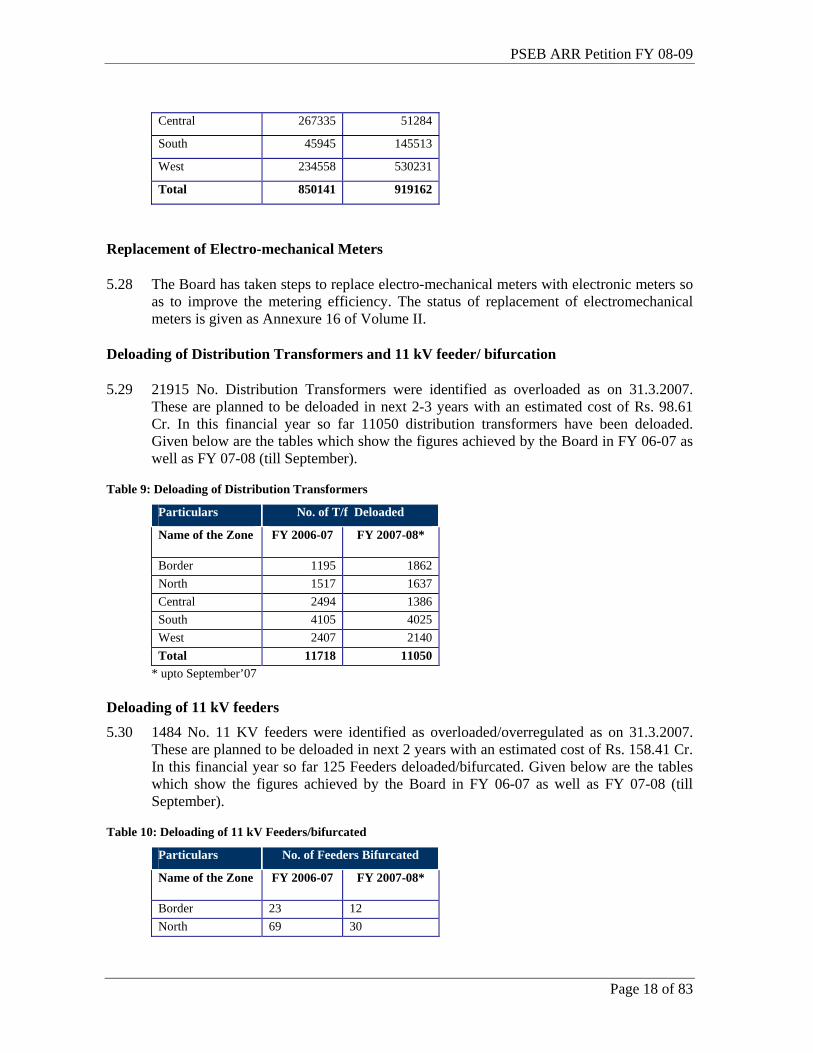
Central 267335 51284
South 45945 145513
West 234558 530231
Total 850141 919162
Replacement of Electro-mechanical Meters
5.28 The Board has taken steps to replace electro-mechanical meters with electronic meters so as to improve the metering efficiency. The status of replacement of electromechanical meters is given as Annexure 16 of Volume II.
Deloading of Distribution Transformers and 11 kV feeder/ bifurcation
5.29 21915 No. Distribution Transformers were identified as overloaded as on 31.3.2007. These are planned to be deloaded in next 2-3 years with an estimated cost of Rs. 98.61 Cr. In this financial year so far 11050 distribution transformers have been deloaded. Given below are the tables which show the figures achieved by the Board in FY 06-07 as well as FY 07-08 (till September).
Table 9: Deloading of Distribution Transformers
Particulars No. of T/f Deloaded
Name of the Zone FY 2006-07 FY 2007-08*
Border 1195 1862 North 1517 1637 Central 2494 1386 South 4105 4025 West 2407 2140 Total 11718 11050
* upto September’07
Deloading of 11 kV feeders
5.30 1484 No. 11 KV feeders were identified as overloaded/overregulated as on 31.3.2007. These are planned to be deloaded in next 2 years with an estimated cost of Rs. 158.41 Cr. In this financial year so far 125 Feeders deloaded/bifurcated. Given below are the tables which show the figures achieved by the Board in FY 06-07 as well as FY 07-08 (till September).
Table 10: Deloading of 11 kV Feeders/bifurcated
Particulars No. of Feeders Bifurcated
Name of the Zone FY 2006-07 FY 2007-08*
Border 23 12 North 69 30
PSEB ARR Petition FY 08-09
Page 19 of 83
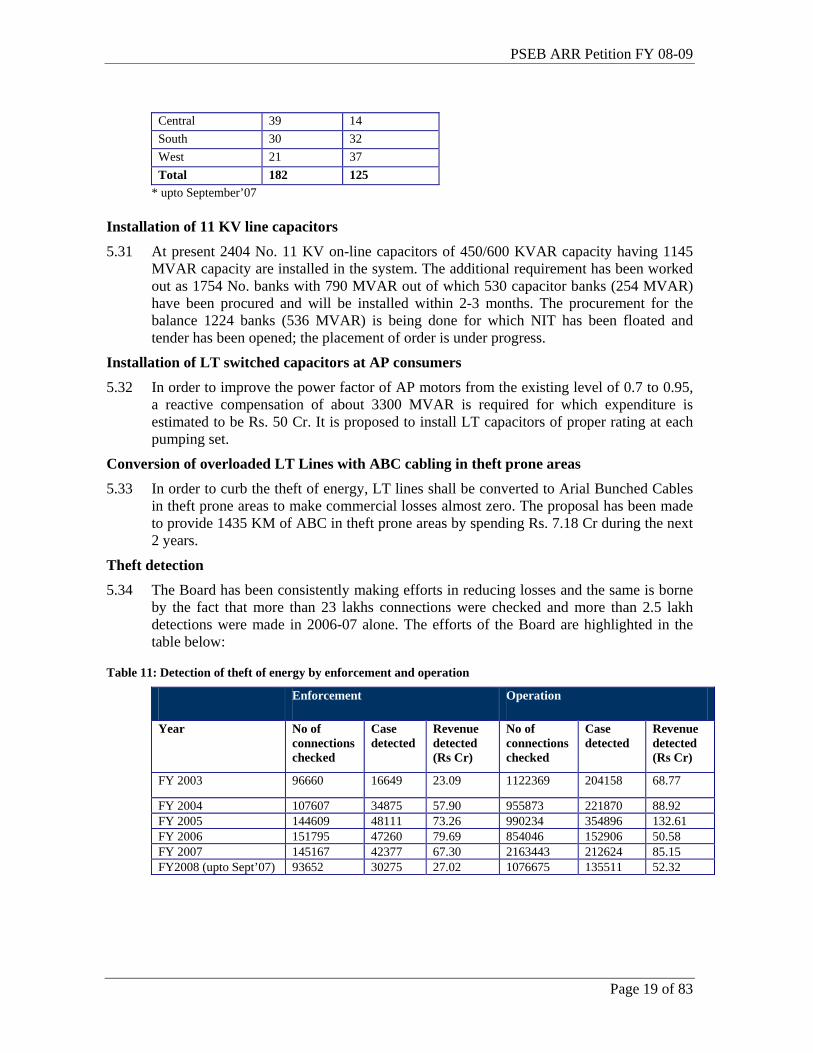
Central 39 14 South 30 32 West 21 37 Total 182 125
* upto September’07
Installation of 11 KV line capacitors
5.31 At present 2404 No. 11 KV on-line capacitors of 450/600 KVAR capacity having 1145 MVAR capacity are installed in the system. The additional requirement has been worked out as 1754 No. banks with 790 MVAR out of which 530 capacitor banks (254 MVAR) have been procured and will be installed within 2-3 months. The procurement for the balance 1224 banks (536 MVAR) is being done for which NIT has been floated and tender has been opened; the placement of order is under progress.
Installation of LT switched capacitors at AP consumers
5.32 In order to improve the power factor of AP motors from the existing level of 0.7 to 0.95, a reactive compensation of about 3300 MVAR is required for which expenditure is estimated to be Rs. 50 Cr. It is proposed to install LT capacitors of proper rating at each pumping set.
Conversion of overloaded LT Lines with ABC cabling in theft prone areas
5.33 In order to curb the theft of energy, LT lines shall be converted to Arial Bunched Cables in theft prone areas to make commercial losses almost zero. The proposal has been made to provide 1435 KM of ABC in theft prone areas by spending Rs. 7.18 Cr during the next 2 years.
Theft detection
5.34 The Board has been consistently making efforts in reducing losses and the same is borne by the fact that more than 23 lakhs connections were checked and more than 2.5 lakh detections were made in 2006-07 alone. The efforts of the Board are highlighted in the table below:
Table 11: Detection of theft of energy by enforcement and operation
Enforcement Operation
Year No of connections checked
Case detected
Revenue detected (Rs Cr)
No of connections checked
Case detected
Revenue detected (Rs Cr)
FY 2003 96660 16649 23.09 1122369 204158 68.77
FY 2004 107607 34875 57.90 955873 221870 88.92 FY 2005 144609 48111 73.26 990234 354896 132.61 FY 2006 151795 47260 79.69 854046 152906 50.58 FY 2007 145167 42377 67.30 2163443 212624 85.15 FY2008 (upto Sept’07) 93652 30275 27.02 1076675 135511 52.32
PSEB ARR Petition FY 08-09
Page 20 of 83
Setting of T&D Loss Reduction Target - Methodology
5.35 The Board wants to reiterate the principles espoused by the National Tariff Policy of accepting the loss levels at actual instead of sticking to a projected trajectory made earlier without a commensurate investment or business plan.
5.36 The Board has been continuously penalised over the past period because the T&D loss reduction trajectory which has been adopted is stringent and unrealistic. The Board submits that it is not prudent to stick to a norm when the utility is not able to achieve the same.
5.37 The Board submits that a proper rational should be considered while fixing the targets for loss reduction. In this context the Board would like to submit the relevant extracts from the Abraham Committee report and the Boards observations on the same.
Recommendations of the Abraham Committee on loss reduction targets
5.38 The Task force of the Abraham Committee constituted under the Ministry of Power issued a report on Restructuring of APDRP in October, 2006. The Task Force recommended the following targets for reduction in AT&C losses by the Utilities:
(a) Utilities having AT&C losses above 40%: Reduction by 4% per year;
(b) Utilities having AT&C losses between 30 & 40%: Reduction by 3% per year;
(c) Utilities having AT&C losses between 20 & 30%: Reduction by 2% per year;
(d) Utilities having AT&C losses below 20%: Reduction by 1% per year.
5.39 The above target classification throws light on the practicality of the loss reduction at various levels of AT&C Losses. The Task force recommendations clearly suggest that as the loss level of a utility reduces, the extent of achieving further loss reduction also reduces.
5.40 It is pertinent to note that many State Regulatory Commissions are following the recommendations of the Abraham Committee and setting the loss reduction targets on the basis of the existing loss level range of the utilities. The Board requests the Hon’ble Commission to adopt the same process as adopted by the other State Commissions.
Resetting of T&D Loss level on Under-achievement/Overachievement
5.41 It is pertinent to mention that the Commission has been setting the T&D loss reduction targets for the ensuing years on the basis of a loss level trajectory set by the Commission (in Tariff Order 2004-05) instead of the actual targets achieved by the Board at the end of the year.
PSEB ARR Petition FY 08-09
Page 21 of 83
5.42 The Board would like to draw the attention of the Commission that many State Regulatory Commissions’ like Haryana, J&K, Rajasthan etc have been using the method of resetting the loss level targets on the basis of actual losses achieved at the end of the year. This implies that in case the utility is not able to achieve the losses as per the Loss level targets set by the Commission, the differential value on account of under-achievement/over-achievement of losses is adjusted in the ARR, as is the case in Punjab, but the targets are then revised based on the existing T&D loss levels.
5.43 Similar methodology may be considered by Hon’ble Commission while setting the T&D losses level for subsequent years rather than penalising the Board twice by way of making reduction in the ARR on one hand for under achieving T&D loss levels in the current year and on the other hand fixing the targets for the ensuing year on a trajectory which has not been achieved.
5.44 Alternatively, the Board proposes to the Commission that it may set the T&D targets for the next 5 years, as per the trajectory and investments proposed by the Board, and the performance of the Board should be measured at the end of the five year term. The loss levels for the next five year term should be reset based on the actual losses attained by the Board at the end of the five year term.
Proposal for T&D Loss Reduction Targets for ensuing years
5.45 Based on the recommendation of the Abraham committee and considering the current level of T&D losses of PSEB (which is almost same as the AT&C losses), the Loss reduction levels need to be set at around 1.5%-2% per year for the initial 2 years and thereafter since the loss levels fall under 20%, the reduction should be around 1% per year.
5.46 PSEB has estimated a T&D loss of 22.70% for the FY 07-08 based on the actual loss levels recorded for the first six months. Keeping in view the above understanding from the Abraham Committee findings, the Board proposes T&D loss target for FY 08-09 at 21%, a reduction of 2.91% over FY 06-07.
Table 12: T&D loss Projection for FY 08-09
5.47 Apart from the above, keeping in view that the five year trajectory given by Board is required to be re-visited in FY 2008-09, the Board also proposes the T&D loss targets for the ensuing years upto FY 2011-12, as under
Table 13: T&D loss reduction trajectory upto FY 11-12
Particulars FY 06-07 ( Actual )
FY 07-08 (RE)
FY 08-09 (Proj.)
Reduction From FY 06- 07
T&D Losses 23.91% 22.70% 21.00% 2.91%
Particulars FY 07-08 (RE)
FY 08-09 (Proj.)
FY 09-10 FY 10-11 FY 11-12
T&D Losses 22.70% 21.00% 19.50% 18% 17%
PSEB ARR Petition FY 08-09
Page 22 of 83
5.48 As already stated earlier, reduction of T&D losses requires appropriate investments in both technical as well as commercial arena. The Board requests the Commission to approve the T&D Loss reduction Road Map as submitted by the Board and amended from time to time as per the prevailing market rates. The Board further requests that in case the Board is not able to make required investments for T&D loss reduction due to financial constraints or other uncontrollable factors, the T&D loss targets for that year should be modified accordingly.
A6: ENERGY REQUIREMENT
6.1 Based on the demand projections and T&D loss reduction targets, the following is the energy requirement of the state.
Table 14: Energy Requirement (MU)
FY’07 (Actual)
FY’08 (RE)
FY’09 (Projected)
% Growth (FY 07-08)
ENERGY REQUIREMENT Energy sales to metered category within the State
18381.96 20,085 20,963 9.3%
Energy sales to AP 8235.09 9,537 10,014 15.8% Total sales within the State 26617.05 29,622 30,977 11.3% Sales to common pool consumers 302.06 303 303 0.2% Sales outside state (RSD and Shanan share not included for FY07-08, 08-09)
977.11 1,615 2,036 65.3%
Sales to electricity traders Sales to other distribution licensees Total sales 27896.22 31,540 33,315 13.1% T&D losses % 23.92% 22.70% 21% MU 8367.09 8,699 8,234 Total energy requirement 36263.31 40,239 41,550 11.0%
PSEB ARR Petition FY 08-09
Page 23 of 83
A7: ENERGY AVAILABILITY
7.1 The majority of energy requirement of the state is met by generation at state’s own generating stations, share from BBMB, banking with other states and state’s share from central generating stations. The balance power purchase requirement is met through other external sources i.e. from traders, UI etc. The state generating stations comprises of three thermal stations, including the two units of 250 MW, GHTP Stage-II, of which one unit is expected to be Commissioned in Feb’08 (Unit-III) and the second unit in June’08 (Unit-IV), 5 hydel stations and micro- hydel projects. The basis and projections for FY 08-09 & FY 07-08(RE) from each of the sources is summarized below.
State Generating Stations- Thermal Generation
7.2 The generation (MU) of Thermal stations of PSEB, namely, GNDTP, Bhatinda, GGSSTP, Ropar and GHTP, Lehra Mohabbat is based on the following parameters:
(a) Gross Generation
(b) Plant Availability
(c) Plant Load Factor
(d) Auxiliary Consumption
7.3 The projected figure of the generation parameters for FY 08-09, the revised estimate for FY 07-08 and the actuals for FY 06-07 is discussed in detail as under.
Gross Generation
7.4 The Gross Generation and performance under other parameters for GNDTP, GGSSTP, GHTP Stage-I(Unit-I&II) and GHTP Stage-II(Unit-III&IV) plants for FY 07-08 has been re-estimated as per the actual generation of the respective plants upto Sept’07 and considering the revised monthly generation targets set for the respective plants for the second half of the FY 07-08(Oct’07- Mar’08).
7.5 The Gross generation of the three thermal plants i.e. GNDTP, GGSSTP and GHTP stage-I ( Unit I&II), has been projected for FY 08-09 on the basis of the past three year’s (FY’05, FY’06, FY’07 ) average generation of each plant, the corresponding three year’s average plant availability and the plant availability projected for FY 08-09.
7.6 The Gross generation of GHTP Stage–II (Unit III&IV) for FY 08-09 has been projected based on the respective units Commissioning schedule.
PSEB ARR Petition FY 08-09
Page 24 of 83
Plant Availability
7.7 Plant availability of GNDTP, Bhatinda is projected at 90.10% in FY 07-08, estimated on the basis of the actual plant availability figures achieved up to Sept’07 and the planned maintenance schedule from Oct’07 till Mar’08, also taking into consideration the forced outage of the plant’s units (average of last three year). The Projection of plant availability for FY 08-09 is expected to be 71.75% in view of the renovation & modernization work of Unit-4 which is planned for 274 days beginning 1st of July 2008 till 31st of March 2009, and taking into account the past trend of forced outage of the plant’s units.
7.8 The projected Plant availability of GNDTP for FY 08-09 is lower than the CERC norms due to major R&M required for Unit-III & Unit-IV. It is submitted that all the units of the thermal plant are over 25 years old (installed during 1975-79) and Unit–IV will be undergoing major repair & maintenance starting from 1st July 2008.
7.9 Revised Plant Availability of GGSSTP is estimated at 90.20% for FY 07-08 as per the actual plant availability figures attained till Sept’07 and the planned maintenance schedule of Units from Oct’07 till Mar’08. For FY 08-09 the plant availability is projected at 90.11% based on the Planned Maintenance Schedule of the generating station for FY 08-09 of 130 days and also taking into account the last three years (excluding current year) average of forced outage duration of plant. In case of GGSSTP plant availability is much higher than the CERC norm of 80% for thermal generating stations for the recovery of full fixed cost.
7.10 Availability of GHTP Stage-I, for FY 07-08 is re-estimated at 91.37% based on the actual availability till Sept’07, and taking into account the planned maintenance on the Units for the second half of FY 07-08. The plant availability for FY 08-09 is projected at 92.03% on the basis of the planned maintenance schedule of Unit-I & Unit-II and past trends in the forced outage duration of the plant’s units.
7.11 GHTP Stage-II, Unit-III of 250MW unit is expected to be commissioned by Feb’08, plant availability of 65% is projected for FY 07-08. For FY 08-09 plant availability of 85% is projected as another unit, Unit-IV of 250MW is expected to be commissioned by June’08 after considering the stabilization period of both the units.
Plant Load Factor
7.12 The Plant Load Factor of GNDTP is expected to be 74.84% in the current year, based on the actual generation figures attained for the first six months till Sept’07 and the revised target generation level for second half of FY 07-08. It needs to be noted that despite of the age of these stations, PSEB has been able to sustain generation at these levels from GNDTP through pro-active, consistent and regular maintenance and by taking- up timely renovation & overhaul of its units. The PLF for FY 08-09 is estimated at 62.55% based on the projection of the generation.
7.13 The Plant Load Factor of GGSSTP for the current year is re-estimated at 84.77% as per the actual generation till Sept’07 and the revised monthly target generation level for Oct’07 till Mar’08. The PLF for FY 08-09 is projected at 85.79%.
PSEB ARR Petition FY 08-09
Page 25 of 83
7.14 The Plant Load Factor for GHTP, Stage-I comprising of Unit-I & Unit-II for the current year is expected to be at 88.82% based on the actuals till Sept’07 and the revised monthly target generation figures for second half of FY 07-08. PLF projected for FY 08-09 is 88.74% as per the generation projections of the Generating Station.
7.15 Plant load factor for GHTP, Stage-II comprising of Unit-III & Unit-IV is projected at 42% for FY 07-08, on the basis that Unit-III will be commissioned by Feb’08. For FY 08-09, PLF is projected at 70%, considering Unit-IV would be commissioned by June’08.
7.16 Considering the above facts, PSEB submits to the Commission to approve the projected generation figures submitted herein as well as consider the provision of generation incentive for generation above 80% PLF (in case of GGSSTP & GHTP) for FY 2007-08 and FY 2008-09 in accordance with the CERC norms.
7.17 Actual PLF figures attained by the three Thermal stations for FY 2006-07 have also been provided.
Auxiliary Consumption
7.18 Auxiliary Consumption of GNDTP, GGSSTP and GHTP Stage-I (Unit-I&II) for FY 07-08 are re-estimated at 11.63%, 8.58% and 9.0% respectively on the basis of the actual generation data available from the respective stations uptill Sept’07 for GNDTP,GGSSTP and GHTP Stage-I. In case of GNDTP auxiliary consumption estimated is higher due to the Commissioning of Unit–II after undergoing repair and maintenance, and the consequent stabilization for operating the Unit.
7.19 Auxiliary consumption projected for FY 08-09 for GGSSTP, GHTP Stage-I and GNDTP has been estimated at 8.6%, 9.0% and 11.0% respectively.
7.20 For GHTP Stage-II (Unit III&IV) auxiliary consumption has been projected at 9.5% for FY 07-08 & FY 08-09, in accordance with the CERC norms for auxiliary consumption of thermal plants with cooling towers during the stabilization period.
7.21 PSEB submits to the Commission to consider the fact that even though the Auxiliary Consumption of PSEB stations are almost same as the CERC norms,
(a) It is much lower than the CERC norms for similarly aged Tanda and Talcher stations.
(b) For GGSSTP Ropar, the auxiliary consumption is slightly higher than norms. The reason for this is that as per design parameters for 210MW units, 4 coal mills are required to run the plant at full load capacity. But in case of Ropar, due to higher ash content i.e. at more than 40%, 5 mills are required to be run. Thus the total auxiliary consumption increases.
(c) Since auxiliary consumption is specific to a particular plant depending on the kind of the auxiliary equipments installed at the plant and the percentage of auxiliary
PSEB ARR Petition FY 08-09
Page 26 of 83
consumption varies depending on the total generation. Nothing much can be done to reduce the auxiliary consumption without major Renovation & Modernization.
7.22 Considering the above aspects, PSEB submits to the Commission not to disallow any part of the Auxiliary Consumption levels estimated by PSEB for all the thermal generating stations.
7.23 Auxiliary power consumption figures as attained by the generating stations for FY 06-07 have been provided for the True-up.
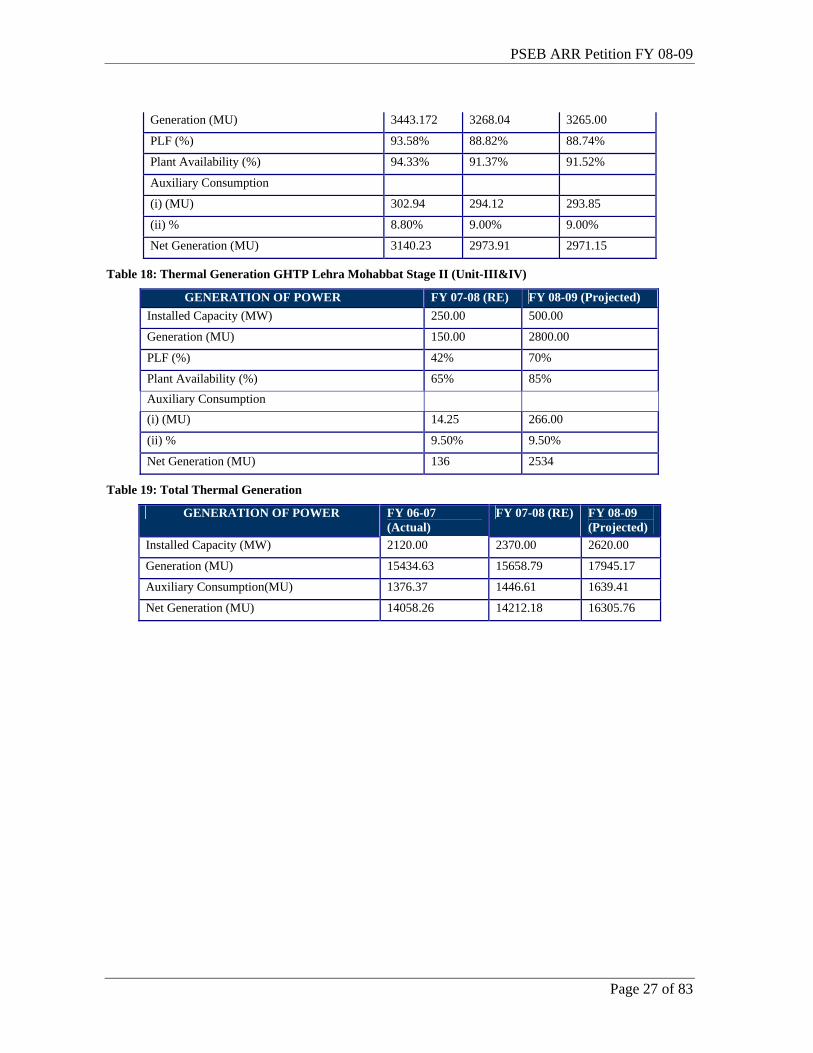
Details of Generation
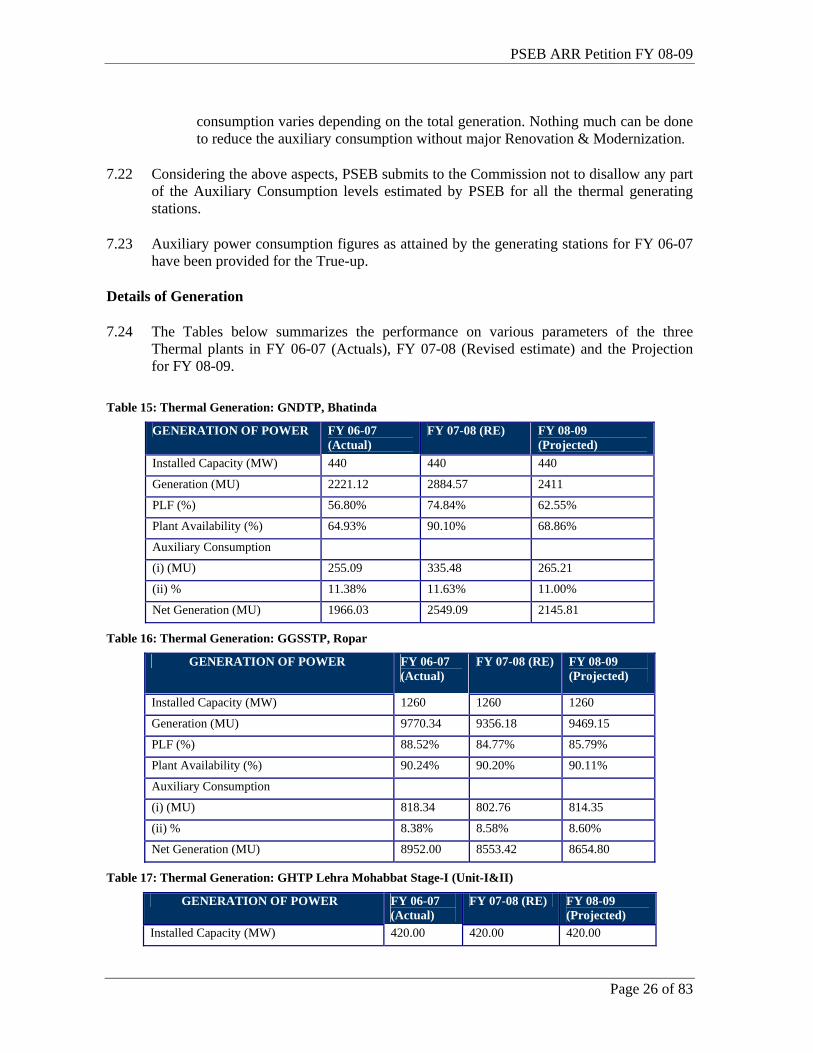
7.24 The Tables below summarizes the performance on various parameters of the three Thermal plants in FY 06-07 (Actuals), FY 07-08 (Revised estimate) and the Projection for FY 08-09.
Table 15: Thermal Generation: GNDTP, Bhatinda
GENERATION OF POWER FY 06-07 (Actual)
FY 07-08 (RE) FY 08-09 (Projected)
Installed Capacity (MW) 440 440 440
Generation (MU) 2221.12 2884.57 2411
PLF (%) 56.80% 74.84% 62.55%
Plant Availability (%) 64.93% 90.10% 68.86%
Auxiliary Consumption
(i) (MU) 255.09 335.48 265.21
(ii) % 11.38% 11.63% 11.00%
Net Generation (MU) 1966.03 2549.09 2145.81
Table 16: Thermal Generation: GGSSTP, Ropar
GENERATION OF POWER FY 06-07 (Actual)
FY 07-08 (RE) FY 08-09 (Projected)
Installed Capacity (MW) 1260 1260 1260
Generation (MU) 9770.34 9356.18 9469.15
PLF (%) 88.52% 84.77% 85.79%
Plant Availability (%) 90.24% 90.20% 90.11%
Auxiliary Consumption
(i) (MU) 818.34 802.76 814.35
(ii) % 8.38% 8.58% 8.60%
Net Generation (MU) 8952.00 8553.42 8654.80
Table 17: Thermal Generation: GHTP Lehra Mohabbat Stage-I (Unit-I&II)
GENERATION OF POWER FY 06-07 (Actual)
FY 07-08 (RE) FY 08-09 (Projected)
Installed Capacity (MW) 420.00 420.00 420.00
PSEB ARR Petition FY 08-09
Page 27 of 83
Generation (MU) 3443.172 3268.04 3265.00
PLF (%) 93.58% 88.82% 88.74%
Plant Availability (%) 94.33% 91.37% 91.52%
Auxiliary Consumption
(i) (MU) 302.94 294.12 293.85
(ii) % 8.80% 9.00% 9.00%
Net Generation (MU) 3140.23 2973.91 2971.15
Table 18: Thermal Generation GHTP Lehra Mohabbat Stage II (Unit-III&IV)
GENERATION OF POWER FY 07-08 (RE) FY 08-09 (Projected) Installed Capacity (MW) 250.00 500.00
Generation (MU) 150.00 2800.00
PLF (%) 42% 70%
Plant Availability (%) 65% 85% Auxiliary Consumption (i) (MU) 14.25 266.00
(ii) % 9.50% 9.50%
Net Generation (MU) 136 2534
Table 19: Total Thermal Generation
GENERATION OF POWER FY 06-07 (Actual)
FY 07-08 (RE) FY 08-09 (Projected)
Installed Capacity (MW) 2120.00 2370.00 2620.00
Generation (MU) 15434.63 15658.79 17945.17
Auxiliary Consumption(MU) 1376.37 1446.61 1639.41
Net Generation (MU) 14058.26 14212.18 16305.76
PSEB ARR Petition FY 08-09
Page 28 of 83
State Generating Stations- Hydel Generation
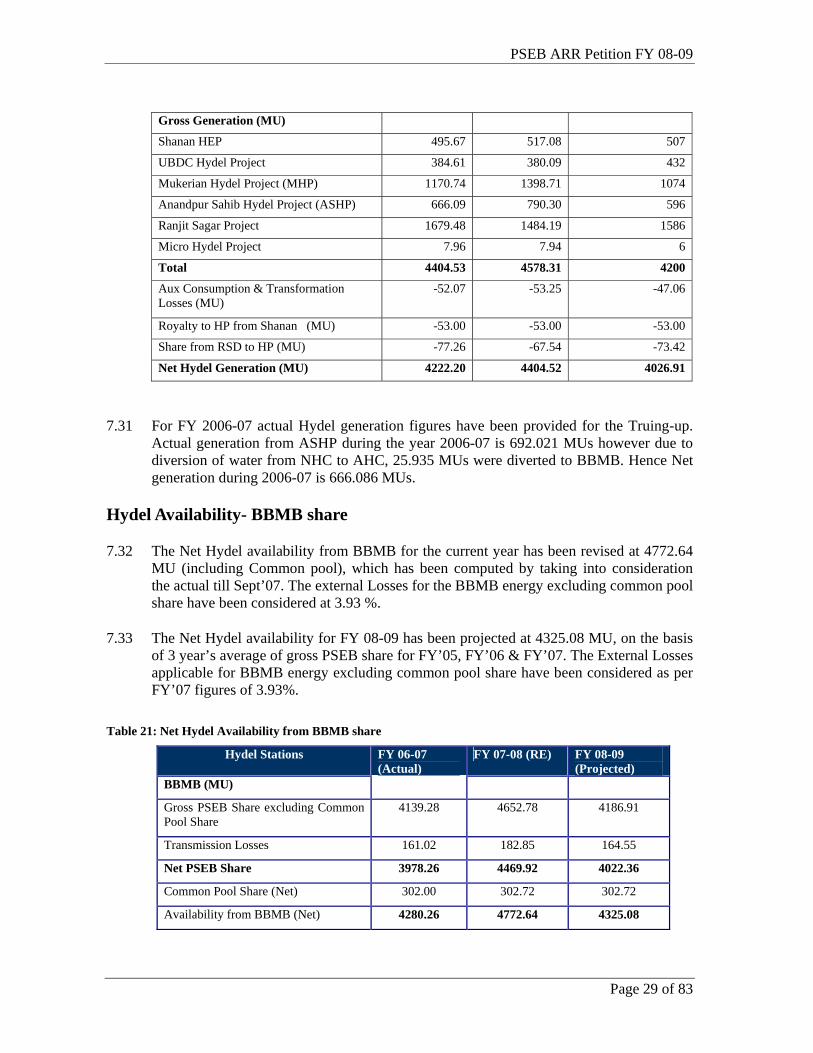
7.25 The revised Net Hydel Generation figures for FY 07-08 and the projections for FY 08-09 excludes 53MUs from the yearly generation of Shanan HEP on account of Royalty payable to the State of H.P. and it also excludes the unit share of H.P. @ 4.6% from the yearly generation of RSPP.
7.26 The Net Hydel availability for FY 07-08 has been revised to 4404.52 MU, on the basis of the actual generation figures available till Sept’07 and the revised monthly generation target figures set for the respective Hydel plants for the period Oct’07 till Mar’08.
7.27 The Net Hydel availability for FY 08-09 has been projected at 4026.91MU, based on the past three year’s average of gross generation for FY’05, FY’06 & FY’07 as shown in the table 25 below.
7.28 The Hydel plants auxiliary losses are also dependent upon the fact that the plant’s auxiliary systems have to be kept running even when the Hydel plants are not operating due to lack of required water level in the reservoirs/hydel channel. For FY 08-09, auxiliary consumption & transformation losses for the Hydel plants have been projected at 47.06MU and for FY 07-08(RE) these losses are projected at 53.25MU.
7.29 GT losses: In case of UBDC hydel project, GT losses are higher since GT transformers are very old and tender enquiry has already been floated for replacement of existing GT transformer. For Mukerian Hydel Project, GT losses are higher due to old GT transformers (1983), and the proposal will be made for replacement of existing transformers. GT losses for Shanan HEP are higher as the GT transformers are old and it is already proposed to be replaced with new GT Transformers as per R&M scheme approved for the replacement of the existing Transformers.
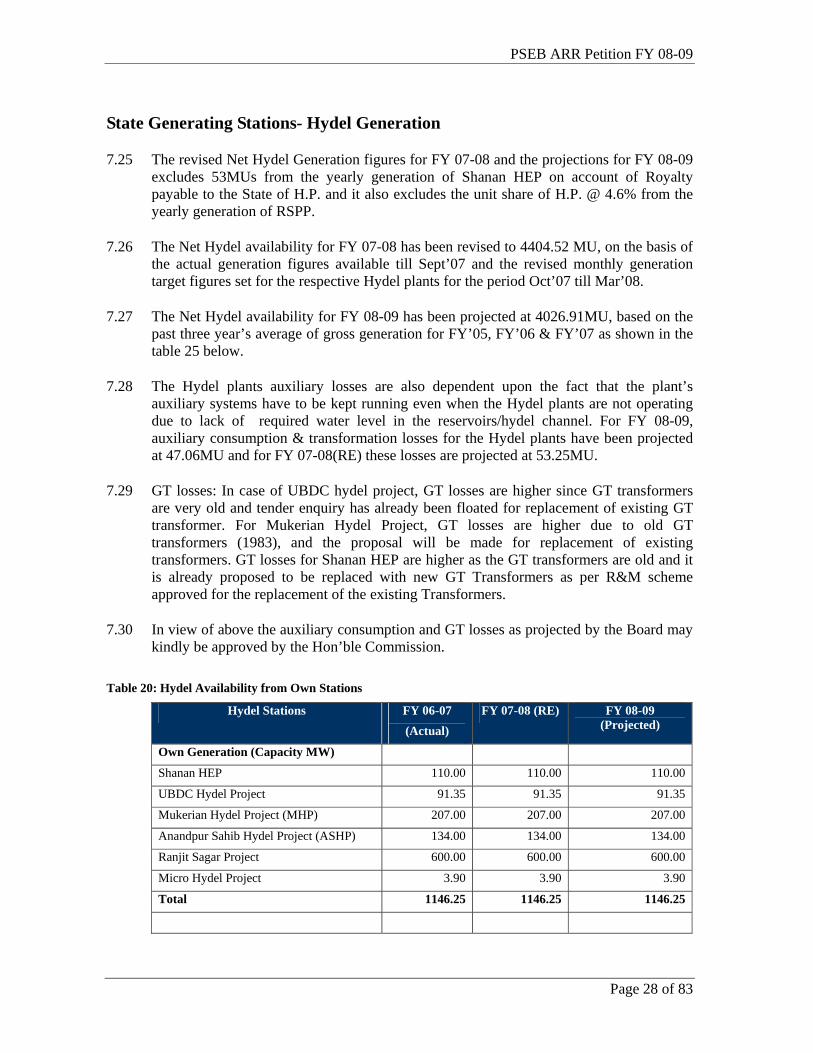
7.30 In view of above the auxiliary consumption and GT losses as projected by the Board may kindly be approved by the Hon’ble Commission.
Table 20: Hydel Availability from Own Stations
Hydel Stations FY 06-07 (Actual)
FY 07-08 (RE) FY 08-09 (Projected)
Own Generation (Capacity MW)
Shanan HEP 110.00 110.00 110.00
UBDC Hydel Project 91.35 91.35 91.35
Mukerian Hydel Project (MHP) 207.00 207.00 207.00
Anandpur Sahib Hydel Project (ASHP) 134.00 134.00 134.00
Ranjit Sagar Project 600.00 600.00 600.00
Micro Hydel Project 3.90 3.90 3.90
Total 1146.25 1146.25 1146.25
PSEB ARR Petition FY 08-09
Page 29 of 83
Gross Generation (MU)
Shanan HEP 495.67 517.08 507
UBDC Hydel Project 384.61 380.09 432
Mukerian Hydel Project (MHP) 1170.74 1398.71 1074
Anandpur Sahib Hydel Project (ASHP) 666.09 790.30 596
Ranjit Sagar Project 1679.48 1484.19 1586
Micro Hydel Project 7.96 7.94 6
Total 4404.53 4578.31 4200
Aux Consumption & Transformation Losses (MU)
-52.07 -53.25 -47.06
Royalty to HP from Shanan (MU) -53.00 -53.00 -53.00
Share from RSD to HP (MU) -77.26 -67.54 -73.42
Net Hydel Generation (MU) 4222.20 4404.52 4026.91
7.31 For FY 2006-07 actual Hydel generation figures have been provided for the Truing-up. Actual generation from ASHP during the year 2006-07 is 692.021 MUs however due to diversion of water from NHC to AHC, 25.935 MUs were diverted to BBMB. Hence Net generation during 2006-07 is 666.086 MUs.
Hydel Availability- BBMB share
7.32 The Net Hydel availability from BBMB for the current year has been revised at 4772.64 MU (including Common pool), which has been computed by taking into consideration the actual till Sept’07. The external Losses for the BBMB energy excluding common pool share have been considered at 3.93 %.
7.33 The Net Hydel availability for FY 08-09 has been projected at 4325.08 MU, on the basis of 3 year’s average of gross PSEB share for FY’05, FY’06 & FY’07. The External Losses applicable for BBMB energy excluding common pool share have been considered as per FY’07 figures of 3.93%.
Table 21: Net Hydel Availability from BBMB share
Hydel Stations FY 06-07 (Actual)
FY 07-08 (RE) FY 08-09 (Projected)
BBMB (MU)
Gross PSEB Share excluding Common Pool Share
4139.28 4652.78 4186.91
Transmission Losses 161.02 182.85 164.55
Net PSEB Share 3978.26 4469.92 4022.36
Common Pool Share (Net) 302.00 302.72 302.72
Availability from BBMB (Net) 4280.26 4772.64 4325.08
PSEB ARR Petition FY 08-09
Page 30 of 83
Power Purchase
7.34 The PSEB procures its power from the central generating stations and other external sources. The shortage in supply due to excess demand is met through the Power trading corporation and other trading sources.
7.35 The major sources from which power is procured by PSEB are:
(a) NTPC
(b) NHPC
(c) NPC
(d) Co-generation
(e) Banking arrangements
(f) Open-access Transactions
7.36 The details of power purchase upto Sep’07, PPA and power purchase bills have been attached in Volume II for the kind reference of the Commission.
Allocation of Share to Punjab
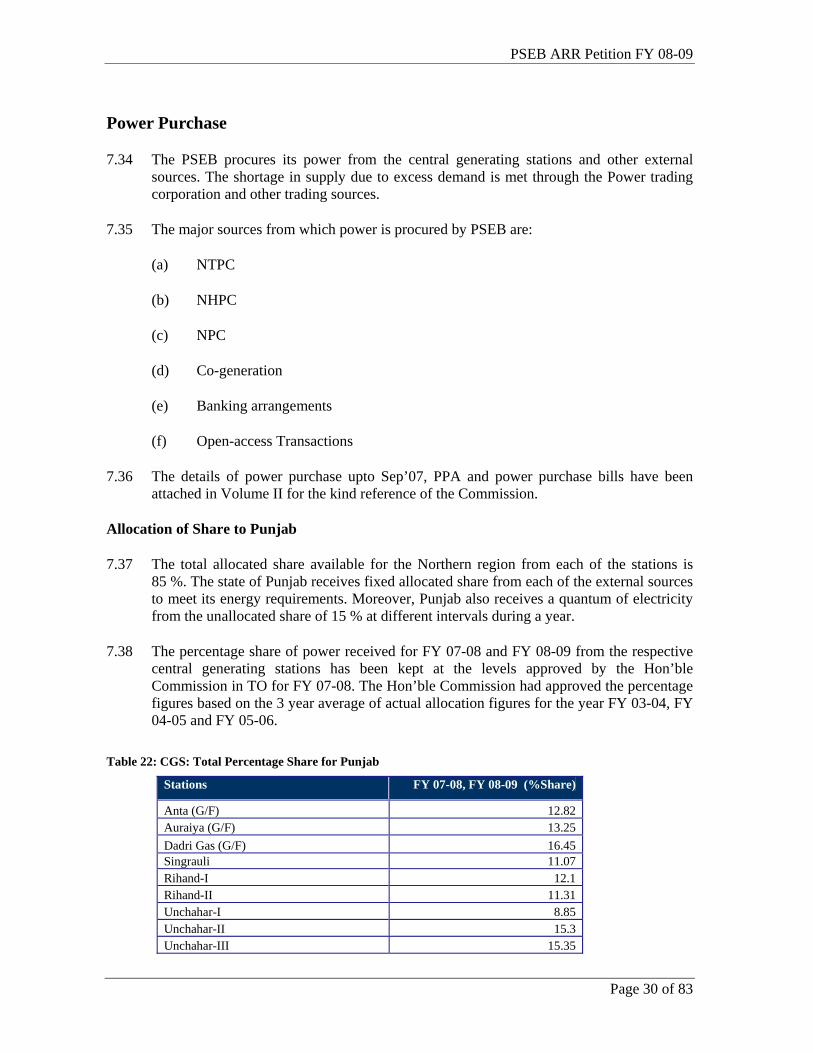
7.37 The total allocated share available for the Northern region from each of the stations is 85 %. The state of Punjab receives fixed allocated share from each of the external sources to meet its energy requirements. Moreover, Punjab also receives a quantum of electricity from the unallocated share of 15 % at different intervals during a year.
7.38 The percentage share of power received for FY 07-08 and FY 08-09 from the respective central generating stations has been kept at the levels approved by the Hon’ble Commission in TO for FY 07-08. The Hon’ble Commission had approved the percentage figures based on the 3 year average of actual allocation figures for the year FY 03-04, FY 04-05 and FY 05-06.
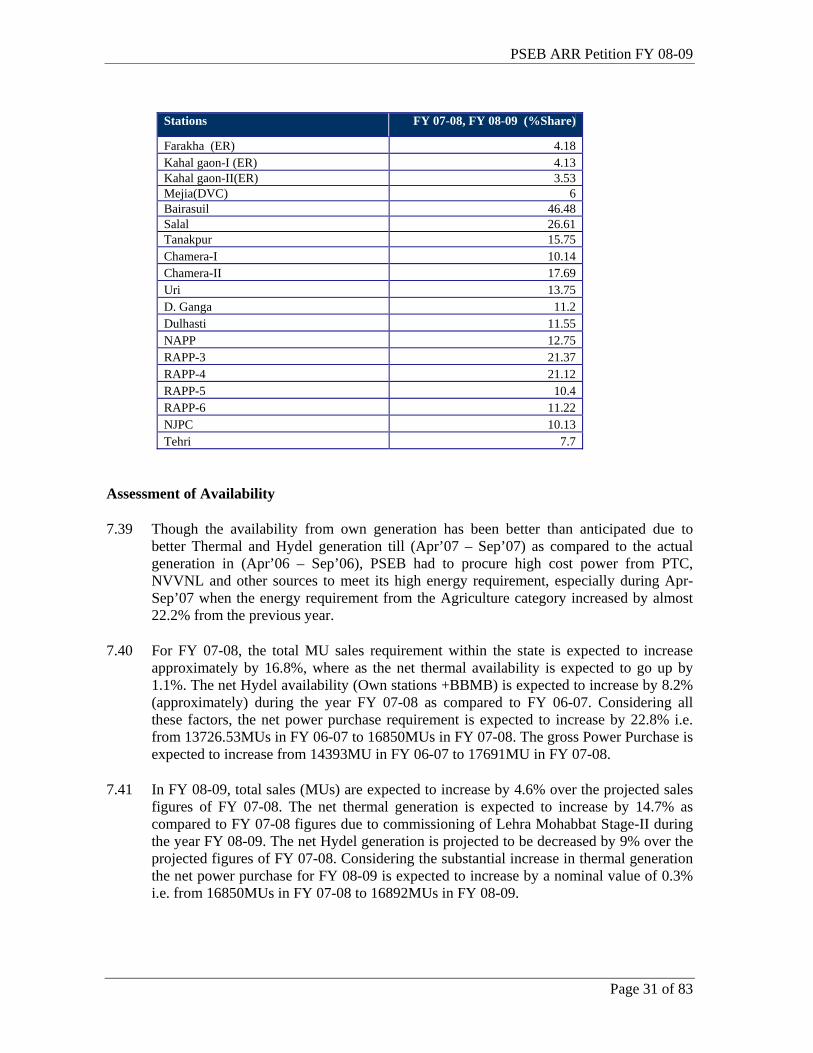
Table 22: CGS: Total Percentage Share for Punjab
Stations FY 07-08, FY 08-09 (%Share)
Anta (G/F) 12.82 Auraiya (G/F) 13.25 Dadri Gas (G/F) 16.45 Singrauli 11.07 Rihand-I 12.1 Rihand-II 11.31 Unchahar-I 8.85 Unchahar-II 15.3 Unchahar-III 15.35
PSEB ARR Petition FY 08-09
Page 31 of 83
Stations FY 07-08, FY 08-09 (%Share)
Farakha (ER) 4.18 Kahal gaon-I (ER) 4.13 Kahal gaon-II(ER) 3.53 Mejia(DVC) 6 Bairasuil 46.48 Salal 26.61 Tanakpur 15.75 Chamera-I 10.14 Chamera-II 17.69 Uri 13.75 D. Ganga 11.2 Dulhasti 11.55 NAPP 12.75 RAPP-3 21.37 RAPP-4 21.12 RAPP-5 10.4 RAPP-6 11.22 NJPC 10.13 Tehri 7.7
Assessment of Availability
7.39 Though the availability from own generation has been better than anticipated due to better Thermal and Hydel generation till (Apr’07 – Sep’07) as compared to the actual generation in (Apr’06 – Sep’06), PSEB had to procure high cost power from PTC, NVVNL and other sources to meet its high energy requirement, especially during Apr-Sep’07 when the energy requirement from the Agriculture category increased by almost 22.2% from the previous year.
7.40 For FY 07-08, the total MU sales requirement within the state is expected to increase approximately by 16.8%, where as the net thermal availability is expected to go up by 1.1%. The net Hydel availability (Own stations +BBMB) is expected to increase by 8.2% (approximately) during the year FY 07-08 as compared to FY 06-07. Considering all these factors, the net power purchase requirement is expected to increase by 22.8% i.e. from 13726.53MUs in FY 06-07 to 16850MUs in FY 07-08. The gross Power Purchase is expected to increase from 14393MU in FY 06-07 to 17691MU in FY 07-08.
7.41 In FY 08-09, total sales (MUs) are expected to increase by 4.6% over the projected sales figures of FY 07-08. The net thermal generation is expected to increase by 14.7% as compared to FY 07-08 figures due to commissioning of Lehra Mohabbat Stage-II during the year FY 08-09. The net Hydel generation is projected to be decreased by 9% over the projected figures of FY 07-08. Considering the substantial increase in thermal generation the net power purchase for FY 08-09 is expected to increase by a nominal value of 0.3% i.e. from 16850MUs in FY 07-08 to 16892MUs in FY 08-09.
PSEB ARR Petition FY 08-09
Page 32 of 83
7.42 External Transmission losses on Power Purchase for FY 07-08 have been estimated on the basis of weighted average of losses for FY 07-08 (H1) and FY 07-08(H2). For FY 07-08 (H1) actual losses have been taken and for FY 07-08 (H2) average of NR losses for the second half of 2006-07 have been taken. External Transmission losses for the year 2008-09 have been taken same as that of estimated values for FY 2007-08. Losses from power received from eastern region and the losses for trading have been estimated at 7.9%.
7.43 Availability projections from various old stations (wherever stations existed for last 3 years) for the year 2008-09 has been based upon the average of energy received for the last 3 years 2004-05 to 2006-07. Projections for the second half of the year 2007-08 are based upon the LGBR for the same period circulated by NRPC.
7.44 For Tehri and Dulhasti stations, energy has been projected based on design energy/ actual energy figures as available. In case of Dhauliganga average energy of last 2 years has been considered.
7.45 Commercial operation of Kahalgaon Stage II has been considered as follows: One machine has been considered operating from December 2007 onwards and second & third machine from April’08 and July’08 respectively.
7.46 For estimation of power received from Mejia TPS (2x250MW), it has been considered operational w.e.f. April’08 and assumed share of about 30MW has been considered
7.47 Projection of power received from RAPS-5 and RAPS-6 has been calculated based on the assumption that RAPS-5 is to be commercially operational w.e.f. March’08 and RAPS-6 is to be commercially operational from May’08.Power drawn has accordingly been reflected corresponding to PSEB share of 45MW.
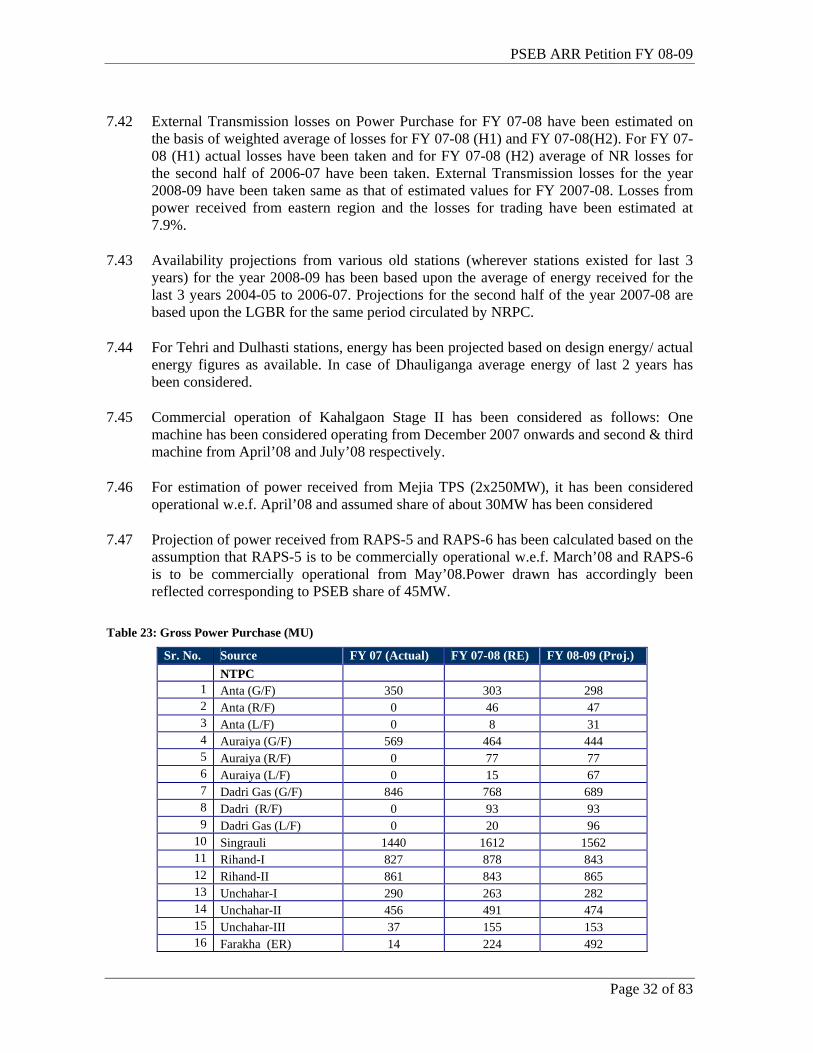
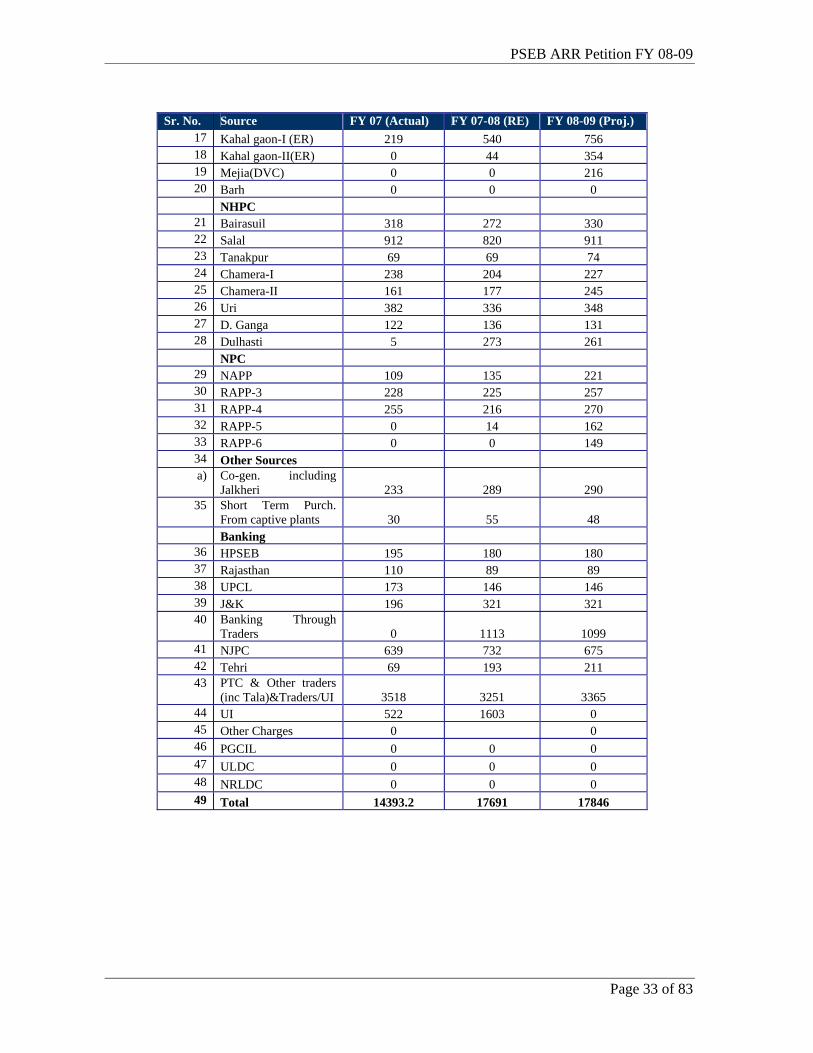
Table 23: Gross Power Purchase (MU)
Sr. No. Source FY 07 (Actual) FY 07-08 (RE) FY 08-09 (Proj.) NTPC
1 Anta (G/F) 350 303 298 2 Anta (R/F) 0 46 47 3 Anta (L/F) 0 8 31 4 Auraiya (G/F) 569 464 444 5 Auraiya (R/F) 0 77 77 6 Auraiya (L/F) 0 15 67 7 Dadri Gas (G/F) 846 768 689 8 Dadri (R/F) 0 93 93 9 Dadri Gas (L/F) 0 20 96
10 Singrauli 1440 1612 1562 11 Rihand-I 827 878 843 12 Rihand-II 861 843 865 13 Unchahar-I 290 263 282 14 Unchahar-II 456 491 474 15 Unchahar-III 37 155 153 16 Farakha (ER) 14 224 492
PSEB ARR Petition FY 08-09
Page 33 of 83
Sr. No. Source FY 07 (Actual) FY 07-08 (RE) FY 08-09 (Proj.) 17 Kahal gaon-I (ER) 219 540 756 18 Kahal gaon-II(ER) 0 44 354 19 Mejia(DVC) 0 0 216 20 Barh 0 0 0
NHPC 21 Bairasuil 318 272 330 22 Salal 912 820 911 23 Tanakpur 69 69 74 24 Chamera-I 238 204 227 25 Chamera-II 161 177 245 26 Uri 382 336 348 27 D. Ganga 122 136 131 28 Dulhasti 5 273 261
NPC 29 NAPP 109 135 221 30 RAPP-3 228 225 257 31 RAPP-4 255 216 270 32 RAPP-5 0 14 162 33 RAPP-6 0 0 149 34 Other Sources a) Co-gen. including
Jalkheri 233 289 290 35 Short Term Purch.
From captive plants 30 55 48 Banking
36 HPSEB 195 180 180 37 Rajasthan 110 89 89 38 UPCL 173 146 146 39 J&K 196 321 321 40 Banking Through
Traders 0 1113 1099 41 NJPC 639 732 675 42 Tehri 69 193 211 43 PTC & Other traders
(inc Tala)&Traders/UI 3518 3251 3365 44 UI 522 1603 0 45 Other Charges 0 0 46 PGCIL 0 0 0 47 ULDC 0 0 0 48 NRLDC 0 0 0 49 Total 14393.2 17691 17846
PSEB ARR Petition FY 08-09
Page 34 of 83
A8: ENERGY BALANCE
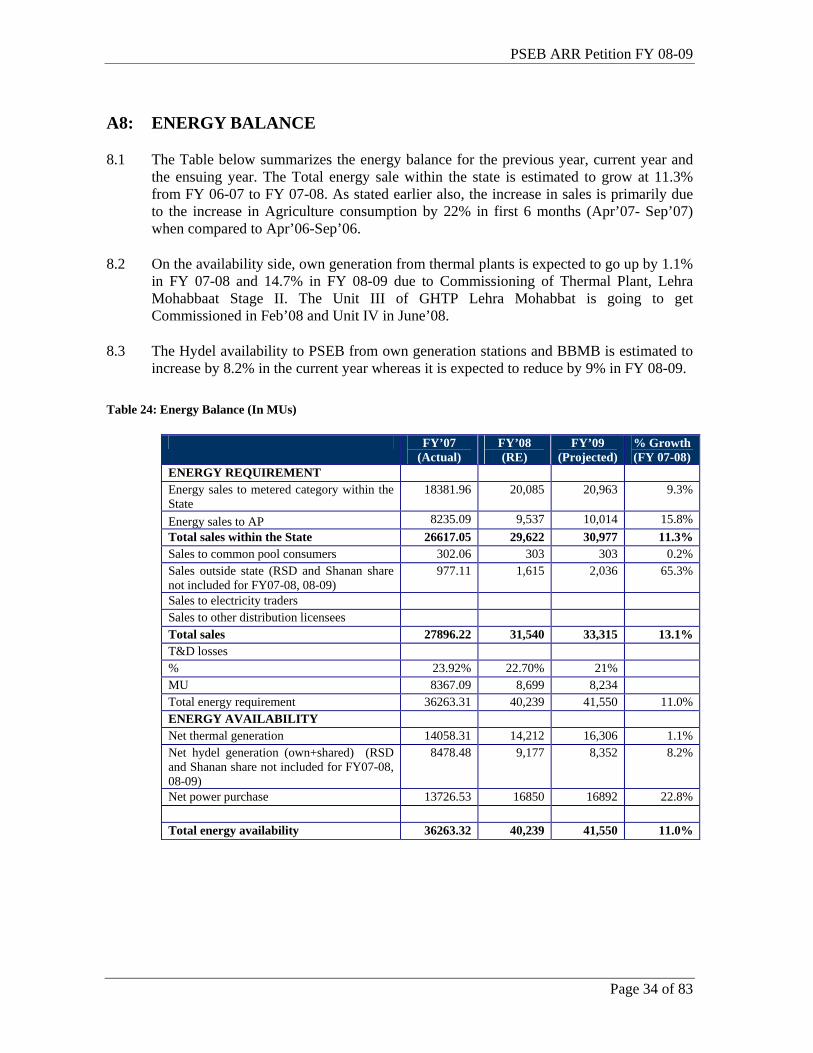
8.1 The Table below summarizes the energy balance for the previous year, current year and the ensuing year. The Total energy sale within the state is estimated to grow at 11.3% from FY 06-07 to FY 07-08. As stated earlier also, the increase in sales is primarily due to the increase in Agriculture consumption by 22% in first 6 months (Apr’07- Sep’07) when compared to Apr’06-Sep’06.
8.2 On the availability side, own generation from thermal plants is expected to go up by 1.1% in FY 07-08 and 14.7% in FY 08-09 due to Commissioning of Thermal Plant, Lehra Mohabbaat Stage II. The Unit III of GHTP Lehra Mohabbat is going to get Commissioned in Feb’08 and Unit IV in June’08.
8.3 The Hydel availability to PSEB from own generation stations and BBMB is estimated to increase by 8.2% in the current year whereas it is expected to reduce by 9% in FY 08-09.
Table 24: Energy Balance (In MUs)
FY’07 (Actual)
FY’08 (RE)
FY’09 (Projected)
% Growth (FY 07-08)
ENERGY REQUIREMENT Energy sales to metered category within the State
18381.96 20,085 20,963 9.3%
Energy sales to AP 8235.09 9,537 10,014 15.8% Total sales within the State 26617.05 29,622 30,977 11.3% Sales to common pool consumers 302.06 303 303 0.2% Sales outside state (RSD and Shanan share not included for FY07-08, 08-09)
977.11 1,615 2,036 65.3%
Sales to electricity traders Sales to other distribution licensees Total sales 27896.22 31,540 33,315 13.1% T&D losses % 23.92% 22.70% 21% MU 8367.09 8,699 8,234 Total energy requirement 36263.31 40,239 41,550 11.0% ENERGY AVAILABILITY Net thermal generation 14058.31 14,212 16,306 1.1% Net hydel generation (own+shared) (RSD and Shanan share not included for FY07-08, 08-09)
8478.48 9,177 8,352 8.2%
Net power purchase 13726.53 16850 16892 22.8% Total energy availability 36263.32 40,239 41,550 11.0%
PSEB ARR Petition FY 08-09
Page 35 of 83
A9: FUEL COST
9.1 The fuel cost of Thermal stations of PSEB, namely, GNDTP, Bhatinda, GGSSTP, Ropar and GHTP, Lehra Mohabbat is based on the following parameters:
(a) Generation figures as determined in Chapter A7:
(b) Specific Oil Consumption and Oil Prices
(c) Station Heat Rate
(d) Coal Transit Loss
(e) Price and Calorific Value of Coal
9.2 The projected figure of the fuel cost parameters for FY 08-09, the revised estimate for FY 07-08 and the actuals for FY 06-07 is discussed in detail as under.
Specific Oil Consumption and Oil Prices
9.3 The Specific Oil Consumption of GNDTP, GGSSTP, GHTP Stage-I & Stage-II plants are estimated on the basis of CERC Norms for the current year as well as the ensuing year. For GGSSTP and GHTP Stage-I (Unit-I&II) specific oil consumption is estimated at 2ml/Kwh. Whereas for GNDTP specific oil consumption is estimated at 3.5ml/Kwh as per CERC norms for Tanda Generating Station.
9.4 For GHTP Stage-II (Unit-III&IV) , specific oil consumption is estimated in accordance with the CERC norm for the consumption of secondary oil for thermal units during the stabilisation period, it is taken as 4.5ml/Kwh for FY 07-08,with Unit-III operating by Feb’08 and 3.25ml/Kwh for FY 08-09 considering that Unit-IV is Commissioned by June’08.
9.5 It must be appreciated that the weighted oil prices for the three plants are different. This is on account of the fact that different levels of mix of FO and LDO are used at thermal plants.
9.6 The proportion of FO and LDO usage varies from plant to plant. LDO is used for initial start-up of the plant and later FO is used till 70% loading. In case of GHTP, since the plant runs mostly at full load, the consumption of FO is quite low whereas in case of GGSSTP the consumption of FO is comparatively high due to partial load. The proportion of LDO varies from 30% to 40% for different plants and accordingly the weighted average of oil price is different for different plants.
9.7 The prices of oil for FY 07-08 and FY 08-09 have been projected based on the actual average price for the respective Generating stations (six month FY 07-08 figures till Sept’07 for GNDTP, GGSSTP & GHTP Stage-I) in line with the Commission’s view that any change in the fuel prices(uncontrollable element in ARR) is recoverable as Fuel Cost Adjustment.
PSEB ARR Petition FY 08-09
Page 36 of 83
9.8 For GHTP Stage-II, average oil prices as determined for GHTP Stage-I based on the actuals till Sept’07 is considered for FY’08 & FY’09.
9.9 The Table 25 below shows the weighted average ex-depot price of oil taken for the year FY07-08 & FY 08-09.
Table 25: Oil Prices for Different Plants (FY07-08 & FY08-09)
Particulars GNDTP GGSSTP GHTP Stage-I GHTP Stage-II Weighted Price of Oil (Rs/KL) 22506.00 21064.73 22654.00 22654.00
Station Heat Rate
9.10 The Station Heat Rate for GHTP Stage-I (Unit-I&II) and GNDTP has been taken as 2500 Kcal/Kwh and 3000 Kcal/Kwh respectively as per CERC norms for similar aged plants, for FY 07-08 & FY 08-09.
9.11 For GGSSTP the Station Heat Rate has been projected at 2666.67 Kcal/Kwh for FY 07-08 & FY 08-09 after considering the fact that two of the six units at GGSSTP are more than 22 years old. The SHR for GGSSTP has been calculated by considering a SHR of 3000 Kcal/Kwh for the older units and 2500 Kcal/Kwh for the other units.
9.12 Station heat rate of GHTP Stage-II (Unit-III&IV) for FY 07-08 has been considered as 2990Kcal/Kwh on the basis that during the 1st year of GHTP Stage-I (Unit-I) operation, Station heat rate of the unit was 2928Kcal/Kwh. For FY 08-09, when Unit-IV will also be in operation by June’08, Station heat rate of 2745Kcal/Kwh has been considered (Average of 2990Kcal/Kwh & 2500 Kcal/Kwh)
9.13 The Board submits to the Hon’ble Commission to approve the Station Heat Rate at the levels submitted herein by PSEB, without any disallowance. Further the Board would like to request the Commission to appreciate that the SHR for any generating station deteriorates with the passage of time and considering the same SHR for all plants irrespective of their age profile would result in the under recovery of the fuel cost.
9.14 For FY 06-07 Station Heat Rate figures attained by the three thermal generating stations have been provided for Truing up.
Coal Transit Loss
9.15 Coal Transit loss for GNDTP, GGSSTP and GHTP Stage-I & II has been assumed to be 2% for the year FY 07-08(RE) & FY 08-09, as per the values approved by the Commission in the Suo Motu Tariff Order for FY 07-08.
9.16 The Boards submits to the Commission that it doesn’t have control in reducing Coal transit loss beyond a certain level, as there are many uncontrollable external factors. The Board should not in any manner be penalized for the impact of such external factors.
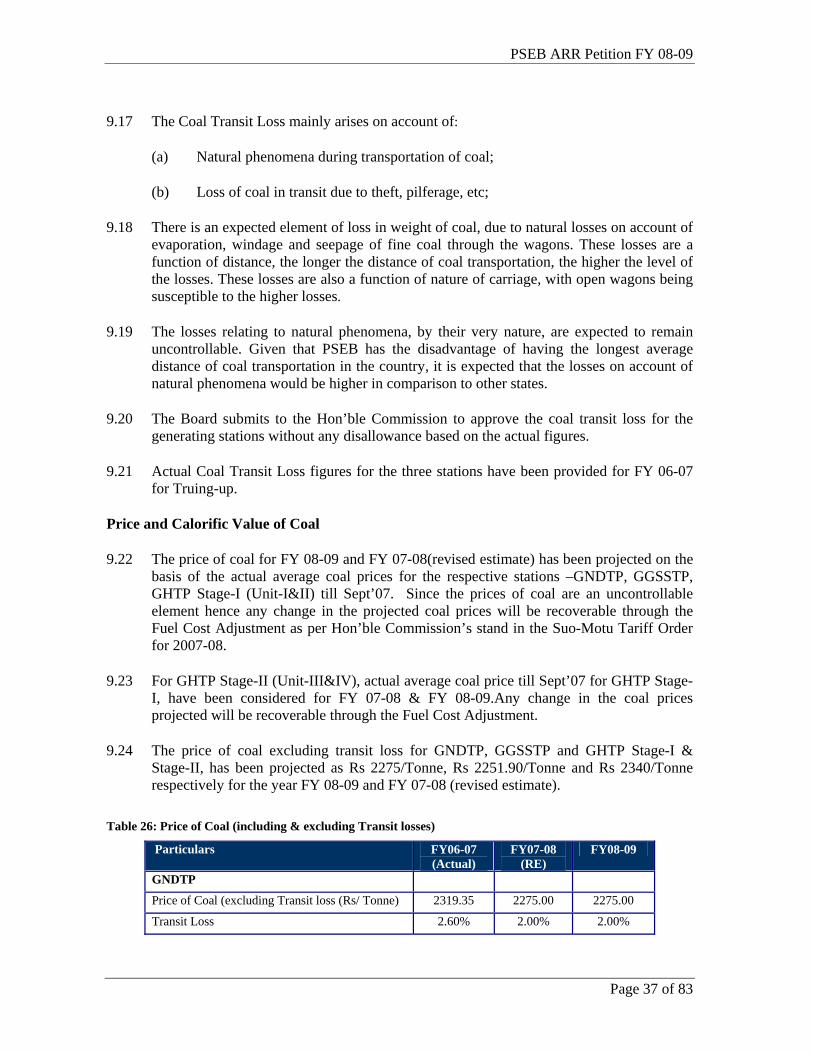
PSEB ARR Petition FY 08-09
Page 37 of 83
9.17 The Coal Transit Loss mainly arises on account of:
(a) Natural phenomena during transportation of coal;
(b) Loss of coal in transit due to theft, pilferage, etc;
9.18 There is an expected element of loss in weight of coal, due to natural losses on account of evaporation, windage and seepage of fine coal through the wagons. These losses are a function of distance, the longer the distance of coal transportation, the higher the level of the losses. These losses are also a function of nature of carriage, with open wagons being susceptible to the higher losses.
9.19 The losses relating to natural phenomena, by their very nature, are expected to remain uncontrollable. Given that PSEB has the disadvantage of having the longest average distance of coal transportation in the country, it is expected that the losses on account of natural phenomena would be higher in comparison to other states.
9.20 The Board submits to the Hon’ble Commission to approve the coal transit loss for the generating stations without any disallowance based on the actual figures.
9.21 Actual Coal Transit Loss figures for the three stations have been provided for FY 06-07 for Truing-up.
Price and Calorific Value of Coal
9.22 The price of coal for FY 08-09 and FY 07-08(revised estimate) has been projected on the basis of the actual average coal prices for the respective stations –GNDTP, GGSSTP, GHTP Stage-I (Unit-I&II) till Sept’07. Since the prices of coal are an uncontrollable element hence any change in the projected coal prices will be recoverable through the Fuel Cost Adjustment as per Hon’ble Commission’s stand in the Suo-Motu Tariff Order for 2007-08.
9.23 For GHTP Stage-II (Unit-III&IV), actual average coal price till Sept’07 for GHTP Stage-I, have been considered for FY 07-08 & FY 08-09.Any change in the coal prices projected will be recoverable through the Fuel Cost Adjustment.
9.24 The price of coal excluding transit loss for GNDTP, GGSSTP and GHTP Stage-I & Stage-II, has been projected as Rs 2275/Tonne, Rs 2251.90/Tonne and Rs 2340/Tonne respectively for the year FY 08-09 and FY 07-08 (revised estimate).
Table 26: Price of Coal (including & excluding Transit losses)
Particulars FY06-07 (Actual)
FY07-08 (RE)
FY08-09
GNDTP
Price of Coal (excluding Transit loss (Rs/ Tonne) 2319.35 2275.00 2275.00
Transit Loss 2.60% 2.00% 2.00%
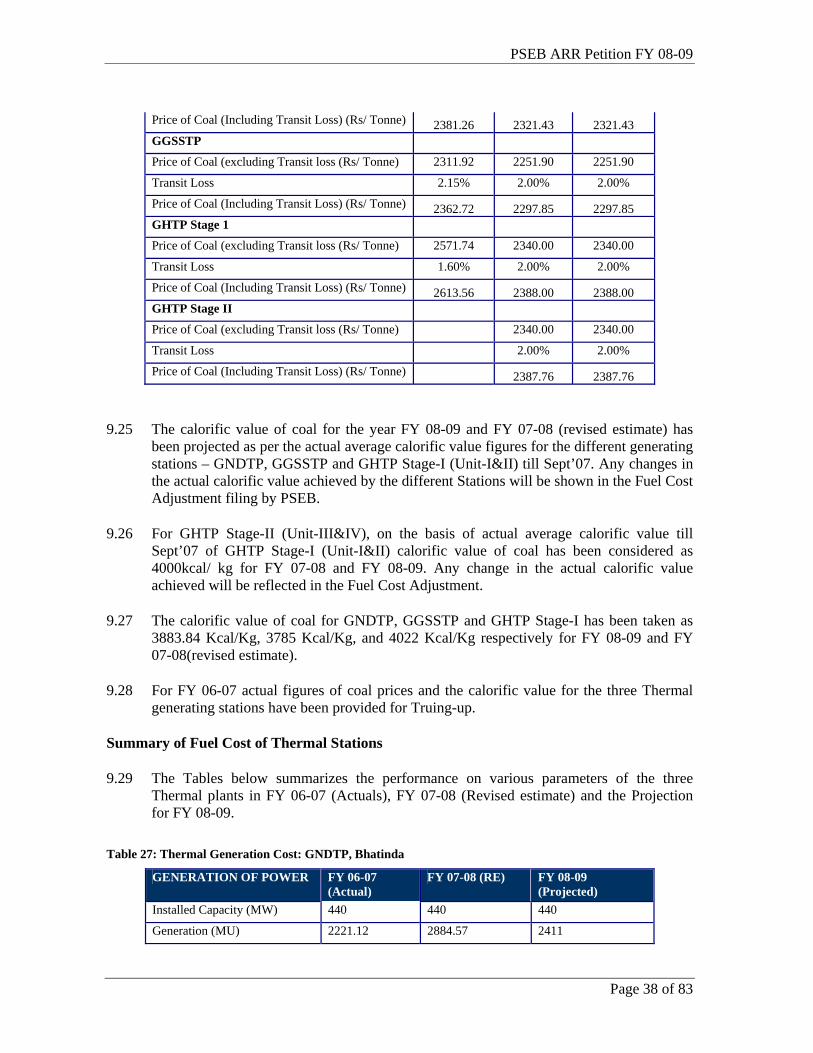
PSEB ARR Petition FY 08-09
Page 38 of 83
Price of Coal (Including Transit Loss) (Rs/ Tonne) 2381.26 2321.43 2321.43 GGSSTP Price of Coal (excluding Transit loss (Rs/ Tonne) 2311.92 2251.90 2251.90
Transit Loss 2.15% 2.00% 2.00%
Price of Coal (Including Transit Loss) (Rs/ Tonne) 2362.72 2297.85 2297.85 GHTP Stage 1 Price of Coal (excluding Transit loss (Rs/ Tonne) 2571.74 2340.00 2340.00
Transit Loss 1.60% 2.00% 2.00%
Price of Coal (Including Transit Loss) (Rs/ Tonne) 2613.56 2388.00 2388.00 GHTP Stage II Price of Coal (excluding Transit loss (Rs/ Tonne) 2340.00 2340.00
Transit Loss 2.00% 2.00%
Price of Coal (Including Transit Loss) (Rs/ Tonne) 2387.76 2387.76
9.25 The calorific value of coal for the year FY 08-09 and FY 07-08 (revised estimate) has been projected as per the actual average calorific value figures for the different generating stations – GNDTP, GGSSTP and GHTP Stage-I (Unit-I&II) till Sept’07. Any changes in the actual calorific value achieved by the different Stations will be shown in the Fuel Cost Adjustment filing by PSEB.
9.26 For GHTP Stage-II (Unit-III&IV), on the basis of actual average calorific value till Sept’07 of GHTP Stage-I (Unit-I&II) calorific value of coal has been considered as 4000kcal/ kg for FY 07-08 and FY 08-09. Any change in the actual calorific value achieved will be reflected in the Fuel Cost Adjustment.
9.27 The calorific value of coal for GNDTP, GGSSTP and GHTP Stage-I has been taken as 3883.84 Kcal/Kg, 3785 Kcal/Kg, and 4022 Kcal/Kg respectively for FY 08-09 and FY 07-08(revised estimate).
9.28 For FY 06-07 actual figures of coal prices and the calorific value for the three Thermal generating stations have been provided for Truing-up.
Summary of Fuel Cost of Thermal Stations
9.29 The Tables below summarizes the performance on various parameters of the three Thermal plants in FY 06-07 (Actuals), FY 07-08 (Revised estimate) and the Projection for FY 08-09.
Table 27: Thermal Generation Cost: GNDTP, Bhatinda
GENERATION OF POWER FY 06-07 (Actual)
FY 07-08 (RE) FY 08-09 (Projected)
Installed Capacity (MW) 440 440 440
Generation (MU) 2221.12 2884.57 2411
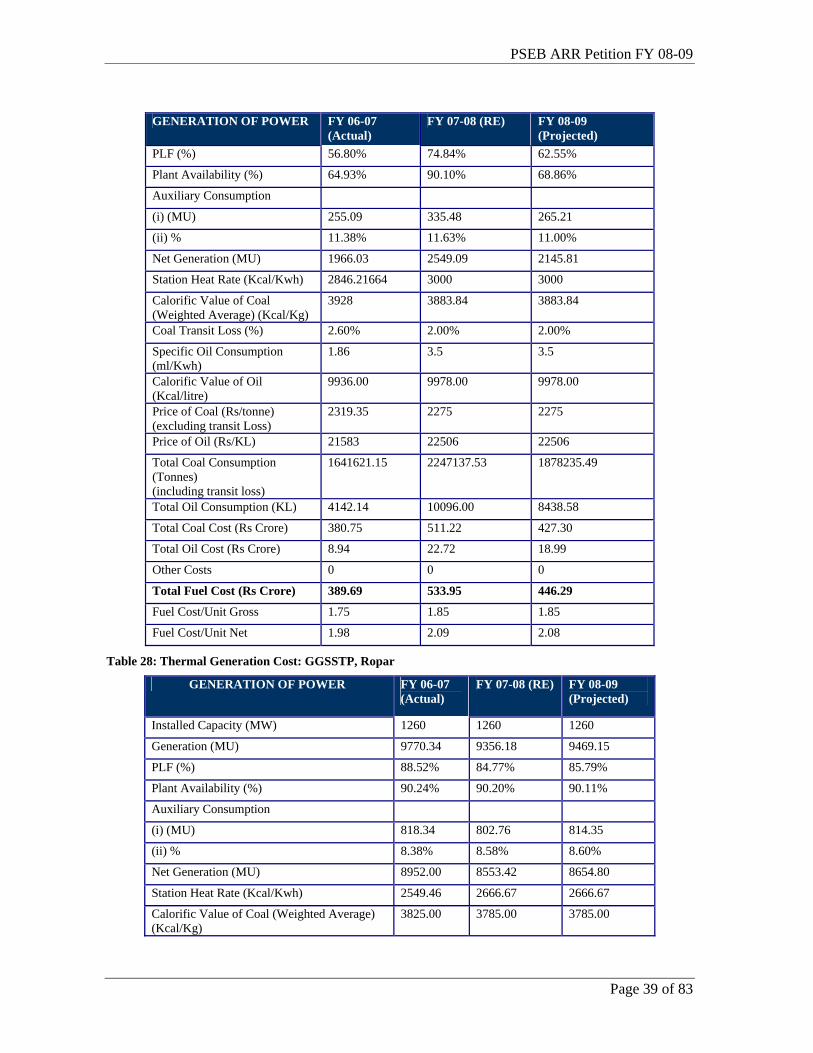
PSEB ARR Petition FY 08-09
Page 39 of 83
GENERATION OF POWER FY 06-07 (Actual)
FY 07-08 (RE) FY 08-09 (Projected)
PLF (%) 56.80% 74.84% 62.55%
Plant Availability (%) 64.93% 90.10% 68.86%
Auxiliary Consumption
(i) (MU) 255.09 335.48 265.21
(ii) % 11.38% 11.63% 11.00%
Net Generation (MU) 1966.03 2549.09 2145.81
Station Heat Rate (Kcal/Kwh) 2846.21664 3000 3000
Calorific Value of Coal (Weighted Average) (Kcal/Kg)
3928 3883.84 3883.84
Coal Transit Loss (%) 2.60% 2.00% 2.00%
Specific Oil Consumption (ml/Kwh)
1.86 3.5 3.5
Calorific Value of Oil (Kcal/litre)
9936.00 9978.00 9978.00
Price of Coal (Rs/tonne) (excluding transit Loss)
2319.35 2275 2275
Price of Oil (Rs/KL) 21583 22506 22506
Total Coal Consumption (Tonnes) (including transit loss)
1641621.15 2247137.53 1878235.49
Total Oil Consumption (KL) 4142.14 10096.00 8438.58
Total Coal Cost (Rs Crore) 380.75 511.22 427.30
Total Oil Cost (Rs Crore) 8.94 22.72 18.99
Other Costs 0 0 0
Total Fuel Cost (Rs Crore) 389.69 533.95 446.29
Fuel Cost/Unit Gross 1.75 1.85 1.85
Fuel Cost/Unit Net 1.98 2.09 2.08
Table 28: Thermal Generation Cost: GGSSTP, Ropar
GENERATION OF POWER FY 06-07 (Actual)
FY 07-08 (RE) FY 08-09 (Projected)
Installed Capacity (MW) 1260 1260 1260
Generation (MU) 9770.34 9356.18 9469.15
PLF (%) 88.52% 84.77% 85.79%
Plant Availability (%) 90.24% 90.20% 90.11%
Auxiliary Consumption
(i) (MU) 818.34 802.76 814.35
(ii) % 8.38% 8.58% 8.60%
Net Generation (MU) 8952.00 8553.42 8654.80
Station Heat Rate (Kcal/Kwh) 2549.46 2666.67 2666.67
Calorific Value of Coal (Weighted Average) (Kcal/Kg)
3825.00 3785.00 3785.00
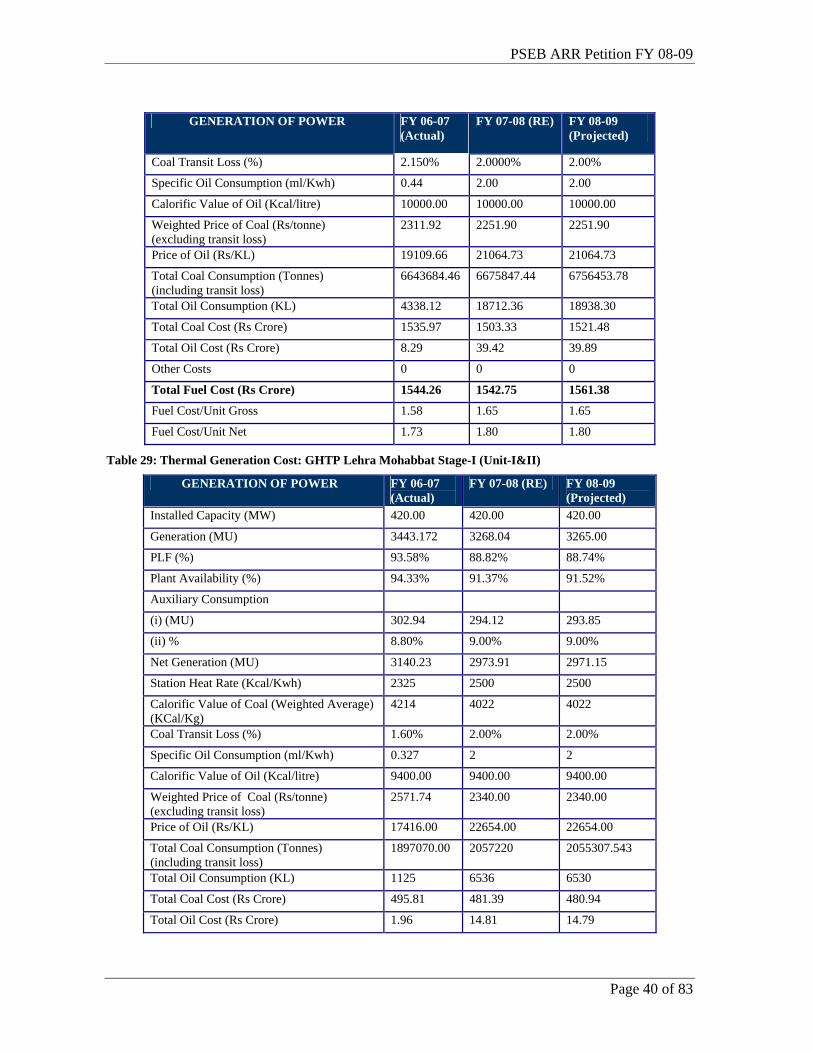
PSEB ARR Petition FY 08-09
Page 40 of 83
GENERATION OF POWER FY 06-07 (Actual)
FY 07-08 (RE) FY 08-09 (Projected)
Coal Transit Loss (%) 2.150% 2.0000% 2.00%
Specific Oil Consumption (ml/Kwh) 0.44 2.00 2.00
Calorific Value of Oil (Kcal/litre) 10000.00 10000.00 10000.00
Weighted Price of Coal (Rs/tonne) (excluding transit loss)
2311.92 2251.90 2251.90
Price of Oil (Rs/KL) 19109.66 21064.73 21064.73
Total Coal Consumption (Tonnes) (including transit loss)
6643684.46 6675847.44 6756453.78
Total Oil Consumption (KL) 4338.12 18712.36 18938.30
Total Coal Cost (Rs Crore) 1535.97 1503.33 1521.48
Total Oil Cost (Rs Crore) 8.29 39.42 39.89
Other Costs 0 0 0
Total Fuel Cost (Rs Crore) 1544.26 1542.75 1561.38
Fuel Cost/Unit Gross 1.58 1.65 1.65
Fuel Cost/Unit Net 1.73 1.80 1.80
Table 29: Thermal Generation Cost: GHTP Lehra Mohabbat Stage-I (Unit-I&II)
GENERATION OF POWER FY 06-07 (Actual)
FY 07-08 (RE) FY 08-09 (Projected)
Installed Capacity (MW) 420.00 420.00 420.00
Generation (MU) 3443.172 3268.04 3265.00
PLF (%) 93.58% 88.82% 88.74%
Plant Availability (%) 94.33% 91.37% 91.52%
Auxiliary Consumption
(i) (MU) 302.94 294.12 293.85
(ii) % 8.80% 9.00% 9.00%
Net Generation (MU) 3140.23 2973.91 2971.15
Station Heat Rate (Kcal/Kwh) 2325 2500 2500
Calorific Value of Coal (Weighted Average) (KCal/Kg)
4214 4022 4022
Coal Transit Loss (%) 1.60% 2.00% 2.00%
Specific Oil Consumption (ml/Kwh) 0.327 2 2
Calorific Value of Oil (Kcal/litre) 9400.00 9400.00 9400.00
Weighted Price of Coal (Rs/tonne) (excluding transit loss)
2571.74 2340.00 2340.00
Price of Oil (Rs/KL) 17416.00 22654.00 22654.00
Total Coal Consumption (Tonnes) (including transit loss)
1897070.00 2057220 2055307.543
Total Oil Consumption (KL) 1125 6536 6530
Total Coal Cost (Rs Crore) 495.81 481.39 480.94
Total Oil Cost (Rs Crore) 1.96 14.81 14.79
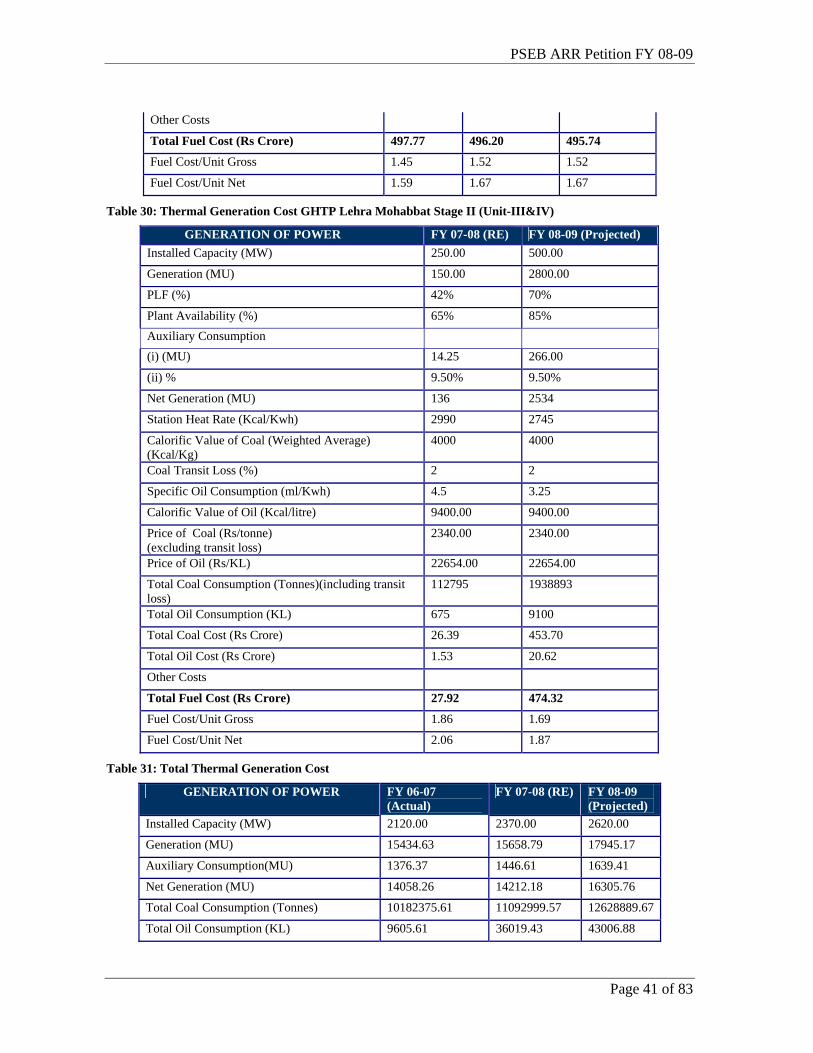
PSEB ARR Petition FY 08-09
Page 41 of 83
Other Costs
Total Fuel Cost (Rs Crore) 497.77 496.20 495.74
Fuel Cost/Unit Gross 1.45 1.52 1.52
Fuel Cost/Unit Net 1.59 1.67 1.67
Table 30: Thermal Generation Cost GHTP Lehra Mohabbat Stage II (Unit-III&IV)
GENERATION OF POWER FY 07-08 (RE) FY 08-09 (Projected) Installed Capacity (MW) 250.00 500.00
Generation (MU) 150.00 2800.00
PLF (%) 42% 70%
Plant Availability (%) 65% 85% Auxiliary Consumption (i) (MU) 14.25 266.00
(ii) % 9.50% 9.50%
Net Generation (MU) 136 2534
Station Heat Rate (Kcal/Kwh) 2990 2745
Calorific Value of Coal (Weighted Average) (Kcal/Kg)
4000 4000
Coal Transit Loss (%) 2 2
Specific Oil Consumption (ml/Kwh) 4.5 3.25
Calorific Value of Oil (Kcal/litre) 9400.00 9400.00
Price of Coal (Rs/tonne) (excluding transit loss)
2340.00 2340.00
Price of Oil (Rs/KL) 22654.00 22654.00
Total Coal Consumption (Tonnes)(including transit loss)
112795 1938893
Total Oil Consumption (KL) 675 9100
Total Coal Cost (Rs Crore) 26.39 453.70
Total Oil Cost (Rs Crore) 1.53 20.62
Other Costs
Total Fuel Cost (Rs Crore) 27.92 474.32
Fuel Cost/Unit Gross 1.86 1.69
Fuel Cost/Unit Net 2.06 1.87
Table 31: Total Thermal Generation Cost
GENERATION OF POWER FY 06-07 (Actual)
FY 07-08 (RE) FY 08-09 (Projected)
Installed Capacity (MW) 2120.00 2370.00 2620.00
Generation (MU) 15434.63 15658.79 17945.17
Auxiliary Consumption(MU) 1376.37 1446.61 1639.41
Net Generation (MU) 14058.26 14212.18 16305.76
Total Coal Consumption (Tonnes) 10182375.61 11092999.57 12628889.67
Total Oil Consumption (KL) 9605.61 36019.43 43006.88
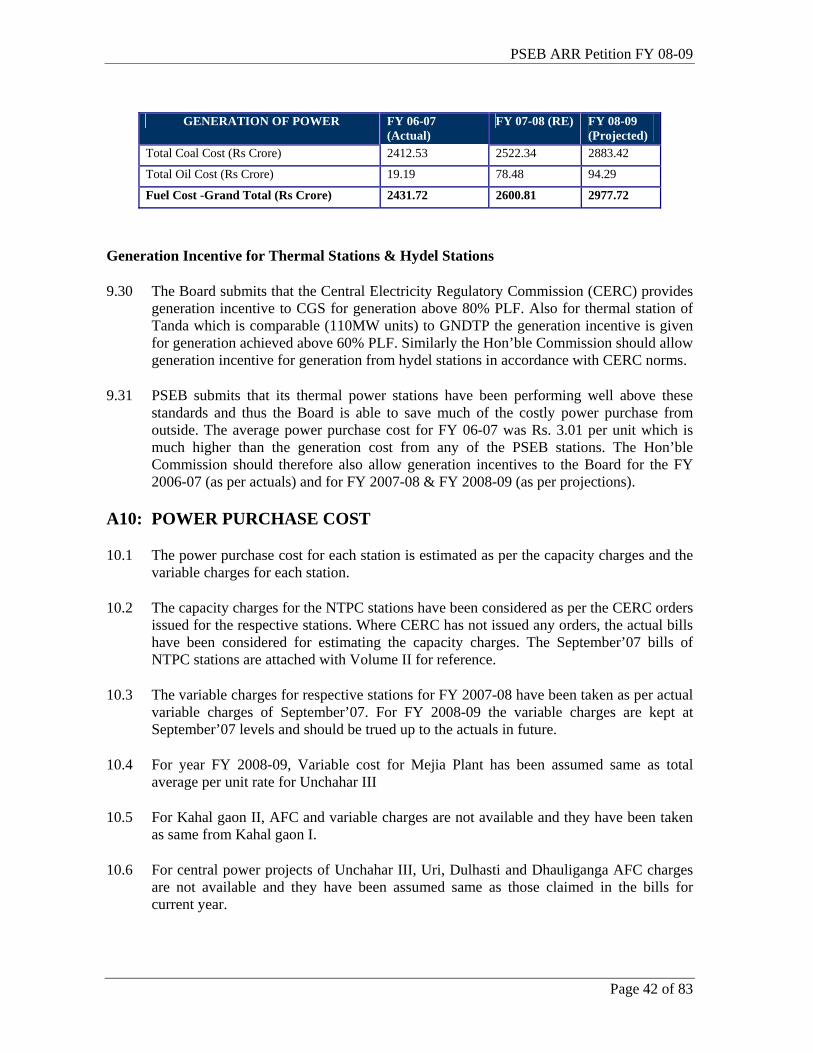
PSEB ARR Petition FY 08-09
Page 42 of 83
GENERATION OF POWER FY 06-07 (Actual)
FY 07-08 (RE) FY 08-09 (Projected)
Total Coal Cost (Rs Crore) 2412.53 2522.34 2883.42
Total Oil Cost (Rs Crore) 19.19 78.48 94.29
Fuel Cost -Grand Total (Rs Crore) 2431.72 2600.81 2977.72
Generation Incentive for Thermal Stations & Hydel Stations
9.30 The Board submits that the Central Electricity Regulatory Commission (CERC) provides generation incentive to CGS for generation above 80% PLF. Also for thermal station of Tanda which is comparable (110MW units) to GNDTP the generation incentive is given for generation achieved above 60% PLF. Similarly the Hon’ble Commission should allow generation incentive for generation from hydel stations in accordance with CERC norms.
9.31 PSEB submits that its thermal power stations have been performing well above these standards and thus the Board is able to save much of the costly power purchase from outside. The average power purchase cost for FY 06-07 was Rs. 3.01 per unit which is much higher than the generation cost from any of the PSEB stations. The Hon’ble Commission should therefore also allow generation incentives to the Board for the FY 2006-07 (as per actuals) and for FY 2007-08 & FY 2008-09 (as per projections).
A10: POWER PURCHASE COST
10.1 The power purchase cost for each station is estimated as per the capacity charges and the variable charges for each station.
10.2 The capacity charges for the NTPC stations have been considered as per the CERC orders issued for the respective stations. Where CERC has not issued any orders, the actual bills have been considered for estimating the capacity charges. The September’07 bills of NTPC stations are attached with Volume II for reference.
10.3 The variable charges for respective stations for FY 2007-08 have been taken as per actual variable charges of September’07. For FY 2008-09 the variable charges are kept at September’07 levels and should be trued up to the actuals in future.
10.4 For year FY 2008-09, Variable cost for Mejia Plant has been assumed same as total average per unit rate for Unchahar III
10.5 For Kahal gaon II, AFC and variable charges are not available and they have been taken as same from Kahal gaon I.
10.6 For central power projects of Unchahar III, Uri, Dulhasti and Dhauliganga AFC charges are not available and they have been assumed same as those claimed in the bills for current year.

PSEB ARR Petition FY 08-09
Page 43 of 83
10.7 The fixed cost for Tehri Hydro has been based on the interim CERC order for both FY08 and FY09.
10.8 The Table below shows the total power purchase in absolute amounts for previous year, current year and the next year.
Table 32: Power Purchase cost for FY06-07, FY07-08(RE), FY08-09(Proj.) (Rs Crs)
Sr. No.
Source FY 07 (Actual) (Gross MUs)
FY 07-08 (RE) (Gross MUs)
FY 08-09 (Proj.) (Gross MUs)
FY 07 (Actual) (Rs. Crs)
FY 07-08 (RE) (Rs. Crs)
FY 08-09 (Proj.) (Rs. Crs)
NTPC 1 Anta (G/F) 350 303 298 86 43 43 2 Anta (R/F) 0 46 47 0 18 18 3 Anta (L/F) 0 8 31 0 6 25 4 Auraiya (G/F) 569 464 444 161 71 69 5 Auraiya (R/F) 0 77 77 0 31 31 6 Auraiya (L/F) 0 15 67 0 11 47 7 Dadri Gas (G/F) 846 768 689 253 126 112 8 Dadri (R/F) 0 93 93 0 37 37 9 Dadri Gas (L/F) 0 20 96 0 14 66 10 Singrauli 1440 1612 1562 180 186 183 11 Rihand-I 827 878 843 141 140 142 12 Rihand-II 861 843 865 131 144 145 13 Unchahar-I 290 263 282 57 52 55 14 Unchahar-II 456 491 474 87 95 93 15 Unchahar-III 37 155 153 7 40 40 16 Farakha (ER) 14 224 492 3 50 83 17 Kahal gaon-I (ER) 219 540 756 39 113 142 18 Kahal gaon-II(ER) 0 44 354 0 17 60 19 Mejia(DVC) 0 0 216 0 0 57 20 Barh 0 0 0 0 0 0 NHPC 21 Bairasuil 318 272 330 30 27 29 22 Salal 912 820 911 67 50 55 23 Tanakpur 69 69 74 9 8 8 24 Chamera-I 238 204 227 33 23 25 25 Chamera-II 161 177 245 49 65 66 26 Uri 382 336 348 87 49 53 27 D. Ganga 122 136 131 22 22 24 28 Dulhasti 5 273 261 0 76 69 NPC 29 NAPP 109 135 221 22 26 42 30 RAPP-3 228 225 257 62 61 70 31 RAPP-4 255 216 270 72 59 74 32 RAPP-5 0 14 162 0 4 44 33 RAPP-6 0 0 149 0 0 41 34 Other Sources a) Co-gen including 233 289 290 86 109 112
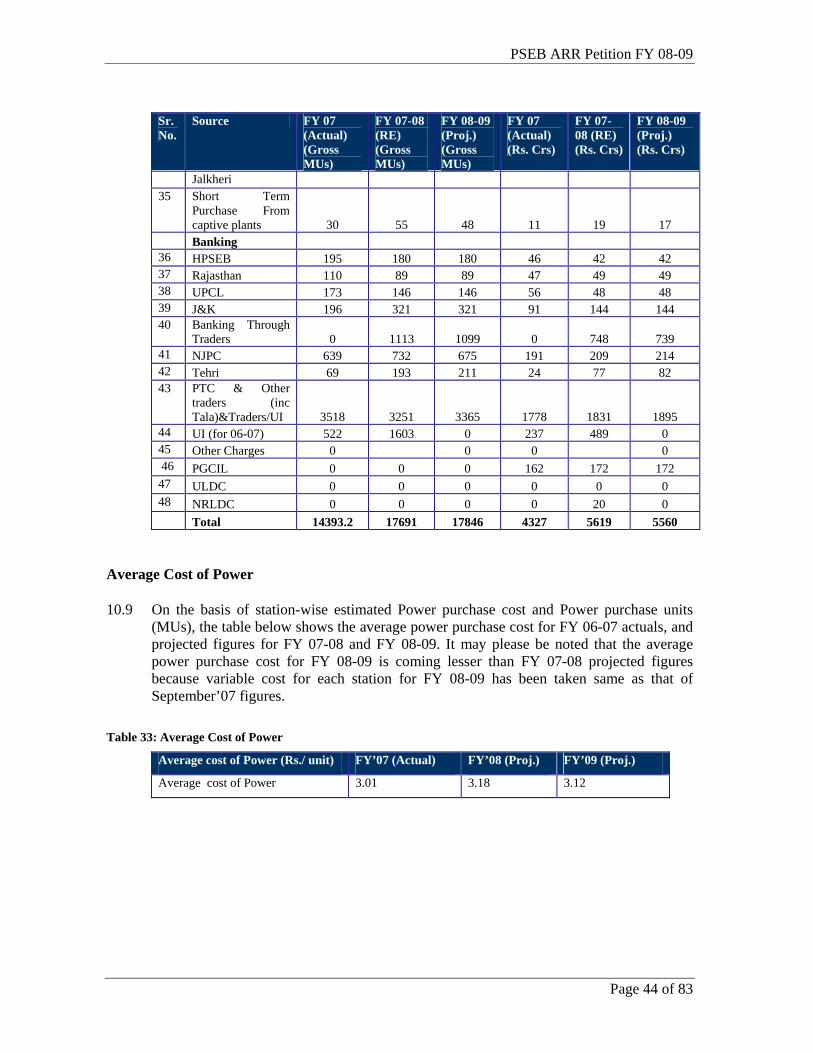
PSEB ARR Petition FY 08-09
Page 44 of 83
Sr. No.
Source FY 07 (Actual) (Gross MUs)
FY 07-08 (RE) (Gross MUs)
FY 08-09 (Proj.) (Gross MUs)
FY 07 (Actual) (Rs. Crs)
FY 07-08 (RE) (Rs. Crs)
FY 08-09 (Proj.) (Rs. Crs)
Jalkheri 35 Short Term
Purchase From captive plants 30 55 48 11 19 17
Banking 36 HPSEB 195 180 180 46 42 42 37 Rajasthan 110 89 89 47 49 49 38 UPCL 173 146 146 56 48 48 39 J&K 196 321 321 91 144 144 40 Banking Through
Traders 0 1113 1099 0 748 739 41 NJPC 639 732 675 191 209 214 42 Tehri 69 193 211 24 77 82 43 PTC & Other
traders (inc Tala)&Traders/UI 3518 3251 3365 1778 1831 1895
44 UI (for 06-07) 522 1603 0 237 489 0 45 Other Charges 0 0 0 0 46 PGCIL 0 0 0 162 172 172 47 ULDC 0 0 0 0 0 0 48 NRLDC 0 0 0 0 20 0 Total 14393.2 17691 17846 4327 5619 5560
Average Cost of Power
10.9 On the basis of station-wise estimated Power purchase cost and Power purchase units (MUs), the table below shows the average power purchase cost for FY 06-07 actuals, and projected figures for FY 07-08 and FY 08-09. It may please be noted that the average power purchase cost for FY 08-09 is coming lesser than FY 07-08 projected figures because variable cost for each station for FY 08-09 has been taken same as that of September’07 figures.
Table 33: Average Cost of Power
Average cost of Power (Rs./ unit) FY’07 (Actual) FY’08 (Proj.) FY’09 (Proj.)
Average cost of Power 3.01 3.18 3.12
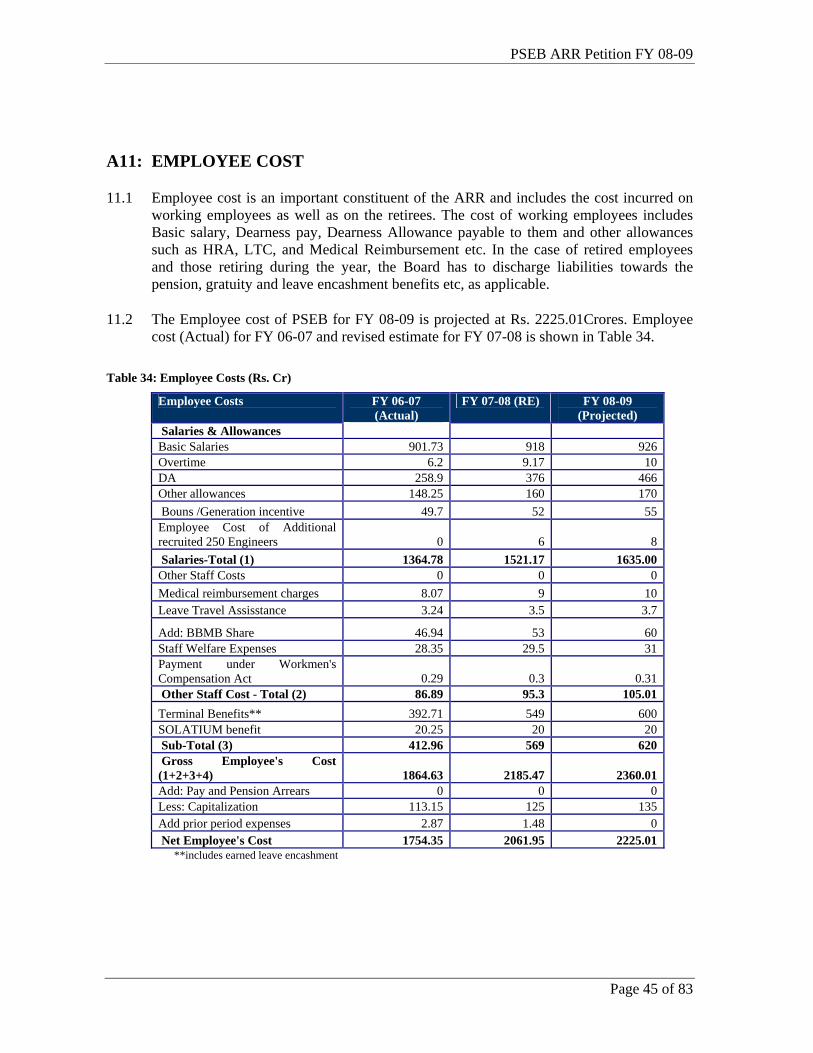
PSEB ARR Petition FY 08-09
Page 45 of 83
A11: EMPLOYEE COST
11.1 Employee cost is an important constituent of the ARR and includes the cost incurred on working employees as well as on the retirees. The cost of working employees includes Basic salary, Dearness pay, Dearness Allowance payable to them and other allowances such as HRA, LTC, and Medical Reimbursement etc. In the case of retired employees and those retiring during the year, the Board has to discharge liabilities towards the pension, gratuity and leave encashment benefits etc, as applicable.
11.2 The Employee cost of PSEB for FY 08-09 is projected at Rs. 2225.01Crores. Employee cost (Actual) for FY 06-07 and revised estimate for FY 07-08 is shown in Table 34.
Table 34: Employee Costs (Rs. Cr)
Employee Costs FY 06-07 (Actual)
FY 07-08 (RE) FY 08-09 (Projected)
Salaries & Allowances Basic Salaries 901.73 918 926Overtime 6.2 9.17 10DA 258.9 376 466Other allowances 148.25 160 170 Bouns /Generation incentive 49.7 52 55Employee Cost of Additional recruited 250 Engineers 0 6 8 Salaries-Total (1) 1364.78 1521.17 1635.00Other Staff Costs 0 0 0Medical reimbursement charges 8.07 9 10Leave Travel Assisstance 3.24 3.5 3.7
Add: BBMB Share 46.94 53 60Staff Welfare Expenses 28.35 29.5 31Payment under Workmen's Compensation Act 0.29 0.3 0.31 Other Staff Cost - Total (2) 86.89 95.3 105.01Terminal Benefits** 392.71 549 600SOLATIUM benefit 20.25 20 20 Sub-Total (3) 412.96 569 620 Gross Employee's Cost (1+2+3+4) 1864.63 2185.47 2360.01Add: Pay and Pension Arrears 0 0 0Less: Capitalization 113.15 125 135Add prior period expenses 2.87 1.48 0 Net Employee's Cost 1754.35 2061.95 2225.01
**includes earned leave encashment
PSEB ARR Petition FY 08-09
Page 46 of 83
Basis for Projections
11.3 PSEB would like to submit justifications for increase in the employee costs and draw the attention of the Commission on the following issues:
(a) Salaries & Allowances: For FY 07-08 revised estimate figures have been arrived at on the basis of six month actual employee cost incurred by the Board for FY 07-08 till Sept’07. Hike in DA for FY 07-08, @ 6% w.e.f from 1st July’07 and additional 6% w.e.f 1st Jan’2008 has been considered in the revised estimate. For FY 08-09 projections, Basic salary has been increased by 3% over FY 07-08(RE) figures as per PSEB Master Scale. Projection of DA for FY 08-09 has been done by considering six-monthly increase @ 6% in Dearness Allowance in accordance with current year.
(i) Over the past few years increases in the DA/allowances of PSEB employees have been at par with the State Government pay and allowances. This is in line with the assurance given by PSEB to the employees at the time of their transfer from PWD Electricity Branch of Government of Punjab to PSEB in 1962-63. Later in 1972, while framing the PSEB Main Service Regulations it was ensured that the service conditions of permanent employees of the erstwhile PWD Electricity Branch transferred to PSEB would not in any way be disadvantageous to these employees.
(ii) The State Government has to allow two installments of DA increase effective in July and January every financial year. PSEB allows DA increase at the same rate to its employees as the increases in pay & allowances to its existing employees has to be at par with the State Government employees. The impact of DA was 11% during 4/07 to 9/07 for the increase in DA installment w.e.f. 1.7.2006 (5%) w.e.f 1.1.2007 (6%) which was only 7% during last corresponding period of 4/06 to 9/06.Impact of 11% is further increased to 11.55% due to release of interim benefit (IR) w.e.f. 1.11.06 which is accounted for. PSEB submits to the Commission to recognize the fact that PSEB has to maintain this pay parity in order to honour the commitment made to the employees. This parity is also required to avoid development of complacency amongst the employees and for the smooth operation of its business without any labor unrest. It is of utmost importance to recognize that the employee’s salaries and wages paid by the Board particularly of the Engineers and skilled personnel are significantly lower that what they are being offered in the private sector and if the employee’s salaries and wages are not maintained there will be large scale efflux of personnel. The employee’s salaries and wages disallowed by the Hon’ble Commission in the past also need to be revisited.
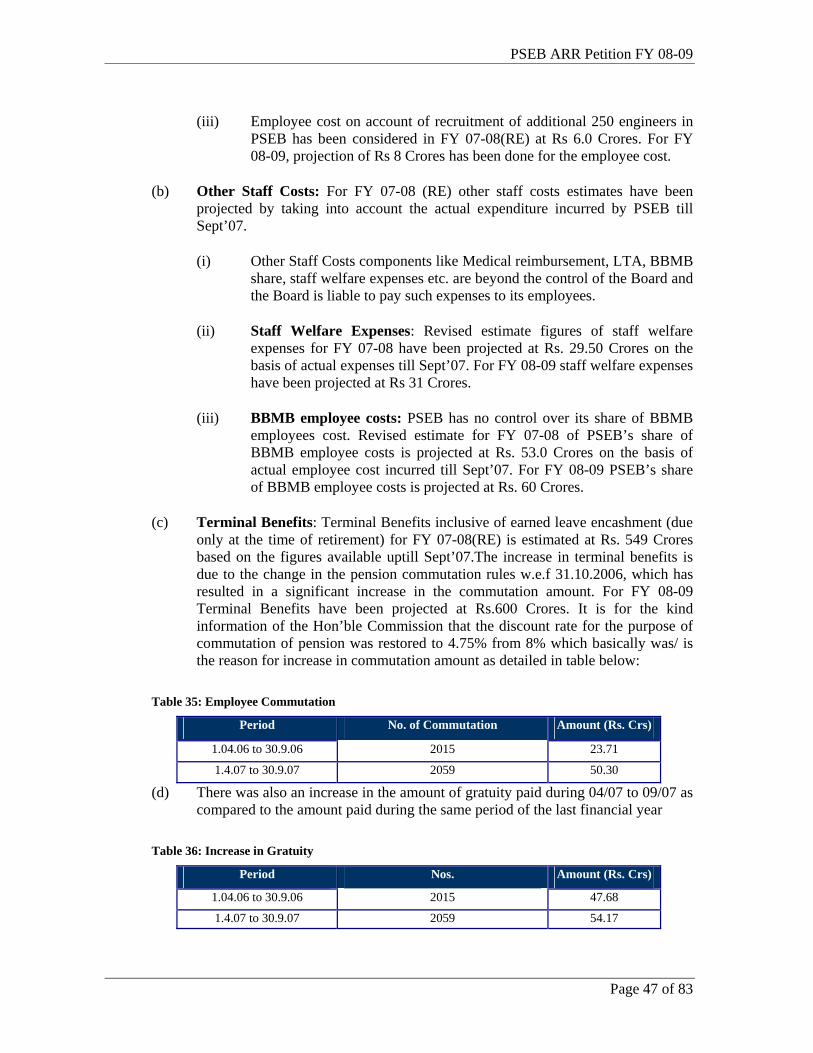
PSEB ARR Petition FY 08-09
Page 47 of 83
(iii) Employee cost on account of recruitment of additional 250 engineers in PSEB has been considered in FY 07-08(RE) at Rs 6.0 Crores. For FY 08-09, projection of Rs 8 Crores has been done for the employee cost.
(b) Other Staff Costs: For FY 07-08 (RE) other staff costs estimates have been projected by taking into account the actual expenditure incurred by PSEB till Sept’07.
(i) Other Staff Costs components like Medical reimbursement, LTA, BBMB share, staff welfare expenses etc. are beyond the control of the Board and the Board is liable to pay such expenses to its employees.
(ii) Staff Welfare Expenses: Revised estimate figures of staff welfare expenses for FY 07-08 have been projected at Rs. 29.50 Crores on the basis of actual expenses till Sept’07. For FY 08-09 staff welfare expenses have been projected at Rs 31 Crores.
(iii) BBMB employee costs: PSEB has no control over its share of BBMB employees cost. Revised estimate for FY 07-08 of PSEB’s share of BBMB employee costs is projected at Rs. 53.0 Crores on the basis of actual employee cost incurred till Sept’07. For FY 08-09 PSEB’s share of BBMB employee costs is projected at Rs. 60 Crores.
(c) Terminal Benefits: Terminal Benefits inclusive of earned leave encashment (due only at the time of retirement) for FY 07-08(RE) is estimated at Rs. 549 Crores based on the figures available uptill Sept’07.The increase in terminal benefits is due to the change in the pension commutation rules w.e.f 31.10.2006, which has resulted in a significant increase in the commutation amount. For FY 08-09 Terminal Benefits have been projected at Rs.600 Crores. It is for the kind information of the Hon’ble Commission that the discount rate for the purpose of commutation of pension was restored to 4.75% from 8% which basically was/ is the reason for increase in commutation amount as detailed in table below:
Table 35: Employee Commutation Period No. of Commutation Amount (Rs. Crs)
1.04.06 to 30.9.06 2015 23.71
1.4.07 to 30.9.07 2059 50.30
(d) There was also an increase in the amount of gratuity paid during 04/07 to 09/07 as compared to the amount paid during the same period of the last financial year
Table 36: Increase in Gratuity
Period Nos. Amount (Rs. Crs)
1.04.06 to 30.9.06 2015 47.68
1.4.07 to 30.9.07 2059 54.17
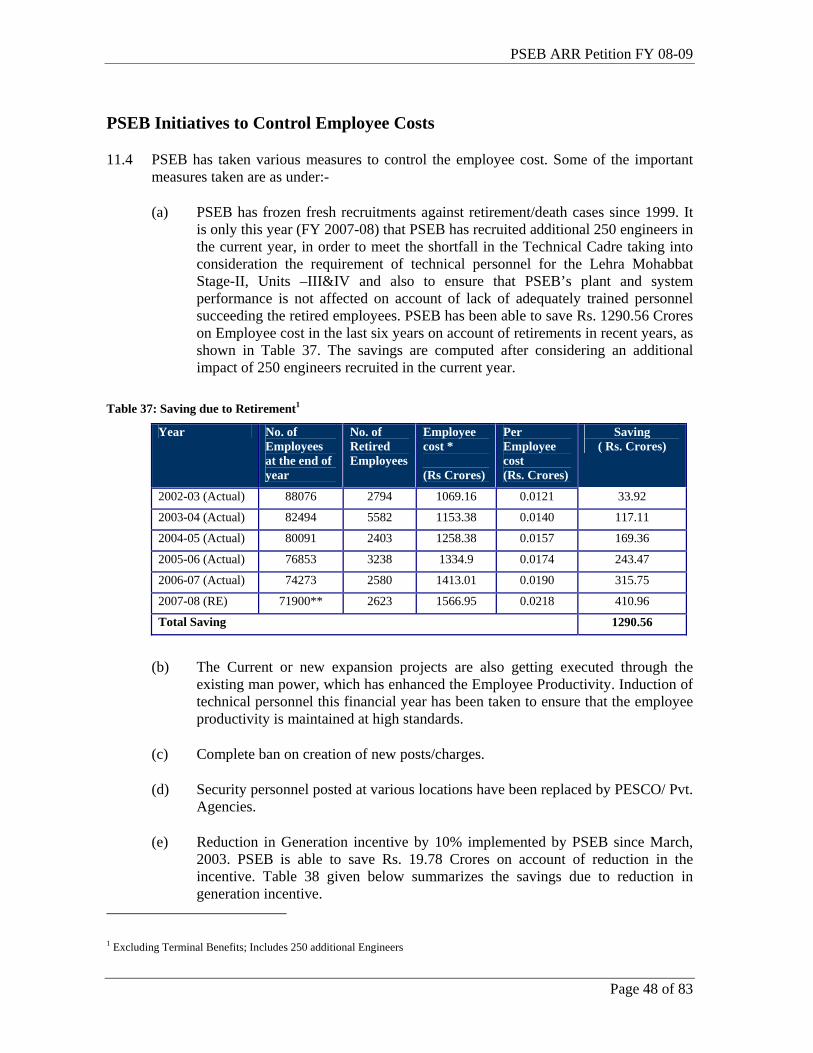
PSEB ARR Petition FY 08-09
Page 48 of 83
PSEB Initiatives to Control Employee Costs
11.4 PSEB has taken various measures to control the employee cost. Some of the important measures taken are as under:-
(a) PSEB has frozen fresh recruitments against retirement/death cases since 1999. It is only this year (FY 2007-08) that PSEB has recruited additional 250 engineers in the current year, in order to meet the shortfall in the Technical Cadre taking into consideration the requirement of technical personnel for the Lehra Mohabbat Stage-II, Units –III&IV and also to ensure that PSEB’s plant and system performance is not affected on account of lack of adequately trained personnel succeeding the retired employees. PSEB has been able to save Rs. 1290.56 Crores on Employee cost in the last six years on account of retirements in recent years, as shown in Table 37. The savings are computed after considering an additional impact of 250 engineers recruited in the current year.
Table 37: Saving due to Retirement1
Year No. of Employees at the end of year
No. of Retired Employees
Employee cost * (Rs Crores)
Per Employee cost (Rs. Crores)
Saving ( Rs. Crores)
2002-03 (Actual) 88076 2794 1069.16 0.0121 33.92
2003-04 (Actual) 82494 5582 1153.38 0.0140 117.11
2004-05 (Actual) 80091 2403 1258.38 0.0157 169.36
2005-06 (Actual) 76853 3238 1334.9 0.0174 243.47
2006-07 (Actual) 74273 2580 1413.01 0.0190 315.75
2007-08 (RE) 71900** 2623 1566.95 0.0218 410.96
Total Saving 1290.56
(b) The Current or new expansion projects are also getting executed through the existing man power, which has enhanced the Employee Productivity. Induction of technical personnel this financial year has been taken to ensure that the employee productivity is maintained at high standards.
(c) Complete ban on creation of new posts/charges.
(d) Security personnel posted at various locations have been replaced by PESCO/ Pvt. Agencies.
(e) Reduction in Generation incentive by 10% implemented by PSEB since March, 2003. PSEB is able to save Rs. 19.78 Crores on account of reduction in the incentive. Table 38 given below summarizes the savings due to reduction in generation incentive.
1 Excluding Terminal Benefits; Includes 250 additional Engineers
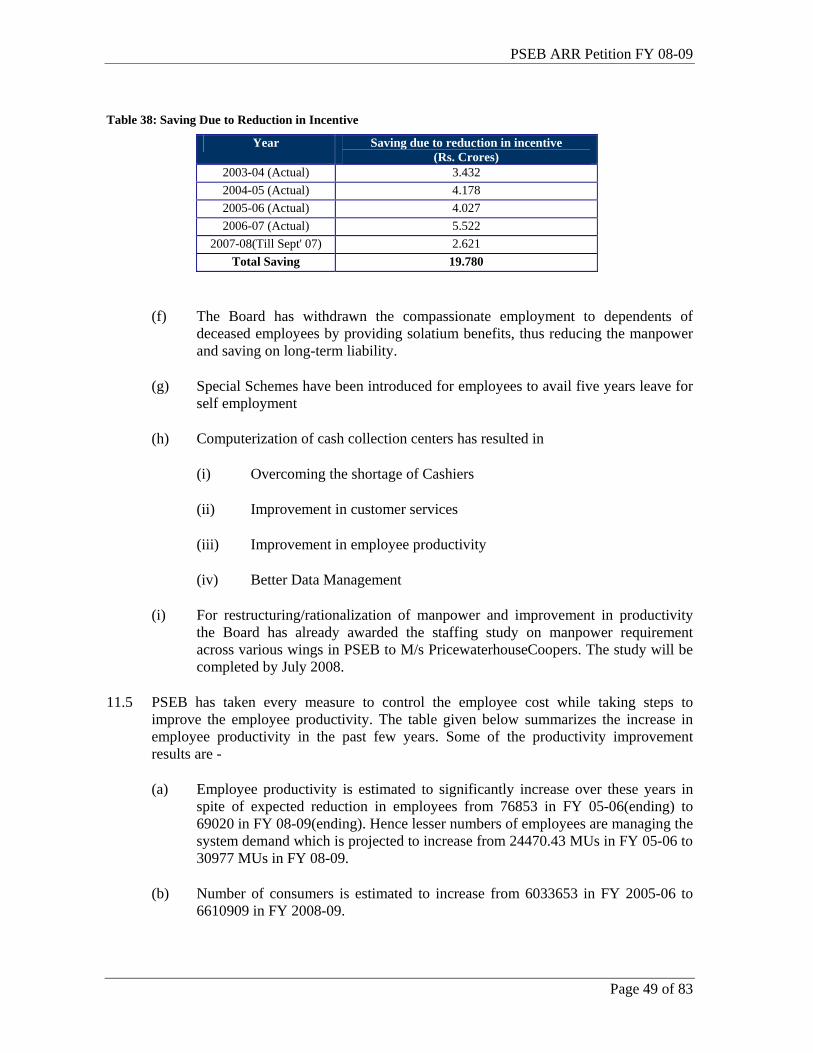
PSEB ARR Petition FY 08-09
Page 49 of 83
Table 38: Saving Due to Reduction in Incentive
Year Saving due to reduction in incentive (Rs. Crores)
2003-04 (Actual) 3.432 2004-05 (Actual) 4.178 2005-06 (Actual) 4.027 2006-07 (Actual) 5.522
2007-08(Till Sept' 07) 2.621 Total Saving 19.780
(f) The Board has withdrawn the compassionate employment to dependents of deceased employees by providing solatium benefits, thus reducing the manpower and saving on long-term liability.
(g) Special Schemes have been introduced for employees to avail five years leave for self employment
(h) Computerization of cash collection centers has resulted in
(i) Overcoming the shortage of Cashiers
(ii) Improvement in customer services
(iii) Improvement in employee productivity
(iv) Better Data Management
(i) For restructuring/rationalization of manpower and improvement in productivity the Board has already awarded the staffing study on manpower requirement across various wings in PSEB to M/s PricewaterhouseCoopers. The study will be completed by July 2008.
11.5 PSEB has taken every measure to control the employee cost while taking steps to improve the employee productivity. The table given below summarizes the increase in employee productivity in the past few years. Some of the productivity improvement results are -
(a) Employee productivity is estimated to significantly increase over these years in spite of expected reduction in employees from 76853 in FY 05-06(ending) to 69020 in FY 08-09(ending). Hence lesser numbers of employees are managing the system demand which is projected to increase from 24470.43 MUs in FY 05-06 to 30977 MUs in FY 08-09.
(b) Number of consumers is estimated to increase from 6033653 in FY 2005-06 to 6610909 in FY 2008-09.
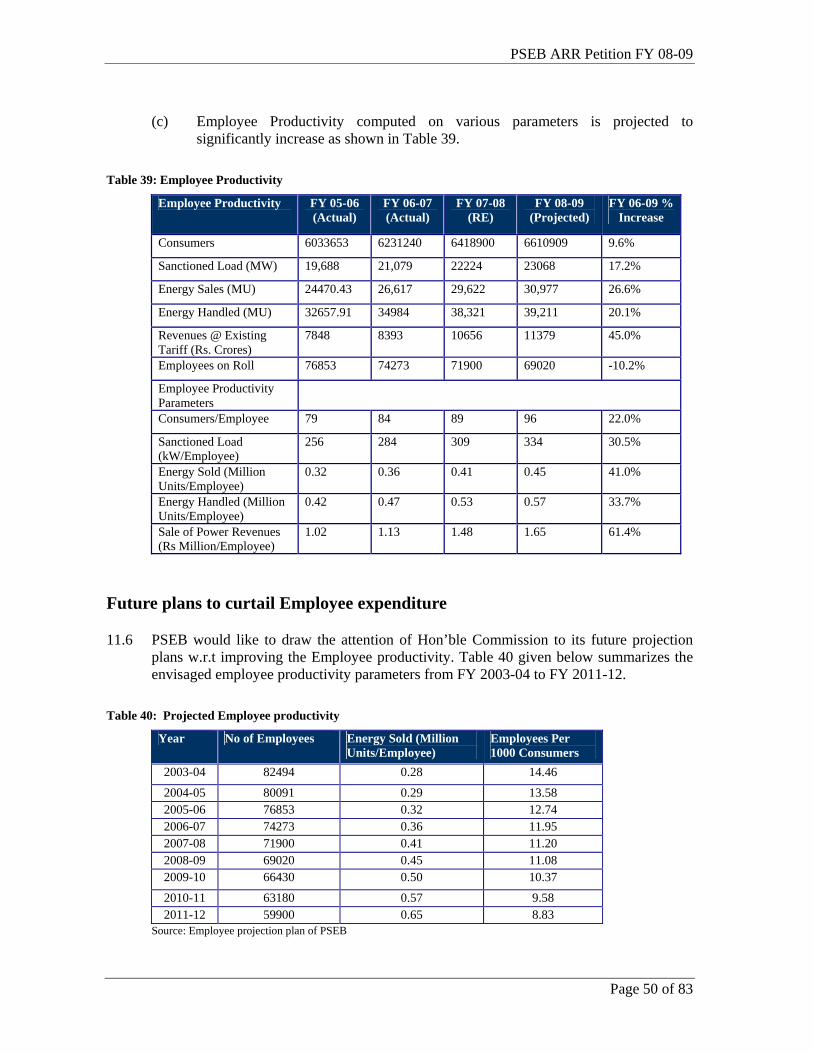
PSEB ARR Petition FY 08-09
Page 50 of 83
(c) Employee Productivity computed on various parameters is projected to significantly increase as shown in Table 39.
Table 39: Employee Productivity
Employee Productivity FY 05-06 (Actual)
FY 06-07 (Actual)
FY 07-08 (RE)
FY 08-09 (Projected)
FY 06-09 % Increase
Consumers 6033653 6231240 6418900 6610909 9.6%
Sanctioned Load (MW) 19,688 21,079 22224 23068 17.2%
Energy Sales (MU) 24470.43 26,617 29,622 30,977 26.6%
Energy Handled (MU) 32657.91 34984 38,321 39,211 20.1%
Revenues @ Existing Tariff (Rs. Crores)
7848 8393 10656 11379 45.0%
Employees on Roll 76853 74273 71900 69020 -10.2%
Employee Productivity Parameters
Consumers/Employee 79 84 89 96 22.0%
Sanctioned Load (kW/Employee)
256 284 309 334 30.5%
Energy Sold (Million Units/Employee)
0.32 0.36 0.41 0.45 41.0%
Energy Handled (Million Units/Employee)
0.42 0.47 0.53 0.57 33.7%
Sale of Power Revenues (Rs Million/Employee)
1.02 1.13 1.48 1.65 61.4%
Future plans to curtail Employee expenditure
11.6 PSEB would like to draw the attention of Hon’ble Commission to its future projection plans w.r.t improving the Employee productivity. Table 40 given below summarizes the envisaged employee productivity parameters from FY 2003-04 to FY 2011-12.
Table 40: Projected Employee productivity
Year No of Employees Energy Sold (Million Units/Employee)
Employees Per 1000 Consumers
2003-04 82494 0.28 14.46
2004-05 80091 0.29 13.58 2005-06 76853 0.32 12.74 2006-07 74273 0.36 11.95 2007-08 71900 0.41 11.20 2008-09 69020 0.45 11.08 2009-10 66430 0.50 10.37
2010-11 63180 0.57 9.58 2011-12 59900 0.65 8.83
Source: Employee projection plan of PSEB
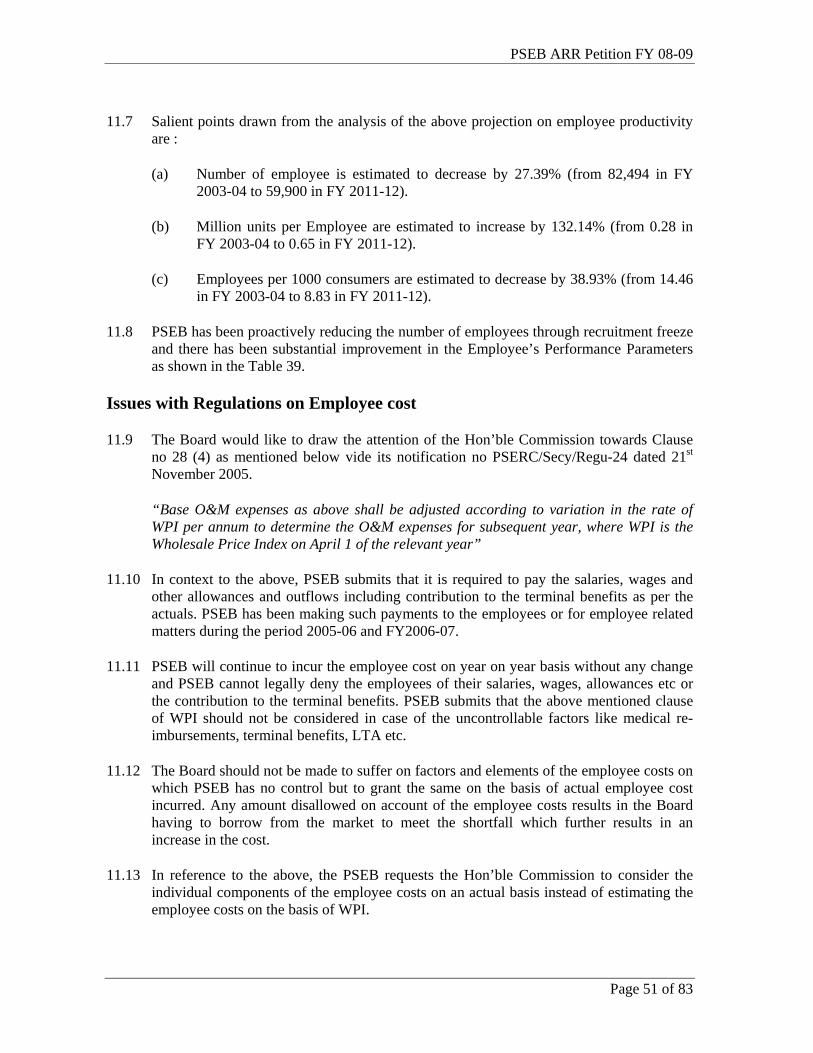
PSEB ARR Petition FY 08-09
Page 51 of 83
11.7 Salient points drawn from the analysis of the above projection on employee productivity are :
(a) Number of employee is estimated to decrease by 27.39% (from 82,494 in FY 2003-04 to 59,900 in FY 2011-12).
(b) Million units per Employee are estimated to increase by 132.14% (from 0.28 in FY 2003-04 to 0.65 in FY 2011-12).
(c) Employees per 1000 consumers are estimated to decrease by 38.93% (from 14.46 in FY 2003-04 to 8.83 in FY 2011-12).
11.8 PSEB has been proactively reducing the number of employees through recruitment freeze and there has been substantial improvement in the Employee’s Performance Parameters as shown in the Table 39.
Issues with Regulations on Employee cost
11.9 The Board would like to draw the attention of the Hon’ble Commission towards Clause no 28 (4) as mentioned below vide its notification no PSERC/Secy/Regu-24 dated 21st November 2005.
“Base O&M expenses as above shall be adjusted according to variation in the rate of WPI per annum to determine the O&M expenses for subsequent year, where WPI is the Wholesale Price Index on April 1 of the relevant year”
11.10 In context to the above, PSEB submits that it is required to pay the salaries, wages and other allowances and outflows including contribution to the terminal benefits as per the actuals. PSEB has been making such payments to the employees or for employee related matters during the period 2005-06 and FY2006-07.
11.11 PSEB will continue to incur the employee cost on year on year basis without any change and PSEB cannot legally deny the employees of their salaries, wages, allowances etc or the contribution to the terminal benefits. PSEB submits that the above mentioned clause of WPI should not be considered in case of the uncontrollable factors like medical re-imbursements, terminal benefits, LTA etc.
11.12 The Board should not be made to suffer on factors and elements of the employee costs on which PSEB has no control but to grant the same on the basis of actual employee cost incurred. Any amount disallowed on account of the employee costs results in the Board having to borrow from the market to meet the shortfall which further results in an increase in the cost.
11.13 In reference to the above, the PSEB requests the Hon’ble Commission to consider the individual components of the employee costs on an actual basis instead of estimating the employee costs on the basis of WPI.
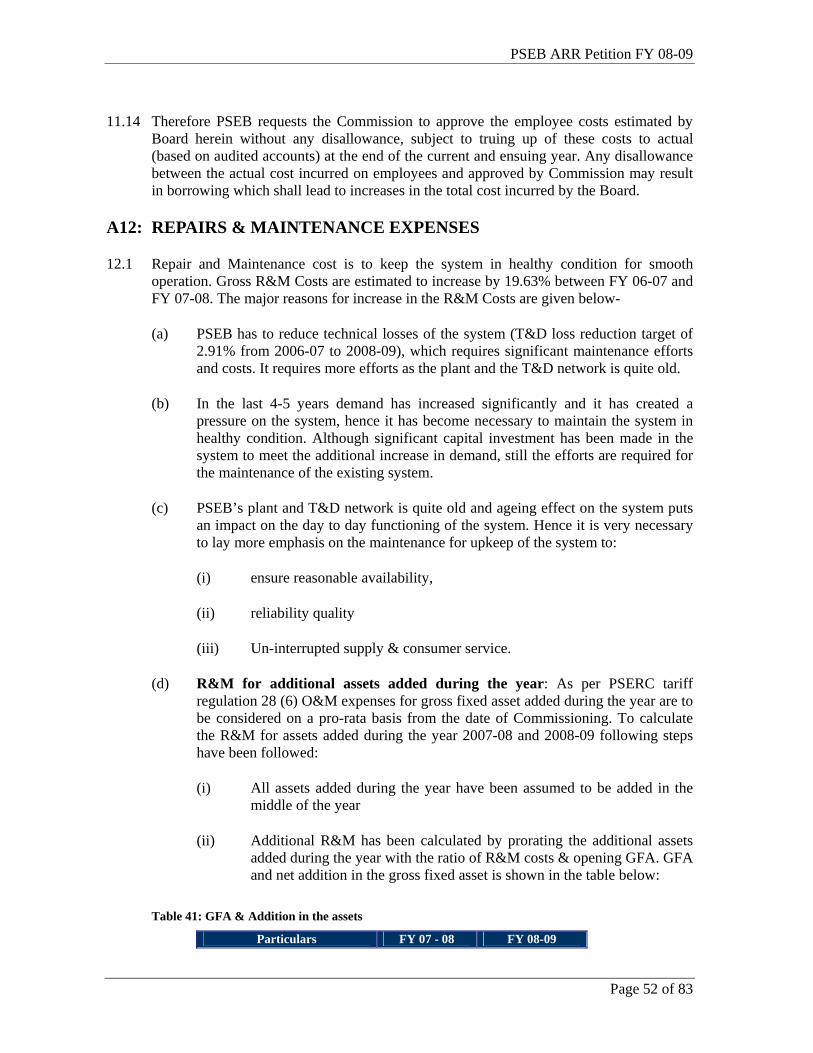
PSEB ARR Petition FY 08-09
Page 52 of 83
11.14 Therefore PSEB requests the Commission to approve the employee costs estimated by Board herein without any disallowance, subject to truing up of these costs to actual (based on audited accounts) at the end of the current and ensuing year. Any disallowance between the actual cost incurred on employees and approved by Commission may result in borrowing which shall lead to increases in the total cost incurred by the Board.
A12: REPAIRS & MAINTENANCE EXPENSES
12.1 Repair and Maintenance cost is to keep the system in healthy condition for smooth operation. Gross R&M Costs are estimated to increase by 19.63% between FY 06-07 and FY 07-08. The major reasons for increase in the R&M Costs are given below-
(a) PSEB has to reduce technical losses of the system (T&D loss reduction target of 2.91% from 2006-07 to 2008-09), which requires significant maintenance efforts and costs. It requires more efforts as the plant and the T&D network is quite old.
(b) In the last 4-5 years demand has increased significantly and it has created a pressure on the system, hence it has become necessary to maintain the system in healthy condition. Although significant capital investment has been made in the system to meet the additional increase in demand, still the efforts are required for the maintenance of the existing system.
(c) PSEB’s plant and T&D network is quite old and ageing effect on the system puts an impact on the day to day functioning of the system. Hence it is very necessary to lay more emphasis on the maintenance for upkeep of the system to:
(i) ensure reasonable availability,
(ii) reliability quality
(iii) Un-interrupted supply & consumer service.
(d) R&M for additional assets added during the year: As per PSERC tariff regulation 28 (6) O&M expenses for gross fixed asset added during the year are to be considered on a pro-rata basis from the date of Commissioning. To calculate the R&M for assets added during the year 2007-08 and 2008-09 following steps have been followed:
(i) All assets added during the year have been assumed to be added in the middle of the year
(ii) Additional R&M has been calculated by prorating the additional assets added during the year with the ratio of R&M costs & opening GFA. GFA and net addition in the gross fixed asset is shown in the table below:
Table 41: GFA & Addition in the assets
Particulars FY 07 - 08 FY 08-09
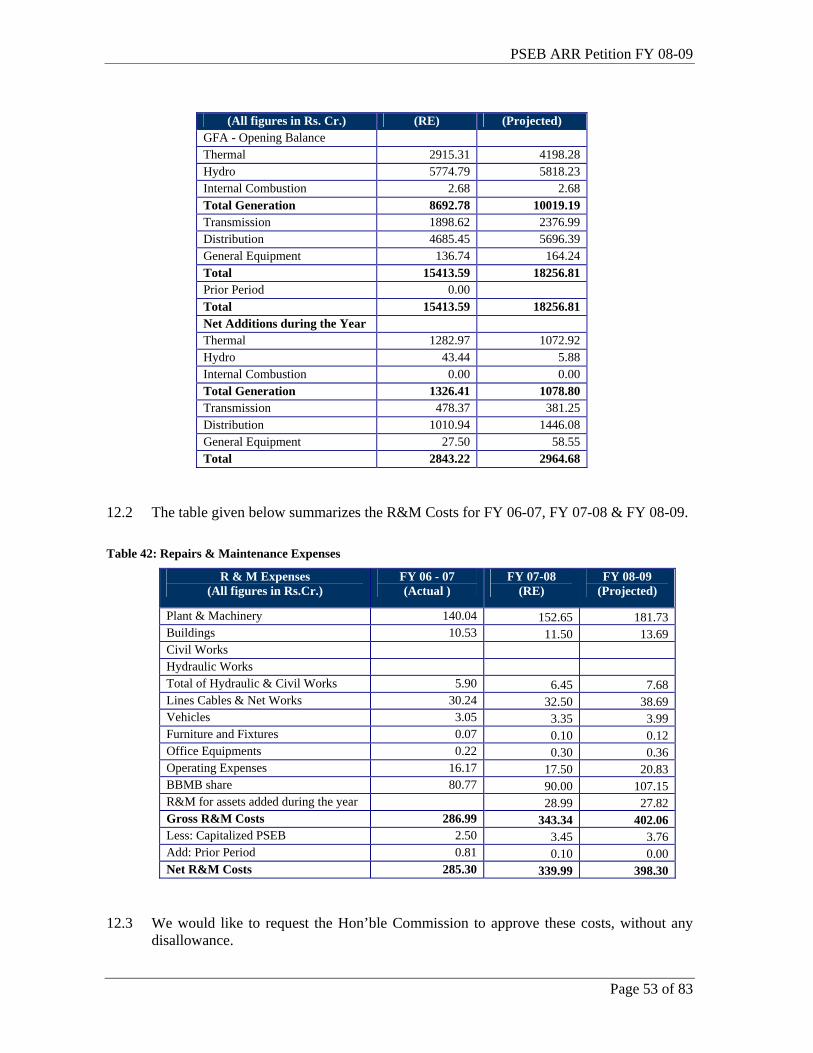
PSEB ARR Petition FY 08-09
Page 53 of 83
(All figures in Rs. Cr.) (RE) (Projected) GFA - Opening Balance Thermal 2915.31 4198.28 Hydro 5774.79 5818.23 Internal Combustion 2.68 2.68 Total Generation 8692.78 10019.19 Transmission 1898.62 2376.99 Distribution 4685.45 5696.39 General Equipment 136.74 164.24 Total 15413.59 18256.81 Prior Period 0.00 Total 15413.59 18256.81 Net Additions during the Year Thermal 1282.97 1072.92 Hydro 43.44 5.88 Internal Combustion 0.00 0.00 Total Generation 1326.41 1078.80 Transmission 478.37 381.25 Distribution 1010.94 1446.08 General Equipment 27.50 58.55 Total 2843.22 2964.68
12.2 The table given below summarizes the R&M Costs for FY 06-07, FY 07-08 & FY 08-09.
Table 42: Repairs & Maintenance Expenses
R & M Expenses (All figures in Rs.Cr.)
FY 06 - 07 (Actual )
FY 07-08 (RE)
FY 08-09 (Projected)
Plant & Machinery 140.04 152.65 181.73 Buildings 10.53 11.50 13.69 Civil Works Hydraulic Works Total of Hydraulic & Civil Works 5.90 6.45 7.68 Lines Cables & Net Works 30.24 32.50 38.69 Vehicles 3.05 3.35 3.99 Furniture and Fixtures 0.07 0.10 0.12 Office Equipments 0.22 0.30 0.36 Operating Expenses 16.17 17.50 20.83 BBMB share 80.77 90.00 107.15 R&M for assets added during the year 28.99 27.82 Gross R&M Costs 286.99 343.34 402.06 Less: Capitalized PSEB 2.50 3.45 3.76 Add: Prior Period 0.81 0.10 0.00 Net R&M Costs 285.30 339.99 398.30
12.3 We would like to request the Hon’ble Commission to approve these costs, without any disallowance.
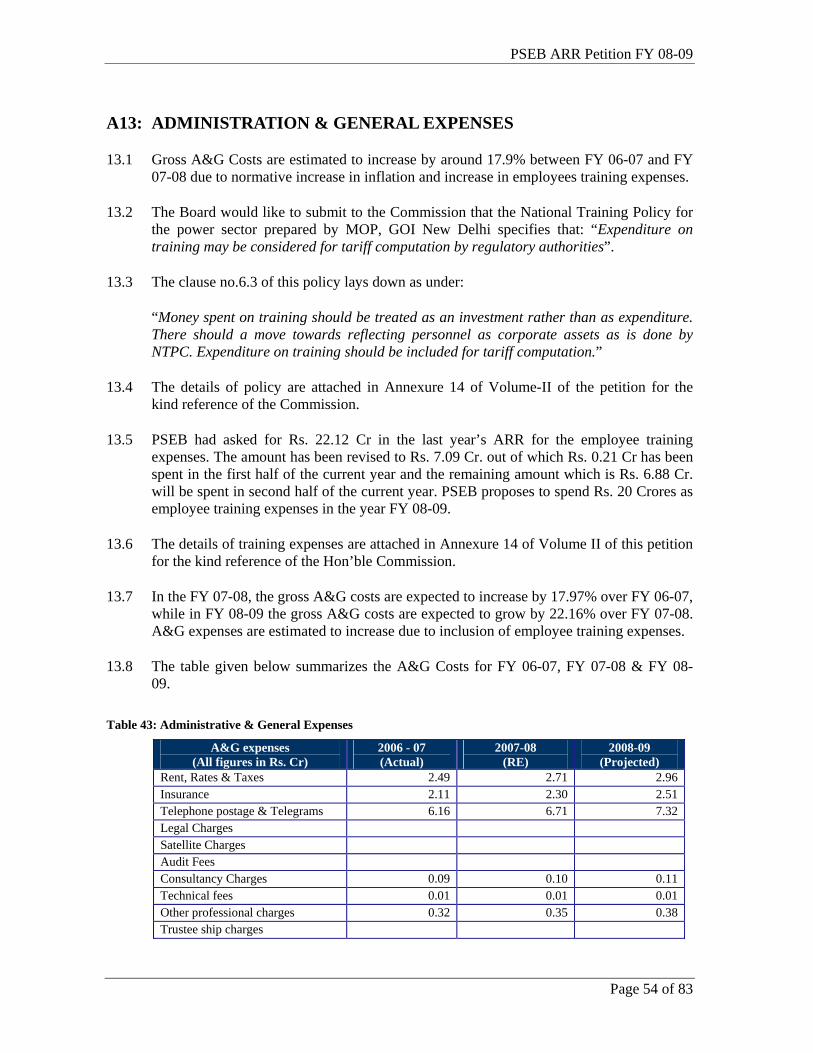
PSEB ARR Petition FY 08-09
Page 54 of 83
A13: ADMINISTRATION & GENERAL EXPENSES
13.1 Gross A&G Costs are estimated to increase by around 17.9% between FY 06-07 and FY 07-08 due to normative increase in inflation and increase in employees training expenses.
13.2 The Board would like to submit to the Commission that the National Training Policy for the power sector prepared by MOP, GOI New Delhi specifies that: “Expenditure on training may be considered for tariff computation by regulatory authorities”.
13.3 The clause no.6.3 of this policy lays down as under:
“Money spent on training should be treated as an investment rather than as expenditure. There should a move towards reflecting personnel as corporate assets as is done by NTPC. Expenditure on training should be included for tariff computation.”
13.4 The details of policy are attached in Annexure 14 of Volume-II of the petition for the kind reference of the Commission.
13.5 PSEB had asked for Rs. 22.12 Cr in the last year’s ARR for the employee training expenses. The amount has been revised to Rs. 7.09 Cr. out of which Rs. 0.21 Cr has been spent in the first half of the current year and the remaining amount which is Rs. 6.88 Cr. will be spent in second half of the current year. PSEB proposes to spend Rs. 20 Crores as employee training expenses in the year FY 08-09.
13.6 The details of training expenses are attached in Annexure 14 of Volume II of this petition for the kind reference of the Hon’ble Commission.
13.7 In the FY 07-08, the gross A&G costs are expected to increase by 17.97% over FY 06-07, while in FY 08-09 the gross A&G costs are expected to grow by 22.16% over FY 07-08. A&G expenses are estimated to increase due to inclusion of employee training expenses.
13.8 The table given below summarizes the A&G Costs for FY 06-07, FY 07-08 & FY 08- 09.
Table 43: Administrative & General Expenses
A&G expenses (All figures in Rs. Cr)
2006 - 07 (Actual)
2007-08 (RE)
2008-09 (Projected)
Rent, Rates & Taxes 2.49 2.71 2.96 Insurance 2.11 2.30 2.51 Telephone postage & Telegrams 6.16 6.71 7.32 Legal Charges Satellite Charges Audit Fees Consultancy Charges 0.09 0.10 0.11 Technical fees 0.01 0.01 0.01 Other professional charges 0.32 0.35 0.38 Trustee ship charges
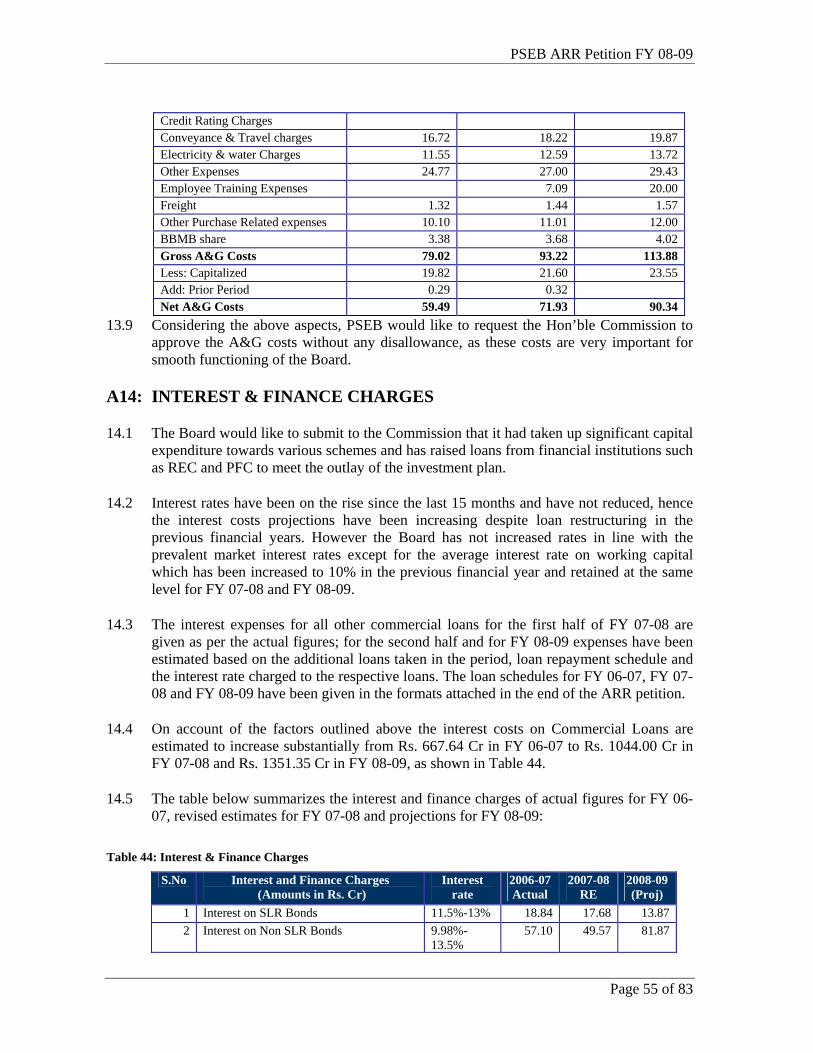
PSEB ARR Petition FY 08-09
Page 55 of 83
Credit Rating Charges Conveyance & Travel charges 16.72 18.22 19.87 Electricity & water Charges 11.55 12.59 13.72 Other Expenses 24.77 27.00 29.43 Employee Training Expenses 7.09 20.00 Freight 1.32 1.44 1.57 Other Purchase Related expenses 10.10 11.01 12.00 BBMB share 3.38 3.68 4.02 Gross A&G Costs 79.02 93.22 113.88 Less: Capitalized 19.82 21.60 23.55 Add: Prior Period 0.29 0.32 Net A&G Costs 59.49 71.93 90.34
13.9 Considering the above aspects, PSEB would like to request the Hon’ble Commission to approve the A&G costs without any disallowance, as these costs are very important for smooth functioning of the Board.
A14: INTEREST & FINANCE CHARGES
14.1 The Board would like to submit to the Commission that it had taken up significant capital expenditure towards various schemes and has raised loans from financial institutions such as REC and PFC to meet the outlay of the investment plan.
14.2 Interest rates have been on the rise since the last 15 months and have not reduced, hence the interest costs projections have been increasing despite loan restructuring in the previous financial years. However the Board has not increased rates in line with the prevalent market interest rates except for the average interest rate on working capital which has been increased to 10% in the previous financial year and retained at the same level for FY 07-08 and FY 08-09.
14.3 The interest expenses for all other commercial loans for the first half of FY 07-08 are given as per the actual figures; for the second half and for FY 08-09 expenses have been estimated based on the additional loans taken in the period, loan repayment schedule and the interest rate charged to the respective loans. The loan schedules for FY 06-07, FY 07-08 and FY 08-09 have been given in the formats attached in the end of the ARR petition.
14.4 On account of the factors outlined above the interest costs on Commercial Loans are estimated to increase substantially from Rs. 667.64 Cr in FY 06-07 to Rs. 1044.00 Cr in FY 07-08 and Rs. 1351.35 Cr in FY 08-09, as shown in Table 44.
14.5 The table below summarizes the interest and finance charges of actual figures for FY 06-07, revised estimates for FY 07-08 and projections for FY 08-09:
Table 44: Interest & Finance Charges
S.No Interest and Finance Charges (Amounts in Rs. Cr)
Interest rate
2006-07 Actual
2007-08 RE
2008-09 (Proj)
1 Interest on SLR Bonds 11.5%-13% 18.84 17.68 13.87 2 Interest on Non SLR Bonds 9.98%-
13.5% 57.10 49.57 81.87
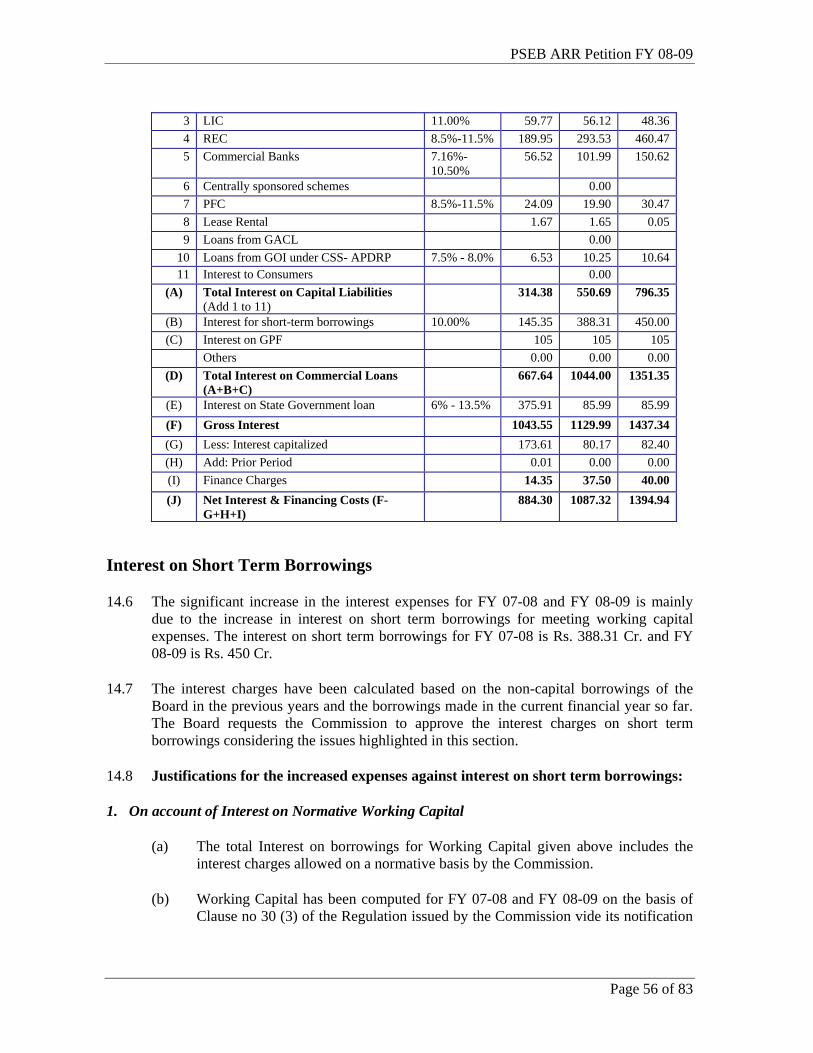
PSEB ARR Petition FY 08-09
Page 56 of 83
3 LIC 11.00% 59.77 56.12 48.36 4 REC 8.5%-11.5% 189.95 293.53 460.47 5 Commercial Banks 7.16%-
10.50% 56.52 101.99 150.62
6 Centrally sponsored schemes 0.00 7 PFC 8.5%-11.5% 24.09 19.90 30.47 8 Lease Rental 1.67 1.65 0.05 9 Loans from GACL 0.00
10 Loans from GOI under CSS- APDRP 7.5% - 8.0% 6.53 10.25 10.64 11 Interest to Consumers 0.00
(A) Total Interest on Capital Liabilities (Add 1 to 11)
314.38 550.69 796.35
(B) Interest for short-term borrowings 10.00% 145.35 388.31 450.00 (C) Interest on GPF 105 105 105
Others 0.00 0.00 0.00 (D) Total Interest on Commercial Loans
(A+B+C) 667.64 1044.00 1351.35
(E) Interest on State Government loan 6% - 13.5% 375.91 85.99 85.99 (F) Gross Interest 1043.55 1129.99 1437.34 (G) Less: Interest capitalized 173.61 80.17 82.40 (H) Add: Prior Period 0.01 0.00 0.00 (I) Finance Charges 14.35 37.50 40.00 (J) Net Interest & Financing Costs (F-
G+H+I) 884.30 1087.32 1394.94
Interest on Short Term Borrowings
14.6 The significant increase in the interest expenses for FY 07-08 and FY 08-09 is mainly due to the increase in interest on short term borrowings for meeting working capital expenses. The interest on short term borrowings for FY 07-08 is Rs. 388.31 Cr. and FY 08-09 is Rs. 450 Cr.
14.7 The interest charges have been calculated based on the non-capital borrowings of the Board in the previous years and the borrowings made in the current financial year so far. The Board requests the Commission to approve the interest charges on short term borrowings considering the issues highlighted in this section.
14.8 Justifications for the increased expenses against interest on short term borrowings:
1. On account of Interest on Normative Working Capital
(a) The total Interest on borrowings for Working Capital given above includes the interest charges allowed on a normative basis by the Commission.
(b) Working Capital has been computed for FY 07-08 and FY 08-09 on the basis of Clause no 30 (3) of the Regulation issued by the Commission vide its notification
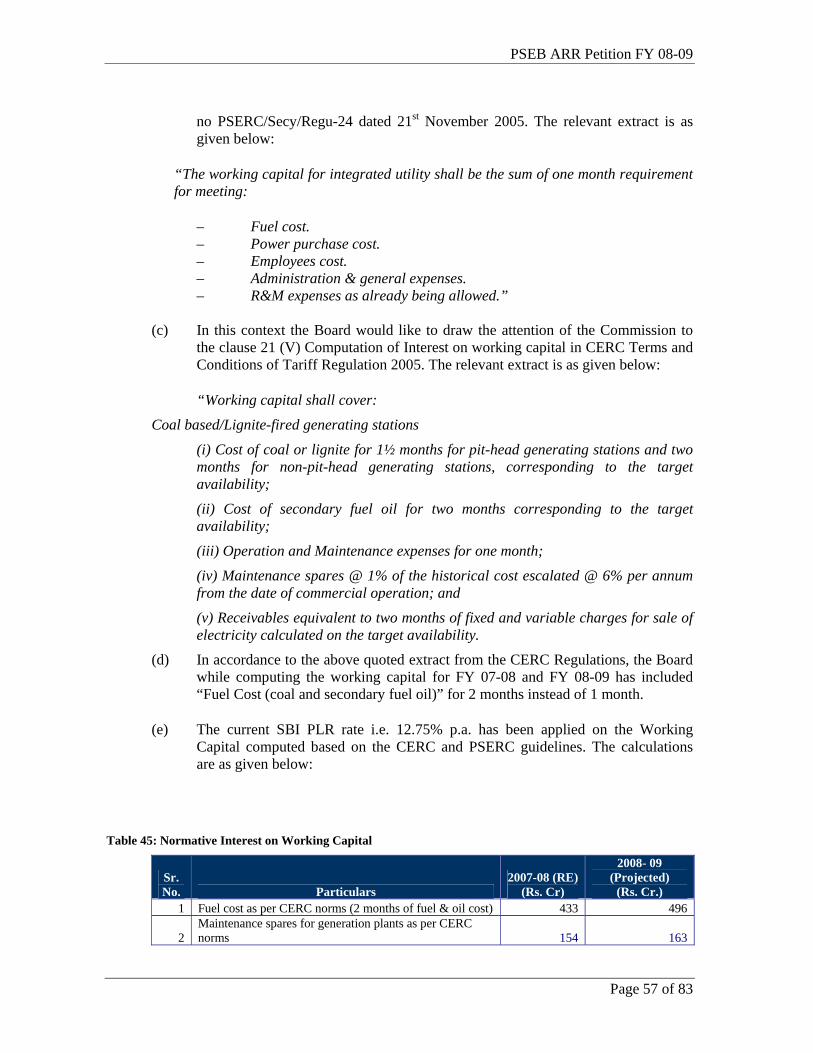
PSEB ARR Petition FY 08-09
Page 57 of 83
no PSERC/Secy/Regu-24 dated 21st November 2005. The relevant extract is as given below:
“The working capital for integrated utility shall be the sum of one month requirement for meeting:
– Fuel cost. – Power purchase cost. – Employees cost. – Administration & general expenses. – R&M expenses as already being allowed.”
(c) In this context the Board would like to draw the attention of the Commission to
the clause 21 (V) Computation of Interest on working capital in CERC Terms and Conditions of Tariff Regulation 2005. The relevant extract is as given below:
“Working capital shall cover:
Coal based/Lignite-fired generating stations
(i) Cost of coal or lignite for 1½ months for pit-head generating stations and two months for non-pit-head generating stations, corresponding to the target availability;
(ii) Cost of secondary fuel oil for two months corresponding to the target availability;
(iii) Operation and Maintenance expenses for one month;
(iv) Maintenance spares @ 1% of the historical cost escalated @ 6% per annum from the date of commercial operation; and
(v) Receivables equivalent to two months of fixed and variable charges for sale of electricity calculated on the target availability.
(d) In accordance to the above quoted extract from the CERC Regulations, the Board while computing the working capital for FY 07-08 and FY 08-09 has included “Fuel Cost (coal and secondary fuel oil)” for 2 months instead of 1 month.
(e) The current SBI PLR rate i.e. 12.75% p.a. has been applied on the Working Capital computed based on the CERC and PSERC guidelines. The calculations are as given below:
Table 45: Normative Interest on Working Capital
Sr. No. Particulars
2007-08 (RE) (Rs. Cr)
2008- 09 (Projected)
(Rs. Cr.) 1 Fuel cost as per CERC norms (2 months of fuel & oil cost) 433 496
2 Maintenance spares for generation plants as per CERC norms 154 163
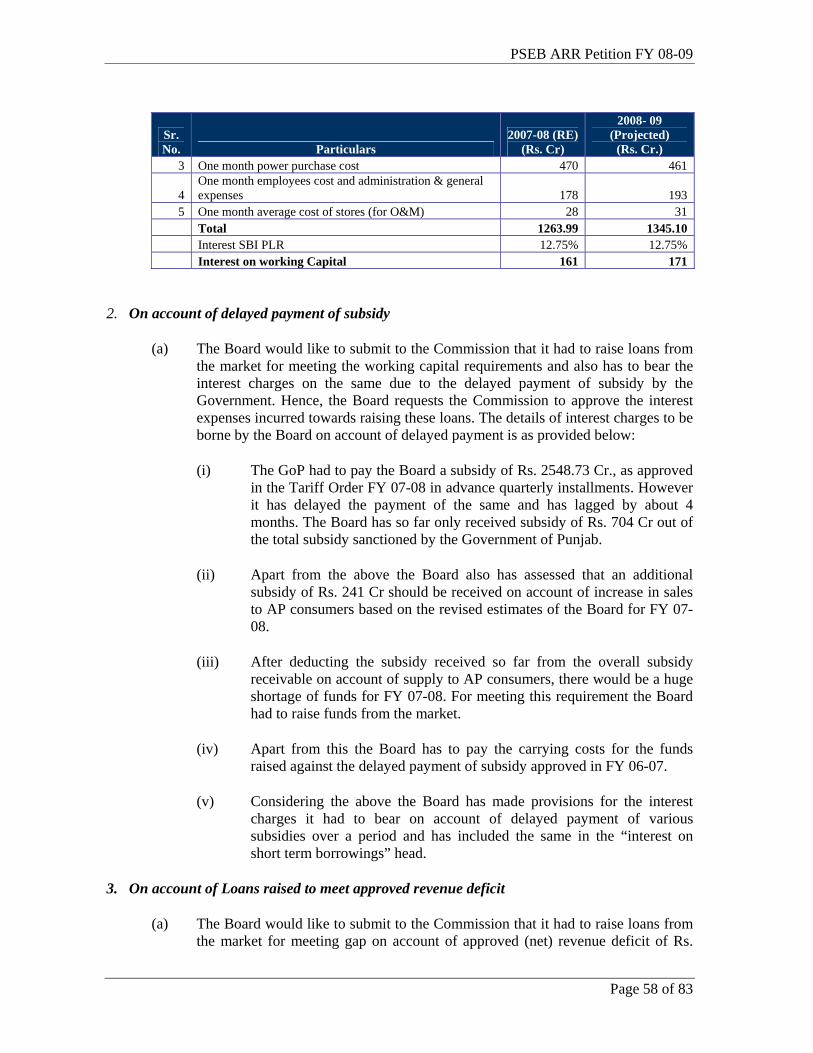
PSEB ARR Petition FY 08-09
Page 58 of 83
Sr. No. Particulars
2007-08 (RE) (Rs. Cr)
2008- 09 (Projected)
(Rs. Cr.) 3 One month power purchase cost 470 461
4 One month employees cost and administration & general expenses 178 193
5 One month average cost of stores (for O&M) 28 31 Total 1263.99 1345.10 Interest SBI PLR 12.75% 12.75% Interest on working Capital 161 171
2. On account of delayed payment of subsidy
(a) The Board would like to submit to the Commission that it had to raise loans from the market for meeting the working capital requirements and also has to bear the interest charges on the same due to the delayed payment of subsidy by the Government. Hence, the Board requests the Commission to approve the interest expenses incurred towards raising these loans. The details of interest charges to be borne by the Board on account of delayed payment is as provided below:
(i) The GoP had to pay the Board a subsidy of Rs. 2548.73 Cr., as approved in the Tariff Order FY 07-08 in advance quarterly installments. However it has delayed the payment of the same and has lagged by about 4 months. The Board has so far only received subsidy of Rs. 704 Cr out of the total subsidy sanctioned by the Government of Punjab.
(ii) Apart from the above the Board also has assessed that an additional subsidy of Rs. 241 Cr should be received on account of increase in sales to AP consumers based on the revised estimates of the Board for FY 07-08.
(iii) After deducting the subsidy received so far from the overall subsidy receivable on account of supply to AP consumers, there would be a huge shortage of funds for FY 07-08. For meeting this requirement the Board had to raise funds from the market.
(iv) Apart from this the Board has to pay the carrying costs for the funds raised against the delayed payment of subsidy approved in FY 06-07.
(v) Considering the above the Board has made provisions for the interest charges it had to bear on account of delayed payment of various subsidies over a period and has included the same in the “interest on short term borrowings” head.
3. On account of Loans raised to meet approved revenue deficit
(a) The Board would like to submit to the Commission that it had to raise loans from the market for meeting gap on account of approved (net) revenue deficit of Rs.
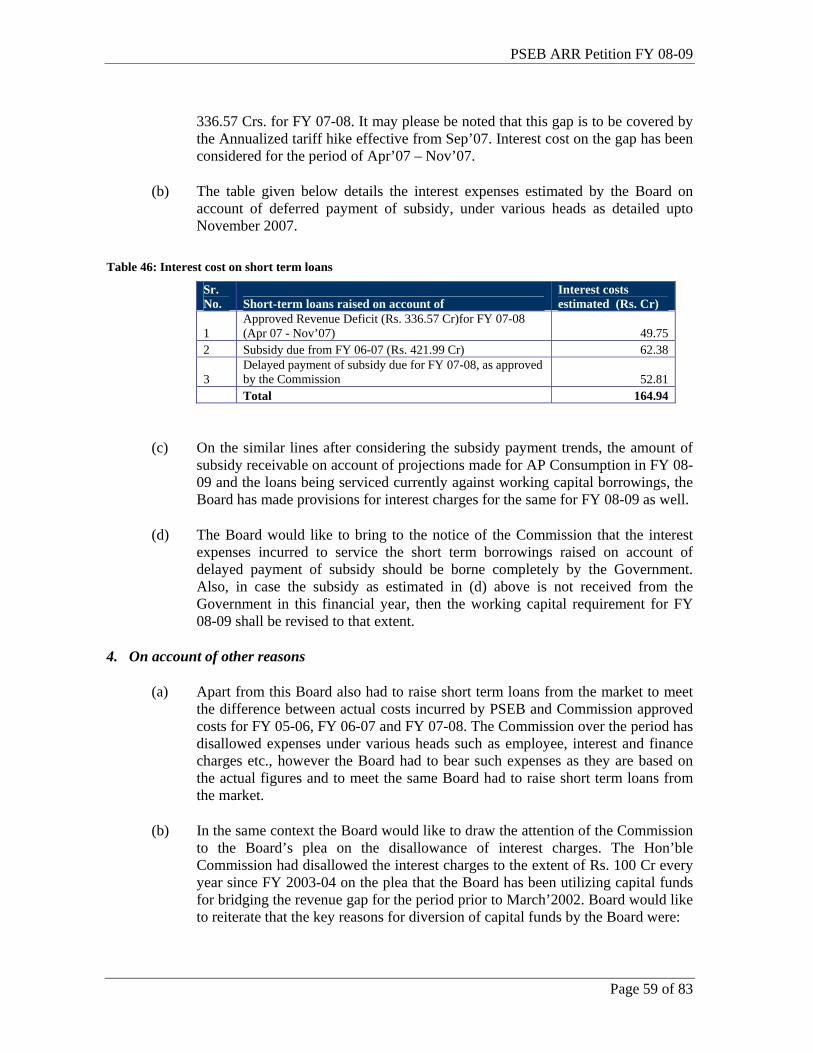
PSEB ARR Petition FY 08-09
Page 59 of 83
336.57 Crs. for FY 07-08. It may please be noted that this gap is to be covered by the Annualized tariff hike effective from Sep’07. Interest cost on the gap has been considered for the period of Apr’07 – Nov’07.
(b) The table given below details the interest expenses estimated by the Board on account of deferred payment of subsidy, under various heads as detailed upto November 2007.
Table 46: Interest cost on short term loans
Sr. No. Short-term loans raised on account of
Interest costs estimated (Rs. Cr)
1 Approved Revenue Deficit (Rs. 336.57 Cr)for FY 07-08 (Apr 07 - Nov’07) 49.75
2 Subsidy due from FY 06-07 (Rs. 421.99 Cr) 62.38
3 Delayed payment of subsidy due for FY 07-08, as approved by the Commission 52.81
Total 164.94
(c) On the similar lines after considering the subsidy payment trends, the amount of subsidy receivable on account of projections made for AP Consumption in FY 08-09 and the loans being serviced currently against working capital borrowings, the Board has made provisions for interest charges for the same for FY 08-09 as well.
(d) The Board would like to bring to the notice of the Commission that the interest expenses incurred to service the short term borrowings raised on account of delayed payment of subsidy should be borne completely by the Government. Also, in case the subsidy as estimated in (d) above is not received from the Government in this financial year, then the working capital requirement for FY 08-09 shall be revised to that extent.
4. On account of other reasons
(a) Apart from this Board also had to raise short term loans from the market to meet the difference between actual costs incurred by PSEB and Commission approved costs for FY 05-06, FY 06-07 and FY 07-08. The Commission over the period has disallowed expenses under various heads such as employee, interest and finance charges etc., however the Board had to bear such expenses as they are based on the actual figures and to meet the same Board had to raise short term loans from the market.
(b) In the same context the Board would like to draw the attention of the Commission to the Board’s plea on the disallowance of interest charges. The Hon’ble Commission had disallowed the interest charges to the extent of Rs. 100 Cr every year since FY 2003-04 on the plea that the Board has been utilizing capital funds for bridging the revenue gap for the period prior to March’2002. Board would like to reiterate that the key reasons for diversion of capital funds by the Board were:
PSEB ARR Petition FY 08-09
Page 60 of 83
(i) Inadequate tariff increase given by the government
(ii) Non-payment of AP subsidy by the Govt in lieu of free supply to AP during the period 1997-2002 amounting to Rs. 1560.11 Cr approx.
(c) The Board would like to request the Commission not to make any reduction in the interest charges on account of diversion of funds which was the result of factors beyond the control of the Board and approve the expenses in full without any disallowance, so that the Board could meet the investment plan and the earlier mismatch between the actual cost incurred and approved costs by the Commission.
(d) Considering the above the Board has included the interest costs being serviced into the interest on working capital expense head.
14.9 The interest charges for short term loans/ working capital requirements are estimated at Rs. 388 Crs and Rs 450 Crs for FY 07-08 and FY 08-09 respectively. The Board requests the Hon’ble Commission to approve these costs without any disallowance as that would mean increased financial burden on PSEB.
14.10 Restructuring of Loans:
(a) The Board has managed to reduce the interest costs due to the pro-active restructuring/ swapping initiatives of PSEB on high cost loans in the previous financial year. A total saving of Rs 227.59 Cr on account of swapping of non SLR bonds and restructuring of loans has been achieved in the previous year.
(b) In addition to above, PSEB has swapped Non SLR Bonds at interest rate of 13.50% p.a .payable half yearly amounting to Rs.169.23 crore by exercising call option for 100% amount instead of 30%. The Bonds have been swapped by fresh borrowing from commercial Banks at the interest rate of 6.50% p.a. with monthly rests.
(c) Further, during 2005-06, Non SLR Bonds amounting to Rs.61 crore (carrying interest at the annualised rate ranging from 12.34% to 13.80%) have been prepaid by fresh borrowing at the interest rate of 6.10% p.a. with monthly rests. The Board would like to submit to the Commission that there is no possibility of further re-structuring of Institutional Loans.
14.11 Considering all the above mentioned issues, the Board requests the Commission to approve the revised estimates of Rs. 1087.32 Cr for FY 07-08 and the projections for FY 08-09 of Rs. 1394.94 Cr towards Interest and Finance Charges.
A15: DEPRECIATION
15.1 Depreciation for the FY 07-08 and FY 08-09 has been calculated by depreciation rate of last year category wise and the opening balance of gross fixed assets of these two years.
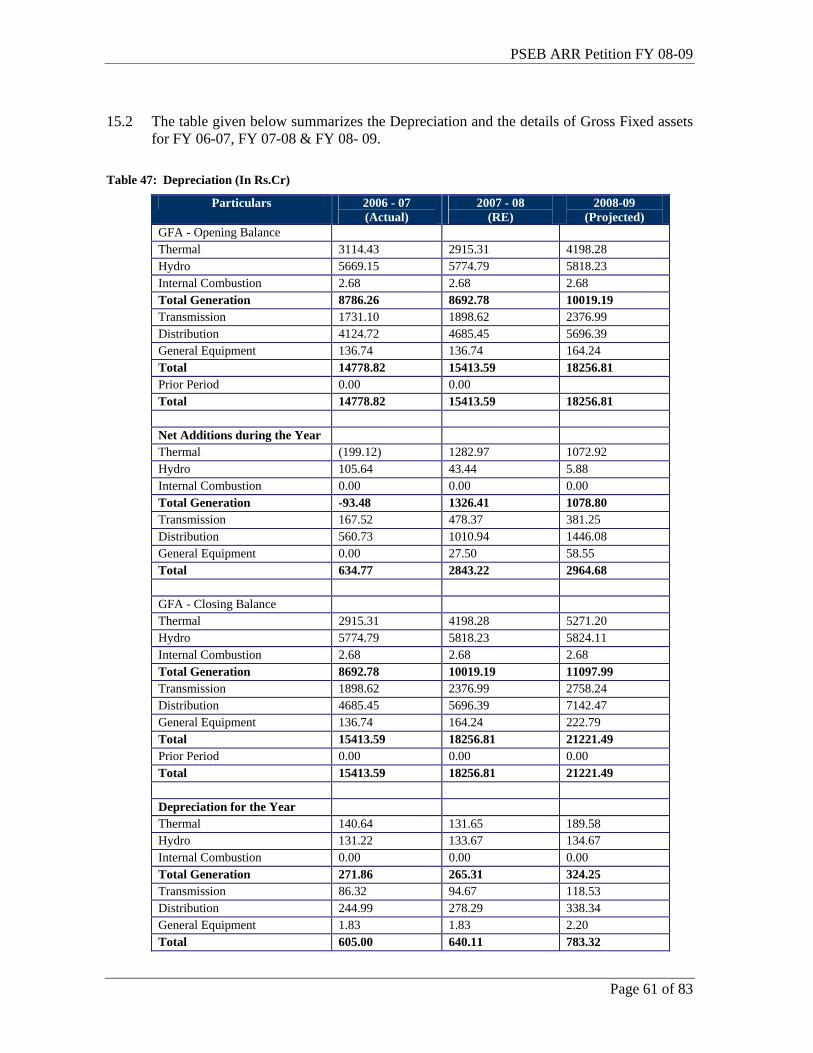
PSEB ARR Petition FY 08-09
Page 61 of 83
15.2 The table given below summarizes the Depreciation and the details of Gross Fixed assets for FY 06-07, FY 07-08 & FY 08- 09.
Table 47: Depreciation (In Rs.Cr)
Particulars 2006 - 07 (Actual)
2007 - 08 (RE)
2008-09 (Projected)
GFA - Opening Balance Thermal 3114.43 2915.31 4198.28 Hydro 5669.15 5774.79 5818.23 Internal Combustion 2.68 2.68 2.68 Total Generation 8786.26 8692.78 10019.19 Transmission 1731.10 1898.62 2376.99 Distribution 4124.72 4685.45 5696.39 General Equipment 136.74 136.74 164.24 Total 14778.82 15413.59 18256.81 Prior Period 0.00 0.00 Total 14778.82 15413.59 18256.81 Net Additions during the Year Thermal (199.12) 1282.97 1072.92 Hydro 105.64 43.44 5.88 Internal Combustion 0.00 0.00 0.00 Total Generation -93.48 1326.41 1078.80 Transmission 167.52 478.37 381.25 Distribution 560.73 1010.94 1446.08 General Equipment 0.00 27.50 58.55 Total 634.77 2843.22 2964.68 GFA - Closing Balance Thermal 2915.31 4198.28 5271.20 Hydro 5774.79 5818.23 5824.11 Internal Combustion 2.68 2.68 2.68 Total Generation 8692.78 10019.19 11097.99 Transmission 1898.62 2376.99 2758.24 Distribution 4685.45 5696.39 7142.47 General Equipment 136.74 164.24 222.79 Total 15413.59 18256.81 21221.49 Prior Period 0.00 0.00 0.00 Total 15413.59 18256.81 21221.49 Depreciation for the Year Thermal 140.64 131.65 189.58 Hydro 131.22 133.67 134.67 Internal Combustion 0.00 0.00 0.00 Total Generation 271.86 265.31 324.25 Transmission 86.32 94.67 118.53 Distribution 244.99 278.29 338.34 General Equipment 1.83 1.83 2.20 Total 605.00 640.11 783.32
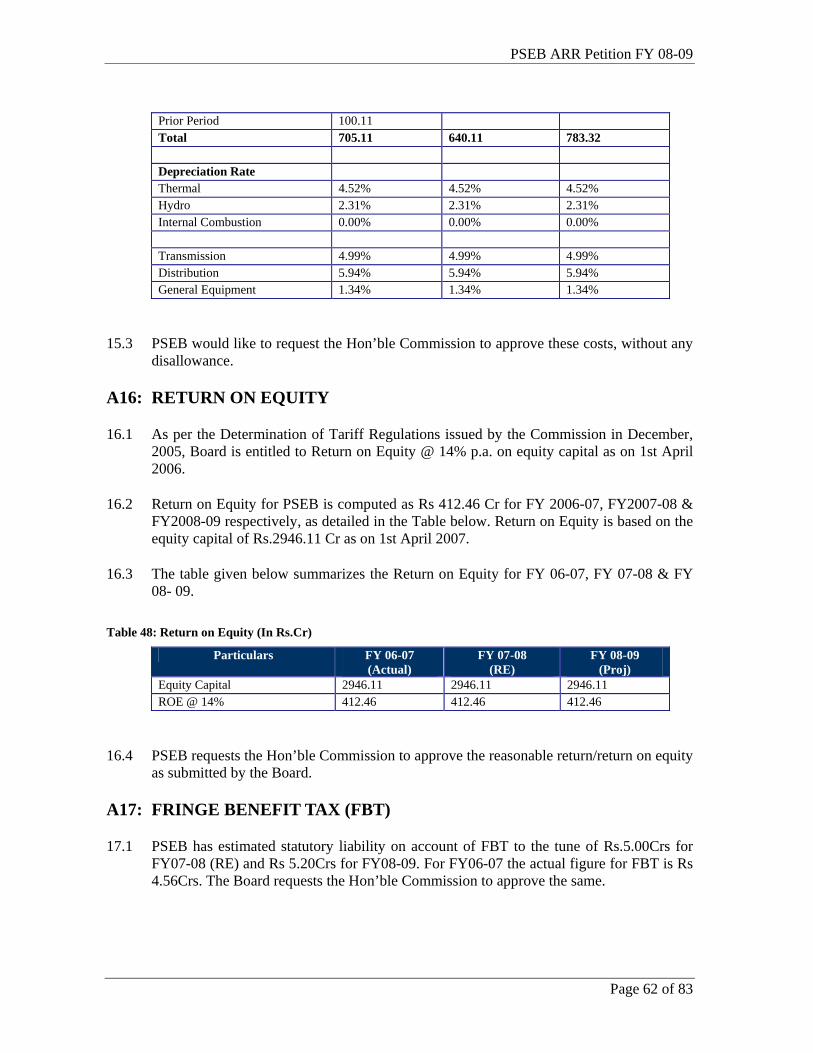
PSEB ARR Petition FY 08-09
Page 62 of 83
Prior Period 100.11 Total 705.11 640.11 783.32 Depreciation Rate Thermal 4.52% 4.52% 4.52% Hydro 2.31% 2.31% 2.31% Internal Combustion 0.00% 0.00% 0.00% Transmission 4.99% 4.99% 4.99% Distribution 5.94% 5.94% 5.94% General Equipment 1.34% 1.34% 1.34%
15.3 PSEB would like to request the Hon’ble Commission to approve these costs, without any disallowance.
A16: RETURN ON EQUITY
16.1 As per the Determination of Tariff Regulations issued by the Commission in December, 2005, Board is entitled to Return on Equity @ 14% p.a. on equity capital as on 1st April 2006.
16.2 Return on Equity for PSEB is computed as Rs 412.46 Cr for FY 2006-07, FY2007-08 & FY2008-09 respectively, as detailed in the Table below. Return on Equity is based on the equity capital of Rs.2946.11 Cr as on 1st April 2007.
16.3 The table given below summarizes the Return on Equity for FY 06-07, FY 07-08 & FY 08- 09.
Table 48: Return on Equity (In Rs.Cr)
Particulars FY 06-07 (Actual)
FY 07-08 (RE)
FY 08-09 (Proj)
Equity Capital 2946.11 2946.11 2946.11 ROE @ 14% 412.46 412.46 412.46
16.4 PSEB requests the Hon’ble Commission to approve the reasonable return/return on equity as submitted by the Board.
A17: FRINGE BENEFIT TAX (FBT)
17.1 PSEB has estimated statutory liability on account of FBT to the tune of Rs.5.00Crs for FY07-08 (RE) and Rs 5.20Crs for FY08-09. For FY06-07 the actual figure for FBT is Rs 4.56Crs. The Board requests the Hon’ble Commission to approve the same.
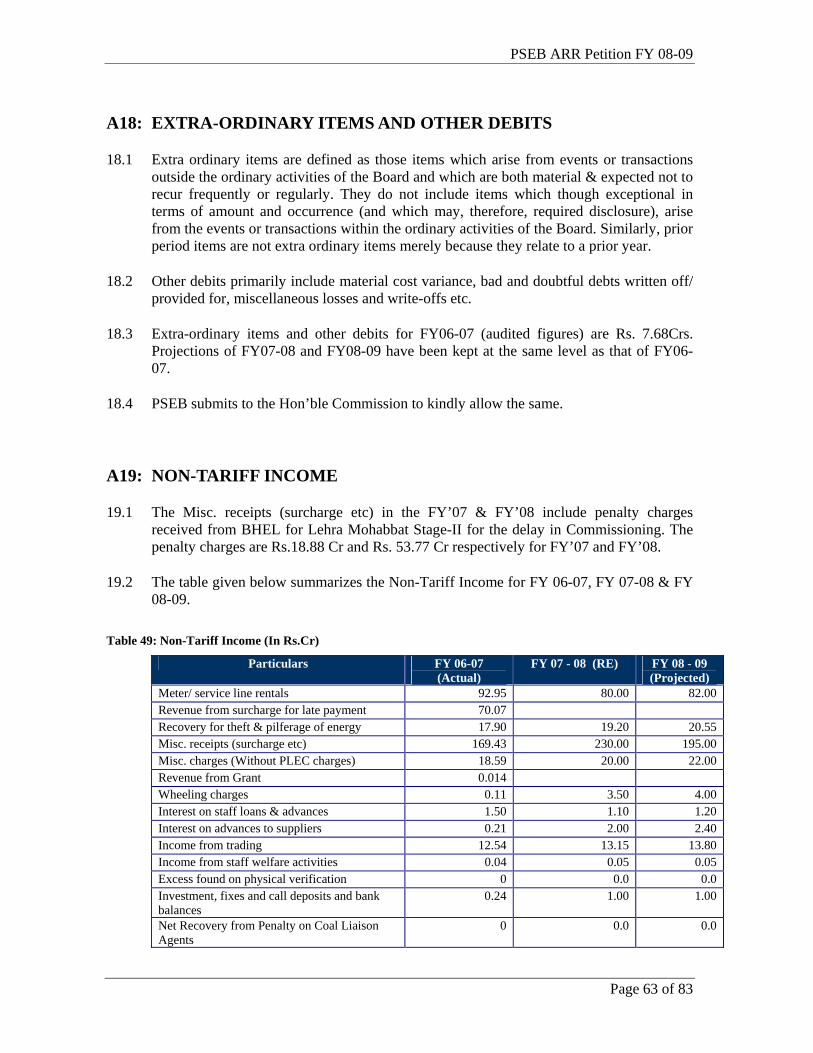
PSEB ARR Petition FY 08-09
Page 63 of 83
A18: EXTRA-ORDINARY ITEMS AND OTHER DEBITS
18.1 Extra ordinary items are defined as those items which arise from events or transactions outside the ordinary activities of the Board and which are both material & expected not to recur frequently or regularly. They do not include items which though exceptional in terms of amount and occurrence (and which may, therefore, required disclosure), arise from the events or transactions within the ordinary activities of the Board. Similarly, prior period items are not extra ordinary items merely because they relate to a prior year.
18.2 Other debits primarily include material cost variance, bad and doubtful debts written off/ provided for, miscellaneous losses and write-offs etc.
18.3 Extra-ordinary items and other debits for FY06-07 (audited figures) are Rs. 7.68Crs. Projections of FY07-08 and FY08-09 have been kept at the same level as that of FY06-07.
18.4 PSEB submits to the Hon’ble Commission to kindly allow the same.
A19: NON-TARIFF INCOME
19.1 The Misc. receipts (surcharge etc) in the FY’07 & FY’08 include penalty charges received from BHEL for Lehra Mohabbat Stage-II for the delay in Commissioning. The penalty charges are Rs.18.88 Cr and Rs. 53.77 Cr respectively for FY’07 and FY’08.
19.2 The table given below summarizes the Non-Tariff Income for FY 06-07, FY 07-08 & FY 08-09.
Table 49: Non-Tariff Income (In Rs.Cr)
Particulars FY 06-07 (Actual)
FY 07 - 08 (RE) FY 08 - 09 (Projected)
Meter/ service line rentals 92.95 80.00 82.00 Revenue from surcharge for late payment 70.07 Recovery for theft & pilferage of energy 17.90 19.20 20.55 Misc. receipts (surcharge etc) 169.43 230.00 195.00 Misc. charges (Without PLEC charges) 18.59 20.00 22.00 Revenue from Grant 0.014 Wheeling charges 0.11 3.50 4.00 Interest on staff loans & advances 1.50 1.10 1.20 Interest on advances to suppliers 0.21 2.00 2.40 Income from trading 12.54 13.15 13.80 Income from staff welfare activities 0.04 0.05 0.05 Excess found on physical verification 0 0.0 0.0 Investment, fixes and call deposits and bank balances
0.24 1.00 1.00
Net Recovery from Penalty on Coal Liaison Agents
0 0.0 0.0
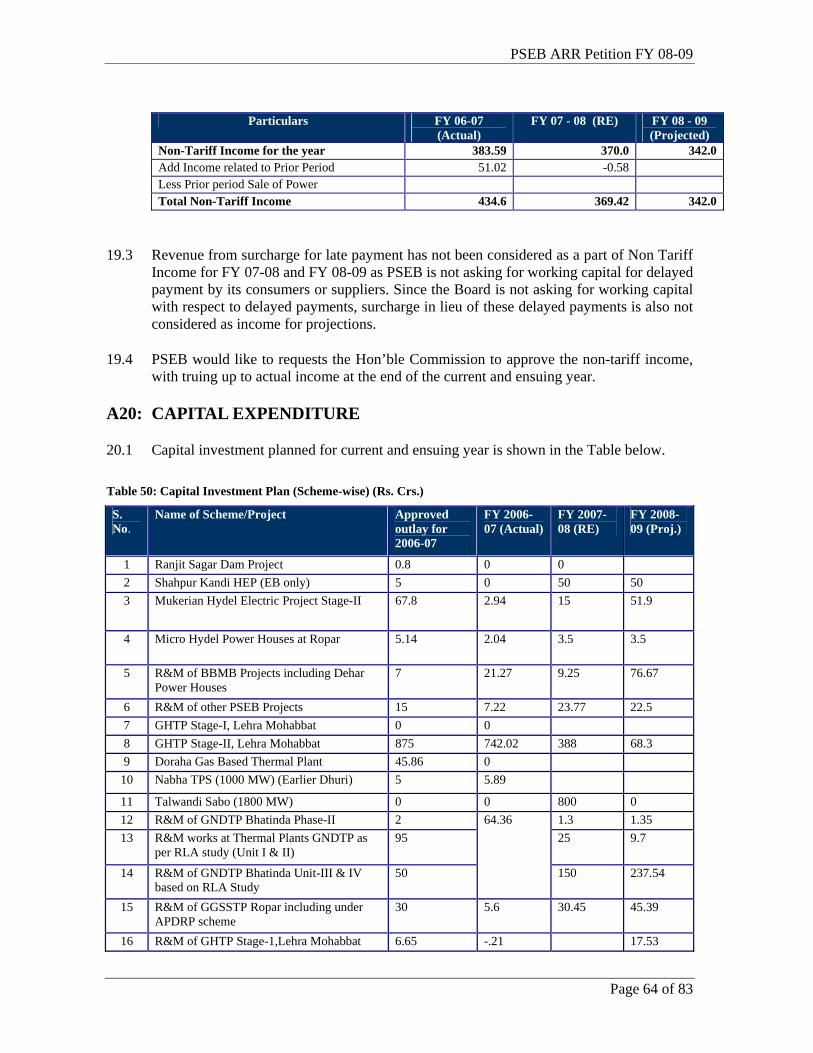
PSEB ARR Petition FY 08-09
Page 64 of 83
Particulars FY 06-07 (Actual)
FY 07 - 08 (RE) FY 08 - 09 (Projected)
Non-Tariff Income for the year 383.59 370.0 342.0 Add Income related to Prior Period 51.02 -0.58 Less Prior period Sale of Power Total Non-Tariff Income 434.6 369.42 342.0
19.3 Revenue from surcharge for late payment has not been considered as a part of Non Tariff Income for FY 07-08 and FY 08-09 as PSEB is not asking for working capital for delayed payment by its consumers or suppliers. Since the Board is not asking for working capital with respect to delayed payments, surcharge in lieu of these delayed payments is also not considered as income for projections.
19.4 PSEB would like to requests the Hon’ble Commission to approve the non-tariff income, with truing up to actual income at the end of the current and ensuing year.
A20: CAPITAL EXPENDITURE
20.1 Capital investment planned for current and ensuing year is shown in the Table below.
Table 50: Capital Investment Plan (Scheme-wise) (Rs. Crs.)
S. No.
Name of Scheme/Project Approved outlay for 2006-07
FY 2006-07 (Actual)
FY 2007-08 (RE)
FY 2008-09 (Proj.)
1 Ranjit Sagar Dam Project 0.8 0 0 2 Shahpur Kandi HEP (EB only) 5 0 50 50 3 Mukerian Hydel Electric Project Stage-II 67.8 2.94 15 51.9
4 Micro Hydel Power Houses at Ropar 5.14 2.04 3.5 3.5
5 R&M of BBMB Projects including Dehar Power Houses
7 21.27 9.25 76.67
6 R&M of other PSEB Projects 15 7.22 23.77 22.5 7 GHTP Stage-I, Lehra Mohabbat 0 0 8 GHTP Stage-II, Lehra Mohabbat 875 742.02 388 68.3 9 Doraha Gas Based Thermal Plant 45.86 0
10 Nabha TPS (1000 MW) (Earlier Dhuri) 5 5.89
11 Talwandi Sabo (1800 MW) 0 0 800 0 12 R&M of GNDTP Bhatinda Phase-II 2 1.3 1.35 13 R&M works at Thermal Plants GNDTP as
per RLA study (Unit I & II) 95 25 9.7
14 R&M of GNDTP Bhatinda Unit-III & IV based on RLA Study
50
64.36
150 237.54
15 R&M of GGSSTP Ropar including under APDRP scheme
30 5.6 30.45 45.39
16 R&M of GHTP Stage-1,Lehra Mohabbat 6.65 -.21 17.53
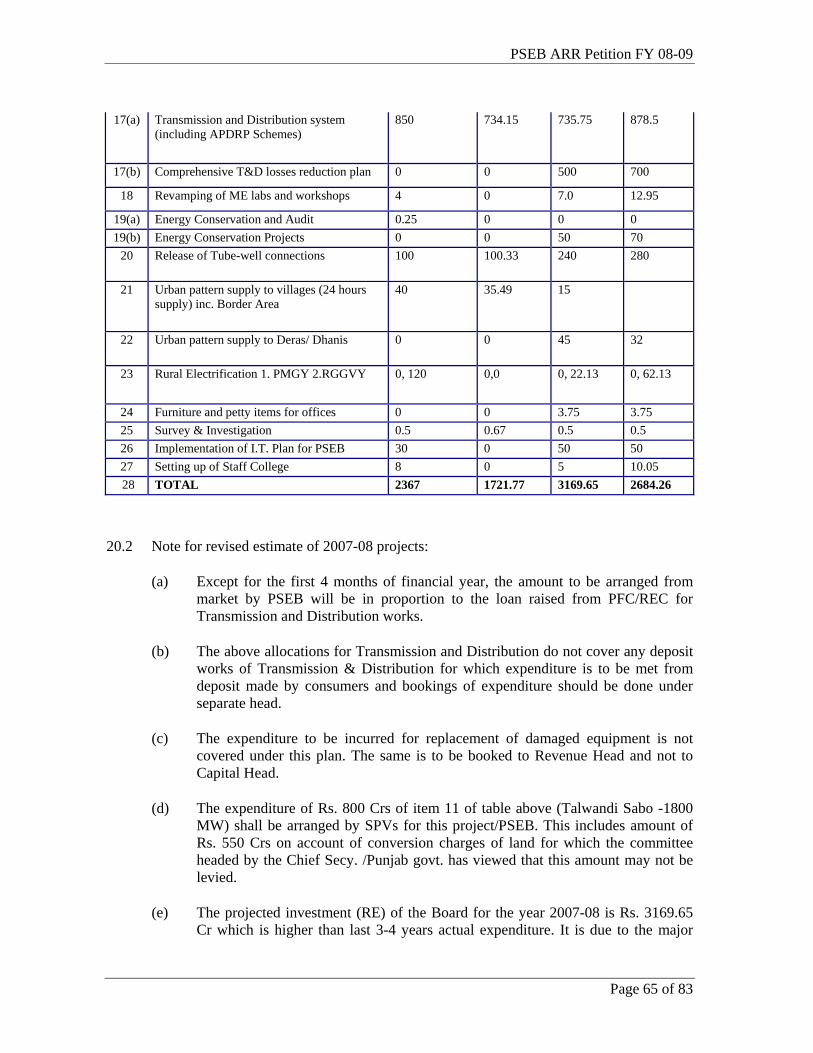
PSEB ARR Petition FY 08-09
Page 65 of 83
17(a) Transmission and Distribution system (including APDRP Schemes)
850 734.15 735.75 878.5
17(b) Comprehensive T&D losses reduction plan 0 0 500 700
18 Revamping of ME labs and workshops 4 0 7.0 12.95
19(a) Energy Conservation and Audit 0.25 0 0 0 19(b) Energy Conservation Projects 0 0 50 70
20 Release of Tube-well connections 100 100.33 240 280
21 Urban pattern supply to villages (24 hours supply) inc. Border Area
40 35.49 15
22 Urban pattern supply to Deras/ Dhanis 0 0 45 32
23 Rural Electrification 1. PMGY 2.RGGVY 0, 120 0,0 0, 22.13 0, 62.13
24 Furniture and petty items for offices 0 0 3.75 3.75 25 Survey & Investigation 0.5 0.67 0.5 0.5 26 Implementation of I.T. Plan for PSEB 30 0 50 50 27 Setting up of Staff College 8 0 5 10.05 28 TOTAL 2367 1721.77 3169.65 2684.26
20.2 Note for revised estimate of 2007-08 projects:
(a) Except for the first 4 months of financial year, the amount to be arranged from market by PSEB will be in proportion to the loan raised from PFC/REC for Transmission and Distribution works.
(b) The above allocations for Transmission and Distribution do not cover any deposit works of Transmission & Distribution for which expenditure is to be met from deposit made by consumers and bookings of expenditure should be done under separate head.
(c) The expenditure to be incurred for replacement of damaged equipment is not covered under this plan. The same is to be booked to Revenue Head and not to Capital Head.
(d) The expenditure of Rs. 800 Crs of item 11 of table above (Talwandi Sabo -1800 MW) shall be arranged by SPVs for this project/PSEB. This includes amount of Rs. 550 Crs on account of conversion charges of land for which the committee headed by the Chief Secy. /Punjab govt. has viewed that this amount may not be levied.
(e) The projected investment (RE) of the Board for the year 2007-08 is Rs. 3169.65 Cr which is higher than last 3-4 years actual expenditure. It is due to the major
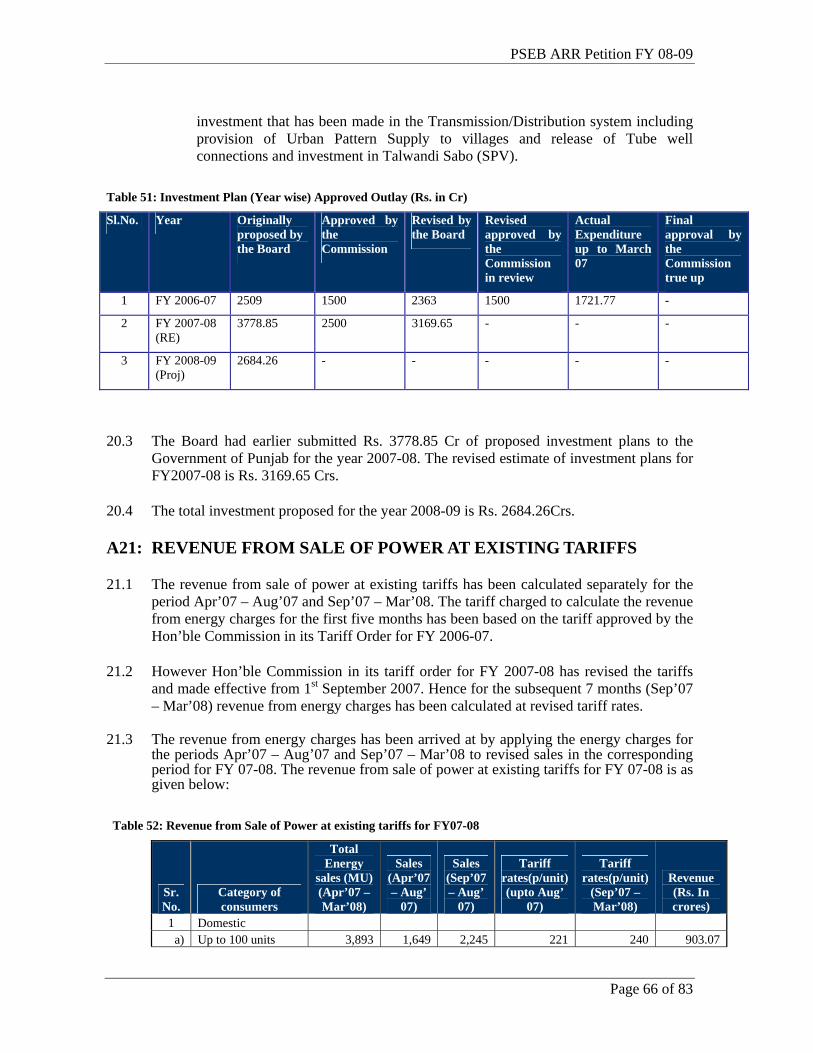
PSEB ARR Petition FY 08-09
Page 66 of 83
investment that has been made in the Transmission/Distribution system including provision of Urban Pattern Supply to villages and release of Tube well connections and investment in Talwandi Sabo (SPV).
Table 51: Investment Plan (Year wise) Approved Outlay (Rs. in Cr)
Sl.No. Year Originally proposed by the Board
Approved by the Commission
Revised by the Board
Revised approved by the Commission in review
Actual Expenditure up to March 07
Final approval by the Commission true up
1 FY 2006-07 2509 1500 2363 1500 1721.77 -
2 FY 2007-08 (RE)
3778.85 2500 3169.65 - - -
3 FY 2008-09 (Proj)
2684.26 - - - - -
20.3 The Board had earlier submitted Rs. 3778.85 Cr of proposed investment plans to the Government of Punjab for the year 2007-08. The revised estimate of investment plans for FY2007-08 is Rs. 3169.65 Crs.
20.4 The total investment proposed for the year 2008-09 is Rs. 2684.26Crs.
A21: REVENUE FROM SALE OF POWER AT EXISTING TARIFFS
21.1 The revenue from sale of power at existing tariffs has been calculated separately for the period Apr’07 – Aug’07 and Sep’07 – Mar’08. The tariff charged to calculate the revenue from energy charges for the first five months has been based on the tariff approved by the Hon’ble Commission in its Tariff Order for FY 2006-07.
21.2 However Hon’ble Commission in its tariff order for FY 2007-08 has revised the tariffs and made effective from 1st September 2007. Hence for the subsequent 7 months (Sep’07 – Mar’08) revenue from energy charges has been calculated at revised tariff rates.
21.3 The revenue from energy charges has been arrived at by applying the energy charges for the periods Apr’07 – Aug’07 and Sep’07 – Mar’08 to revised sales in the corresponding period for FY 07-08. The revenue from sale of power at existing tariffs for FY 07-08 is as given below:
Table 52: Revenue from Sale of Power at existing tariffs for FY07-08
Sr. No.
Category of consumers
Total Energy
sales (MU) (Apr’07 – Mar’08)
Sales (Apr’07 – Aug’
07)
Sales (Sep’07 – Aug’
07)
Tariff rates(p/unit) (upto Aug’
07)
Tariff rates(p/unit)
(Sep’07 – Mar’08)
Revenue (Rs. In crores)
1 Domestic a) Up to 100 units 3,893 1,649 2,245 221 240 903.07
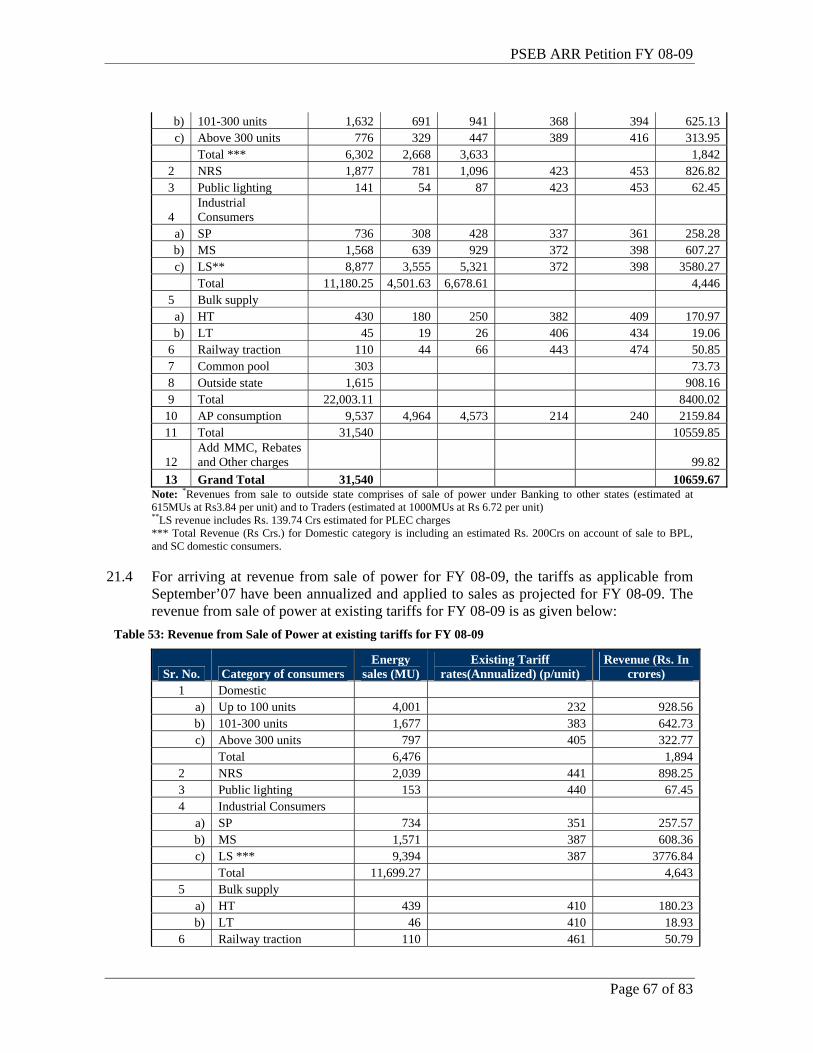
PSEB ARR Petition FY 08-09
Page 67 of 83
b) 101-300 units 1,632 691 941 368 394 625.13c) Above 300 units 776 329 447 389 416 313.95
Total *** 6,302 2,668 3,633 1,8422 NRS 1,877 781 1,096 423 453 826.823 Public lighting 141 54 87 423 453 62.45
4 Industrial Consumers
a) SP 736 308 428 337 361 258.28b) MS 1,568 639 929 372 398 607.27c) LS** 8,877 3,555 5,321 372 398 3580.27
Total 11,180.25 4,501.63 6,678.61 4,4465 Bulk supply
a) HT 430 180 250 382 409 170.97b) LT 45 19 26 406 434 19.06
6 Railway traction 110 44 66 443 474 50.857 Common pool 303 73.738 Outside state 1,615 908.169 Total 22,003.11 8400.02
10 AP consumption 9,537 4,964 4,573 214 240 2159.8411 Total 31,540 10559.85
12 Add MMC, Rebates and Other charges 99.82
13 Grand Total 31,540 10659.67Note: *Revenues from sale to outside state comprises of sale of power under Banking to other states (estimated at 615MUs at Rs3.84 per unit) and to Traders (estimated at 1000MUs at Rs 6.72 per unit) **LS revenue includes Rs. 139.74 Crs estimated for PLEC charges *** Total Revenue (Rs Crs.) for Domestic category is including an estimated Rs. 200Crs on account of sale to BPL, and SC domestic consumers.
21.4 For arriving at revenue from sale of power for FY 08-09, the tariffs as applicable from September’07 have been annualized and applied to sales as projected for FY 08-09. The revenue from sale of power at existing tariffs for FY 08-09 is as given below:
Table 53: Revenue from Sale of Power at existing tariffs for FY 08-09
Sr. No. Category of consumers Energy
sales (MU) Existing Tariff
rates(Annualized) (p/unit) Revenue (Rs. In
crores) 1 Domestic
a) Up to 100 units 4,001 232 928.56b) 101-300 units 1,677 383 642.73c) Above 300 units 797 405 322.77
Total 6,476 1,8942 NRS 2,039 441 898.253 Public lighting 153 440 67.454 Industrial Consumers
a) SP 734 351 257.57b) MS 1,571 387 608.36c) LS *** 9,394 387 3776.84
Total 11,699.27 4,6435 Bulk supply
a) HT 439 410 180.23b) LT 46 410 18.93
6 Railway traction 110 461 50.79
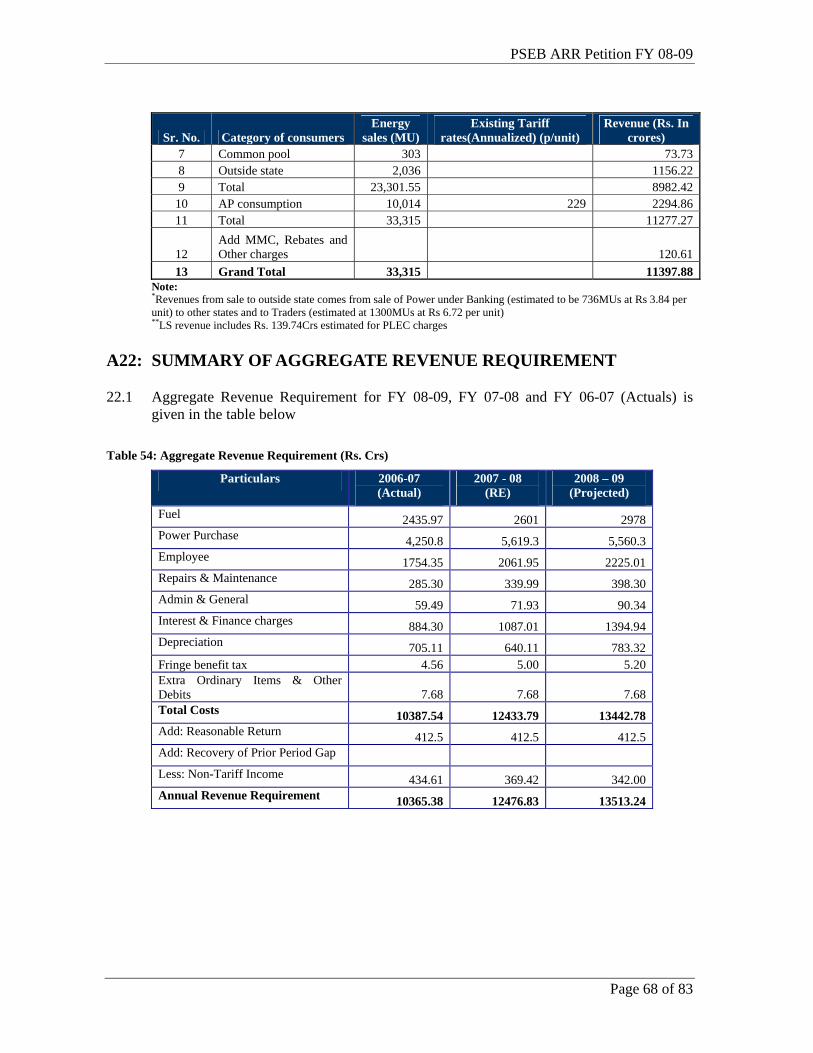
PSEB ARR Petition FY 08-09
Page 68 of 83
Sr. No. Category of consumers Energy
sales (MU) Existing Tariff
rates(Annualized) (p/unit) Revenue (Rs. In
crores) 7 Common pool 303 73.738 Outside state 2,036 1156.229 Total 23,301.55 8982.42
10 AP consumption 10,014 229 2294.8611 Total 33,315 11277.27
12 Add MMC, Rebates and Other charges 120.61
13 Grand Total 33,315 11397.88Note: *Revenues from sale to outside state comes from sale of Power under Banking (estimated to be 736MUs at Rs 3.84 per unit) to other states and to Traders (estimated at 1300MUs at Rs 6.72 per unit) **LS revenue includes Rs. 139.74Crs estimated for PLEC charges
A22: SUMMARY OF AGGREGATE REVENUE REQUIREMENT
22.1 Aggregate Revenue Requirement for FY 08-09, FY 07-08 and FY 06-07 (Actuals) is given in the table below
Table 54: Aggregate Revenue Requirement (Rs. Crs)
Particulars 2006-07 (Actual)
2007 - 08 (RE)
2008 – 09 (Projected)
Fuel 2435.97 2601 2978 Power Purchase 4,250.8 5,619.3 5,560.3 Employee 1754.35 2061.95 2225.01 Repairs & Maintenance 285.30 339.99 398.30 Admin & General 59.49 71.93 90.34 Interest & Finance charges 884.30 1087.01 1394.94 Depreciation 705.11 640.11 783.32 Fringe benefit tax 4.56 5.00 5.20 Extra Ordinary Items & Other Debits 7.68 7.68 7.68 Total Costs 10387.54 12433.79 13442.78 Add: Reasonable Return 412.5 412.5 412.5 Add: Recovery of Prior Period Gap
Less: Non-Tariff Income 434.61 369.42 342.00 Annual Revenue Requirement 10365.38 12476.83 13513.24
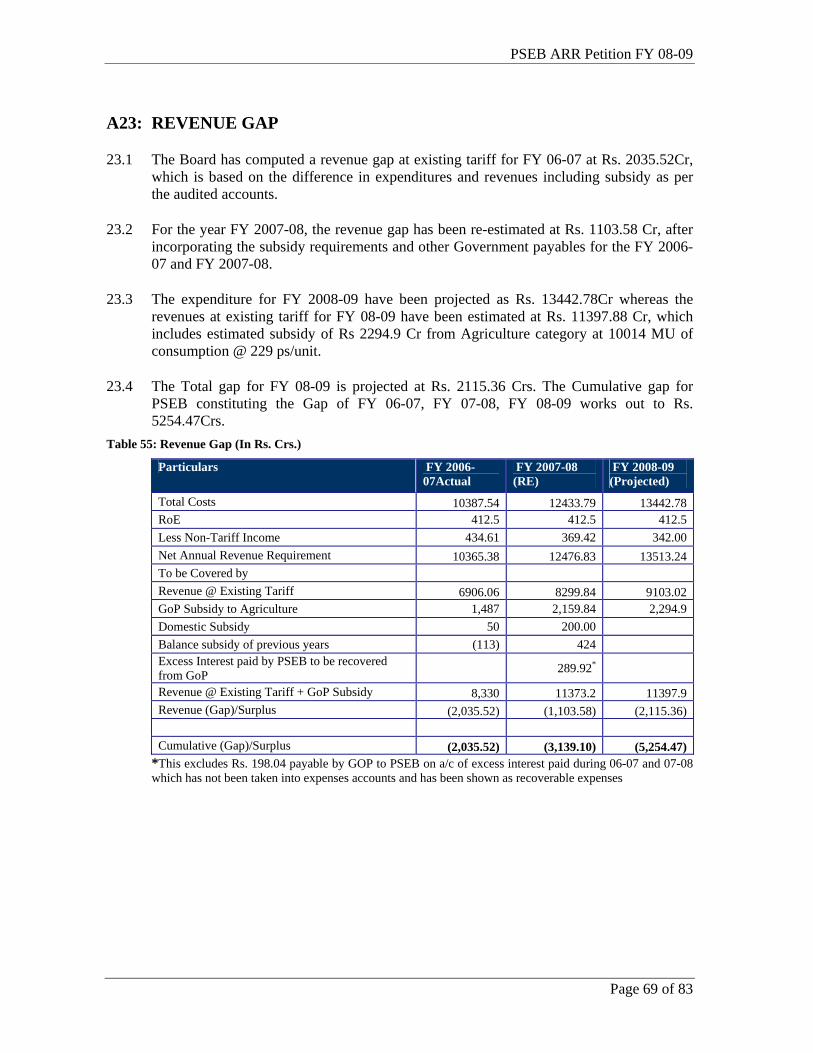
PSEB ARR Petition FY 08-09
Page 69 of 83
A23: REVENUE GAP
23.1 The Board has computed a revenue gap at existing tariff for FY 06-07 at Rs. 2035.52Cr, which is based on the difference in expenditures and revenues including subsidy as per the audited accounts.
23.2 For the year FY 2007-08, the revenue gap has been re-estimated at Rs. 1103.58 Cr, after incorporating the subsidy requirements and other Government payables for the FY 2006-07 and FY 2007-08.
23.3 The expenditure for FY 2008-09 have been projected as Rs. 13442.78Cr whereas the revenues at existing tariff for FY 08-09 have been estimated at Rs. 11397.88 Cr, which includes estimated subsidy of Rs 2294.9 Cr from Agriculture category at 10014 MU of consumption @ 229 ps/unit.
23.4 The Total gap for FY 08-09 is projected at Rs. 2115.36 Crs. The Cumulative gap for PSEB constituting the Gap of FY 06-07, FY 07-08, FY 08-09 works out to Rs. 5254.47Crs.
Table 55: Revenue Gap (In Rs. Crs.)
Particulars FY 2006-07Actual
FY 2007-08 (RE)
FY 2008-09 (Projected)
Total Costs 10387.54 12433.79 13442.78 RoE 412.5 412.5 412.5 Less Non-Tariff Income 434.61 369.42 342.00 Net Annual Revenue Requirement 10365.38 12476.83 13513.24 To be Covered by Revenue @ Existing Tariff 6906.06 8299.84 9103.02 GoP Subsidy to Agriculture 1,487 2,159.84 2,294.9 Domestic Subsidy 50 200.00 Balance subsidy of previous years (113) 424 Excess Interest paid by PSEB to be recovered from GoP 289.92*
Revenue @ Existing Tariff + GoP Subsidy 8,330 11373.2 11397.9 Revenue (Gap)/Surplus (2,035.52) (1,103.58) (2,115.36) Cumulative (Gap)/Surplus (2,035.52) (3,139.10) (5,254.47)
*This excludes Rs. 198.04 payable by GOP to PSEB on a/c of excess interest paid during 06-07 and 07-08 which has not been taken into expenses accounts and has been shown as recoverable expenses
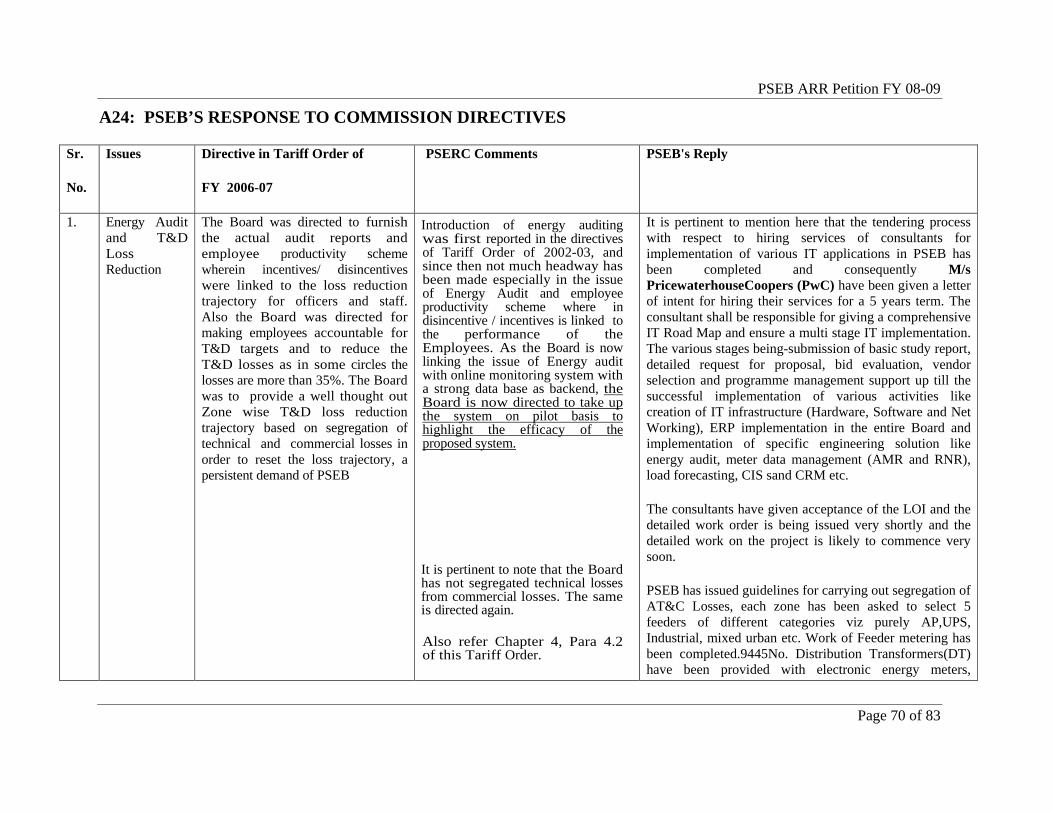
PSEB ARR Petition FY 08-09
Page 70 of 83
A24: PSEB’S RESPONSE TO COMMISSION DIRECTIVES
Sr.
No.
Issues Directive in Tariff Order of
FY 2006-07
PSERC Comments PSEB's Reply
1. Energy Audit and T&D Loss Reduction
The Board was directed to furnish the actual audit reports and employee productivity scheme wherein incentives/ disincentives were linked to the loss reduction trajectory for officers and staff. Also the Board was directed for making employees accountable for T&D targets and to reduce the T&D losses as in some circles the losses are more than 35%. The Board was to provide a well thought out Zone wise T&D loss reduction trajectory based on segregation of technical and commercial losses in order to reset the loss trajectory, a persistent demand of PSEB
Introduction of energy auditing was first reported in the directives of Tariff Order of 2002-03, and since then not much headway has been made especially in the issue of Energy Audit and employee productivity scheme where in disincentive / incentives is linked to the performance of the Employees. As the Board is now linking the issue of Energy audit with online monitoring system with a strong data base as backend, the Board is now directed to take up the system on pilot basis to highlight the efficacy of the proposed system.
It is pertinent to note that the Board has not segregated technical losses from commercial losses. The same is directed again.
Also refer Chapter 4, Para 4.2 of this Tariff Order.
It is pertinent to mention here that the tendering process with respect to hiring services of consultants for implementation of various IT applications in PSEB has been completed and consequently M/s PricewaterhouseCoopers (PwC) have been given a letter of intent for hiring their services for a 5 years term. The consultant shall be responsible for giving a comprehensive IT Road Map and ensure a multi stage IT implementation. The various stages being-submission of basic study report, detailed request for proposal, bid evaluation, vendor selection and programme management support up till the successful implementation of various activities like creation of IT infrastructure (Hardware, Software and Net Working), ERP implementation in the entire Board and implementation of specific engineering solution like energy audit, meter data management (AMR and RNR), load forecasting, CIS sand CRM etc.
The consultants have given acceptance of the LOI and the detailed work order is being issued very shortly and the detailed work on the project is likely to commence very soon.
PSEB has issued guidelines for carrying out segregation of AT&C Losses, each zone has been asked to select 5 feeders of different categories viz purely AP,UPS, Industrial, mixed urban etc. Work of Feeder metering has been completed.9445No. Distribution Transformers(DT) have been provided with electronic energy meters,
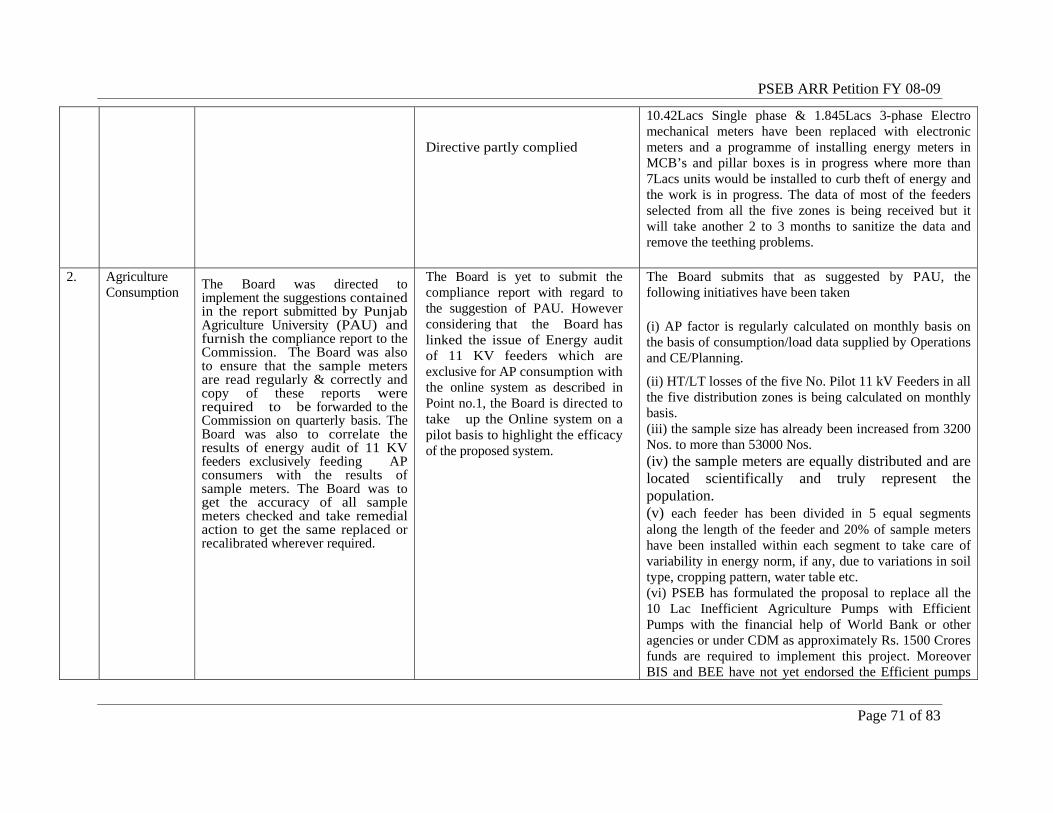
PSEB ARR Petition FY 08-09
Page 71 of 83
Directive partly complied
10.42Lacs Single phase & 1.845Lacs 3-phase Electro mechanical meters have been replaced with electronic meters and a programme of installing energy meters in MCB’s and pillar boxes is in progress where more than 7Lacs units would be installed to curb theft of energy and the work is in progress. The data of most of the feeders selected from all the five zones is being received but it will take another 2 to 3 months to sanitize the data and remove the teething problems.
2. Agriculture Consumption The Board was directed to
implement the suggestions contained in the report submitted by Punjab Agriculture University (PAU) and furnish the compliance report to the Commission. The Board was also to ensure that the sample meters are read regularly & correctly and copy of these reports were required to be forwarded to the Commission on quarterly basis. The Board was also to correlate the results of energy audit of 11 KV feeders exclusively feeding AP consumers with the results of sample meters. The Board was to get the accuracy of all sample meters checked and take remedial action to get the same replaced or recalibrated wherever required.
The Board is yet to submit the compliance report with regard to the suggestion of PAU. However considering that the Board has linked the issue of Energy audit of 11 KV feeders which are exclusive for AP consumption with the online system as described in Point no.1, the Board is directed to take up the Online system on a pilot basis to highlight the efficacy of the proposed system.
The Board submits that as suggested by PAU, the following initiatives have been taken
(i) AP factor is regularly calculated on monthly basis on the basis of consumption/load data supplied by Operations and CE/Planning.
(ii) HT/LT losses of the five No. Pilot 11 kV Feeders in all the five distribution zones is being calculated on monthly basis. (iii) the sample size has already been increased from 3200 Nos. to more than 53000 Nos. (iv) the sample meters are equally distributed and are located scientifically and truly represent the population. (v) each feeder has been divided in 5 equal segments along the length of the feeder and 20% of sample meters have been installed within each segment to take care of variability in energy norm, if any, due to variations in soil type, cropping pattern, water table etc. (vi) PSEB has formulated the proposal to replace all the 10 Lac Inefficient Agriculture Pumps with Efficient Pumps with the financial help of World Bank or other agencies or under CDM as approximately Rs. 1500 Crores funds are required to implement this project. Moreover BIS and BEE have not yet endorsed the Efficient pumps
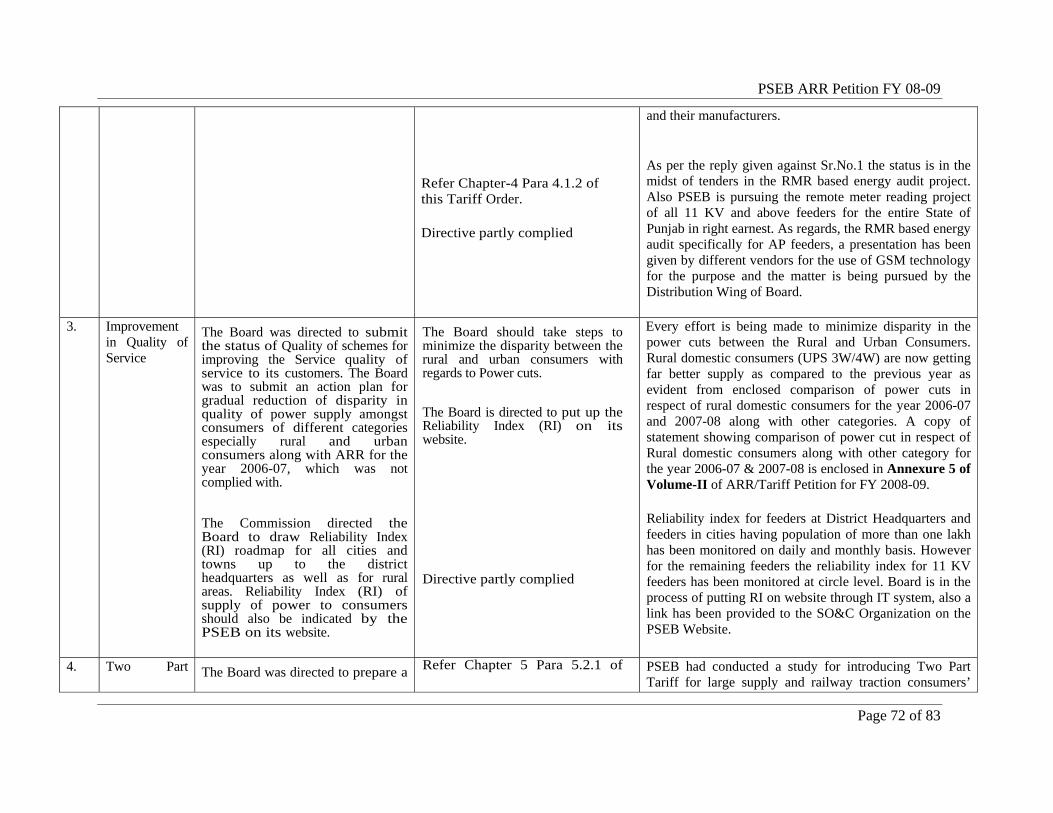
PSEB ARR Petition FY 08-09
Page 72 of 83
Refer Chapter-4 Para 4.1.2 of this Tariff Order.
Directive partly complied
and their manufacturers.
As per the reply given against Sr.No.1 the status is in the midst of tenders in the RMR based energy audit project. Also PSEB is pursuing the remote meter reading project of all 11 KV and above feeders for the entire State of Punjab in right earnest. As regards, the RMR based energy audit specifically for AP feeders, a presentation has been given by different vendors for the use of GSM technology for the purpose and the matter is being pursued by the Distribution Wing of Board.
3. Improvement in Quality of Service
The Board was directed to submit the status of Quality of schemes for improving the Service quality of service to its customers. The Board was to submit an action plan for gradual reduction of disparity in quality of power supply amongst consumers of different categories especially rural and urban consumers along with ARR for the year 2006-07, which was not complied with.
The Commission directed the Board to draw Reliability Index (RI) roadmap for all cities and towns up to the district headquarters as well as for rural areas. Reliability Index (RI) of supply of power to consumers should also be indicated by the PSEB on its website.
The Board should take steps to minimize the disparity between the rural and urban consumers with regards to Power cuts.
The Board is directed to put up the Reliability Index (RI) on its website.
Directive partly complied
Every effort is being made to minimize disparity in the power cuts between the Rural and Urban Consumers. Rural domestic consumers (UPS 3W/4W) are now getting far better supply as compared to the previous year as evident from enclosed comparison of power cuts in respect of rural domestic consumers for the year 2006-07 and 2007-08 along with other categories. A copy of statement showing comparison of power cut in respect of Rural domestic consumers along with other category for the year 2006-07 & 2007-08 is enclosed in Annexure 5 of Volume-II of ARR/Tariff Petition for FY 2008-09.
Reliability index for feeders at District Headquarters and feeders in cities having population of more than one lakh has been monitored on daily and monthly basis. However for the remaining feeders the reliability index for 11 KV feeders has been monitored at circle level. Board is in the process of putting RI on website through IT system, also a link has been provided to the SO&C Organization on the PSEB Website.
4. Two Part The Board was directed to prepare a Refer Chapter 5 Para 5.2.1 of PSEB had conducted a study for introducing Two Part Tariff for large supply and railway traction consumers’
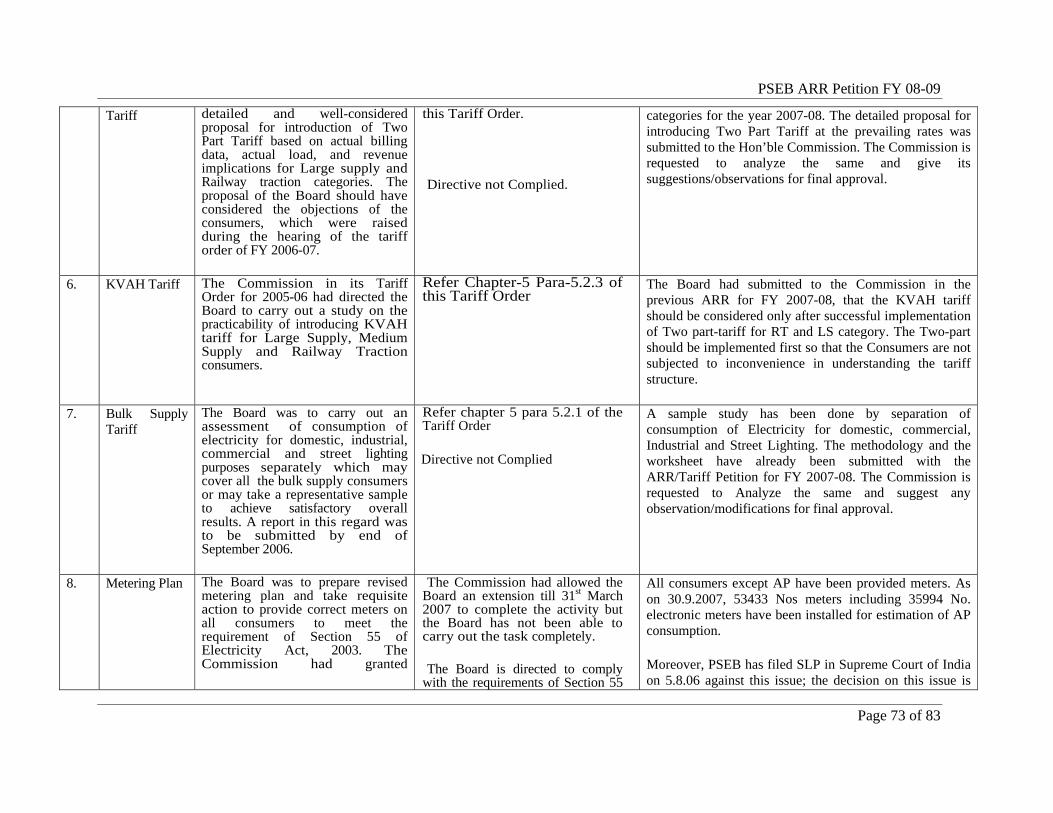
PSEB ARR Petition FY 08-09
Page 73 of 83
Tariff detailed and well-considered proposal for introduction of Two Part Tariff based on actual billing data, actual load, and revenue implications for Large supply and Railway traction categories. The proposal of the Board should have considered the objections of the consumers, which were raised during the hearing of the tariff order of FY 2006-07.
this Tariff Order.
Directive not Complied.
categories for the year 2007-08. The detailed proposal for introducing Two Part Tariff at the prevailing rates was submitted to the Hon’ble Commission. The Commission is requested to analyze the same and give its suggestions/observations for final approval.
6. KVAH Tariff The Commission in its Tariff Order for 2005-06 had directed the Board to carry out a study on the practicability of introducing KVAH tariff for Large Supply, Medium Supply and Railway Traction consumers.
Refer Chapter-5 Para-5.2.3 of this Tariff Order
The Board had submitted to the Commission in the previous ARR for FY 2007-08, that the KVAH tariff should be considered only after successful implementation of Two part-tariff for RT and LS category. The Two-part should be implemented first so that the Consumers are not subjected to inconvenience in understanding the tariff structure.
7. Bulk Supply Tariff
The Board was to carry out an assessment of consumption of electricity for domestic, industrial, commercial and street lighting purposes separately which may cover all the bulk supply consumers or may take a representative sample to achieve satisfactory overall results. A report in this regard was to be submitted by end of September 2006.
Refer chapter 5 para 5.2.1 of the Tariff Order
Directive not Complied
A sample study has been done by separation of consumption of Electricity for domestic, commercial, Industrial and Street Lighting. The methodology and the worksheet have already been submitted with the ARR/Tariff Petition for FY 2007-08. The Commission is requested to Analyze the same and suggest any observation/modifications for final approval.
8. Metering Plan The Board was to prepare revised metering plan and take requisite action to provide correct meters on all consumers to meet the requirement of Section 55 of Electricity Act, 2003. The Commission had granted
The Commission had allowed the Board an extension till 31st March 2007 to complete the activity but the Board has not been able to carry out the task completely.
The Board is directed to comply with the requirements of Section 55
All consumers except AP have been provided meters. As on 30.9.2007, 53433 Nos meters including 35994 No. electronic meters have been installed for estimation of AP consumption.
Moreover, PSEB has filed SLP in Supreme Court of India on 5.8.06 against this issue; the decision on this issue is
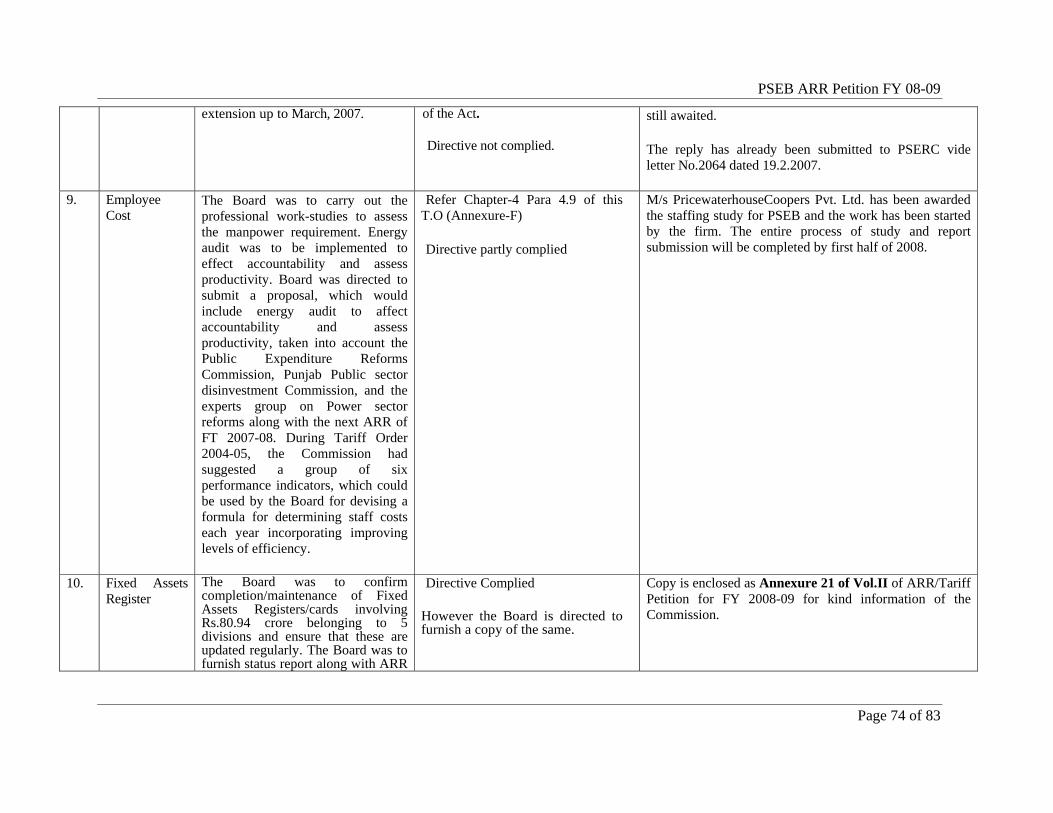
PSEB ARR Petition FY 08-09
Page 74 of 83
extension up to March, 2007.
of the Act.
Directive not complied.
still awaited.
The reply has already been submitted to PSERC vide letter No.2064 dated 19.2.2007.
9. Employee Cost
The Board was to carry out the professional work-studies to assess the manpower requirement. Energy audit was to be implemented to effect accountability and assess productivity. Board was directed to submit a proposal, which would include energy audit to affect accountability and assess productivity, taken into account the Public Expenditure Reforms Commission, Punjab Public sector disinvestment Commission, and the experts group on Power sector reforms along with the next ARR of FT 2007-08. During Tariff Order 2004-05, the Commission had suggested a group of six performance indicators, which could be used by the Board for devising a formula for determining staff costs each year incorporating improving levels of efficiency.
Refer Chapter-4 Para 4.9 of this T.O (Annexure-F)
Directive partly complied
M/s PricewaterhouseCoopers Pvt. Ltd. has been awarded the staffing study for PSEB and the work has been started by the firm. The entire process of study and report submission will be completed by first half of 2008.
10. Fixed Assets Register
The Board was to confirm completion/maintenance of Fixed Assets Registers/cards involving Rs.80.94 crore belonging to 5 divisions and ensure that these are updated regularly. The Board was to furnish status report along with ARR
Directive Complied
However the Board is directed to furnish a copy of the same.
Copy is enclosed as Annexure 21 of Vol.II of ARR/Tariff Petition for FY 2008-09 for kind information of the Commission.
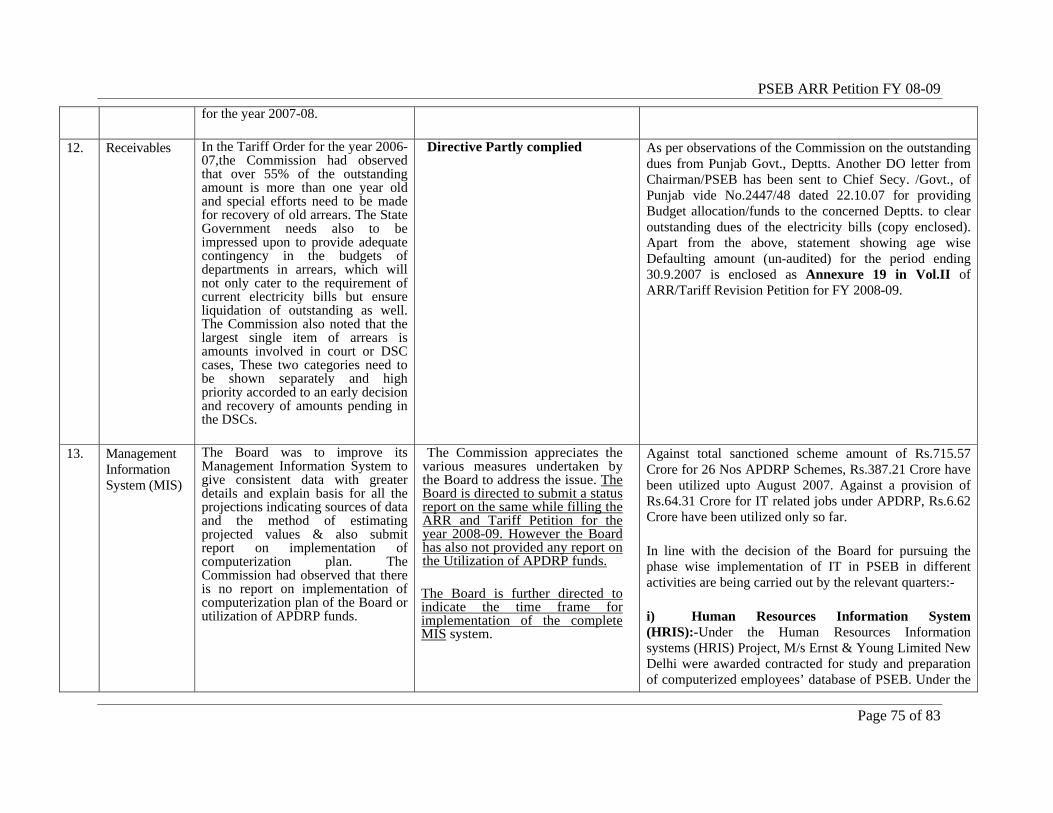
PSEB ARR Petition FY 08-09
Page 75 of 83
for the year 2007-08.
12. Receivables In the Tariff Order for the year 2006-07,the Commission had observed that over 55% of the outstanding amount is more than one year old and special efforts need to be made for recovery of old arrears. The State Government needs also to be impressed upon to provide adequate contingency in the budgets of departments in arrears, which will not only cater to the requirement of current electricity bills but ensure liquidation of outstanding as well. The Commission also noted that the largest single item of arrears is amounts involved in court or DSC cases, These two categories need to be shown separately and high priority accorded to an early decision and recovery of amounts pending in the DSCs.
Directive Partly complied As per observations of the Commission on the outstanding dues from Punjab Govt., Deptts. Another DO letter from Chairman/PSEB has been sent to Chief Secy. /Govt., of Punjab vide No.2447/48 dated 22.10.07 for providing Budget allocation/funds to the concerned Deptts. to clear outstanding dues of the electricity bills (copy enclosed). Apart from the above, statement showing age wise Defaulting amount (un-audited) for the period ending 30.9.2007 is enclosed as Annexure 19 in Vol.II of ARR/Tariff Revision Petition for FY 2008-09.
13. Management Information System (MIS)
The Board was to improve its Management Information System to give consistent data with greater details and explain basis for all the projections indicating sources of data and the method of estimating projected values & also submit report on implementation of computerization plan. The Commission had observed that there is no report on implementation of computerization plan of the Board or utilization of APDRP funds.
The Commission appreciates the various measures undertaken by the Board to address the issue. The Board is directed to submit a status report on the same while filling the ARR and Tariff Petition for the year 2008-09. However the Board has also not provided any report on the Utilization of APDRP funds.
The Board is further directed to indicate the time frame for implementation of the complete MIS system.
Against total sanctioned scheme amount of Rs.715.57 Crore for 26 Nos APDRP Schemes, Rs.387.21 Crore have been utilized upto August 2007. Against a provision of Rs.64.31 Crore for IT related jobs under APDRP, Rs.6.62 Crore have been utilized only so far.
In line with the decision of the Board for pursuing the phase wise implementation of IT in PSEB in different activities are being carried out by the relevant quarters:-
i) Human Resources Information System (HRIS):-Under the Human Resources Information systems (HRIS) Project, M/s Ernst & Young Limited New Delhi were awarded contracted for study and preparation of computerized employees’ database of PSEB. Under the
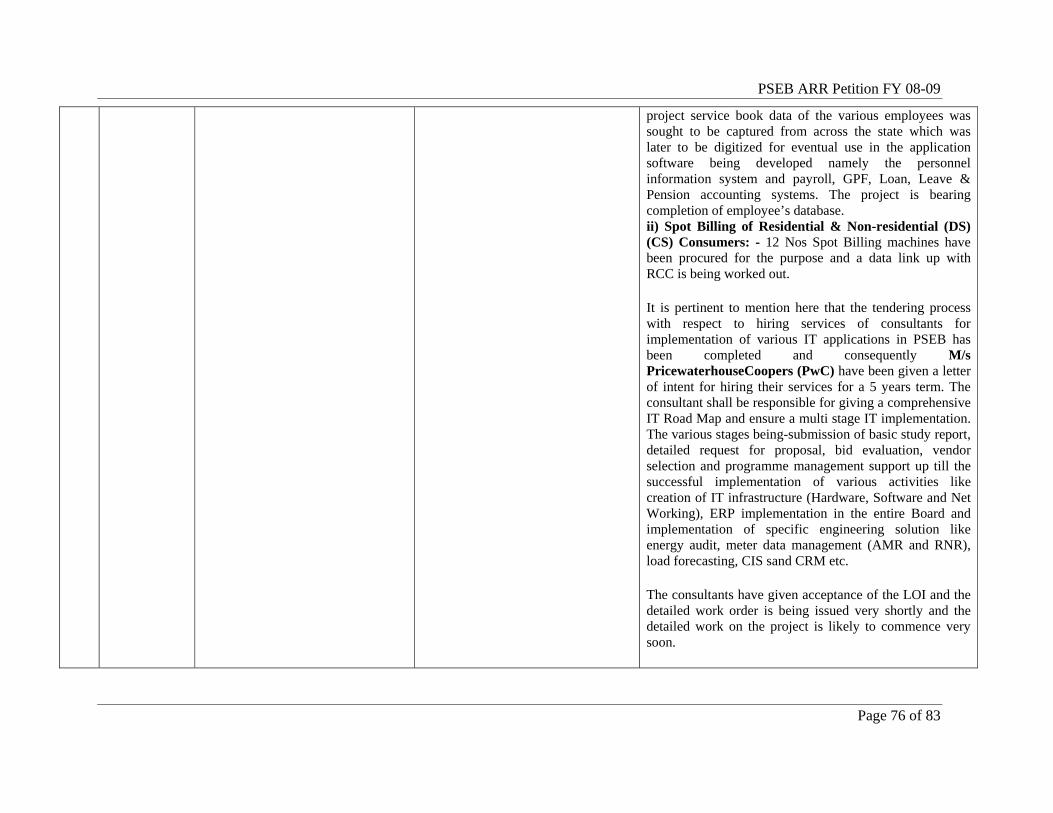
PSEB ARR Petition FY 08-09
Page 76 of 83
project service book data of the various employees was sought to be captured from across the state which was later to be digitized for eventual use in the application software being developed namely the personnel information system and payroll, GPF, Loan, Leave & Pension accounting systems. The project is bearing completion of employee’s database. ii) Spot Billing of Residential & Non-residential (DS) (CS) Consumers: - 12 Nos Spot Billing machines have been procured for the purpose and a data link up with RCC is being worked out.
It is pertinent to mention here that the tendering process with respect to hiring services of consultants for implementation of various IT applications in PSEB has been completed and consequently M/s PricewaterhouseCoopers (PwC) have been given a letter of intent for hiring their services for a 5 years term. The consultant shall be responsible for giving a comprehensive IT Road Map and ensure a multi stage IT implementation. The various stages being-submission of basic study report, detailed request for proposal, bid evaluation, vendor selection and programme management support up till the successful implementation of various activities like creation of IT infrastructure (Hardware, Software and Net Working), ERP implementation in the entire Board and implementation of specific engineering solution like energy audit, meter data management (AMR and RNR), load forecasting, CIS sand CRM etc.
The consultants have given acceptance of the LOI and the detailed work order is being issued very shortly and the detailed work on the project is likely to commence very soon.
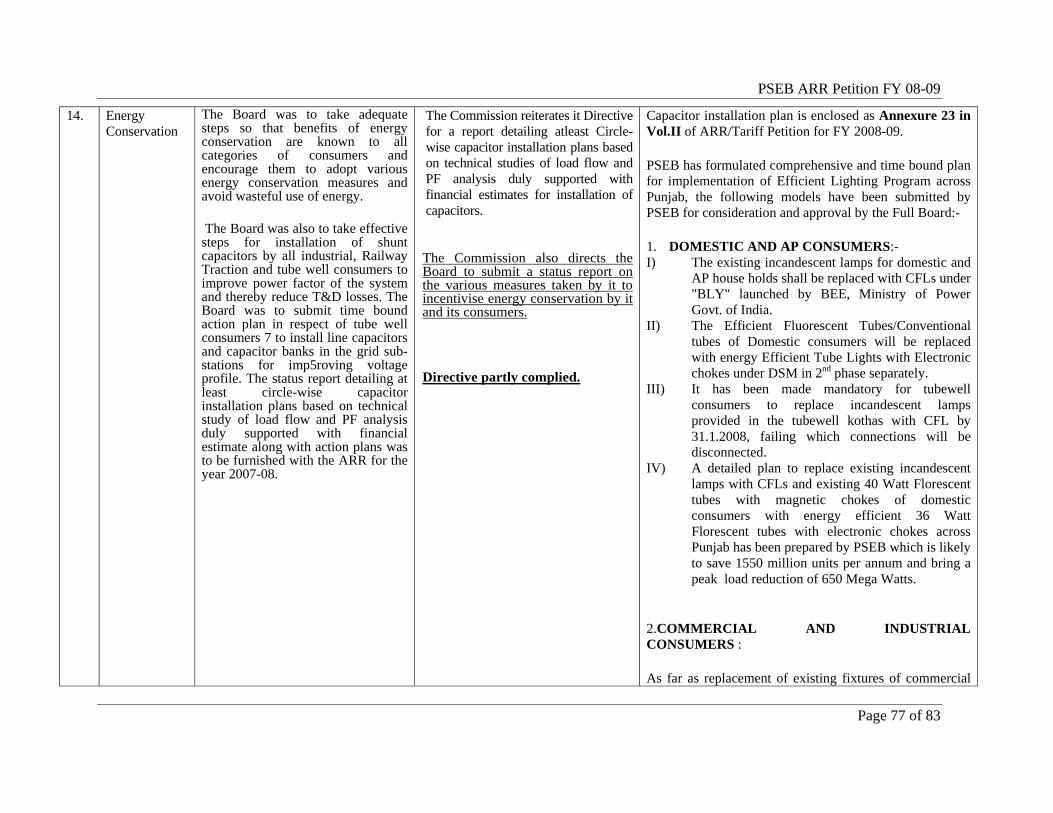
PSEB ARR Petition FY 08-09
Page 77 of 83
14. Energy Conservation
The Board was to take adequate steps so that benefits of energy conservation are known to all categories of consumers and encourage them to adopt various energy conservation measures and avoid wasteful use of energy.
The Board was also to take effective steps for installation of shunt capacitors by all industrial, Railway Traction and tube well consumers to improve power factor of the system and thereby reduce T&D losses. The Board was to submit time bound action plan in respect of tube well consumers 7 to install line capacitors and capacitor banks in the grid sub-stations for imp5roving voltage profile. The status report detailing at least circle-wise capacitor installation plans based on technical study of load flow and PF analysis duly supported with financial estimate along with action plans was to be furnished with the ARR for the year 2007-08.
The Commission reiterates it Directive for a report detailing atleast Circle-wise capacitor installation plans based on technical studies of load flow and PF analysis duly supported with financial estimates for installation of capacitors.
The Commission also directs the Board to submit a status report on the various measures taken by it to incentivise energy conservation by it and its consumers.
Directive partly complied.
Capacitor installation plan is enclosed as Annexure 23 in Vol.II of ARR/Tariff Petition for FY 2008-09.
PSEB has formulated comprehensive and time bound plan for implementation of Efficient Lighting Program across Punjab, the following models have been submitted by PSEB for consideration and approval by the Full Board:-
1. DOMESTIC AND AP CONSUMERS:- I) The existing incandescent lamps for domestic and
AP house holds shall be replaced with CFLs under "BLY" launched by BEE, Ministry of Power Govt. of India.
II) The Efficient Fluorescent Tubes/Conventional tubes of Domestic consumers will be replaced with energy Efficient Tube Lights with Electronic chokes under DSM in 2nd phase separately.
III) It has been made mandatory for tubewell consumers to replace incandescent lamps provided in the tubewell kothas with CFL by 31.1.2008, failing which connections will be disconnected.
IV) A detailed plan to replace existing incandescent lamps with CFLs and existing 40 Watt Florescent tubes with magnetic chokes of domestic consumers with energy efficient 36 Watt Florescent tubes with electronic chokes across Punjab has been prepared by PSEB which is likely to save 1550 million units per annum and bring a peak load reduction of 650 Mega Watts.
2.COMMERCIAL AND INDUSTRIAL CONSUMERS :
As far as replacement of existing fixtures of commercial
PSEB ARR Petition FY 08-09
Page 78 of 83
and industrial consumers is concerned, the same may be made mandatory and got implemented by order to be issued by CE/Commercial. It has also been already suggested that some incentive be allowed to such consumers to attract them for implementation of the order.
3.PSEB IN-HOUSE
PSEB has decided to procure Efficient Lighting system for in-house PSEB requirements by Energy Conservation Directorate by inviting Limited Tenders from 6 Nos of manufacturers enlisted by BEE, Ministry of Power, Govt. of India as per the specifications approved by PSEB committee on Efficient Lighting Program. As per the decision, the NIT has been floated for invitation/submission of quotations from all the 6 Nos Manufacturers.
4. AGRICULTURE PUMPS:
PSEB has formulated the proposal to replace all the 10 Lac in-Efficient Agriculture Pumps with efficient pumps with the financial help of World Bank of other agencies or under CDM as approximately Rs. 1500 Crores funds are required to implement this project. Moreover, BIS and BEE have not still endorsed Efficient pumps and their manufacturers.
5. BUILDING ENERGY AWARENESS OF CONSERVATION: PSEB has taken various measures to encourage all categories of consumers to adopt various conservation measures and avoid wasteful use of Energy. Board has set a target of organizing 20 Number functions to be celebrated on 14 Dec. of every year in different zones under the supervision of Director/Energy
PSEB ARR Petition FY 08-09
Page 79 of 83
Conservation and provided stalls in 5 Nos Kisan Melas organized by Punjab Agricultural University Ludhiana in different cities of Punjab to encourage energy Conservation. For the Agriculture consumer every year besides energy conservation slogans in Punjabi & English, advertisement publications, announcement of Radio, TV have also been designed for the year 2007-08.
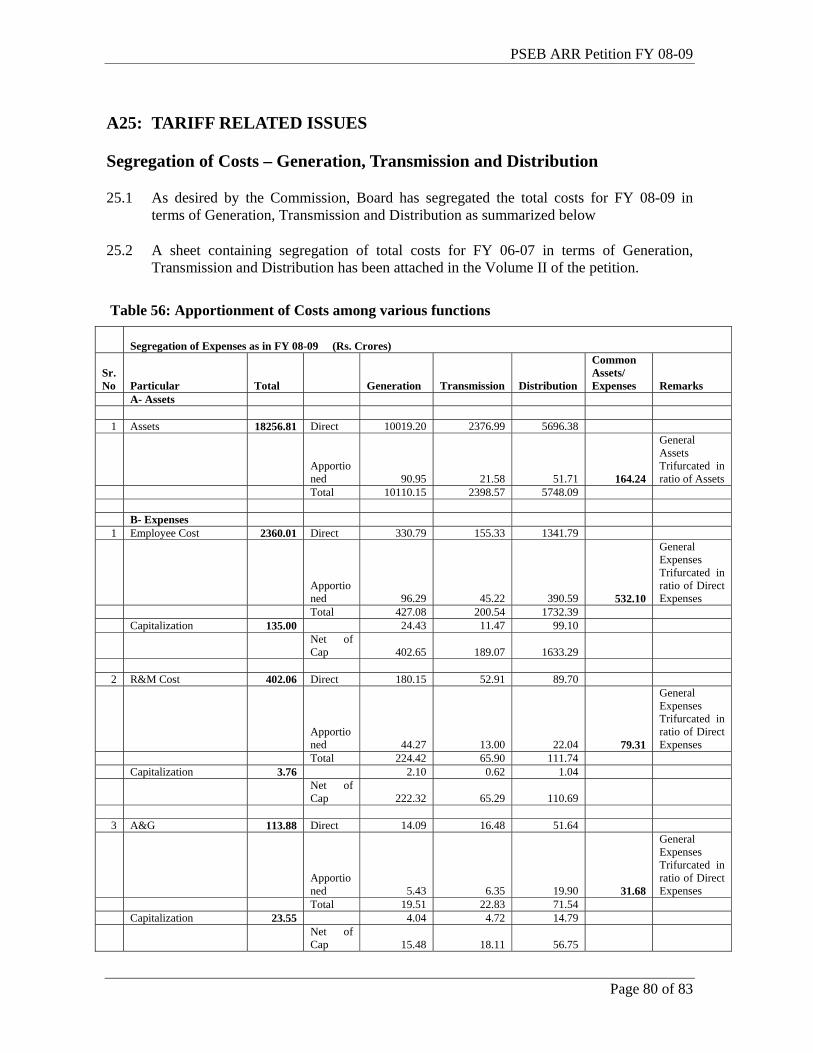
PSEB ARR Petition FY 08-09
Page 80 of 83
A25: TARIFF RELATED ISSUES
Segregation of Costs – Generation, Transmission and Distribution
25.1 As desired by the Commission, Board has segregated the total costs for FY 08-09 in terms of Generation, Transmission and Distribution as summarized below
25.2 A sheet containing segregation of total costs for FY 06-07 in terms of Generation, Transmission and Distribution has been attached in the Volume II of the petition.
Table 56: Apportionment of Costs among various functions
Segregation of Expenses as in FY 08-09 (Rs. Crores)
Sr. No Particular Total Generation Transmission Distribution
Common Assets/ Expenses Remarks
A- Assets
1 Assets 18256.81 Direct 10019.20 2376.99 5696.38
Apportioned 90.95 21.58 51.71 164.24
General Assets Trifurcated in ratio of Assets
Total 10110.15 2398.57 5748.09 B- Expenses
1 Employee Cost 2360.01 Direct 330.79 155.33 1341.79
Apportioned 96.29 45.22 390.59 532.10
General Expenses Trifurcated in ratio of Direct Expenses
Total 427.08 200.54 1732.39 Capitalization 135.00 24.43 11.47 99.10
Net of Cap 402.65 189.07 1633.29
2 R&M Cost 402.06 Direct 180.15 52.91 89.70
Apportioned 44.27 13.00 22.04 79.31
General Expenses Trifurcated in ratio of Direct Expenses
Total 224.42 65.90 111.74 Capitalization 3.76 2.10 0.62 1.04
Net of Cap 222.32 65.29 110.69
3 A&G 113.88 Direct 14.09 16.48 51.64
Apportioned 5.43 6.35 19.90 31.68
General Expenses Trifurcated in ratio of Direct Expenses
Total 19.51 22.83 71.54 Capitalization 23.55 4.04 4.72 14.79
Net of Cap 15.48 18.11 56.75
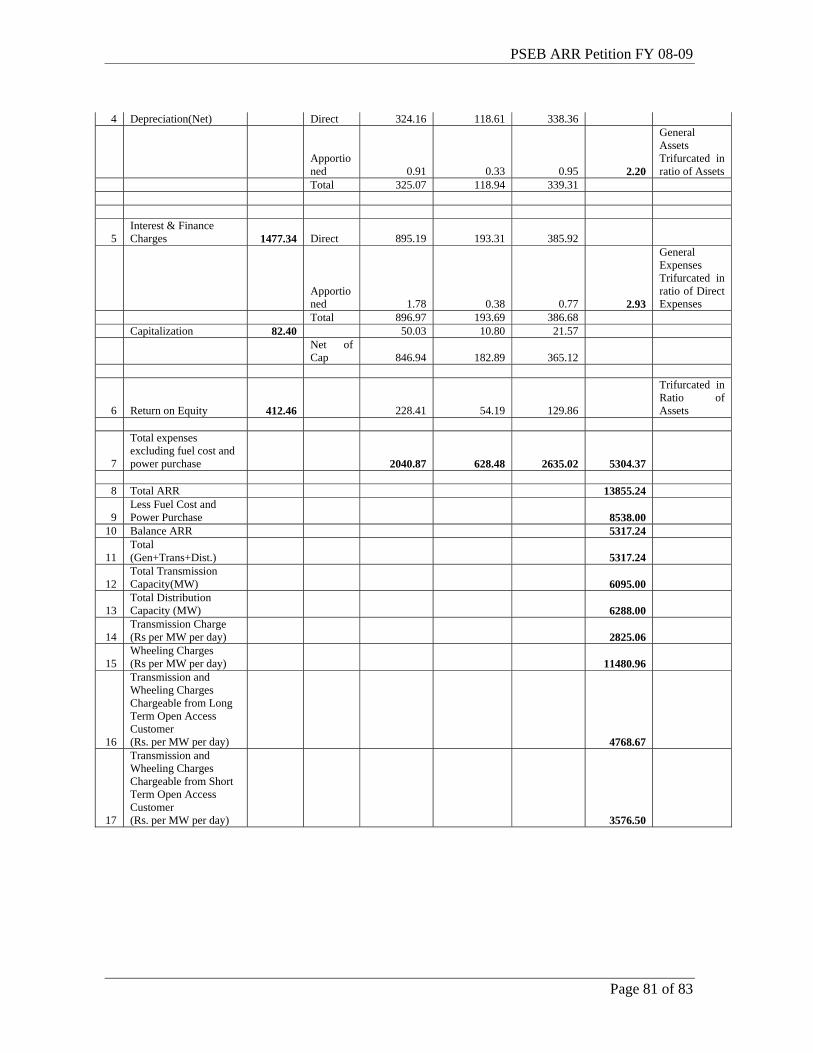
PSEB ARR Petition FY 08-09
Page 81 of 83
4 Depreciation(Net) Direct 324.16 118.61 338.36
Apportioned 0.91 0.33 0.95 2.20
General Assets Trifurcated in ratio of Assets
Total 325.07 118.94 339.31
5 Interest & Finance Charges 1477.34 Direct 895.19 193.31 385.92
Apportioned 1.78 0.38 0.77 2.93
General Expenses Trifurcated in ratio of Direct Expenses
Total 896.97 193.69 386.68 Capitalization 82.40 50.03 10.80 21.57
Net of Cap 846.94 182.89 365.12
6 Return on Equity 412.46 228.41 54.19 129.86
Trifurcated in Ratio of Assets
7
Total expenses excluding fuel cost and power purchase 2040.87 628.48 2635.02 5304.37
8 Total ARR 13855.24
9 Less Fuel Cost and Power Purchase 8538.00
10 Balance ARR 5317.24
11 Total (Gen+Trans+Dist.) 5317.24
12 Total Transmission Capacity(MW) 6095.00
13 Total Distribution Capacity (MW) 6288.00
14 Transmission Charge (Rs per MW per day) 2825.06
15 Wheeling Charges (Rs per MW per day) 11480.96
16
Transmission and Wheeling Charges Chargeable from Long Term Open Access Customer (Rs. per MW per day) 4768.67
17
Transmission and Wheeling Charges Chargeable from Short Term Open Access Customer (Rs. per MW per day) 3576.50
PSEB ARR Petition FY 08-09
Page 82 of 83
A26: WAIVER
26.1 This ARR & Tariff Revision Petition covers most of the requirements specified by the Commission from time to time. PSEB has endeavored to comply with the extensive information requirements prescribed by the Commission.
26.2 PSEB requests the Commission to condone any inadvertent omissions/ errors/ shortcomings and permit the Petitioner to add/ change/ modify/ alter this filing and make further submissions as may be required at a future date.
26.3 PSEB has segregated the transmission and wheeling costs and the same has been furnished with the petition.
26.4 PSEB submits to the Commission that it would submit necessary additional information required by the Commission during the processing of this petition
A27: PRAYER
27.1 PSEB requests the Hon’ble Commission to:
(a) Approve the Aggregate Revenue Requirement for FY 08-09.
(b) Treat the filing as complete in view of substantial compliance as also the specific requests for waivers with justification placed on record;
(c) Allow the remaining provisions for tariff as per existing PSEB Tariff for supply of Electricity rules, regulations and guidelines as amended upto date;
(d) And pass such other and further orders as are deemed fit and proper in the facts and circumstances of the case.
BY THE APPLICANT THROUGH
Er. P. P. Garg
January 31, 2008 Chief Engineer (Commercial) Punjab State Electricity Board, Patiala
PSEB ARR Petition FY 08-09
Page 83 of 83
A28: ANNEXURE - DETAILED FORMATS


![[XLS]himachal.nic.inhimachal.nic.in/WriteReadData/l892s/16_l892s/chamba 19... · Web view14 5/3/2017 13:41:15 5/3/2017 13:51:21 76.400299072266 30.326700210571 23 147001 2010705702](https://img.pdfslide.net/doc/110x75/5ac0c7b37f8b9a4e7c8c423e/xls-19web-view14-532017-134115-532017-135121-76400299072266-30326700210571.jpg)