Embed Size (px)
Citation preview

Make EBM Individualized and Smarter
Hao-min Cheng, M.D., PhD. Department of Medical Education, Taipei Veterans General Hospital
Division of Cardiology, Taipei Veterans General HospitalFaculty of Medicine, National Yang-Ming University, Taiwan
1


Presentation Outline
Core epistemological principle of EBM
The principal of EBM application
Shared Decision Making
Make EBM Individualized
Why and how?
Maker EBM smarter
Learning on demand
Medical calculation in EMR
A better EBM inquiry system
Take Home Messages
3

Presentation Outline
Core epistemological principle of EBM
The principal of EBM application
Shared Decision Making
Make EBM Individualized
Why and how?
Maker EBM smarter
Learning on demand
Medical calculation in EMR
A better EBM inquiry system
Take Home Messages
4

Benchmark of Clinical Research
5

Benchmark of Clinical Research
6

3 Epistemological Principles of EBM
Djulbegovic B, Guyatt GH. Progress in evidence-based medicine: a quarter century on. The Lancet; 390(10092):415-423.
Not all evidence is created equal
The pursuit of truth is best accomplished by evaluating the totality of the evidence
Clinical decision making requires consideration of patients’ values and preferences
Practice of medicine should be
based on the best available
evidence.
Health claims should be based on
systematic reviews that summarise
the best available evidence
Effective decision making has to
address the consequences of
importance to the decision maker

Presentation Outline
Core epistemological principle of EBM
The principal of EBM application
Shared Decision Making
Make EBM Individualized
Why and how?
Maker EBM smarter
Learning on demand
Medical calculation in EMR
A better EBM inquiry system
Take Home Messages
8

實證醫學應用模式
9
Progress in evidence-based medicine: a quarter century on.The Lancet.390(10092):415-423.
10
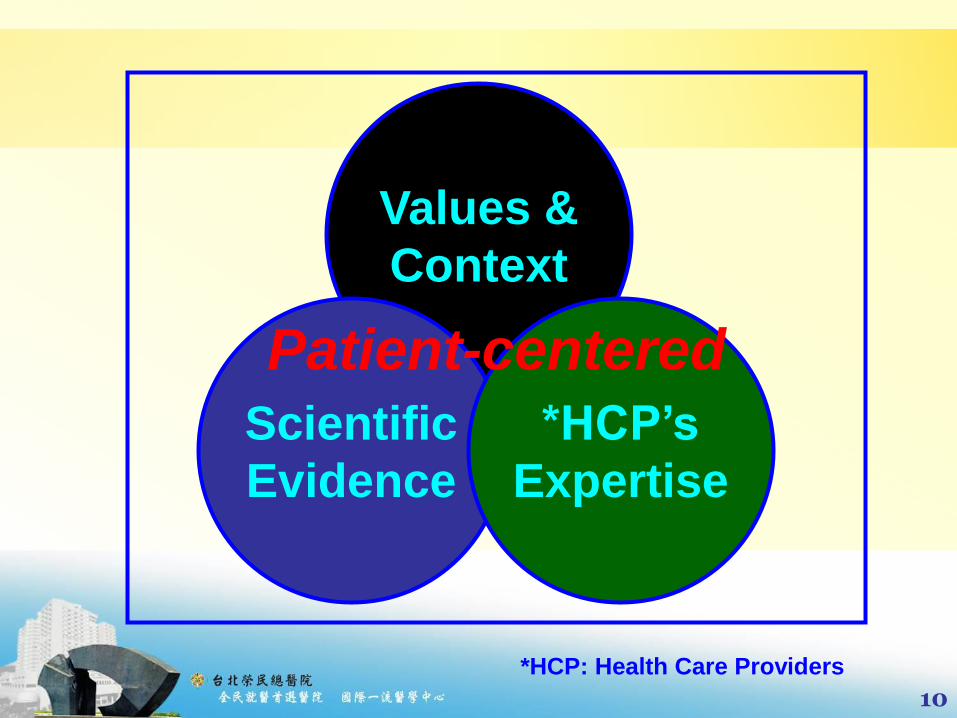
Values &
Context
Scientific
Evidence
*HCP’s
Expertise
Patient-centered
*HCP: Health Care Providers

The SHARE ApproachEssential Steps of Shared Decision Making

Step 1: Seek your patient’s participation
Step 2: Help your patient explore and compare treatment options You need the help of SR for decision aids
Step 3: Assess your patient’s values and preferences
Step 4: Reach a decision with your patient
Step 5: Evaluate your patient’s decision
The SHARE Approach
12
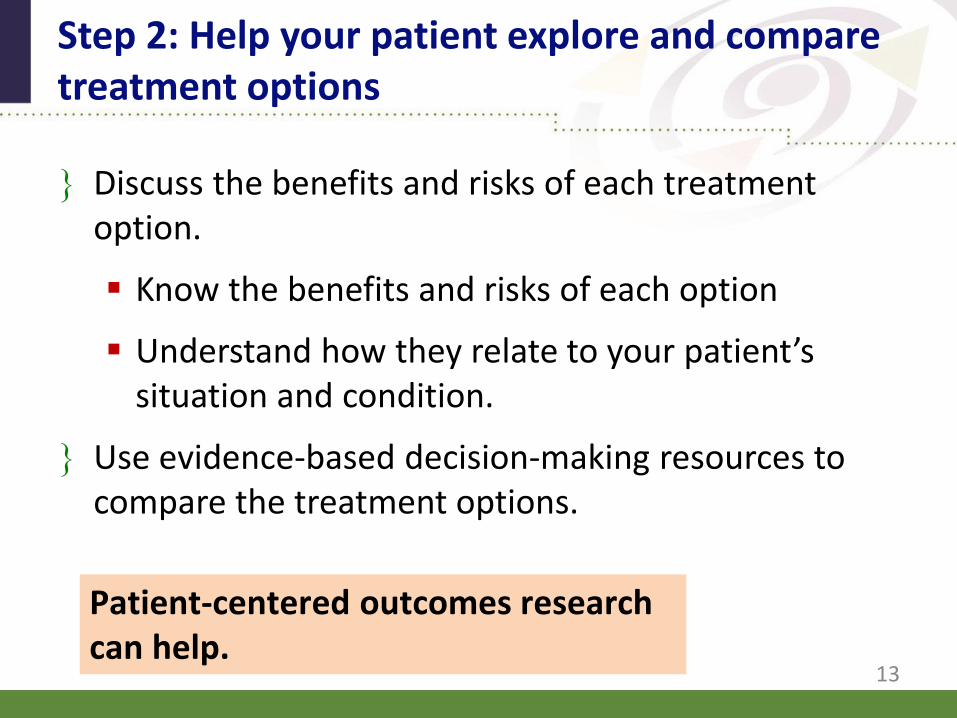
Discuss the benefits and risks of each treatment option.
Know the benefits and risks of each option
Understand how they relate to your patient’s situation and condition.
Use evidence-based decision-making resources to compare the treatment options.
Step 2: Help your patient explore and compare treatment options
13
Patient-centered outcomes research can help.

Effective Health Care Program activities
Evidence synthesis
Development of systematic reviews of existing evidence to compare treatment/intervention effectiveness and identifying relevant knowledge gaps
• Compare the benefits and harms of treatment options
• Explain what is known and what is not known
14

Health Decisions
Good decisions Informed
Supported by best evidence
Compatible with patients values
Considers patients preferences
Weigh pros and cons
Practical
Poor decisions Objective data inadequate
Too few options considered
Alternatives unclear
Values and preferences unexplored
Roles unclear
Communication is poor
Cornelia Rulandhttp://www.dbmi.columbia.edu/homepages/cmr7001/sdm/html/decision_support.htm

Decision Aids
Designed to Provide information on
options Help people participate
in decision making Help clarify and
communicate personal values
NOT designed to Advise people to choose
one option over another Not meant to replace
physician consultation
Cornelia Rulandhttp://www.dbmi.columbia.edu/homepages/cmr7001/sdm/html/decision_support.htm
Prepare Patients to Make Informed, Value-based Decisions with Their Physicians

Presentation Outline
Core epistemological principle of EBM
The principal of EBM application
Shared Decision Making
Make EBM Individualized
Why and how?
Maker EBM smarter
Learning on demand
Medical calculation in EMR
A better EBM inquiry system
Take Home Messages
17

What do you mean by patient value?
The patients’ preference can be related to Intervention options: it is subjective but important!
Multiple outcomes resulting from intervention: it can be objective
18

Let us do a opinion poll!
Which of the following outcomes you rate the most critical to you:
A. Myocardial infarction 心肌梗塞
B. Stroke or systemic embolism 缺血性中風
C. Intracranial hemorrhage 顱內出血
D. Gastrointestinal bleeding 胃出血
E. All-cause death 死亡
19

Patients and clinical trialists did not weigh individual components of a composite end point equally.
Whereas trialists are most concerned about avoiding death, patients place equal or greater importance on reducing myocardial infarction or stroke
20Circulation. 2014;130:1254-1261

Adjusted end point weights according to patient age, race, and annual income
21
Circulation. 2014;130:1254-1261

End point weights of clinical trialist
22Circulation. 2014;130:1254-1261

Stroke Prevention for Atrial Fibrillation
23
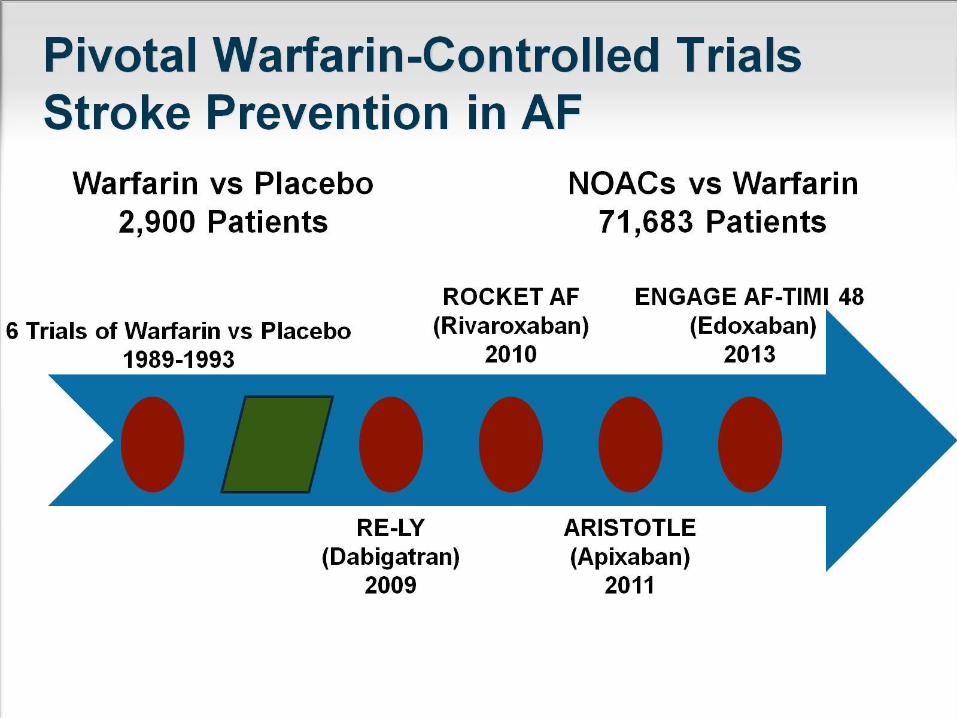
Effective aNticoaGulation with factor xAnext GEneration in Atrial Fibrillation

Edoxaban30 mg QD regimen
Warfarin (INR 2.0–3.0)
Edoxaban60 mg QD regimen
PATIENTSAF on electrical recording within last 12 months
Intended oral anticoagulant
CHADS2 ≥2
N=21,105
Median duration of follow up 2.8 years
Study design: ENGAGE AF-TIMI 48
*Dose reduced by 50% if CrCl 30–50 mL/min, body weight ≤60 kg
or patient receiving verapamil, quinidine or dronedarone
AF=atrial fibrillation; CrCl=creatinine clearance
INR=International Normalized Ratio; QD=once daily
RANDOMIZATION1:1:1 randomization is stratified by CHADS2 score 2–3 versus 4–6
and need for edoxaban dose reduction*
Randomized,double-blind,
double-dummy,event-driven study
Giugliano et al. N Engl J Med 2013; DOI: 10.1056/NEJMoa1310907

Primary Endpoint: Stroke / SEE(2.8 years median f/u)
Noninferiority Analysis (mITT, On Treatment)
0.79
0.50 1.00 2.0
Edoxaban 60* mg QD
vs warfarin
Edoxaban 30* mg QD
vs warfarin
P Values
Non-inferiority Superiority
P<0.0001
P=0.005
Hazard ratio (97.5% CI)
1.07
1.38
P=0.017
P=0.44
edoxaban noninferior
0.87P=0.08
P=0.10
Hazard ratio (97.5% CI)
1.13
0.50 1.00 2.0
P Value for Superiority
Edoxaban 60* mg QD
vs warfarin
Edoxaban 30* mg QD
vs warfarin
edoxaban better warfarin better
Superiority Analysis (ITT, Overall)
Warfarin TTR 68.4%
*Dose reduced by
50% in selected ptsGiugliano RP. NEJM 2013; 369:2093-2104

Key Secondary Outcomes
edoxaban better warfarin better
Warfarin TTR 68.4%
*Dose reduced by 50%
in selected pts
2° EP: Stroke, SEE, CV death
Death or ICH
All-cause mortality
CV death
Myocardial infarction
HR (95% CI)
Hem. Stroke
Ischemic Stroke
0.25 1.00 2.00.5
Edoxaban 60* mg QD
vs warfarin
0.94
1.411.00
0.540.33
0.87
0.87
0.92
0.86
Edoxaban 30* mg QD
vs warfarin
0.95
0.82
0.87
0.85
1.19
P vs
warfarin
E-60 E-30
<0.001
<0.001
0.97
<0.001
0.005
0.32
0.004
<0.001
0.08
0.006
0.013
0.008
0.60
0.13
Giugliano RP. NEJM 2013; 369:2093-2104

Key Safety Results- Safety Cohort on Treatment -
P Value
vs warfarin
Safety cohort=all patients who received at least 1 dose study drug
*Dose reduced by
50% in selected pts
Warfarin TTR 68.4%HR (95% CI)
Edoxaban 60* mg QD
vs warfarin
Edoxaban 30* mg QD
vs warfarin
edoxaban better warfarin better0.25 1.00.5
P<0.001
P<0.001
ISTH Major Bleeding0.80
0.47
2.0
Fatal Bleeding 0.55
0.35P=0.006
P<0.001
Intracranial Hemorrhage
0.47
0.30P<0.001
P<0.001
Gastrointestinal Bleeding1.23
0.67P=0.03P<0.001
Giugliano RP. NEJM 2013; 369:2093-2104

You have so many choices and so many outcomes!!!
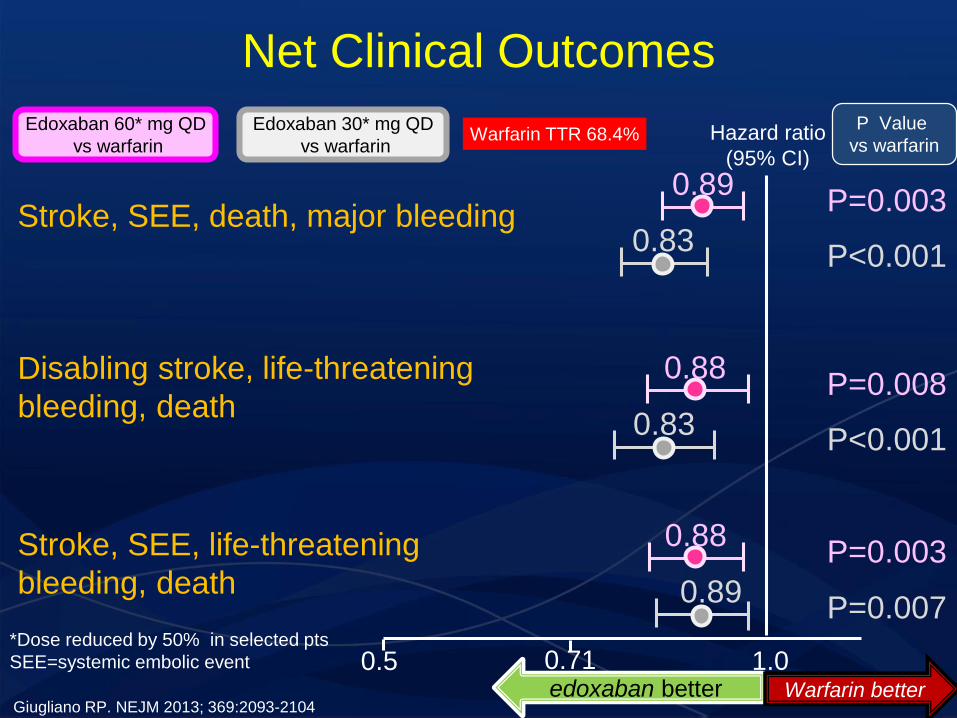
Net Clinical Outcomes
31
Warfarin TTR 68.4% Hazard ratio
(95% CI)
Edoxaban 60* mg QD
vs warfarin
edoxaban better Warfarin better
0.5 1.00.71*Dose reduced by 50% in selected pts
SEE=systemic embolic event
P Value
vs warfarin
Stroke, SEE, death, major bleeding0.89
P=0.003
P<0.001
Disabling stroke, life-threatening
bleeding, death
0.88P=0.008
P<0.001
Stroke, SEE, life-threatening
bleeding, death
0.88P=0.003
P=0.007
Edoxaban 30* mg QD
vs warfarin
0.83
0.83
0.89
Giugliano RP. NEJM 2013; 369:2093-2104


Gap In the Shared Decision Process
33

BMJ 2016;353:i2452.
Problems faced Scenarios
ComorbiditiesRCT aimed for single condition
Real patients have multiple conditions
Power struggleWhat mean to you doesn’t necessary
mean to the patients
Viewpoints
Risks, benefits, and downsides of
management options may be viewed
differently at the level of the population
than from the perspective of an individual
SDMSDM is not clearly enabled in
contemporary practice
When applying population based evidence to individuals

Decision aids should be published in tandem with guidelines
Guideline itself should be created and evaluated in real-world
Short pressurised consultations may not be the best place for making choices: Coaching system
35

Users’ Guides to the Medical LiteratureXX. Integrating Research Evidence With the Care of the Individual Patient
36JAMA. 2000 Jun 7;283(21):2829-36.
Threshold NNTIntegrate the evidence on benefit or harm with patient values to reach treatment recommendations
Challenges:• Value data not available
• Substantial variation in values between individuals
• Decision analyses that rely on group averages for values may not always
be applicable to a particular patient: close examination of the utility sensitivity analyses of a decision analysis may provide some
guidance

Aim
Desirability of differential weighting of clinical trial end points, but a widely acceptable weighting method has not been advanced
We propose a novel method to generate a value-weighted composite end point

Data Extraction 9 RCTs that compared NOACs with VKAs in patients with nonvalvular AF 5 Outcomes : myocardial infarction, stroke or systemic embolism, intracranial hemorrhage,
gastrointestinal bleeding, and all-cause death
Preparation of End Point Weights
The disability-adjusted life-years (DALYs) The lifetime cost of medical care The clinical end points preferences survey
Meta-analysisMantel-Haenszel fixed-effects model DerSimonian and Laird random-effects model
Summarization
Incorporation of Preference Weights into Individual End Points
Standardized preference-weight for individual end points Age-standardized DALYs per patient
Lifetime medical spending per patient
Importance of individual end points for each subject
Relative weight
Constructing a preference-weight integrated composite end point
1000 resampling iterations
Mean predicted cost per case in subacute phase
Mean predicted cost per case in chronic phase+ +
Mean predicted cost per case in acute phase

Data Extraction
9 RCTs that compared NOACs with VKAs in patients with nonvalvular AF
5 Outcomes
myocardial infarction
stroke or systemic embolism
intracranial hemorrhage
gastrointestinal bleeding
all-cause death

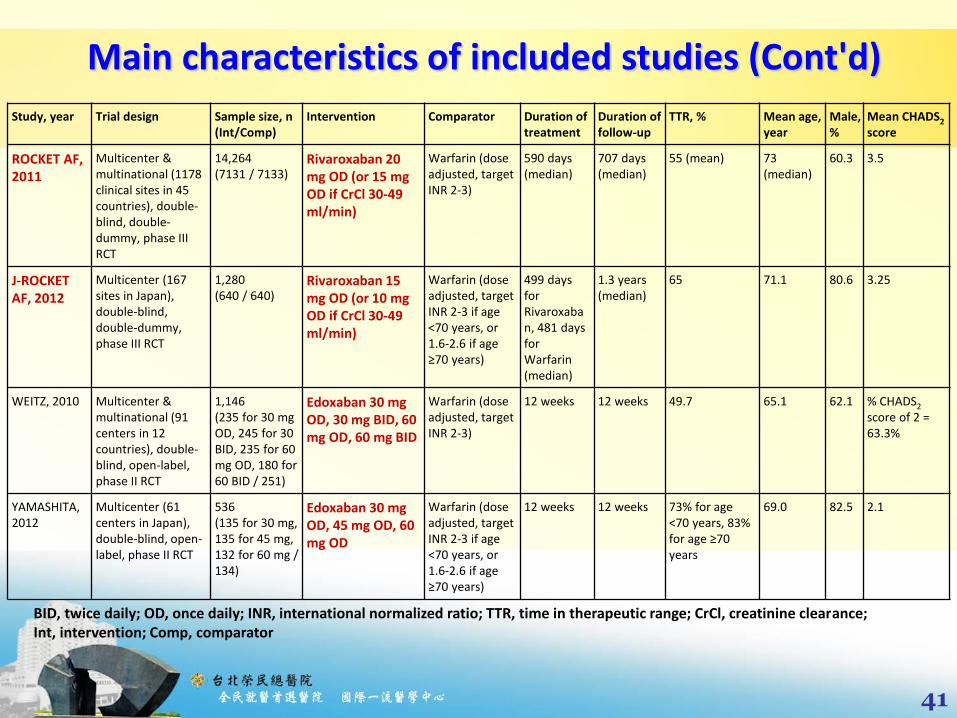
Main characteristics of included studies
40
Study, year Trial design Sample size, n(Int/Comp)
Intervention Comparator Duration of treatment
Duration of follow-up
TTR, % Mean age, year
Male, %
Mean CHADS2
score
ARISTOTLE, 2011
Multicenter & multinational (1034 centers in 39 countries), double-blind, phase III RCT
18,201(9120 / 9081)
Apixaban 5 mg BID (or 2.5 mg BID if ≥2 criteria: age ≥80 years, body weight ≤60 kg, serum creatinine ≥1.5 mg/dl)
Warfarin (dose adjusted, target INR 2-3)
1.8 years (median)
1.8 years (median)
62.2 (mean) 70 (median)
64.7 2.1
ARISTOTLE-J, 2011
Multicenter (23 centers in Japan), double-blind, open-label, phase II RCT
222(74 for 2.5 mg, 74 for 5 mg / 74)
Apixaban 2.5 mg BID, 5 mg BID
Warfarin (dose adjusted, target INR 2-3 if age ≤70 years, or 2-2.6 if age >70 years)
12 weeks (median)
NA Overall ≥60% of patients had INR within the 2-3 range for 60% of the treatment period
70.3 82.9 1.9
CHUNG, 2011
Multinational (4 Asian countries), double-blind, open-label, phase II RCT
235(79 for 30 mg, 80 for 60 mg / 76)
Edoxaban 30 mg OD, 60 mg OD
Warfarin (dose adjusted, target INR 2-3)
3 months 3 months 45.1 65.1 65.4 1.9
ENGAGE AF-TIMI 48, 2013
Multicenter & multinational (1393 centers in 46 countries), double-blind, double-dummy, phase III RCT
21,105(7034 for 30 mg, 7035 for 60 mg / 7036)
Edoxaban 30 mg OD, 60 mg OD
Warfarin (dose adjusted, target INR 2-3)
907 days (medium)
1022 days (medium)
64.9 (mean) 72 (median)
61.9 2.8
RE-LY, 2009
Multicenter & multinational (951 centers in 44 countries), open-label, phase III RCT
18,113(6015 for 110 mg, 6076 for 150 mg / 6022)
Dabigatran 110 mg BID, 150 mg BID
Warfarin (dose adjusted, target INR 2-3)
2 years (median)
2 years (median)
64 (mean) 71.5 63.6 2.1
41
Study, year Trial design Sample size, n(Int/Comp)
Intervention Comparator Duration of treatment
Duration of follow-up
TTR, % Mean age, year
Male, %
Mean CHADS2
score
ROCKET AF, 2011
Multicenter & multinational (1178 clinical sites in 45 countries), double-blind, double-dummy, phase III RCT
14,264(7131 / 7133)
Rivaroxaban 20 mg OD (or 15 mg OD if CrCl 30-49 ml/min)
Warfarin (dose adjusted, target INR 2-3)
590 days (median)
707 days (median)
55 (mean) 73 (median)
60.3 3.5
J-ROCKET AF, 2012
Multicenter (167 sites in Japan), double-blind, double-dummy, phase III RCT
1,280(640 / 640)
Rivaroxaban 15 mg OD (or 10 mg OD if CrCl 30-49 ml/min)
Warfarin (dose adjusted, target INR 2-3 if age <70 years, or 1.6-2.6 if age≥70 years)
499 days for Rivaroxaban, 481 days for Warfarin (median)
1.3 years (median)
65 71.1 80.6 3.25
WEITZ, 2010 Multicenter & multinational (91 centers in 12 countries), double-blind, open-label, phase II RCT
1,146 (235 for 30 mg OD, 245 for 30 BID, 235 for 60 mg OD, 180 for 60 BID / 251)
Edoxaban 30 mg OD, 30 mg BID, 60 mg OD, 60 mg BID
Warfarin (dose adjusted, target INR 2-3)
12 weeks 12 weeks 49.7 65.1 62.1 % CHADS2
score of 2 = 63.3%
YAMASHITA, 2012
Multicenter (61 centers in Japan), double-blind, open-label, phase II RCT
536(135 for 30 mg, 135 for 45 mg, 132 for 60 mg / 134)
Edoxaban 30 mg OD, 45 mg OD, 60 mg OD
Warfarin (dose adjusted, target INR 2-3 if age <70 years, or 1.6-2.6 if age ≥70 years)
12 weeks 12 weeks 73% for age <70 years, 83% for age ≥70 years
69.0 82.5 2.1
Main characteristics of included studies (Cont'd)
BID, twice daily; OD, once daily; INR, international normalized ratio; TTR, time in therapeutic range; CrCl, creatinine clearance; Int, intervention; Comp, comparator

Preparation of End Point Weights
Three metrics
The disability-adjusted life-years (DALYs) developed by WHO Global Burden of Disease Project (GBDP)
The lifetime cost of medical care reimbursed by Taiwan's National Health Insurance
The clinical endpoints preferences surveyed by questionnaire in the field

Disability-adjusted life-years (DALYs)
A summary measure of population health widely used to quantify burden of disease
1 DALY = 1 lost year of "healthy" life in given population, due to combined effects of disability and premature death
Formula

(Stroke. 2011;42:1722-1729)

New versionhttp://ghdx.healthdata.org/gbd-results-tool
DALYs
Open database
Reference

Clinical endpoints preferences survey
Demographic characteristics
Disease history
Importance of each end point to subjects themselves


Incorporation of Preference Weights into Individual End Points
STEP 1: Standardized preference-weight for individualend points
Age-standardized DALYs per patient
Lifetime medical spending per patient
Clinical endpoints preferences for each subject
Mean predicted cost per case in
acute phase
Mean predicted cost per case in subacute phase
Mean predicted cost per case in chronic phase
+ +


Data Extraction 9 RCTs that compared NOACs with VKAs in patients with nonvalvular AF 5 Outcomes : myocardial infarction, stroke or systemic embolism, intracranial hemorrhage,
gastrointestinal bleeding, and all-cause death
Preparation of End Point Weights
The disability-adjusted life-years (DALYs) The clinical end points preferences survey
Meta-analysisMantel-Haenszel fixed-effects model DerSimonian and Laird random-effects model
Summarization
Incorporation of Value Weights into Individual End Points
Standardized value-weight for individual end points
Age-standardized DALYs per patient
Importance of individual end points for each subject
Relative weight
Constructing a value-weight integrated composite end point
1000 resampling iterations
Age−standardized DALY rate (per 100,000)
Age−standardized prevalence (per 100,000)
Weight in each outcome
Mean of weights of five outcomes
Relative weight𝑖× Number of events𝑖

Data Extraction
9 RCTs that compared NOACs with VKAs in patients with nonvalvular AF
5 Outcomes
myocardial infarction
stroke or systemic embolism
intracranial hemorrhage
gastrointestinal bleeding
all-cause death

Main characteristics of included studies
Study, year Trial design Sample size, n(Int/Comp)
Intervention Comparator Duration of treatment
Duration of follow-up
TTR, % Mean age, year
Male, %
Mean CHADS2
score
ARISTOTLE, 2011
Multicenter & multinational (1034 centers in 39 countries), double-blind, phase III RCT
18,201(9120 / 9081)
Apixaban 5 mg BID (or 2.5 mg BID if ≥2 criteria: age ≥80 years, body weight ≤60 kg, serum creatinine ≥1.5 mg/dl)
Warfarin (dose adjusted, target INR 2-3)
1.8 years (median)
1.8 years (median)
62.2 (mean) 70 (median) 64.7 2.1
ARISTOTLE-J, 2011
Multicenter (23 centers in Japan), double-blind, open-label, phase II RCT
222(74 for 2.5 mg, 74 for 5 mg / 74)
Apixaban 2.5 mg BID, 5 mg BID
Warfarin (dose adjusted, target INR 2-3 if age ≤70 years, or 2-2.6 if age >70 years)
12 weeks (median)
NA Overall ≥60% of patients had INR within the 2-3 range for 60% of the treatment period
70.3 82.9 1.9
CHUNG, 2011 Multinational (4 Asian countries), double-blind, open-label, phase II RCT
235(79 for 30 mg, 80 for 60 mg / 76)
Edoxaban 30 mg OD, 60 mg OD
Warfarin (dose adjusted, target INR 2-3)
3 months 3 months 45.1 65.1 65.4 1.9
ENGAGE AF-TIMI 48, 2013
Multicenter & multinational (1393 centers in 46 countries), double-blind, double-dummy, phase III RCT
21,105(7034 for 30 mg, 7035 for 60 mg / 7036)
Edoxaban 30 mg OD, 60 mg OD
Warfarin (dose adjusted, target INR 2-3)
907 days (medium)
1022 days (medium)
64.9 (mean) 72 (median) 61.9 2.8
RE-LY, 2009 Multicenter & multinational (951 centers in 44 countries), open-label, phase III RCT
18,113(6015 for 110 mg, 6076 for 150 mg / 6022)
Dabigatran 110 mg BID, 150 mg BID
Warfarin (dose adjusted, target INR 2-3)
2 years (median)
2 years (median)
64 (mean) 71.5 63.6 2.1

Main characteristics of included studies (Cont'd)
Study, year Trial design Sample size, n(Int/Comp)
Intervention Comparator Duration of treatment
Duration of follow-up
TTR, % Mean age, year
Male, %
Mean CHADS2
score
ROCKET AF, 2011
Multicenter & multinational (1178 clinical sites in 45 countries), double-blind, double-dummy, phase III RCT
14,264(7131 / 7133)
Rivaroxaban 20 mg OD (or 15 mg OD if CrCl30-49 ml/min)
Warfarin (dose adjusted, target INR 2-3)
590 days (median)
707 days (median)
55 (mean) 73 (median) 60.3 3.5
J-ROCKET AF, 2012
Multicenter (167 sites in Japan), double-blind, double-dummy, phase III RCT
1,280(640 / 640)
Rivaroxaban 15 mg OD (or 10 mg OD if CrCl30-49 ml/min)
Warfarin (dose adjusted, target INR 2-3 if age <70 years, or 1.6-2.6 if age ≥70 years)
499 days for Rivaroxaban, 481 days for Warfarin (median)
1.3 years (median)
65 71.1 80.6 3.25
WEITZ, 2010 Multicenter & multinational (91 centers in 12 countries), double-blind, open-label, phase II RCT
1,146 (235 for 30 mg OD, 245 for 30 BID, 235 for 60 mg OD, 180 for 60 BID / 251)
Edoxaban 30 mg OD, 30 mg BID, 60 mg OD, 60 mg BID
Warfarin (dose adjusted, target INR 2-3)
12 weeks 12 weeks 49.7 65.1 62.1 % CHADS2 score of 2 = 63.3%
YAMASHITA, 2012
Multicenter (61 centers in Japan), double-blind, open-label, phase II RCT
536(135 for 30 mg, 135 for 45 mg, 132 for 60 mg / 134)
Edoxaban 30 mg OD, 45 mg OD, 60 mg OD
Warfarin (dose adjusted, target INR 2-3 if age <70 years, or 1.6-2.6 if age ≥70 years)
12 weeks 12 weeks 73% for age <70 years, 83% for age ≥70 years
69.0 82.5 2.1
BID, twice daily; OD, once daily; INR, international normalized ratio; TTR, time in therapeutic range; CrCl, creatinine clearance; Int, intervention; Comp, comparator

Preparation of End Point Weights
Two metrics
The disability-adjusted life-years (DALYs) developed by WHO Global Burden of Disease Project (GBDP)
The clinical endpoints preferences surveyed by questionnaire in the field

Disability-adjusted life-years (DALYs)
A summary measure of population health widely used to quantify burden of disease
1 DALY = 1 lost year of "healthy" life in given population, due to combined effects of disability and premature death
Formula

New versionhttp://ghdx.healthdata.org/gbd-results-tool
DALYs
Open database
Reference
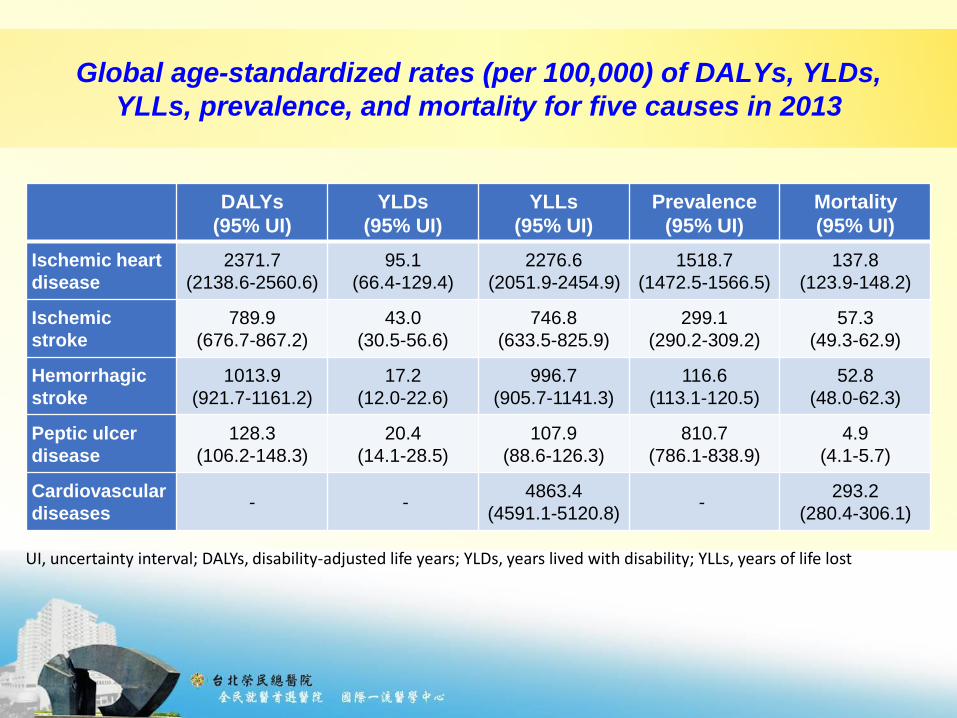
Global age-standardized rates (per 100,000) of DALYs, YLDs,
YLLs, prevalence, and mortality for five causes in 2013
DALYs
(95% UI)
YLDs
(95% UI)
YLLs
(95% UI)
Prevalence
(95% UI)
Mortality
(95% UI)
Ischemic heart
disease
2371.7
(2138.6-2560.6)
95.1
(66.4-129.4)
2276.6
(2051.9-2454.9)
1518.7
(1472.5-1566.5)
137.8
(123.9-148.2)
Ischemic
stroke
789.9
(676.7-867.2)
43.0
(30.5-56.6)
746.8
(633.5-825.9)
299.1
(290.2-309.2)
57.3
(49.3-62.9)
Hemorrhagic
stroke
1013.9
(921.7-1161.2)
17.2
(12.0-22.6)
996.7
(905.7-1141.3)
116.6
(113.1-120.5)
52.8
(48.0-62.3)
Peptic ulcer
disease
128.3
(106.2-148.3)
20.4
(14.1-28.5)
107.9
(88.6-126.3)
810.7
(786.1-838.9)
4.9
(4.1-5.7)
Cardiovascular
diseases- -
4863.4
(4591.1-5120.8)-
293.2
(280.4-306.1)
UI, uncertainty interval; DALYs, disability-adjusted life years; YLDs, years lived with disability; YLLs, years of life lost

Clinical endpoints preferences survey
• Demographic characteristics• Disease history• Importance of each endpoint to subjects themselves

63
Distribution of endpoints preferences (N=172)
Myocardial
infarction
Ischemic
stroke
Hemorrhagic
stroke
Gastrointestinal
bleeding
All-cause
death
Importance Score N (%) N (%) N (%) N (%) N (%)
Minimal 1 2 (1.16) 2 (1.16) 2 (1.16) 5 (2.91) 15 (8.72)
2 4 (2.33) 2 (1.16) 1 (0.58) 3 (1.74) 10 (5.81)
3 2 (1.16) 2 (1.16) 0 (0.00) 13 (7.56) 9 (5.23)
4 0 (0.00) 1 (0.58) 2 (1.16) 12 (6.98) 8 (4.65)
5 10 (5.81) 8 (4.65) 6 (3.49) 34 (19.77) 12 (6.98)
6 6 (3.49) 4 (2.33) 4 (2.33) 28 (16.28) 6 (3.49)
7 4 (2.33) 11 (6.40) 9 (5.23) 21 (12.21) 0 (0.00)
8 25 (14.53) 32 (18.60) 28 (16.28) 24 (13.95) 7 (4.07)
9 22 (12.79) 35 (20.35) 31 (18.02) 4 (2.33) 4 (2.33)
Maximal 10 97 (56.40) 75 (43.60) 89 (51.74) 28 (16.28) 101 (58.72)
E(score) 8.7093 8.5930 8.8488 6.3430 7.5116

Incorporation of Value Weights into Individual End Points
STEP 1: Standardized value-weight for individual end points
Age-standardized DALYs per patient
Clinical endpoints preferences for each subject
Age−standardized DALY rate (per 100,000)
Age−standardized prevalence (per 100,000)

STEP 2: Relative weight for individual end points
STEP 3: Constructing a value-weight integrated composite end point
Weight in each outcome
Mean of weights of five outcomes
Relative weight𝑖 × Number of events𝑖

Comparison of end point weights from two metrics, DALYs and
clinical endpoints preferences
Weights Relative Weights
MI SSE ICH GIBAll-cause
deathMI SSE ICH GIB
All-cause
death
DALYs,
year (per
event)
1.56 (1.42-1.70)
2.64 (2.31-3.00)
8.66 (7.53-9.69)
0.16 (0.13-0.19)
16.59 (15.47-17.80)
0.264 (0.236-0.293)
0.446 (0.387-0.501)
1.462 (1.314-1.603)
0.027 (0.022-0.032)
2.802(2.667-2.940)
Endpoints
preference
s, points
(per
subject)
8.70 (8.38-8.99)
8.59 (8.29-8.84)
8.84(8.55-9.08)
6.35(5.99-6.71)
7.50(6.99-8.00)
1.088 (1.051-1.123)
1.074 (1.040-1.107)
1.106 (1.071-1.137)
0.794 (0.753-0.834)
0.938 (0.882-0.993)
Values are expressed as mean (95% uncertainty interval).DALYs, disability-adjusted life years; MI, Myocardial infarction; SSE, Stroke or systemic embolism; ICH, Intracranial hemorrhage; GIB, Gastrointestinal bleeding
1000 resampling iterations based on the appropriate distribution of weighting parameter

STEP 2: Relative weight for individual end points
STEP 3: Constructing a value-weight integrated composite end point
Weight in each outcome
Mean of weights of five outcomes
Relative weight𝑖 × Number of events𝑖

Meta-analysis
Two types of models were used to statistically combine results
Mantel-Haenszel fixed-effects model
DerSimonian and Laird random-effects model

Summarization
1000 pooled estimates calculated by meta-analysis
DALYs

NOACs VKAs DALYs-weighted (1000 bootstraps)Events Total Events Total RR (95% CI) RR, range 95% LL, range 95% UL, range
Apixaban
ARISTOTLE 1062 9120 1277 9081 0.83 (0.77, 0.89)
ARISTOTLE-J 1 148 4 75 0.13 (0.01, 1.11)
Subtotal 1063 9268 1281 9156
Fixed-effects 0.83 (0.76, 0.89) (0.844, 0.860) (0.797, 0.816) (0.892, 0.906)
Random-effects 0.45 (0.08, 2.52) (0.845, 0.861) (0.799, 0.817) (0.894, 0.907)
Dabigatran
RE-LY 1782 12091 979 6022 0.91 (0.84, 0.97)
Subtotal 1782 12091 979 6022
Fixed-effects 0.91 (0.84, 0.97) (0.848, 0.867) (0.803, 0.824) (0.896, 0.913)
Edoxaban
CHUNG 1 159 2 75 0.24 (0.02, 2.56)
ENGAGE AF 2954 14069 1639 7036 0.90 (0.85, 0.95)
WEITZ 23 469 11 250 1.11 (0.55, 2.25)
YAMASHITA 7 260 4 125 0.84 (0.25, 2.82)
Subtotal 2985 14957 1656 7486
Fixed-effects 0.90 (0.86, 0.95) (0.866, 0.881) (0.834, 0.850) (0.900, 0.913)
Random-effects 0.90 (0.86, 0.95) (0.866, 0.880) (0.833, 0.849) (0.900, 0.913)
Rivaroxaban
J-ROCKET AF 44 640 57 640 0.77 (0.53, 1.13)
ROCKET AF 1260 7111 1318 7125 0.96 (0.89, 1.03)
Subtotal 1304 7751 1375 7765
Fixed-effects 0.95 (0.89, 1.02) (0.901, 0.909) (0.853, 0.864) (0.952, 0.957)
Random-effects 0.93 (0.82, 1.07) (0.901, 0.909) (0.853, 0.864) (0.952, 0.956)
Total 7134 44067 5291 30429
Fixed-effects 0.90 (0.87, 0.93) (0.865, 0.879) (0.844, 0.859) (0.887, 0.899)
Random-effects 0.90 (0.85, 0.94) (0.866, 0.879) (0.844, 0.860) (0.887, 0.900)

72
Cumulative ranking curve for DALYs-weighted results
0
50
100
Best 2nd 3rd Worst0
50
100
Best 2nd 3rd Worst
0
50
100
Best 2nd 3rd Worst0
50
100
Best 2nd 3rd Worst
Apixaban Dabigatran
Edoxaban Rivaroxaban
Cum
ula
tive p
robabili
ty (
%)
SUCRA = 1.0 SUCRA = 0.7
SUCRA = 0.3 SUCRA = 0.0
SUCRA, surface under the cumulative ranking

NOACs VKAs Preferences-weighted (1000 bootstraps)
Events Total Events Total RR (95% CI) RR, range 95% LL, range 95% UL, range
Apixaban
ARISTOTLE 1062 9120 1277 9081 0.83 (0.77, 0.89)
ARISTOTLE-J 1 148 4 75 0.13 (0.01, 1.11)
Subtotal 1063 9268 1281 9156
Fixed-effects 0.83 (0.76, 0.89) (0.811, 0.822) (0.750, 0.762) (0.878, 0.886)
Random-effects 0.45 (0.08, 2.52) (0.370, 0.407) (0.044, 0.060) (2.768, 3.093)
Dabigatran
RE-LY 1782 12091 979 6022 0.91 (0.84, 0.97)
Subtotal 1782 12091 979 6022
Fixed-effects 0.91 (0.84, 0.97) (0.885, 0.897) (0.823, 0.834) (0.952, 0.965)
Edoxaban
CHUNG 1 159 2 75 0.24 (0.02, 2.56)
ENGAGE AF 2954 14069 1639 7036 0.90 (0.85, 0.95)
WEITZ 23 469 11 250 1.11 (0.55, 2.25)
YAMASHITA 7 260 4 125 0.84 (0.25, 2.82)
Subtotal 2985 14957 1656 7486
Fixed-effects 0.90 (0.86, 0.95) (0.897, 0.902) (0.849, 0.855) (0.946, 0.952)
Random-effects 0.90 (0.86, 0.95) (0.897, 0.902) (0.849, 0.855) (0.946, 0.952)
Rivaroxaban
J-ROCKET AF 44 640 57 640 0.77 (0.53, 1.13)
ROCKET AF 1260 7111 1318 7125 0.96 (0.89, 1.03)
Subtotal 1304 7751 1375 7765
Fixed-effects 0.95 (0.89, 1.02) (0.932, 0.941) (0.869, 0.878) (1.000, 1.010)
Random-effects 0.93 (0.82, 1.07) (0.933, 0.941) (0.869, 0.877) (1.001, 1.017)
Total 7134 44067 5291 30429
Fixed-effects 0.90 (0.87, 0.93) (0.885, 0.892) (0.856, 0.863) (0.915, 0.922)
Random-effects 0.90 (0.85, 0.94) (0.883, 0.890) (0.837, 0.846) (0.930, 0.938)

74
Cumulative ranking curve for preferences-weighted results
0
50
100
Best 2nd 3rd Worst0
50
100
Best 2nd 3rd Worst
0
50
100
Best 2nd 3rd Worst0
50
100
Best 2nd 3rd Worst
Apixaban Dabigatran
Edoxaban Rivaroxaban
Cum
ula
tive p
robabili
ty (
%)
SUCRA = 1.0 SUCRA = 0.7
SUCRA = 0.3 SUCRA = 0.0
SUCRA, surface under the cumulative ranking
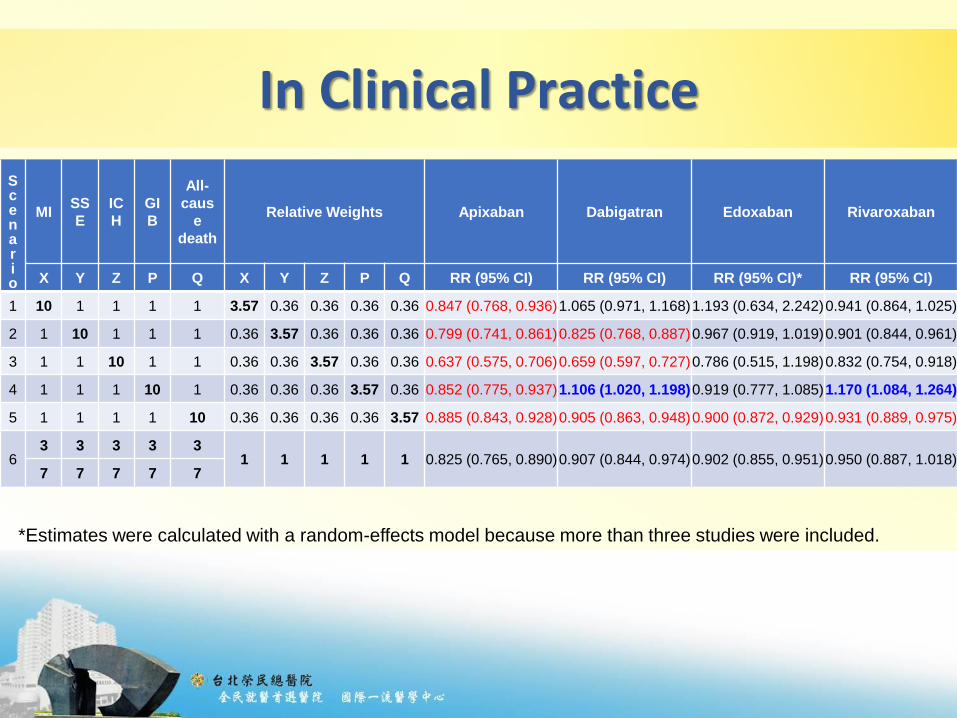
In Clinical Practice
S c enar io
MISS
E
IC
H
GI
B
All-
caus
e
death
Relative Weights Apixaban Dabigatran Edoxaban Rivaroxaban
X Y Z P Q X Y Z P Q RR (95% CI) RR (95% CI) RR (95% CI)* RR (95% CI)
1 10 1 1 1 1 3.57 0.36 0.36 0.36 0.36 0.847 (0.768, 0.936)1.065 (0.971, 1.168)1.193 (0.634, 2.242)0.941 (0.864, 1.025)
2 1 10 1 1 1 0.36 3.57 0.36 0.36 0.36 0.799 (0.741, 0.861)0.825 (0.768, 0.887)0.967 (0.919, 1.019)0.901 (0.844, 0.961)
3 1 1 10 1 1 0.36 0.36 3.57 0.36 0.36 0.637 (0.575, 0.706)0.659 (0.597, 0.727)0.786 (0.515, 1.198)0.832 (0.754, 0.918)
4 1 1 1 10 1 0.36 0.36 0.36 3.57 0.36 0.852 (0.775, 0.937)1.106 (1.020, 1.198)0.919 (0.777, 1.085)1.170 (1.084, 1.264)
5 1 1 1 1 10 0.36 0.36 0.36 0.36 3.57 0.885 (0.843, 0.928)0.905 (0.863, 0.948)0.900 (0.872, 0.929)0.931 (0.889, 0.975)
63 3 3 3 3
1 1 1 1 1 0.825 (0.765, 0.890)0.907 (0.844, 0.974)0.902 (0.855, 0.951)0.950 (0.887, 1.018)7 7 7 7 7
*Estimates were calculated with a random-effects model because more than three studies were included.
Future Plans
Establish interactive decision support system incorporating our proposed preference-weighted SR method
76
Summary
Diseases and their treatment can influence many organs in diverse ways
Composite end points (Net clinical outcomes) are increasingly used in RCTs
To capture the number of patients who have 1 or more of several events of interest
Can index the overall impact of therapeutic interventions and reduce sample size requirements
Have well-recognized limitations
Common practice of weighting all end point components equally, irrespective of their relative impact on the life of the patient

Presentation Outline
Core epistemological principle of EBM
The principal of EBM application
Shared Decision Making
Make EBM Individualized
Why and how?
Maker EBM smarter
Learning on demand
Medical calculation in EMR
A better EBM inquiry system
Take Home Messages
78

院內建置UpToDate實證連結
79
有效節省臨床工作時間!

Learning on Demand 功能擴充
80
Presentation Outline
Core epistemological principle of EBM
The principal of EBM application
Shared Decision Making
Make EBM Individualized
Why and how?
Maker EBM smarter
Learning on demand
Medical calculation in EMR
A better EBM inquiry system
Take Home Messages
81

82
醫學計算機展示-首頁

83
選擇計算機

84
自動抓取病歷資料1

85
自動抓取病歷資料2

86
自動抓取病歷資料3

87
參數有誤提醒

88
計算結果與儲存

89
儲存紀錄瀏覽1

90
儲存紀錄瀏覽2

Presentation Outline
Core epistemological principle of EBM
The principal of EBM application
Shared Decision Making
Make EBM Individualized
Why and how?
Maker EBM smarter
Learning on demand
Medical calculation in EMR
A better EBM inquiry system
Take Home Messages
91

實證醫學與教學研究發展的嶄新思維
臺北榮總實證醫學中心的核心理念與前瞻遠見,不只是展現出實證醫學5A的流程需
求 , 更洞見了實證醫學在臨床和教研上的相互關聯 ,這將開創出國內首創的實證醫
學與互動交流的創新改革 。
臨床實務
實證醫學中心
同儕互動
前瞻願景

規劃理念
實證醫學模組
Future Leaders in EBM
知識互動模組
Clinicians & Healthcare Professionals
Resources, Tools, Case Studies…
Discussion, Interaction,Analysis….

02
使用者(會員)
實證醫學模組。• 5A流程系統的具體實踐。
Ask: 臨床情境、PICO查詢。
Acquire: 查詢策略、結果去重、書目收藏、 SFX全文鏈結。
Appraise:評讀及發表工具下載、結果PDF匯入、評讀表單。
Apply: 決策輔助工具下載、PDAs表單。
Audit: 評估表單填寫及儲存。
Case Studies: 成果紀錄單預覽、下載、E-mail及公開。


Presentation Outline
Core epistemological principle of EBM
The principal of EBM application
Shared Decision Making
Make EBM Individualized
Why and how?
Maker EBM smarter
Learning on demand
Medical calculation in EMR
A better EBM inquiry system
Take Home Messages
102

Take Home Message
EBM is a useful and powerful clinical tool for clinicians
Shared decision making is the core of patient-centered care
In the era of AI, technology and environment embedded with augmented intelligence is important for a better clinical care
Facing the many clinical outcomes, including benefit and risk endpoints, it is hard to incorporate patients’ value in the decision making process.
We propose a novel method to generate a preference-weighted composite endpoint which may better the informed decision process
103

Q & A
謝謝聆聽敬請指教