Embed Size (px)
Citation preview
DI
SC
US
SI
ON
P
AP
ER
S
ER
IE
S
Forschungsinstitut zur Zukunft der ArbeitInstitute for the Study of Labor
“Making It Count”:Evidence from a Field Study on Assessment Rules, Study Incentives and Student Performance
IZA DP No. 8582
October 2014
Arnaud ChevalierPeter DoltonMelanie Lührmann
“Making It Count”: Evidence from a Field Study on Assessment Rules,
Study Incentives and Student Performance
Arnaud Chevalier IZA
Peter Dolton University of Sussex, CEP, LSE and IZA
Melanie Lührmann
Royal Holloway, University of London, IFS and MEA
Discussion Paper No. 8582 October 2014
IZA
P.O. Box 7240 53072 Bonn
Germany
Phone: +49-228-3894-0 Fax: +49-228-3894-180
E-mail: [email protected]
Any opinions expressed here are those of the author(s) and not those of IZA. Research published in this series may include views on policy, but the institute itself takes no institutional policy positions. The IZA research network is committed to the IZA Guiding Principles of Research Integrity. The Institute for the Study of Labor (IZA) in Bonn is a local and virtual international research center and a place of communication between science, politics and business. IZA is an independent nonprofit organization supported by Deutsche Post Foundation. The center is associated with the University of Bonn and offers a stimulating research environment through its international network, workshops and conferences, data service, project support, research visits and doctoral program. IZA engages in (i) original and internationally competitive research in all fields of labor economics, (ii) development of policy concepts, and (iii) dissemination of research results and concepts to the interested public. IZA Discussion Papers often represent preliminary work and are circulated to encourage discussion. Citation of such a paper should account for its provisional character. A revised version may be available directly from the author.
IZA Discussion Paper No. 8582 October 2014
ABSTRACT
“Making It Count”: Evidence from a Field Study on Assessment Rules, Study Incentives and Student Performance* This paper examines a quasi-experiment in which we encourage student effort by setting various weekly incentives to engage in online tests. Our identification strategy exploits i) weekly variation in incentives to determine their impact on student effort, and ii) controlled cross-group variation in assessment weighting. Assessment weighting strongly encourages quiz participation, without displacing effort over the year. We estimate the return to a quiz at around 0.15 of a standard deviation in exam grade. Effort in our study increases most for students at and below median ability, resulting in a reduction of the grade gap by 8%. JEL Classification: I23, D20 Keywords: incentive, feedback, effort, higher education Corresponding author: Arnaud Chevalier IZA P.O. Box 7240 53072 Bonn Germany E-mail: [email protected]
* We wish to acknowledge the help of the administration staff at RHUL and thank Eleftherios Giovanis for research assistance. We are grateful to Macke Raymond, Edwin Leuven, Hessel Osterbeek, Susan Dynarski, John Bound, Santiago Oliveros and seminar participants at CESifo 2012, RES 2013, Sussex, Michigan, City University, Nuremberg, SOFI Stockholm, NIESR, SFI and IZA for comments. This project was partially financed by the RHUL Faculty Initiative Fund.
IZA Discussion Paper No. 8582 October 2014
NON-TECHNICAL SUMMARY A large fraction of students fail at university, one potential reason is that students do not exercise enough effort on a regular basis. If intrinsic motivation does not suffice to induce satisfactory student performance, then what interventions might help to increase student effort and performance? In this study, we vary incentives for students to provide effort on a weekly basis. We focus only on one type of effort, participation to a weekly online quiz which provides students with feedback of their understanding of the lecture. On a given week, students face either no incentive, get additional educational material if they participate, the best performer wins a book voucher or the quiz is declared to be compulsory. In a second cohort, two additional incentives are included, the quiz grade counts for 2.5% or 5% towards the final grade for the course. We find that the book voucher by rewarding only the top performer reduces participation; the provision of additional educational material has little impact on weekly effort, but if effort is rewarded in terms of grades, then participation becomes close to what it is under compulsion. Assessment weighting increases quiz effort and continuous learning relatively more among lower ability students. For the cohort subject to the assessment weighting of quiz grades we find an average increase of final grades in the order of 4%. These performance increases are in the order of magnitude of the results for large financial incentives. All incentives in our set up relate directly to course outcomes and are easy to scale up at a low cost, as such it is quite easy to increase students effort and grades.
2
1. Introduction
Improving students’ performance in education has been a long-standing goal of researchers
and stakeholders alike (see reviews by Hanushek 2006 or Bishop 2006). After much
emphasis on educational inputs, recent research emphasizes the effect of students’ inputs.
This paper focuses on the returns to students’ effort and on how incentives may alter it. We
conduct our study in higher education where a large fraction of students fail to pass courses,
and a substantial minority drop out. Possible explanations for these outcomes are a lack of
effort due to uncertainty about returns to study effort, high discounting of the future,
subjective ability (mis)perceptions about own study progress due to lack of (study progress)
feedback. Our central motivation is - if intrinsic motivation does not suffice to induce
satisfactory student performance, then what interventions might help to increase student
effort and performance?
We conduct a controlled field study among first year undergraduate economics
students at a large college of the University of London. In a large course, we vary the
incentives to participate in weekly online quizzes. The quasi-experimental setup allows us to
pursue two lines of investigation: first, we compare quiz effort within student across different
incentivization treatments designed to foster continuous learning. In particular, we investigate
three types of incentives: a) the provision of additional study material conditional on quiz
participation, b) the awarding of a small cash prize for the best quiz performance, and, most
importantly, c) the weighting of quiz performance towards the course grade. We test the
relative efficiency of these incentives in increasing effort and compare them to two
benchmarks: no incentive and compulsion. Second, we estimate the effort return on exam
grades. Since assessment structure is varied across two groups, we employ propensity score
matching techniques and use our exogenous incentivization to instrument for endogenous
effort choice.
3
We extend Grove and Wasserman (2006) by comparing students’ effort response to
several types of incentives, including a tournament. We test the effect of all incentives within
the same student population and differentiate between low and high stakes (non-financial)
incentives. We also investigate heterogeneity effects with respect to gender and pre-
determined ability and include usually unobserved characteristics such as risk attitudes.
We find that, with the exception of the tournament incentive, all our incentives
increase effort, but assessment weighting has by far the largest impact– increasing quiz
participation between 40 and 60 percentage points. We also find heterogeneous effects on
quiz effort across ability types consistent with a trade-off between intrinsic and extrinsic
motivation (Frey and Jegen, 2002). Assessment weighting increases quiz effort and
continuous learning relatively more among lower ability students. We also show that lower
ability students are less likely to exert effort in the absence of incentives, so assessment
weighting helps ‘level the playing field’. Additionally, we find gender differences in
competition in the effort dimension.
Our second contribution is the estimation of heterogeneous performance returns to effort. We
show in a simple model that assessment weighting increases the benefit of participating in
continuous learning through a direct (grade) reward and an indirect reward by inducing
additional effort. We use the exogenous variation in effort induced by our quasi-experiment
to assess the direct effect of effort (quiz participation) on student performance. Overall, our
results show that quiz participation increased significantly, and that the grade return to
additional effort (measured in quiz units) is in the order of 0.15 of a standard deviation on
average, and larger for students below median ability. Since assessment weighting induced
students to do 1.6 more quizzes per term on average, we find an average increase of grades
following the introduction of (low) assessment weights in the order of 4%.
4
These performance increases are in the order of magnitude of the results for large financial
incentives (see Angrist et al, 2009, 2010, and Leuven et al. 2010), taking a lead from
personnel economics (e.g. Lazear, 2000). Leuven et al (2010) find that substantial rewards
(up to €681) for passing all first year exams increase achievement among high ability, but
decrease it among low ability students, potentially due to the crowding out of intrinsic
motivation1. Angrist et al. (2010) conclude from a series of randomized trials offering
financial incentives worth up to 5,000 US$ per student – e.g. Angrist et al. (2009, 2010), Cha
and Patel (2010), and Barrow and Rouse (2013) - that there is an “emerging picture of mostly
modest effects for cash award programs [...] at the post-secondary level” (p.1). These
moderate effects may result from crowding out of intrinsic motivation (Frey and Jegen, 2002)
or a mismatch between achievement targets and students’ ability (Camerer and Hogarth,
1999). Additionally, financial incentives may be difficult to scale up considering the limited
resources of higher education institutions. 2 All incentives in our set up relate directly to
course outcomes and are easy to scale up at a low cost3.
Our results are also similar to those of previous studies of assessment weighting (e.g.
Pozo and Stull, 2006; Grove and Wasserman, 2006). Pozo and Stull (2006) investigate the
combined effect of additional math courses and assessment weighting for first year
economics students4 and find an average 2% achievement gain among students in the
treatment group - with larger gains among the weakest students. While in their study
performance gain could either arise from the additional math training or from the assessment
incentive, Grove and Wasserman (2006) separate the effect of assessment weighting (worth
1 Garibaldi et al. (2012) also shows that financial incentives raise effort using regression discontinuity designs.
2 Dolton et al. (1994) and Angrist et al. (2009) examine support services, and find small knowledge and
performance effects. Beltz et al. (2012) find detrimental effects of belated reward and lax exam re-sitting
constraints. Ball et al. (2006) study a costlier teaching tool and find performance effects of similar magnitude. 3 Implementation costs have decreased in recent years due to widespread provision of online platforms in
conjection with classic textbooks. These platforms often include options for setting up online assessments. 4 The treatment group’s overall course grade depends on the best result from a pre-university math exam and a
second exam following a Maths course. The control group can choose to attend the same Maths course, which
may enhance their performance in the economics courses, but which will not affect their course grade directly.
5
15% in the treatment group and zero in the control group) and find a grade increase among
freshmen of 2.4 to 4.6 percentage points.
However, neither our incentives (nor financial ones) can fully compensate for the lack
of effort (and/or ability) at the lower end of the grade distribution. Indeed, assessment
weighting does not increase pass rates in our study. Recent work addresses this by using
relative achievement targets in the incentive design (Behrman et al., 2012) or by targeting
teacher performance instead (Figlio and Kenny, 2007). However, due to its effectiveness
around the median of the ability distribution, assessment weighting does help reduce the
within-group performance gap by about 8%. Future research is needed to investigate whether
lack of self-discipline to study, heavy discounting of the graduation deadline or lack of ability
may be the cause of underperformance among low achieving students.
In the remainder of the paper, we develop a simple model of students’ effort choices
conditional on their ability, which lends a structural interpretation to our reduced form results
(Section 2). Section 3 describes the design of our controlled study and the data. Section 4
presents empirical results. Section 5 concludes.
2. A Simple Economic Model
We propose a simple inter-temporal model of study behavior in which students wish
to maximize their utility from leisure and course performance. Our model is similar to
Bandiera et al (2012), but focuses on changes in assessment rules rather than on feedback. In
period 1, i.e. term time, lecturing and other study activities, including the online quizzes, take
place. Period 2 is the pre-exam time during which students can study for the exam. Students
derive utility from their overall course grade, which is revealed at the end of period 2.
Students choose their effort level maximizing the following utility function:
6
𝑈 = 𝑢1(𝑙1) + 𝛽 ∗ 𝑢2(𝑔(𝑒1, 𝑒2, 𝑎), 𝑙2) (1)
where utility in period 1 depends only on their choice of leisure time 𝑙1 and utility in
period 2 depends on their course grade 𝑔 and 𝑙2 . 𝛽 < 1 is the discount factor. In each period
t, students choose an effort level, 𝑒𝑡 ∈ [0,1], measured in time units. If they choose an effort
of zero, their entire time endowment (T=1) is spent enjoying leisure. At the maximum effort
level of 1, no time is left for other activities. In both periods, students face the same time
constraint, 𝑙𝑡 + 𝑒𝑡 = 1.
The overall grade production function g is a weighted average of grades in both
periods, and depends on period specific effort and time-invariant ability a:
𝑔 = (1 − 𝑐) ∗ 𝑔2(𝑎, 𝑒1, 𝑒2) + 𝑐 ∗ 𝑔1(𝑎, 𝑒1) (2)
where c is the assessment weight in period 1. Exam performance 𝑔𝑡 is a
monotonously increasing function with decreasing marginal returns in effort e. Grades
depend on academic ability, a, which is heterogeneous across students. For simplicity, we
assume that the grade function is linear in ability. For the moment, we also assume that at the
beginning of period 1, students are endowed with ability, 𝑎 ∈ [0,1], which is drawn from a
uniform distribution between 0 and 1, and that students know their ability (This assumption
rules out any feedback effect of period-one assessments. We will discuss feedback effects
later in this section). Final grades are given by:
𝑔 = (1 − 𝑐) ∗ (𝑎 ∗ ln(𝛾𝑒1 + 𝑒2) + 휀2) + 𝑐 ∗ (𝑎 ∗ ln(𝑒1) + 휀1). (3)
Grades are affected by idiosyncratic iid shocks (휀1 and 휀2) with mean zero and standard
deviation 1. These shocks reflect any circumstantial factors that may hinder or ease a
student’s performance and can be interpreted as exam specific luck. Exerting effort (and
participating in the assessments) in period 1 is costly as it crowds out leisure time. However,
7
regardless of assessment weighting, effort 𝑒1 directly results in better grades in period 2 since
exam performance 𝑔2 depends on effort in both periods. We assume that effort is always
productive but the effectiveness of period 1 effort on period 2 grades depends on the
depreciation of knowledge, 𝛾 < 1, and is lower than that of effort exerted in period 2:
0 <∂g2
∂e1=
aγ
γe1 + e2<
∂g2
∂e2=
a
γe1 + e2
Students may prefer to exert effort in period 2 for two reasons: first, knowledge
acquired at an earlier date depreciates at a rate 𝛾. Secondly, students are impatient and value
leisure in period 1 higher (𝛽 < 1).
Thus, at the beginning of the year the maximization problem of each student is:
𝑈 = 𝑢1(𝑙1) + 𝛽 ∗ 𝑢2(𝑔(𝑒1, 𝑒2, 𝑎), 𝑙2) s. t. 𝑙1 + 𝑒1 = 1 and 𝑙2 + 𝑒2 = 1 (4)
In the context of our study, 𝑔1 represents performance in the online quizzes and 𝑔2 final
exam performance. With the introduction of positive assessment weights c, we expect
students to shift effort from period 2 to period 1 for the following reasons:
1. The marginal grade return to period 1 effort can be written as:
𝜕𝑔
𝜕𝑒1=
(1 − 𝑐) ∗ 𝑎 ∗ 𝛾
(𝛾𝑒1 + 𝑒2)+
𝑐 ∗ 𝑎
𝑒1> 0
If ability a>0 and students exert positive effort in period 15, and the assessment
weight c is positive, the following holds:
𝑐 ∗ 𝑎 ∗ 𝑒2
𝑒1(𝛾𝑒1 + 𝑒2)> 0
The marginal return to effort exerted in period 1 will be greater in a course with
positive assessment weight c relative to the same course with zero assessment weighting.
5 We also plausibly assume that marginal (grade) returns to effort are decreasing.
8
2. The marginal benefit of effort in period 2 decreases due to the lower weight of the
final exam in the overall course grade (1-c) < 1: ∂g
∂e2=
(1−c)∗a
γe1+e2<
a
γe1+e2 .
3. With zero assessment weight, the overall grade depends on the realization of the final
exam shock 휀2 with mean zero and variance one. With c>0, the overall grade depends on the
exam shocks in both periods. If the two shocks are independent and have a variance of 1, the
variance of the overall shock is less than one, and assessment weighting lowers the variance
of the final grade.
Var(c ∗ ε1 + (1 − c) ∗ ε2) = c2 ∗ Var(ε1) + (1 − c)2 ∗ Var(ε2) = 2c(c − 1) + 1 < 1
In our study, g1 consists of multiple assessments during the term. Hence, the variance of the
iid shocks is lower in period 1 than in period 2 (where only one exam takes place). Students
can thus substantially reduce the variance of shocks affecting the overall grade by
participating in all assessments:Var (ε1̂ + ε2̂) < 𝑉𝑎𝑟 (ε1̂) < 𝑉𝑎𝑟 (ε2̂). Risk-averse students
should thus increase their effort in period 1 when we introduce positive assessment weights.
Relaxing the assumption that students know their ability, participation in assessments
in period 1 yields feedback, which helps students to learn about their unknown ability a, and
to better determine how much effort is needed to reach their optimal grade g*. This is
especially relevant in situations in which students enter a new environment with unknown
performance standards. Bandiera et al. (2012) provide a detailed model of feedback effects –
and vary feedback exploiting different assessment rules across academic departments. Since
we do not vary feedback – just the incentive to exert effort to obtain it, we only sketch the
role of feedback provided through the period 1 assessments: Let us assume that students form
a prior belief �̂� about their ability6. Since it is a noisy signal they are unsure how much effort
6 The first year undergraduate students in our experiment come from a wide variety of countries and educational
systems. Since they are just starting university, it seems reasonable to assume that they take their school
performance as a signal of their ability but that this is a noisy signal of their relative ability in the new
environment (and the strongly selected peer group).
9
is needed to reach their optimal grade g*. In both years of our field study, students can buy a
signal of their ability by exerting effort 𝑒1̂ which allows them to observe their resulting grade,
𝑔1̂ = 𝑎 ∗ ln (𝑒1̂) + 휀1̂. Due to the unobserved shock, 휀1̂, some uncertainty about ability and
mapping of effort to grades remains. Repeated participation in period 1 assessments reduces
the noisiness of the signal. If students perceive the unobserved exam shock to be zero, their
ability posterior is �̃� =𝑔1̂
ln (𝑒1̂). Assuming Bayesian updating, then there is convergence to true
ability, �̃� → 𝑎 . If students decide not to participate in the assessment, they do not receive a
signal and the best estimate of their true ability a remains their prior belief, �̂�. However,
feedback is costly, as students need to exert effort in first period assessments to learn about
their ability. Assessment incentives increase the benefit of such effort by providing additional
grade returns.7 For these reasons, we expect students to exert more effort in the first period,
when we introduce positive weighting of the quizzes. Whether students exert an overall
higher level of effort or simply shift their effort between period 2 and 1, depends on (i) the
weighting of the course grade, c, (ii) the adequacy of the updating of their priors on their own
ability, a, (iii) their discount factor β, and (iv) the presence and size of random exam shocks.
As such, the overall effect of assessment weighting on effort and grades is ambiguous.
This conceptual framework is simplistic in two aspects. Firstly, we may not capture
all incentives to exert effort in the first period. Effort shifting may be even more beneficial
than shown if study time in period 1 is more, rather than less productive, in the final exam
than period 2 effort. Rather than being substitutes in the production of final grade, efforts in
both periods may be complements if learning benefits from repetition and each week’s course
material builds on last weeks’ contents. ( 𝛾 ≥ 1 ). Secondly, we assume that students
maximize their first year exam score. As first year grades do not count towards their overall
7 If the quality of the signal increases in the effort students exert (at the extensive or intensive margin), then the
role of feedback will be different between the years due to the effort incentive described above.
10
degree classification and a simple pass requirement is required to progress to the second year8,
this assumption need not hold empirically. If this motive is absent, we do not expect high
ability types to exert (much) more effort under assessment weighting with a pass requirement,
since their high ability makes failure unlikely. However, grades play an important role as
signals of qualifications to employers and admissions offices, which use them to assess
applicants for internships, student jobs and admissions to Masters degree programs. Medium
or low ability students for whom the pass requirement may be binding should exert more
effort to meet the grade threshold, unless their ability is too low.
3. Study design and Data
We conducted the study among incoming first year economic students at a large
college of the University of London over two academic years.9 Excluding repeating students
and students that drop-out during the year, the first group (henceforth: Group 1) consisted of
206 students, the second (henceforth: Group 2) of 242 students. We test the role of
incentivized assessment on the continuous study effort of students and on overall student
performance.
The study was conducted in a mandatory course Principles of Economics (henceforth:
Principles). Students are required to complete three additional courses, so Principles
represents a quarter of their first year course load. It is a high stake module, which students
need to pass in order to progress. We vary assessment weighting, but keep all other course
elements – the two course instructors (one teaching in the autumn term, one in the spring),
8 This is not specific to the studied institution. The first year of a degree does not count towards the final degree
class at most UK institutions. 9 The experiment is designed to treat all students within a cohort equally, so that no ethical concerns apply.
11
contents, materials, delivery10
, communication and the quiz question database, identical
across the two years.
In the first year of our intervention, we introduced on-line quizzes, testing the
concepts taught in the previous week. In both years, we informed students about quizzes in
the same way and encouraged participation. Students could complete quizzes within a
predefined window of one to three days following the last weekly lecture. After the due date,
students received information on their overall score, the correct solution and their stated
answer for each question and – in some cases – detailed explanations. For assessed quizzes,
students had 60 minutes to complete quizzes within a specified 24 hour period, and we
randomly drew questions from a large question bank for each student.
In a given week, all students face the same incentive to complete the quiz but
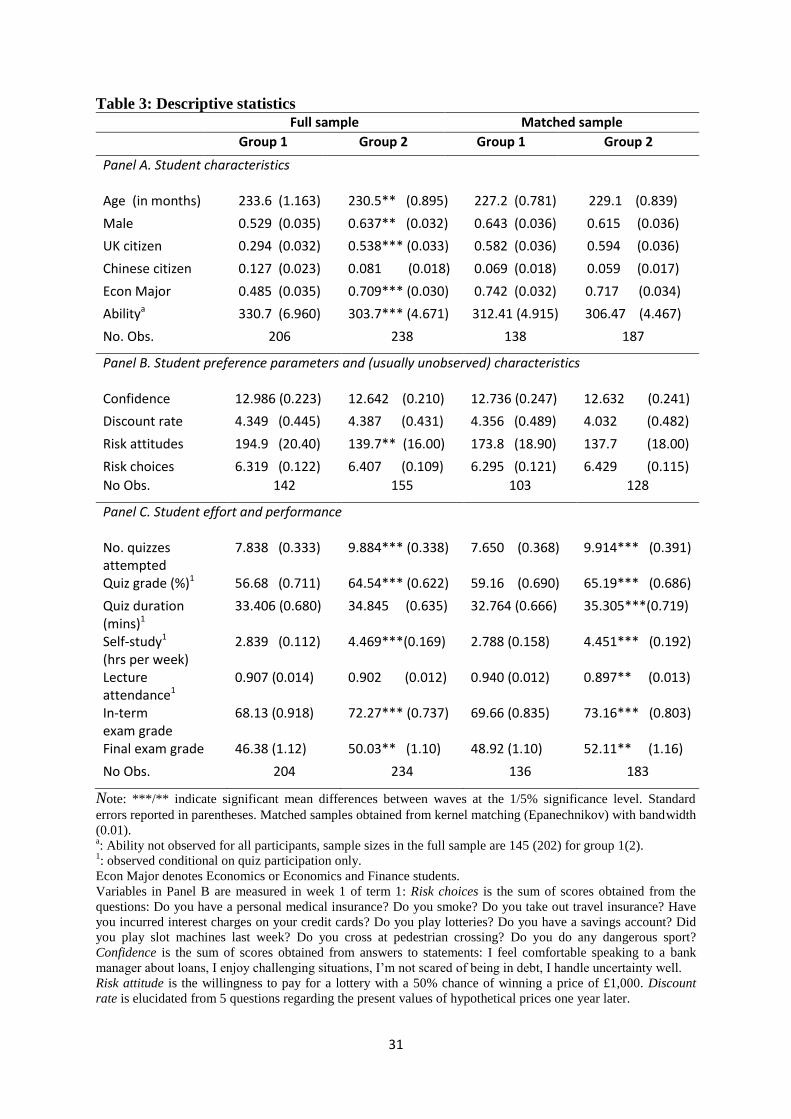
incentives vary between weeks. Table 1 shows the timing across weeks for the four
incentives. We repeat incentives throughout the year and vary their timing across terms to
increase our confidence that we capture the incentive effect and not week specific effects.11
This ‘within’ student design allows us to account for students’ unobserved characteristics. To
create a participation benchmark, we make one quiz per term mandatory (“Compulsory”), i.e.
we weakly force participation.12
The first incentive is a simple participation incentive that
gives access to seminar exercise solutions conditional on participation in a quiz
(“Solution”).13
The second incentive introduces a performance incentive in the form of a £20
book voucher for the best quiz performance (“Voucher”). With differential ability, we expect
this tournament to increase quiz participation and performance among those students who
10
The course is delivered through weekly 2 hours lecture and a compulsory tutorial. 11
We additionally add a linear time trend for each term to flexibly control for time effects. 12
We informed students that admission to final exam was conditional on having completed at least three out of
four formative assessments - two essays and the two “compulsory” on-line quizzes (one per term). However,
this threat is not strictly enforced by a college rule. Since the enforcement of such a rule is difficult and costly in
practice, we expect it to work best among first year students who lack experience with university practices. In
subsequent years, its impact may weaken. 13
In the Spring term, access to the material is conditional on achieving a quiz grade above 30% .
12
believe to have a chance to win it, i.e. those with higher ability (or those with high
overconfidence). The tournament setting may have detrimental effects on others through
discouragement (Cason et al., 2010). For both groups, these incentives are repeated twice per
year. For Group 2, we add assessment weighting: four out of the weekly online quizzes
contribute 2.5% (“Assessed 2.5%”) and two count 5% (“Assessed 5%”) towards the final
course grade, amounting to a total of 20%. If these small assessment weights are salient
enough, we expect an increase in student participation (and performance) in assessed quizzes
relative to non-assessed ones.
Our key variables of interest are students’ ability, effort and performance. We collect
information on students’ quiz participation and performance for both groups. We match it
with administrative data on final exam performance, students’ characteristics and ability
(school completion grades14
). We further obtain a set of measures of preference parameters
from a survey conducted in the first week of lectures.
Effort is largely unobserved and hence difficult to measure. In this study, we observe
several measures of this multi-dimensional concept: quiz participation, quiz grades and the
time students require to complete an online quiz. Furthermore, we ask students to report their
weekly self-study time and lecture attendance. While this gives us a quite complete picture of
effort spent in different course-related activities, we have systematic attrition in most of these
measures as they are observed only for students who choose to participate in the quiz.15
.
Another measure of effort, seminar attendance is recorded in administrative records and thus
14
For international students, we use a combination of the academic equivalencies scales published by the
University of Brighton (www.brighton.ac.uk/international/equivalencies) and the scales used by the admissions
office of the College in which we conduct the experiment. We deviate in the valuation of the international
baccalaureat as the equivalence scales seem too conservative given the high quality of this school degree
programme.
As a robustness check, we alternatively used standardised scores on other first year courses that are not part of
our experiment – with very similar results. We are presenting results based on pre-university grades as they are
not subject to substitution of effort within the first year and as such are independent of our experiment.
15 If only high ability students participate when no incentive is in place, we will under-estimate the effect of
incentives on duration of quiz participation and performance. Alternatively, if quiz participants tend to be
weaker students with a high demand for feedback, then our estimates would be biased upwards.
13
observable for all students. However, seminar participation is officially mandatory and lacks
variability making it unsuitable for measuring effort. Hence, we focus our analysis on weekly
quiz participation as the effort measure, which is available for all students in all weeks, and
report outcomes in the other measures only as corroborative evidence below.
In the second part of the analysis, we identify the effect of assessment incentives on
student performance. Our identification strategy relies on differences between the two groups.
To prevent bias due to variation in exam difficulty or marking standards across years, we rely
on grades from term-time exams (2 per student). These tests consist of multiple-choice
questions that we draw randomly for each student from a large test bank. This test bank
remains unchanged across groups. In expectation, the exam is thus identical across groups
and since grading is automated it avoids any other bias. For each student, we observe two
term-time grades - one per term - which minimizes the importance of an exam group specific
shock on our results.
We test for cheating in our performance measure. If students were cheating (by
collaborating in the online quizzes) then exam outcomes would be positively correlated
across students who start the online quiz at a similar time. We do not find any evidence that a
student’s quiz grade increases as measured by the fraction of students starting the quiz around
the same time (see columns 1, 3 and 5 in Table 2 for different time ranges: +-30 sec, +-1 min,
+-2 mins). Secondly, we test whether a student i’s grade difference between each quiz and the
final exam depends on how many students start the test at the same time as student i. In this
test for cheating, we are exploiting the fact that it is more difficult to cheat in an (in-class)
final exam under surveillance. We do not find systematic variation in the grade difference
with the fraction of students starting at the same time (see columns 2, 4 and 6 in Table 3).
Additionally, assuming that earlier quiz completers pass on information regarding the exams
14
to other students, we test whether time of completion correlates with grades but find no
support for this hypothesis16
. In summary, we find no evidence of cheating.
Our identification of the impact of assessment weighting relies on differences across
the two groups. A threat to our identification strategy stems from potential composition
differences between the two groups. Columns 1 and 2 in Table 3 shows some group
differences: Group 2 is about 3 months younger, has a larger fraction of males (64 relative to
53%), more economics majors, is of slightly lower academic ability – as measured by entry
grades – and contains more British students17
. The ensuing selection could introduce a
downward bias in our estimation, as Group 2, which is the one affected by the assessment
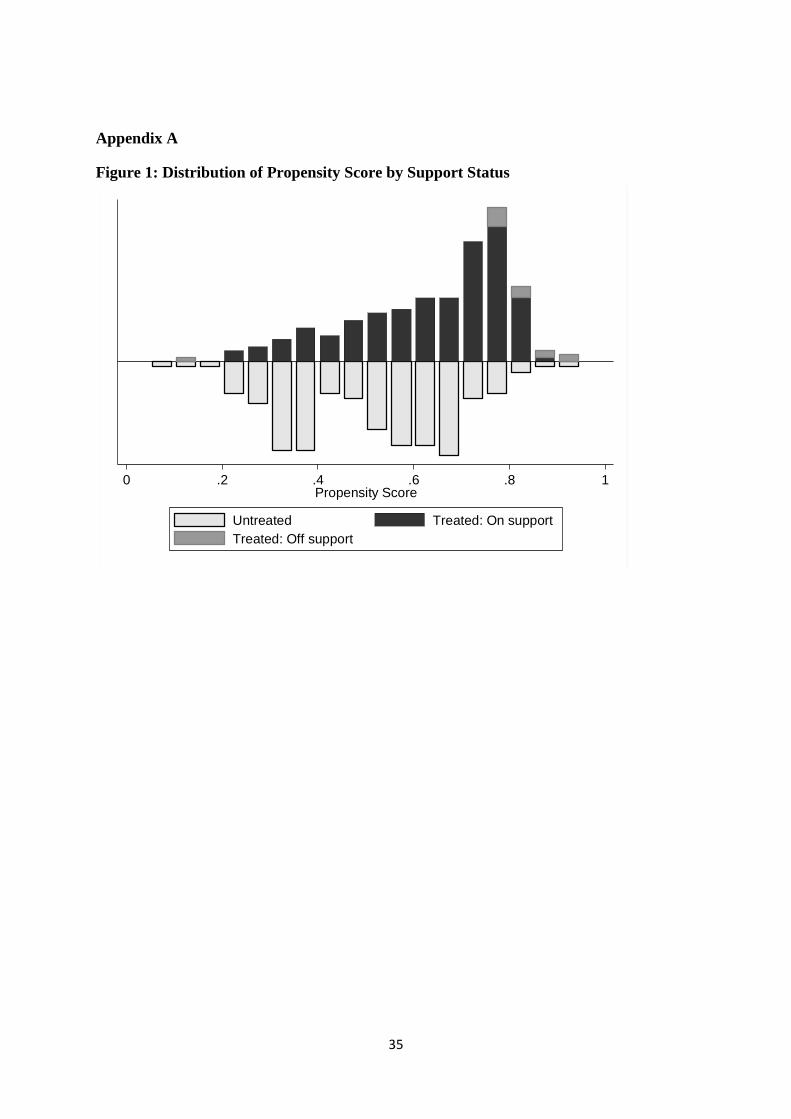
incentive, is academically weaker at entry into university. Thus, we rebalance our sample
using propensity score matching. We match based on age, gender, citizenship, degree major
and ability. 94% of group 2 individuals are matched, highlighting the large amount of
common support between the two groups (see Appendix 1). 18
Columns 3 and 4 of Table 3
shows that the matched cohorts are balanced on the observable characteristics used in the
matching process (see panel A); i.e. the differences in the composition of the two groups have
been eliminated. Moreover, the two groups are balanced well with regard to (usually
unobserved) characteristics that were not used in the matching procedure (see Panel B). We
rely here on survey evidence eliciting students’ time preferences, risk aversion and their self-
confidence before the first lecture. All four parameters – the discount rate, two measures of
risk choices and attitudes and a measure of self-confidence - have been identified as
important determinants of academic performance and other economic choices. Hence, we
16
The results are available from the authors upon request. 17
These composition shifts may have been due to the impending reform in education financing, which
substantially increased tuition fees for British and EU students the following year. To avoid the fees hike,
British students rushed to enter higher education under the old system. 18
The matching is obtained using an Epanechnikov kernel with bandwidth 0.01 based on a program developed
by Leuven and Sianesi. 16 individuals from the second cohort are not matched and are dropped from the
analysis. These are mostly low achievers studying Economics for whom no match in the first group can be
found. Individuals from the first group, who are never used as controls, are also dropped.
15
take this as additional evidence for the quality of our matching approach; the two groups are
now identical in terms of observable and unobservable characteristics. For the remainder of
the analysis, we reweight individuals in the control group to the frequency at which they have
been used as match.
Panel C of Table 3 contains descriptive measures of the change in effort and
performance across the two (matched) groups. Students in Group 2 are significantly more
active in continuous learning via quizzes: They participate in 23% more quizzes than Group 1
and quiz grades are 10% higher. Even the time spent on each quiz increases significantly in
our sample. Term-time exam grades are 3.5 points or 5% higher and final exam grades are up
by 3.5 points, or 6.5%.
4. Results
a. Incentives and Student Effort
In this section, we investigate the effectiveness of different incentives in inducing
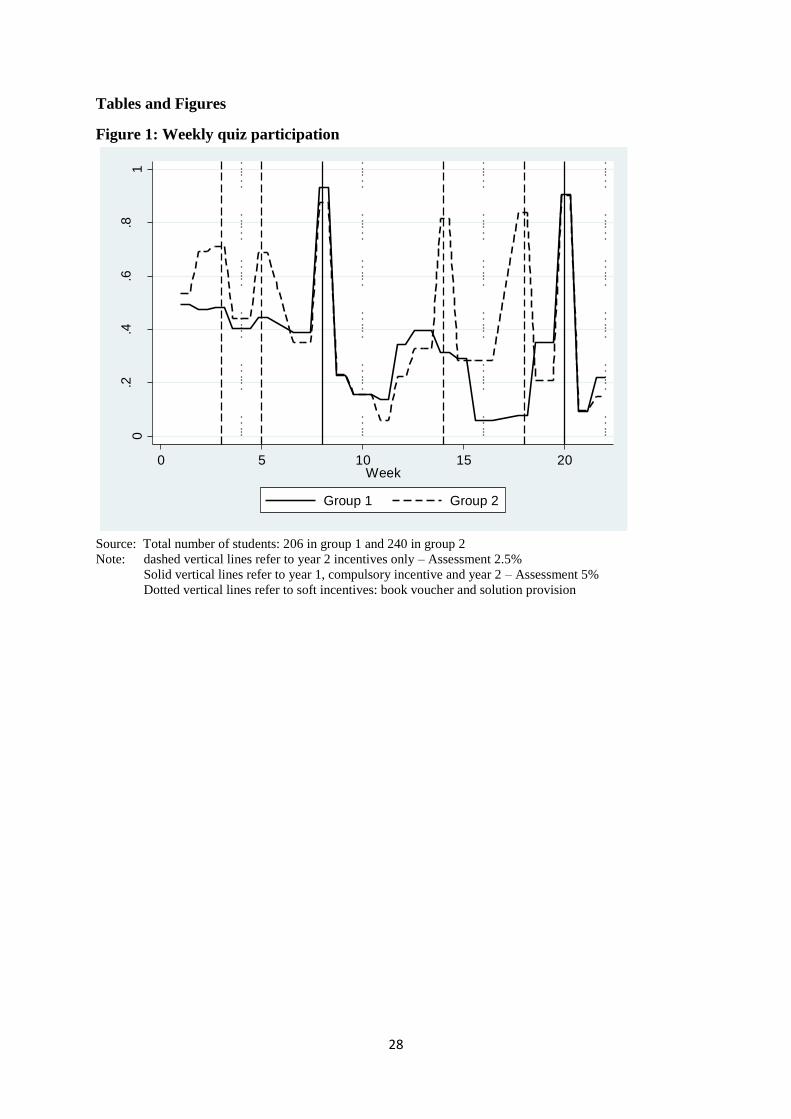
students to engage in continuous learning. Figure 1 reports weekly quiz participation rates for
each group. Importantly in week 1, i.e. before any treatment, participation is indistinguishable
between the two groups (50% vs. 53%), highlighting again how similar the two groups are at
baseline. Vertical lines mark weeks with incentivized quizzes. The low and declining quiz
participation in weeks without incentives suggests that students’ demand for feedback is low
when obtaining such feedback requires effort. Participation in weeks without incentives is
almost identical across the two groups, which could indicate that group 2 does not displace
effort from no incentive weeks to high incentive weeks. Hence, both groups allocate their
effort similarly in the absence of incentives.
16
Figure 1 also shows that soft incentives – book vouchers and the provision of seminar
solutions, marked by dotted vertical lines – do not appear to have much impact on
participation. On the contrary in weeks with assessed quizzes (marked by solid (5%
weighting) and dashed vertical lines (2.5% weighting)), participation spikes and is always
greater than 80% and substantially higher than participation in the same weeks for Group 1.
These figures suggest a strong reaction to assessment incentives. Indeed, participation rates in
quizzes with a 2.5% weighting are 83% of the participation rates achieved in the compulsory
tests. When weighting is 5%, participation is not statistically different from the one observed
for compulsory quizzes.
To estimate the effect of incentives on weekly quiz participation (q) while capturing
unobserved heterogeneity, we estimate the following model with individual fixed effects, 𝜇𝑖:
𝑞𝑖𝑡 =∝ + ∑ 𝛽𝑍 𝐼𝑛𝑐𝑒𝑛𝑡𝑖𝑣𝑒𝑧𝑡𝑧 + ∑ 𝛿𝑘 𝑥𝑖𝑘𝑡𝑘 + 𝜑𝑇𝑡 + 𝜇𝑖 + 휀𝑖𝑡 (5)
where the subscripts stand for individual i at time t (measured in weeks). Each
individual is exposed to a set of z incentives. All time-invariant student characteristics -
including pre-determined ability, motivation or work ethics- are absorbed in the individual
fixed effect. However, xikt also include measures of weekly variation in academic burden, i.e.
assignment deadlines in other courses. We allow for time-specific fixed effects T in the form
of a term dummy and a term-specific linear trend in week. All standard errors (in Tables 5 to
9) are clustered at the student level.
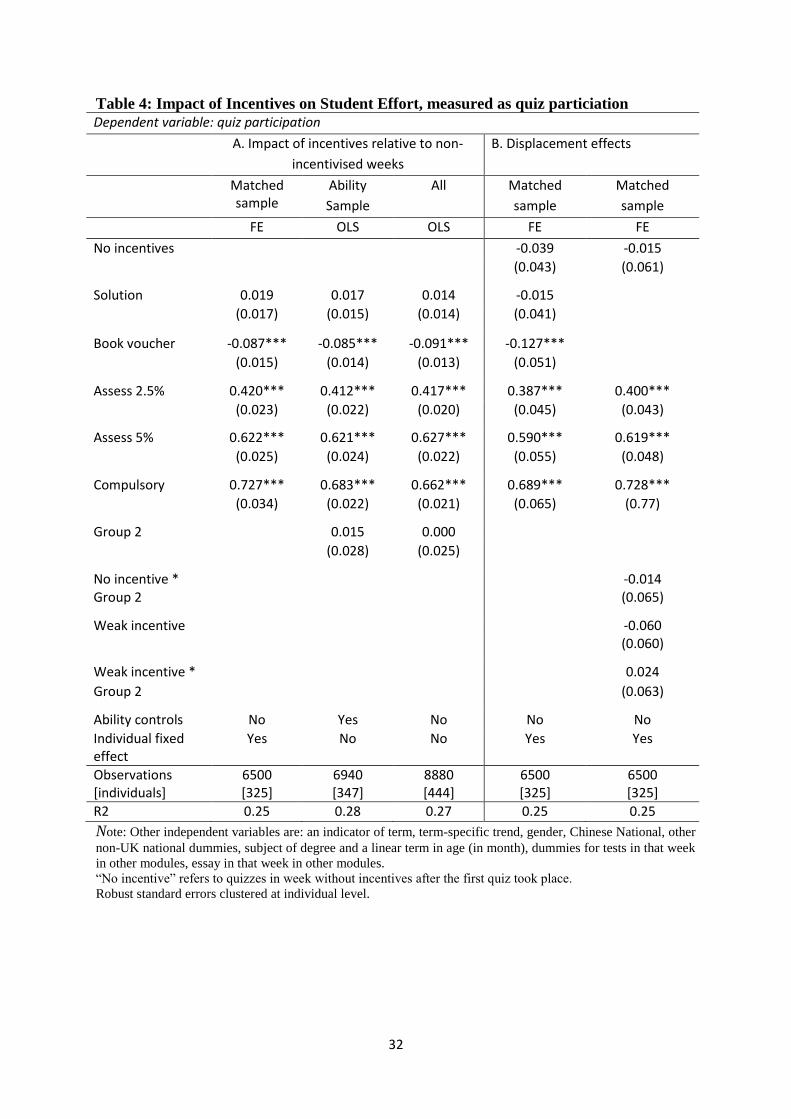
Panel A of Table 4 reports estimates of the incentive effects on student effort relative
to non-incentivized weeks. Column 1 shows the fixed effects estimation results for the
matched sample. Strong incentives, such as compulsion or assessment weights have a
positive effect on quiz participation. An assessment weight of 2.5% boosts quiz participation
by 42 percentage points. The effect is large given the low weight of the assessment. Doubling
17
the incentive weight to 5% increases quiz participation by 62 percentage points, i.e. only
about 1.5 times, instead of doubling it. However, not all incentives increase participation. The
“Solution” incentive, which gives access to problem-set solutions conditional on quiz
participation, has no significant effect, maybe because students can share problem-set
solutions, and the £20 book voucher for the best quiz performance reduces participation by
8.7 percentage points. Since only high ability students are likely to win the voucher with a
salient probability, a tournament incentive is unlikely to increase mean participation and
appears to crowd out intrinsic motivation (Fryer 2011, Gneezy et al. 2011).
We conduct multiple checks to show the robustness of our results. Our results are not
dependent on the sample used or estimation strategy. Estimates relying on OLS and
controlling or not for ability (columns 2 and 3) are similar to those presented in Column 1, i.e.
unobserved individual characteristics do not affect much the effect of incentives on quiz
participation.19
While ability is positively correlated with quiz participation (not reported) it
does not affect the size of the incentive effects on quiz participation. Importantly, the
coefficient on the group 2 dummy is not statistically significant; i.e. the two groups do not
systematically differ in their intrinsic motivation to participate in quizzes.
When faced with a mixed schedule of incentivized and non-incentivized quizzes,
students may simply shift effort between weeks rather than increasing effort overall.20
In
consequence, there may be displacement effects, which would lead us to overestimate the
impact of incentives on student effort. We investigate displacement effects in Panel B of
Table 4 by producing estimates of incentives effects relative to participation in the first week
of term. In the first week, fresher students did not know about the incentive structure of future
19
We include the time-invariant individual characteristics age in months, sex, dummies for Chinese, British or
other nationality, and degree subject in both columns. 20
Even an effort shift towards earlier weeks may have beneficial effects on overall performance due to the
modular course structure in which topics build on previously covered material. Shifting effort forward enables
students to follow lectures and seminar better throughout the course.
18
quizzes yet. Indeed, we find no significant differences in quiz participation in the first week
between the two groups (t=0.52). The parameter estimates in column 1 of Panel B are very
similar to those in Panel A, and support our hypothesis that assessment weighting increases
student effort. All coefficients on incentives are marginally smaller than in panel A,
consistent with participation in week 1 being relatively high for a non-incentivized week (see
Figure 1). Importantly, participation in non-incentivized weeks is not dissimilar to that of the
first week, rejecting the displacement effect hypothesis.
Finally, to confirm that the two groups are similar, we test whether students from both
groups react similarly when faced with the same incentives. We find no statistically
significant difference in their reaction to no or weak incentives, namely the book voucher and
the supplementary material (Column 2 of Panel B).
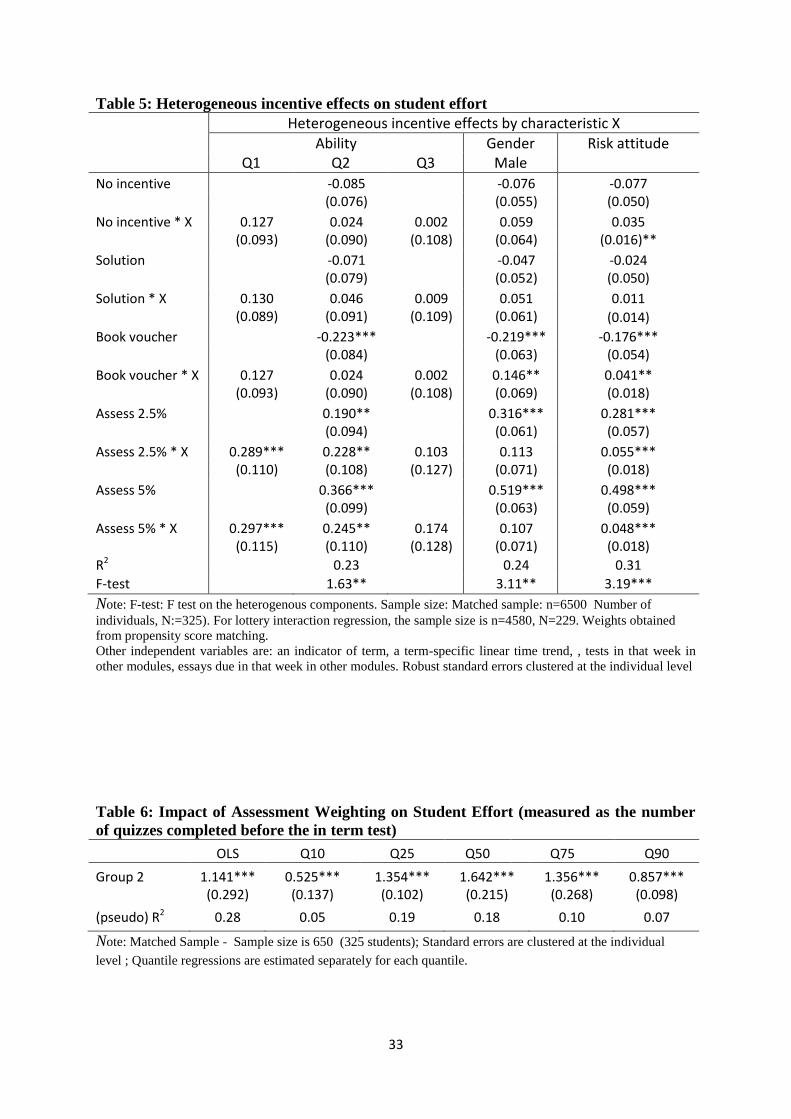
So far, we have assumed that the effect of incentives is homogeneous across students.
However, students may differ in their need for feedback and extrinsic incentives to provide
effort. Are our four incentives differently effective in increasing effort for different student
groups? In Table 5, we relax the assumption of a common treatment effect and allow for
heterogeneous impacts of incentives across students with respect to gender, ability, and risk
attitudes21
. We add interaction effects with student characteristics to our fixed effects model
and estimate the following:
𝑦𝑖𝑡 =∝ + ∑ 𝛽𝑍 𝐼𝑛𝑐𝑒𝑛𝑡𝑖𝑣𝑒𝑧𝑡𝑧 + ∑ 𝛽𝑍𝑘 𝐼𝑛𝑐𝑒𝑛𝑡𝑖𝑣𝑒𝑧𝑡𝑧𝑘 ∗ 𝑥𝑖𝑘 + 𝜑𝑇𝑡 + µ𝑖 + 휀𝑖𝑡 (6)
We find no evidence of heterogeneity by ability in the impact of the soft incentives
(book voucher and access to additional study material). However, we do find evidence of a
21 We find no heterogeneity in the reaction to incentives between economics and non-economics majors, by age,
confidence or discount rate and thus do not report them. There are heterogeneous effects by nationality: British
students react strongest to incentives, illustrated by significantly lower participation in non-incentivised quizzes
and increased participation in incentivised ones relative to non-Chinese foreign students, our base group.
Chinese students react less to incentives such as tournament or assessment weighting than non-Chinese
foreigners.
19
stronger effort impact of assessment incentives for students with ability below the median
(columns 1 to 3 in Table 5). Participation rates increase by an additional 29 to 30 (23 to 25)
percentage points for students in the bottom (second) relative to students in the top ability
quartile. The parameter estimates are very similar for the 2.5 and the 5% assessment weight.
One reason for the larger response of low-ability students to incentives is that they are 10%
less likely to participate in quizzes in the absence of incentives than students with ability
above the median. These findings are consistent with incentives providing additional
motivation to produce effort among lower ability students. As such, incentives can reduce the
variance in quiz participation between students.
We also find a participation gap by gender in the reaction to incentives, but only in
the tournament setting. The tournament discourages effort among females quite strongly – by
around 22%, while it does not affect male effort strongly (-7%). These findings are in
accordance with the gender gap in competition surveyed in Croson and Gneezy (2009).
Finally, we investigate heterogeneous treatment effects with respect to students’
discount rates and risk attitudes: we find no evidence that incentives have a differential effect
by discount rate (not shown here), while we find a stronger reaction to the assessment
incentives and to compulsion among students with a higher willingness to pay for a risky
lottery.22
If – under restrictive assumptions about the curvature of the utility function, loss
aversion etc. – we interpret our risk measure as an indicator of risk-aversion, this result is
puzzling as it conflicts with our conjecture that the introduction of continuous assessments
with positive assessment weights will help reduce grade variance as exam shocks are
22
Results available from the authors upon request. Risk attitudes are obtained from questions on personal
medical and travel insurance ownership, smoking, interest charges on your credit cards, playing the lottery and
gambling, saving account ownership, jaywalking, dangerous sports activities. Discount rates are elucidated from
five questions regarding the present values of hypothetical prices in one year time
20
diversified.23
However, since we did not conduct a full assessment of risk preferences that
would allow us to estimate students’ preference parameters, future research is needed to
investigate the role of incentives in the link between risk preferences and effort.
As another test of displacement of effort, we assess whether assessment weighting,
which affected only group 2, led to an overall increase in effort. Table 6 confirms an increase
in overall quiz participation up to the in-term exam, when we introduce assessment weighting.
The increase is, on average in the order of magnitude of more than one additional quiz (out of
a maximum of 7), or 46 percent. We observe the increase in participation at every quartile of
the distribution (see columns 2 to 6) but it is largest for students in the 25-75 range. The
effort increase is weaker in the tails but even for the lowest 10% participants, the number of
quizzes completed increased by half a quiz during a seven weeks period. Overall, this shows
the lack of displacement effects as the total number of completed quizzes increases across the
whole distribution. Strong incentives thus narrow the participation gap between students of
different intrinsic motivation level.
All results in this section show that our low-cost incentives, such as assessment
weighting, strongly affect continuous learning effort by students. However, other incentives
can have no, or even negative, impact on effort. We further show that there are no
displacement effects towards non-assessed quiz effort, so that overall effort in quizzes
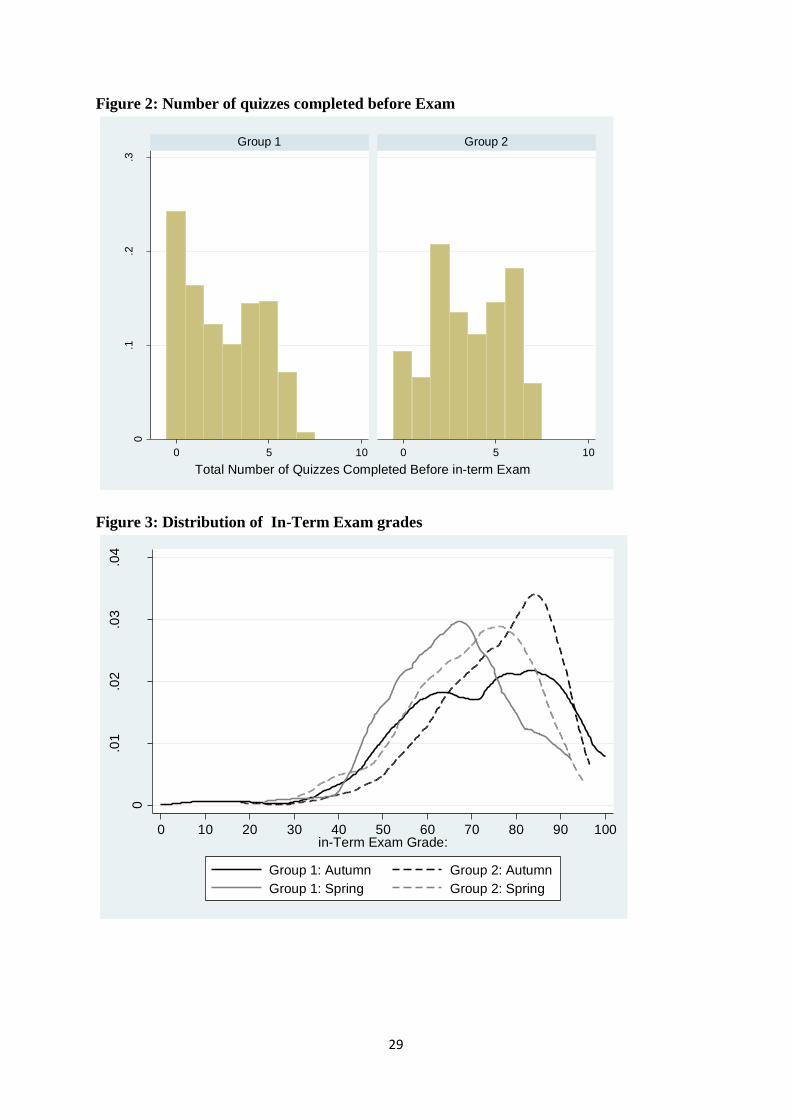
increases. Figure 2 illustrates the shift in the distribution of the overall number of completed
quizzes to the right with in particular a sharp drop in the fraction of students completing no or
just one quiz before the in-term test. Our findings are consistent with our model prediction
that the introduction of assessment incentives will result in an increase in period 1 (i.e. term
time) effort. These effects are particularly strong among students below median ability whose
23
We find no differences in quiz participation by risk groups in the first week when the incentive scheme was
unknown to either group.
21
participation is significantly lower in the absence of strong incentives. We are lacking
unbiased measures on effort in other dimensions and cannot quantify displacement effects in
these activities. However, in the next section, we investigate the effect of quiz effort on
student performance and discuss such displacement effects in this context.
b. The Impact of Effort on Student Performance
If students exert additional effort under assessment weighting, e.g. by increasing quiz
participation, does student performance increase as well? If our incentives only lead to
intertemporal substitution of effort between term time and exam preparation, additional effort
in quizzes may not improve performance.
As discussed in Section 2, we measure performance using students’ grades in an exam
that takes place during the term. It is designed to be identical in expectation between the two
years, since, for each student, we randomly draw a set of questions from the same large
question database. For each student, we observe grades at two such tests, one per term. Exam
participation does not substantially differ across waves, so there is no evidence that our
results are driven by selection into the exam. We estimate the following model:
𝑆𝑖𝑡 =∝ +𝛽 ∑ 𝑞𝑖𝑛𝑡𝑛 + ∑ 𝛿𝑘 𝑥𝑖𝑘𝑡𝑘 + 𝑎𝑖 + 휀𝑖𝑡
where 𝑆𝑖𝑡 denotes the exam grade of individual i in term t, and 𝑞𝑖𝑛𝑡 defines the total
number of quizzes students have completed – our measure of effort; ai represents the
individual level time invariant fixed effects, while xikt are a set of time variant variables. We
measure grade in terms of standard deviations from the average exam grade24
.
24
These are measured in z scores, i.e. as the difference between a grade and the average grade divided by the
standard deviation of grades.
22
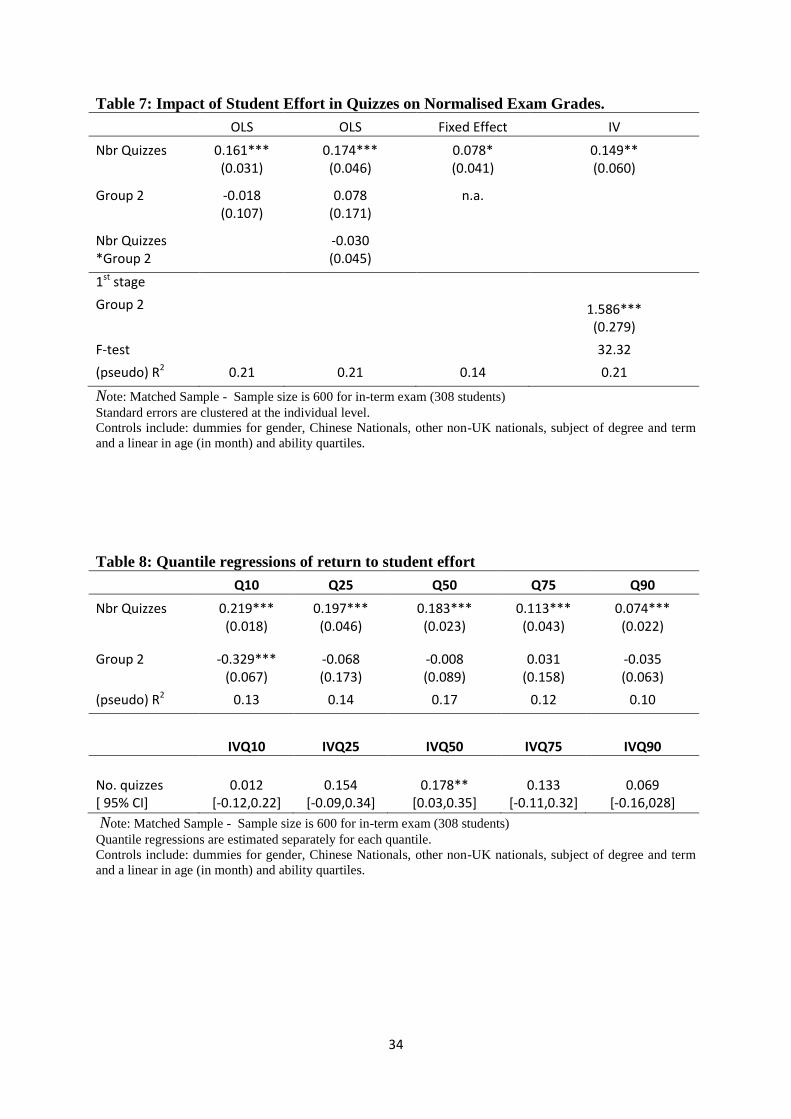
Column 1 of Table 7 shows the OLS estimates of the association between effort and
exam performance. Doing one additional quiz improves exam performance by 0.16 of a
standard deviation, and the estimated coefficient is statistically significant at the 1% level. In
addition to the covariates used throughout this analysis, we control for group dummies to
provide additional evidence that the matched groups are not different. Indeed, the estimated
group effect coefficient is statistically insignificant, negative and close to zero. In column 2,
we show that the correlation between (quiz) effort and exam performance does not differ by
group. Again, this supports our hypothesis that the two groups do not substantially differ –
the return to quiz effort is the same for both groups. With displacement effects, the return to
quiz effort should be lower among students exposed to assessment weighting.
In column 3, we augment our specification to include individual fixed effects.
Filtering out unobserved heterogeneity reduces the impact of online quizzes on student
performance by roughly one half, and the effect is only marginally significant. While the
fixed effect model eliminates the impact of fixed students’ characteristics, the effect is
identified from students whose quiz participation differs between two terms, which may be
endogenous. For example, a student who performed below par in the first term, may increase
effort in the second term.
Since each student chooses their optimal quiz effort, there is likely an endogenous
link between effort choice and exam performance, which works through motivation and
similar (unobserved) factors. In column 4 of Table 7, we therefore use IV techniques to
identify the impact of effort on exam performance. Our instrument is the exogenous
assessment weighting (i.e. group 2): it affects quiz effort but after controlling for observable
characteristics, has no direct impact on grades (see column 2). The F-test supports our
23
conjecture that the instrument is not weak25
. As expected, OLS yields an overestimate of the
link between effort and exam performance. However, the bias is not large. The IV estimates
yield an only slightly smaller – still substantial and statistically significant- grade increase by
0.149 of a standard deviation per additional quiz. We interpret this as the causal effect on
grade of completing an additional quiz for a student whose quiz participation increased
because of the incentives we provided for group 2.
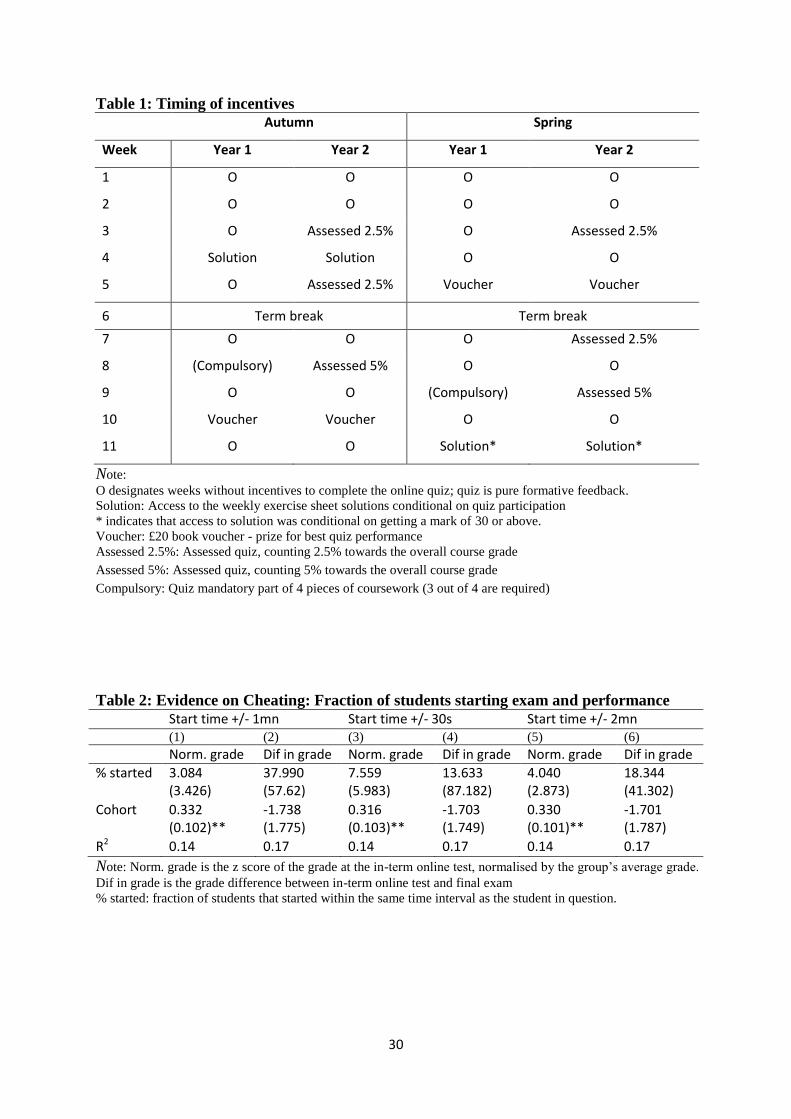
Figure 3 compares the distribution of grades, our performance measure across groups
1 and 2 by term. In both terms, the grade distribution shifts to the right for Group 2, which we
induced to exert more effort via assessment weighting. A reduced form model estimate shows
that group 2 grades are on average 0.24 of a standard deviation better.26
Finally, in Table 8,
we allow for heterogeneity in the link between effort and performance using quantile
regressions for different grade segments. We find evidence of grade shifts everywhere along
the grade distribution. They are concentrated particularly at the lower end (grades increase by
about 0.2 of a standard deviation in the 10th
and 25th
percentile) and in the middle of the
grade distribution (about 0.18 of a standard deviation). Grade effects at the median more than
double those at the top of the distribution. Students, especially those achieving below median
scores, experience large returns to completing quizzes. While we do not find statistically
significant grade effects in the 10th
and 25th
percentile once we move to IV estimation, we
find a very robust effect of effort on exam performance at the median. It amounts to a quiz
return of 0.18 of a standard deviation.
There are two reasons why performance may increase particularly in the lower half of
the grade distribution: a) we have shown in Table 5 that lower ability students increase their
25
Note the first stage effect is slightly different than the one presented in Table 6 as the sample of students with
valid test grades is marginally different. 26
Additionally, we also allow for interactions between effort and individual characteristics but find no
heterogeneous effort effects by nationality, age or economics major. The exception are our measures of risk
attitudes and choices: those with a higher willingness to act risky or pay for a risky lottery have small additional
performance gains from increasing quiz effort.
24
total effort in quizzes by more than higher ability students. As such, incentives help level the
playing field by balancing effort across the ability scale; b) continuous learning via online
quizzes may be particularly effective for median ability students. At the very low end of the
grade distribution (in the 10th
and 25th
percentile), students have very little knowledge of the
course content and a low probability to pass, so that additional effort does not translate into
better grades. These findings are also consistent with larger intrinsic motivation and less need
for additional effort at the top – as these students display higher quiz participation rates when
there are no stakes – i.e. in week 1 and in non-assessed quizzes.
In summary, we find a significant and quantitatively large effect of moderate
assessment incentives on grades. Their effect is concentrated at the lower to middle part of
the grade distribution, hence the provision of incentivized continuous learning tools does not
only increase grades but also reduces the variation in grades between students above the pass
mark. Looking back at the grade difference between group 1 and 2 in Table 3, it is evident
that average grade increases, while the standard deviation of grades decreases under
assessment weighting.27
Overall, this leads to a reduction in grade dispersion – measured
using the relative standard deviation – by 8%.
5. Conclusions
This paper presents the results of a field study in which we manipulate the incentives
for students to participate in weekly on-line quizzes. We find that assessment weighting is
highly effective in inducing additional effort among students, increasing quiz participation by
up to 55 percentage points. Assessment weights need not be very high – in our study, students
27
As a robustness check, we also investigated the impact of effort on final course grades and found
quantitatively smaller but qualitatively similar results. However, since – due to exam regulations – we cannot
create a final exam which would be comparable (i.e. in expectation identical) across the two groups, we
concentrate our discussion of results on the interim exam.
25
react strongly to weights of only 2.5% of the overall course grade. Doubling this weight (to
5%) increases participation by an additional 15 percentage points only. We also find that the
effect of assessment weights is heterogeneous. High ability students display high
participation rates in quizzes even in the absence of assessment weighting, so positive
weighting is particularly effective in increasing effort among low and median ability students.
In contrast, rewarding top performers with prizes can lead to reduced participation,
particularly by female students, consistent with inadequate targeting of such incentives to
heterogeneous student ability, which results in discouragement.
Inducing students to participate in quizzes is an effective means of improving their
performance: we find that each additional quiz attempted improves grades by 0.15 of a
standard deviation. The effect is causal and concentrated among students around the median.
Since assessment weighting induced students to do 1.6 more quizzes per term on average, we
find an average increase of grades following the introduction of (low) assessment weights in
the order of 4%. These estimated effects of incentives are of a comparable magnitude to
studies that implemented large (and costly) financial incentives (see Angrist et al, 2010, and
Leuven et al. 2010). They are also comparable to the effects of relative and absolute feedback
found in Bandiera et al. (2012). However, in the absence of incentives, many students –
especially males and low ability students- are not willing to exert effort, i.e. participate in the
assessment, to obtain feedback. The positive effects of feedback on performance found in
previous studies– e.g. a 1% test score increase overall and a 4% increase in the probability of
obtaining a first class grade in Bandiera et al. (2012) 28
- may thus be conditional on the
existence of an assessment incentive or compulsion rule to complete the feedback-generating
assignment.
28
Azmat and Iriberri (2011) conduct their experiment in schools and find that the provision of relative feedback
induced a 5% increase in students’ grades, and no heterogeneity in the treatment.
26
References
Angrist, J., P. Oreopoulos, T. Williams (2010) When Opportunity Knocks, Who Answers?
New Evidence on College Achievement Awards, NBER Working Papers #16643.
Angrist, J., Lang, D. and Oreopoulos, P. (2009) Incentives and Services for College
Achievement: Evidence from a Randomized Trial, American Economic Journal:
Applied Economics 1(1), 136-63.
Angrist, J. and Lavy, V. (2009) The Effects of High Stakes High School Achievement
Awards: Evidence from a Randomized Trial, American Economic Review, 99, 1384-
1414.
Azmat, G. and Iriberri, N. (2010) The importance of relative feedback information: Evidence
from a natural experiment using high school students, Journal of Public Economics
94, 435-52.
Ball, S.B. Ekel, C. and Rojas, C. (2006) Technology Improves Learning in large principle of
economics classes: Using our WITS. American Economic Review 96(2), 442-6.
Bandiera, O. Larcinese, V and Rasul, I. (2012) Blissful ignorance? Evidence from a natural
experiment on the effect of individual feedback on Performance. LSE mimeo.
Barrow, L. and C. E. Rouse (2013) Financial Incentives and Educational Investment: The
Impact of Performance-Based Scholarships on Student Time Use," NBER WP#
19351.
Behrman, E., S. Parker, P. Todd, K. Wolpin (2012) Aligning Learning Incentives of Students
and Teachers: Results from a Social Experiment in Mexican High Schools, mimeo,
University of Pennsylvania.
Beltz, P., Link, S. and Ostermaier, A. (2012) Incentives for Students: Evidence from Two
Natural Experiments, Ifo Working Paper #133.
Bishop, J. (2006) Drinking from the fountain of knowledge: Student incentive to study and
learn-externalities, information problems and peer pressure. CAHRS Working Paper
#4-15.
Camerer, C. and Hogarth, R. (1999) The Effects of Financial Incentives in Experiments: A
Review and Capital-Labor-Production Framework, Journal of Risk and Uncertainty,
19,7-42.
Cason, T., W. Masters and R. Sheremeta (2010) Entry into winner-take-all and proportional-
prize contests: An experimental study, Journal of Public Economics 94, 604-611.
Cha, P. and R. Patel (2010) Rewarding Progress, Reducing Debt: Early Results from Ohio’s
Performance-Based Scholarship Demonstration for Low-Income Parents. MDRC.
Croson, R. and Gneezy, U. (2009) Gender Differences in Preferences. Journal of Economic
Literature 47(2), 448–474
27
Dolton, P.J., Klein, J.D. and Weir, I. (1994) The economic evaluation of peer counselling in
facilitating computer use in higher education. Education Economics 2(3), 313-26.
Evensky, J., Grove, W.A., Hu, Y. and Wasserman, T. (2007) Closing the Loop: Enhancing
Collegiate Performance by Self-Assessment, mimeo.
Figlio, D. N. and L. W. Kenny (2007) Individual teacher incentives and student performance,
Journal of Public Economics 91(5-6), 901-914.
Frey, B and Jegen, R. (2002) Motivation crowding theory, Journal of Economic Surveys
15(5), 589-623.
Fryer, R. G. (2011) Teacher Incentives and Student Achievement: Evidence from New York
City Public Schools," NBER Working Papers #16850.
Garibaldi, P., A. Ichino, F. Giavazzi and E. Rettore (2012) College Cost and Time to
Complete a Degree: Evidence from Tuition Discontinuities, Review of Economics
and Statistics 94(3), 699-711.
Gneezy, U., S. Meier and P Rey-Biel (2011) When and Why Incentives (Don’t) Work to
Modify Behavior, Journal of Economic Perspectives 25(4), 191-210.
Grove, W. A. and Wasserman, T. (2006) Incentives and student learning: A natural
experiment with economics problems sets. American Economic Review 96(2), 437-
41.
Hanushek, E. 2006 School Resources in Handbook of the Economics of Education, (E.
Hanushek and F. Welsh), Volume 2, Elsevier
Lazear, E. P. 2000. Performance Pay and Productivity, American Economic Review, 90,
1346-1361.
Leuven, E Osterbeek, H and van der Klaauw, B. (2010) The effect of financial rewards on
student’s achievement: Evidence from a randomized experiment. Journal of the
European Economic Association 8(6), 1243-65.
Pozo, S. and Stull, C.A. (2006) Requiring a Math skill unit: Results of a randomised
experiment. American Economic Review 96 (2), 437-441.
Stock, J.H. and Yogo, M. (2005). Testing for Weak Instruments in Linear IV Regression. In
D.W.K. Andrews and J.H. Stock, eds. Identification and Inference for Econometric
Models: Essays in Honor of Thomas Rothenberg. Cambridge University Press, 80–
108.
28
Tables and Figures
Figure 1: Weekly quiz participation
Source: Total number of students: 206 in group 1 and 240 in group 2
Note: dashed vertical lines refer to year 2 incentives only – Assessment 2.5%
Solid vertical lines refer to year 1, compulsory incentive and year 2 – Assessment 5%
Dotted vertical lines refer to soft incentives: book voucher and solution provision
0.2
.4.6
.81
Qu
iz P
art
icip
ation
0 5 10 15 20Week
Group 1 Group 2
29
Figure 2: Number of quizzes completed before Exam
Figure 3: Distribution of In-Term Exam grades
0.1
.2.3
0 5 10 0 5 10
Group 1 Group 2
De
nsity
Total Number of Quizzes Completed Before in-term Exam
0
.01
.02
.03
.04
de
nsity
0 10 20 30 40 50 60 70 80 90 100in-Term Exam Grade:
Group 1: Autumn Group 2: Autumn
Group 1: Spring Group 2: Spring
30
Table 1: Timing of incentives
Autumn Spring
Week Year 1 Year 2 Year 1 Year 2
1 O O O O
2 O O O O
3 O Assessed 2.5% O Assessed 2.5%
4 Solution Solution O O
5 O Assessed 2.5% Voucher Voucher
6 Term break Term break
7 O O O Assessed 2.5%
8 (Compulsory) Assessed 5% O O
9 O O (Compulsory) Assessed 5%
10 Voucher Voucher O O
11 O O Solution* Solution*
Note:
O designates weeks without incentives to complete the online quiz; quiz is pure formative feedback.
Solution: Access to the weekly exercise sheet solutions conditional on quiz participation
* indicates that access to solution was conditional on getting a mark of 30 or above.
Voucher: £20 book voucher - prize for best quiz performance
Assessed 2.5%: Assessed quiz, counting 2.5% towards the overall course grade
Assessed 5%: Assessed quiz, counting 5% towards the overall course grade
Compulsory: Quiz mandatory part of 4 pieces of coursework (3 out of 4 are required)
Table 2: Evidence on Cheating: Fraction of students starting exam and performance
Start time +/- 1mn Start time +/- 30s Start time +/- 2mn (1) (2) (3) (4) (5) (6)
Norm. grade Dif in grade Norm. grade Dif in grade Norm. grade Dif in grade
% started 3.084 37.990 7.559 13.633 4.040 18.344 (3.426) (57.62) (5.983) (87.182) (2.873) (41.302)
Cohort 0.332 -1.738 0.316 -1.703 0.330 -1.701 (0.102)** (1.775) (0.103)** (1.749) (0.101)** (1.787)
R2 0.14 0.17 0.14 0.17 0.14 0.17
Note: Norm. grade is the z score of the grade at the in-term online test, normalised by the group’s average grade.
Dif in grade is the grade difference between in-term online test and final exam
% started: fraction of students that started within the same time interval as the student in question.
31
Table 3: Descriptive statistics Full sample Matched sample
Group 1 Group 2 Group 1 Group 2
Panel A. Student characteristics Age (in months) 233.6 (1.163) 230.5** (0.895) 227.2 (0.781) 229.1 (0.839)
Male 0.529 (0.035) 0.637** (0.032) 0.643 (0.036) 0.615 (0.036)
UK citizen 0.294 (0.032) 0.538*** (0.033) 0.582 (0.036) 0.594 (0.036)
Chinese citizen 0.127 (0.023) 0.081 (0.018) 0.069 (0.018) 0.059 (0.017)
Econ Major 0.485 (0.035) 0.709*** (0.030) 0.742 (0.032) 0.717 (0.034)
Abilitya 330.7 (6.960) 303.7*** (4.671) 312.41 (4.915) 306.47 (4.467)
No. Obs. 206 238 138 187
Panel B. Student preference parameters and (usually unobserved) characteristics Confidence 12.986 (0.223) 12.642 (0.210) 12.736 (0.247) 12.632 (0.241)
Discount rate 4.349 (0.445) 4.387 (0.431) 4.356 (0.489) 4.032 (0.482)
Risk attitudes 194.9 (20.40) 139.7** (16.00) 173.8 (18.90) 137.7 (18.00)
Risk choices 6.319 (0.122) 6.407 (0.109) 6.295 (0.121) 6.429 (0.115)
No Obs. 142 155 103 128
Panel C. Student effort and performance No. quizzes attempted
7.838 (0.333) 9.884*** (0.338) 7.650 (0.368) 9.914*** (0.391)
Quiz grade (%)1 56.68 (0.711) 64.54*** (0.622) 59.16 (0.690) 65.19*** (0.686)
Quiz duration (mins)1
33.406 (0.680) 34.845 (0.635) 32.764 (0.666) 35.305***(0.719)
Self-study1 (hrs per week)
2.839 (0.112) 4.469***(0.169) 2.788 (0.158) 4.451*** (0.192)
Lecture attendance1
0.907 (0.014) 0.902 (0.012) 0.940 (0.012) 0.897** (0.013)
In-term exam grade
68.13 (0.918) 72.27*** (0.737) 69.66 (0.835) 73.16*** (0.803)
Final exam grade 46.38 (1.12) 50.03** (1.10) 48.92 (1.10) 52.11** (1.16)
No Obs. 204 234 136 183
Note: ***/** indicate significant mean differences between waves at the 1/5% significance level. Standard
errors reported in parentheses. Matched samples obtained from kernel matching (Epanechnikov) with bandwidth
(0.01). a: Ability not observed for all participants, sample sizes in the full sample are 145 (202) for group 1(2).
1: observed conditional on quiz participation only.
Econ Major denotes Economics or Economics and Finance students.
Variables in Panel B are measured in week 1 of term 1: Risk choices is the sum of scores obtained from the
questions: Do you have a personal medical insurance? Do you smoke? Do you take out travel insurance? Have
you incurred interest charges on your credit cards? Do you play lotteries? Do you have a savings account? Did
you play slot machines last week? Do you cross at pedestrian crossing? Do you do any dangerous sport?
Confidence is the sum of scores obtained from answers to statements: I feel comfortable speaking to a bank
manager about loans, I enjoy challenging situations, I’m not scared of being in debt, I handle uncertainty well.
Risk attitude is the willingness to pay for a lottery with a 50% chance of winning a price of £1,000. Discount
rate is elucidated from 5 questions regarding the present values of hypothetical prices one year later.
32
Table 4: Impact of Incentives on Student Effort, measured as quiz particiation
Dependent variable: quiz participation
A. Impact of incentives relative to non-
incentivised weeks
B. Displacement effects
Matched sample
Ability
Sample
All Matched
sample
Matched
sample
FE OLS OLS FE FE
No incentives -0.039 -0.015
(0.043) (0.061)
Solution 0.019 0.017 0.014 -0.015
(0.017) (0.015) (0.014) (0.041)
Book voucher -0.087*** -0.085*** -0.091*** -0.127***
(0.015) (0.014) (0.013) (0.051)
Assess 2.5% 0.420*** 0.412*** 0.417*** 0.387*** 0.400***
(0.023) (0.022) (0.020) (0.045) (0.043)
Assess 5% 0.622*** 0.621*** 0.627*** 0.590*** 0.619***
(0.025) (0.024) (0.022) (0.055) (0.048)
Compulsory 0.727*** 0.683*** 0.662*** 0.689*** 0.728***
(0.034) (0.022) (0.021) (0.065) (0.77)
Group 2 0.015 0.000
(0.028) (0.025)
No incentive * -0.014 Group 2 (0.065)
Weak incentive -0.060 (0.060)
Weak incentive * 0.024
Group 2 (0.063)
Ability controls No Yes No No No
Individual fixed effect
Yes No No Yes Yes
Observations [individuals]
6500 [325]
6940 [347]
8880 [444]
6500 [325]
6500 [325]
R2 0.25 0.28 0.27 0.25 0.25
Note: Other independent variables are: an indicator of term, term-specific trend, gender, Chinese National, other
non-UK national dummies, subject of degree and a linear term in age (in month), dummies for tests in that week
in other modules, essay in that week in other modules.
“No incentive” refers to quizzes in week without incentives after the first quiz took place.
Robust standard errors clustered at individual level.
33
Table 5: Heterogeneous incentive effects on student effort
Heterogeneous incentive effects by characteristic X
Ability Gender Risk attitude Q1 Q2 Q3 Male
No incentive -0.085 -0.076 -0.077
(0.076) (0.055) (0.050)
No incentive * X 0.127 0.024 0.002 0.059 0.035
(0.093) (0.090) (0.108) (0.064) (0.016)**
Solution -0.071 -0.047 -0.024 (0.079) (0.052) (0.050)
Solution * X 0.130 0.046 0.009 0.051 0.011 (0.089) (0.091) (0.109) (0.061) (0.014)
Book voucher -0.223*** -0.219*** -0.176*** (0.084) (0.063) (0.054)
Book voucher * X 0.127 0.024 0.002 0.146** 0.041** (0.093) (0.090) (0.108) (0.069) (0.018)
Assess 2.5% 0.190** 0.316*** 0.281*** (0.094) (0.061) (0.057)
Assess 2.5% * X 0.289*** 0.228** 0.103 0.113 0.055*** (0.110) (0.108) (0.127) (0.071) (0.018)
Assess 5% 0.366*** 0.519*** 0.498*** (0.099) (0.063) (0.059)
Assess 5% * X 0.297*** 0.245** 0.174 0.107 0.048*** (0.115) (0.110) (0.128) (0.071) (0.018)
R2 0.23 0.24 0.31
F-test 1.63** 3.11** 3.19***
Note: F-test: F test on the heterogenous components. Sample size: Matched sample: n=6500 Number of
individuals, N:=325). For lottery interaction regression, the sample size is n=4580, N=229. Weights obtained
from propensity score matching.
Other independent variables are: an indicator of term, a term-specific linear time trend, , tests in that week in
other modules, essays due in that week in other modules. Robust standard errors clustered at the individual level
Table 6: Impact of Assessment Weighting on Student Effort (measured as the number
of quizzes completed before the in term test)
OLS Q10 Q25 Q50 Q75 Q90
Group 2 1.141*** 0.525*** 1.354*** 1.642*** 1.356*** 0.857*** (0.292) (0.137) (0.102) (0.215) (0.268) (0.098)
(pseudo) R2 0.28 0.05 0.19 0.18 0.10 0.07
Note: Matched Sample - Sample size is 650 (325 students); Standard errors are clustered at the individual
level ; Quantile regressions are estimated separately for each quantile.
34
Table 7: Impact of Student Effort in Quizzes on Normalised Exam Grades.
OLS OLS Fixed Effect IV
Nbr Quizzes 0.161*** 0.174*** 0.078* 0.149** (0.031) (0.046) (0.041) (0.060)
Group 2 -0.018 0.078 n.a.
(0.107) (0.171)
Nbr Quizzes -0.030
*Group 2 (0.045)
1st stage
Group 2 1.586*** (0.279)
F-test 32.32
(pseudo) R2 0.21 0.21 0.14 0.21
Note: Matched Sample - Sample size is 600 for in-term exam (308 students)
Standard errors are clustered at the individual level.
Controls include: dummies for gender, Chinese Nationals, other non-UK nationals, subject of degree and term
and a linear in age (in month) and ability quartiles.
Table 8: Quantile regressions of return to student effort
Q10 Q25 Q50 Q75 Q90
Nbr Quizzes 0.219*** 0.197*** 0.183*** 0.113*** 0.074*** (0.018) (0.046) (0.023) (0.043) (0.022)
Group 2 -0.329*** -0.068 -0.008 0.031 -0.035 (0.067) (0.173) (0.089) (0.158) (0.063)
(pseudo) R2 0.13 0.14 0.17 0.12 0.10
IVQ10 IVQ25 IVQ50 IVQ75 IVQ90
No. quizzes 0.012 0.154 0.178** 0.133 0.069 [ 95% CI] [-0.12,0.22] [-0.09,0.34] [0.03,0.35] [-0.11,0.32] [-0.16,028]
Note: Matched Sample - Sample size is 600 for in-term exam (308 students)
Quantile regressions are estimated separately for each quantile.
Controls include: dummies for gender, Chinese Nationals, other non-UK nationals, subject of degree and term
and a linear in age (in month) and ability quartiles.
35
Appendix A
Figure 1: Distribution of Propensity Score by Support Status
0 .2 .4 .6 .8 1Propensity Score
Untreated Treated: On support
Treated: Off support