Embed Size (px)
Citation preview

National Aeronautics and Space Administration
www.nasa.gov
Making Predictions at the
Ashok N. Srivastava, Ph.D.
Principal Investigator, IVHM Project
Group Leader, Intelligent Data Understanding Group
Santanu Das, Ph.D.
Arizona State University
NASA Ames Research Center

National Aeronautics and Space Administration
www.nasa.gov
Some Predictions are Difficult

National Aeronautics and Space Administration
www.nasa.gov
One of Leibniz’s Views on Prediction
If someone could have a sufficient insight into the inner parts of things, and in addition had remembrance and intelligence enough to consider all the circumstances and to take them into account, he would be a prophet and would see the future in the present as in a mirror.
From ChaosBook.org and Wikipedia

National Aeronautics and Space Administration
www.nasa.gov
0 1 0 0 2 0 0 3 0 0 4 0 0 5 0 00
1
2
3
4
5
6x 1 0
4
S a m p l e p o i n t s ( t i m e a x i s )
Am
pli
tud
eSome Predictions are Easy
0 5 0 1 0 0 1 5 0 2 0 0 2 5 0 3 0 0 3 5 0 4 0 0- 1 . 5
- 1
- 0 . 5
0
0 . 5
1
1 . 5
S a m p l e p o i n t s ( t i m e a x i s )
Am
pli
tud
e
National Aeronautics and Space Administration
www.nasa.gov
0 100 200 300 400 5000
50
100
150
200
250
Sample points (time axis)
Inte
nsi
ty
Run-1
Run-2
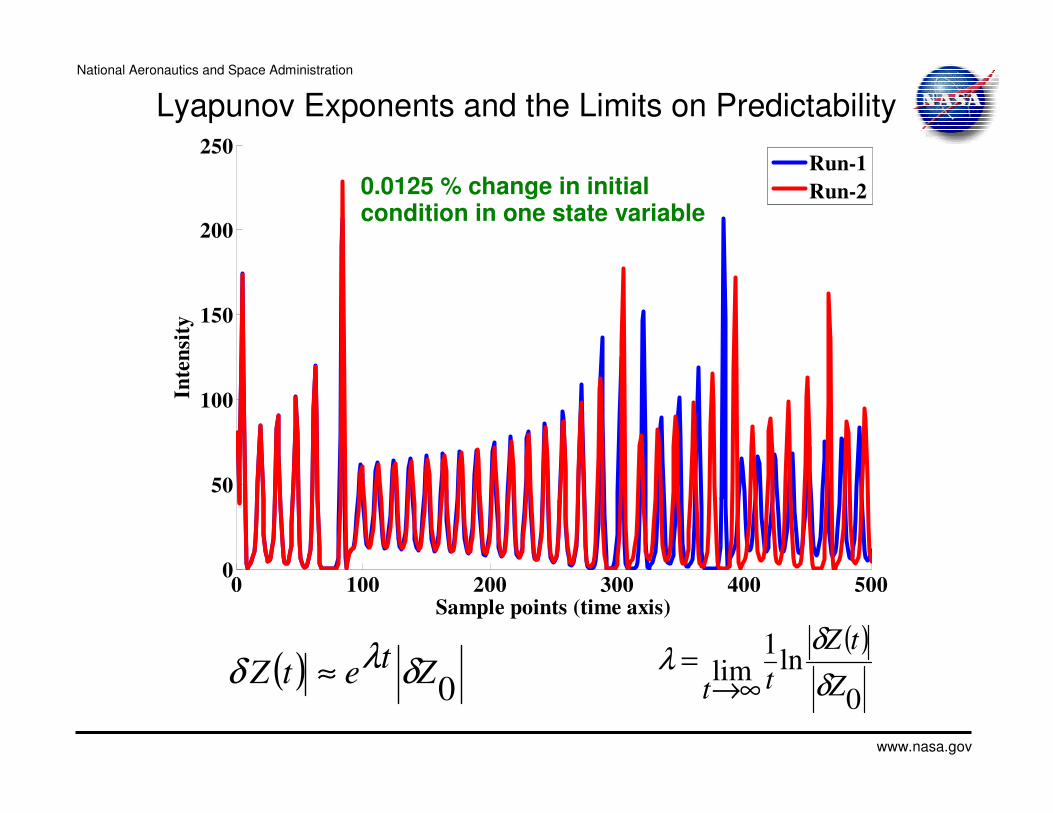
Lyapunov Exponents and the Limits on Predictability
0.0125 % change in initial condition in one state variable
( )0
Zt
etZ δλδ ≈( )
0
ln1
limZ
tZ
tt δ
δλ
∞→=
National Aeronautics and Space Administration
www.nasa.gov
0 1 0 0 2 0 0 3 0 0 4 0 0 5 0 00
1
2
3
4
5
6
7
8x 1 0
5
S a m p l e p o i n t s ( t i m e a x i s )
Cu
mu
lati
ve
squ
are
d e
rro
r
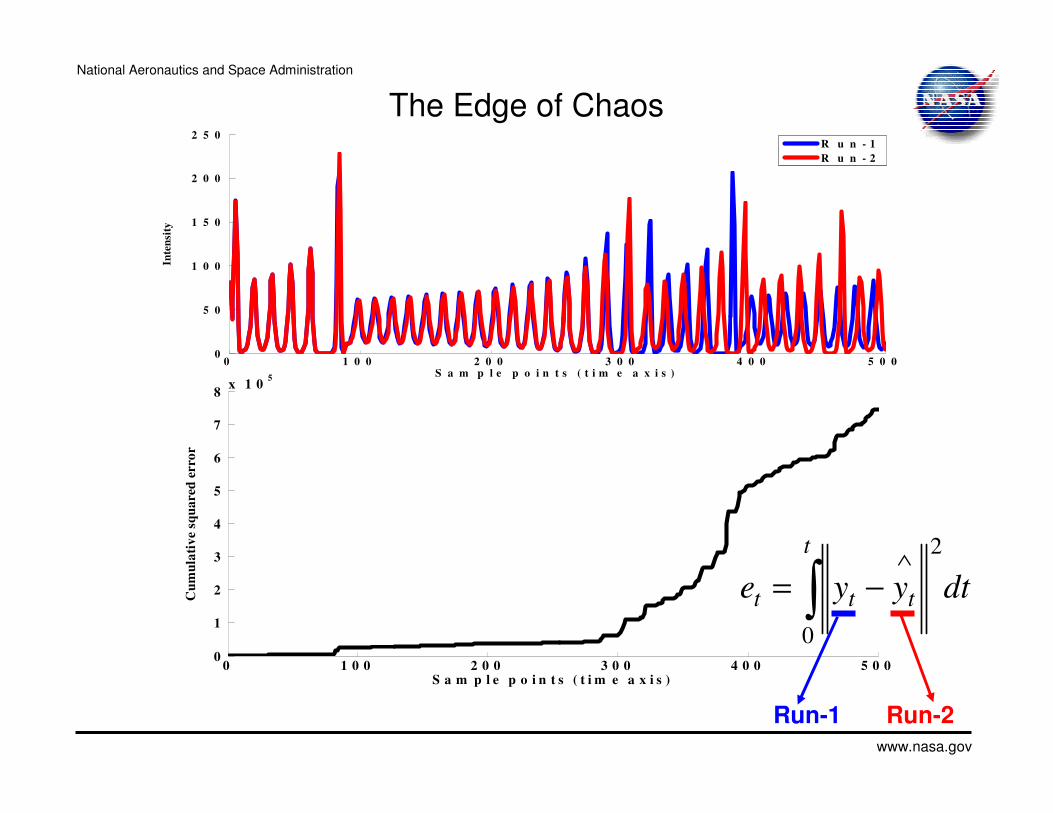
dtyye
t
ttt ∫∧
−=
0
2
Run-1 Run-2
0 1 0 0 2 0 0 3 0 0 4 0 0 5 0 00
5 0
1 0 0
1 5 0
2 0 0
2 5 0
S a m p l e p o i n t s ( t i m e a x i s )
Inte
nsi
ty
R u n - 1
R u n - 2
The Edge of Chaos

National Aeronautics and Space Administration
www.nasa.gov
Extreme Shred Metalwww.edgeofchaos.us
National Aeronautics and Space Administration
www.nasa.gov
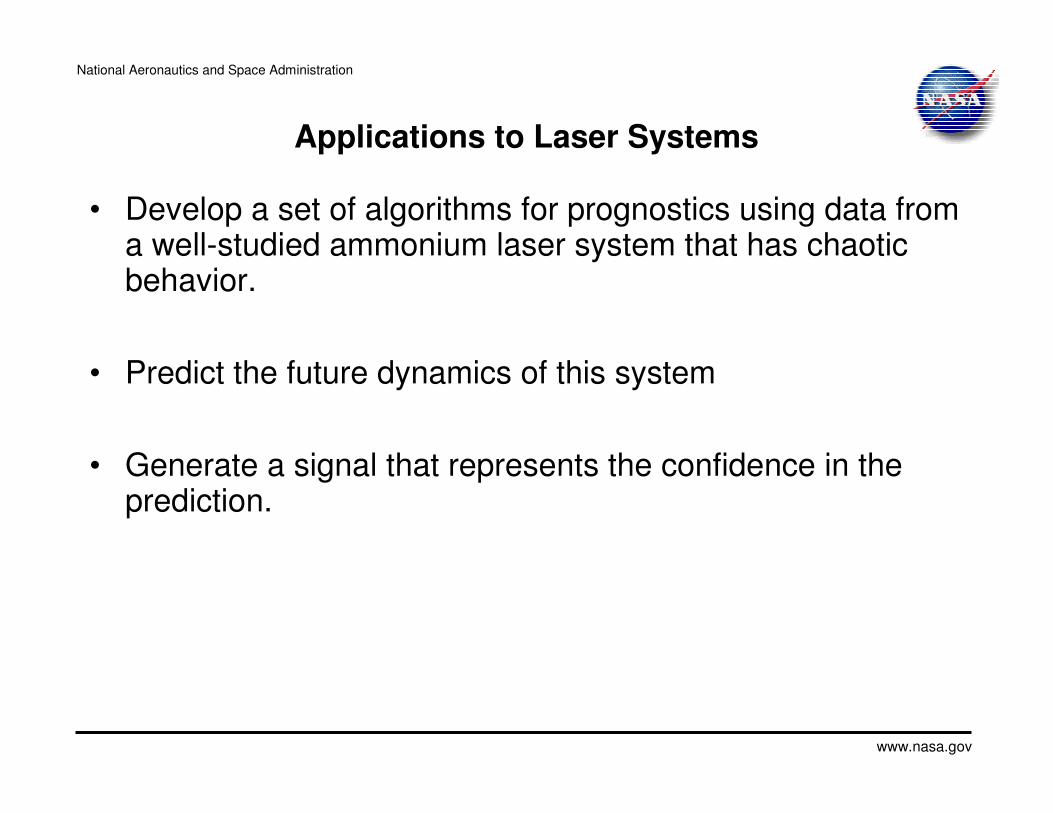
Applications to Laser Systems
• Develop a set of algorithms for prognostics using data from a well-studied ammonium laser system that has chaotic behavior.
• Predict the future dynamics of this system
• Generate a signal that represents the confidence in the prediction.

National Aeronautics and Space Administration
www.nasa.gov
National Aeronautics and Space Administration
www.nasa.gov
0 100 200 300 400 500 600 700 8000
50
100
150
200
250
300
Sample points (time axis)
Inte
nsi
ty
collapse
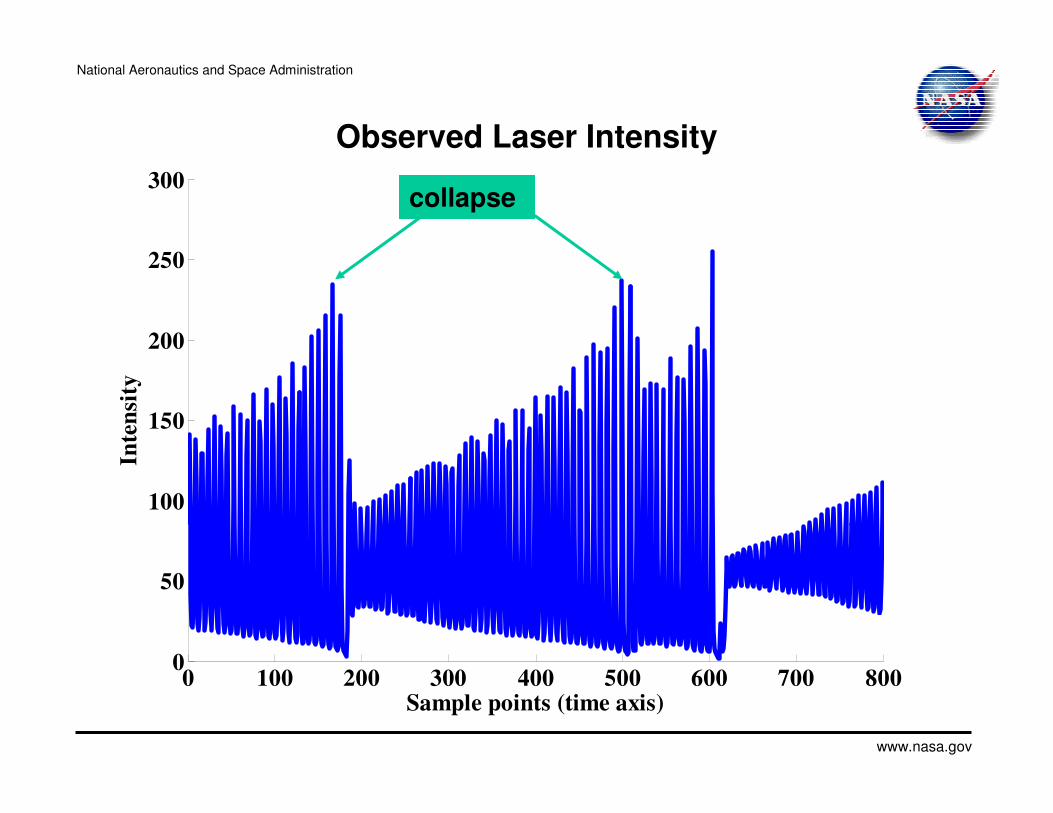
Observed Laser Intensity
National Aeronautics and Space Administration
www.nasa.gov
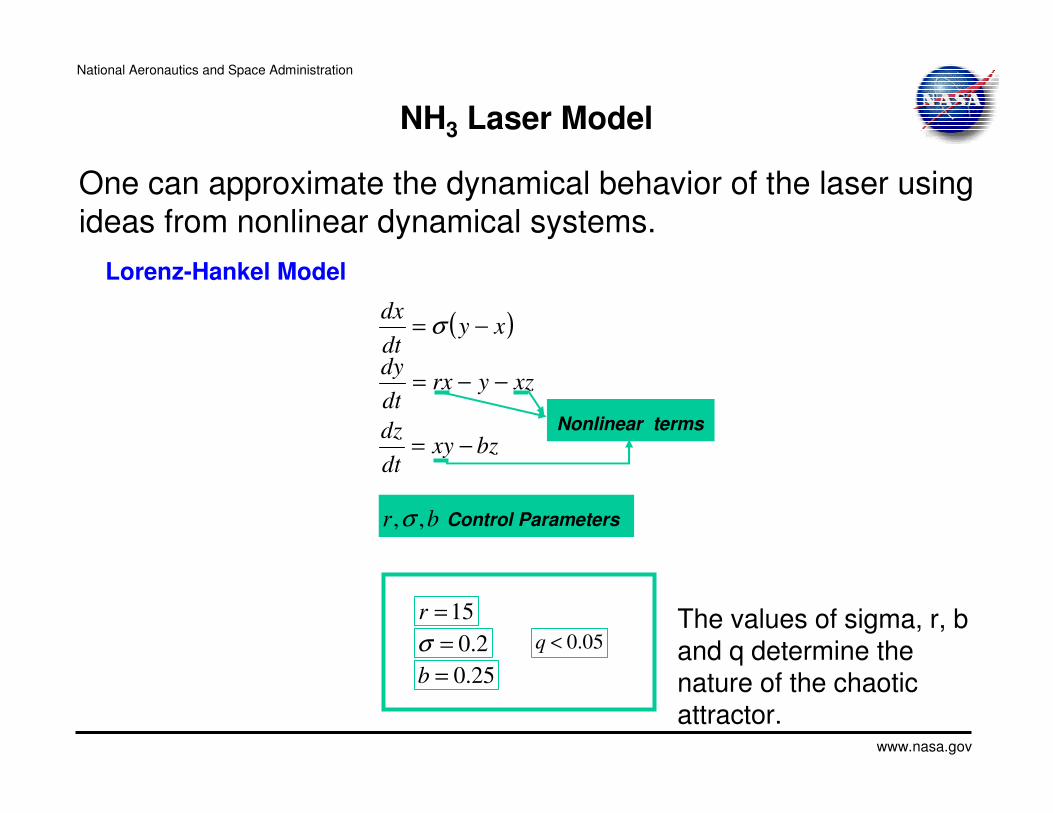
NH3 Laser Model
Lorenz-Hankel Model
( )xydt
dx−= σ
xzyrxdt
dy−−=
bzxydt
dz−=
Control Parametersbr ,,σ
Nonlinear terms
2.0=σ 05.0<q
15=r
25.0=b
One can approximate the dynamical behavior of the laser using
ideas from nonlinear dynamical systems.
The values of sigma, r, b and q determine the nature of the chaotic attractor.
National Aeronautics and Space Administration
www.nasa.gov
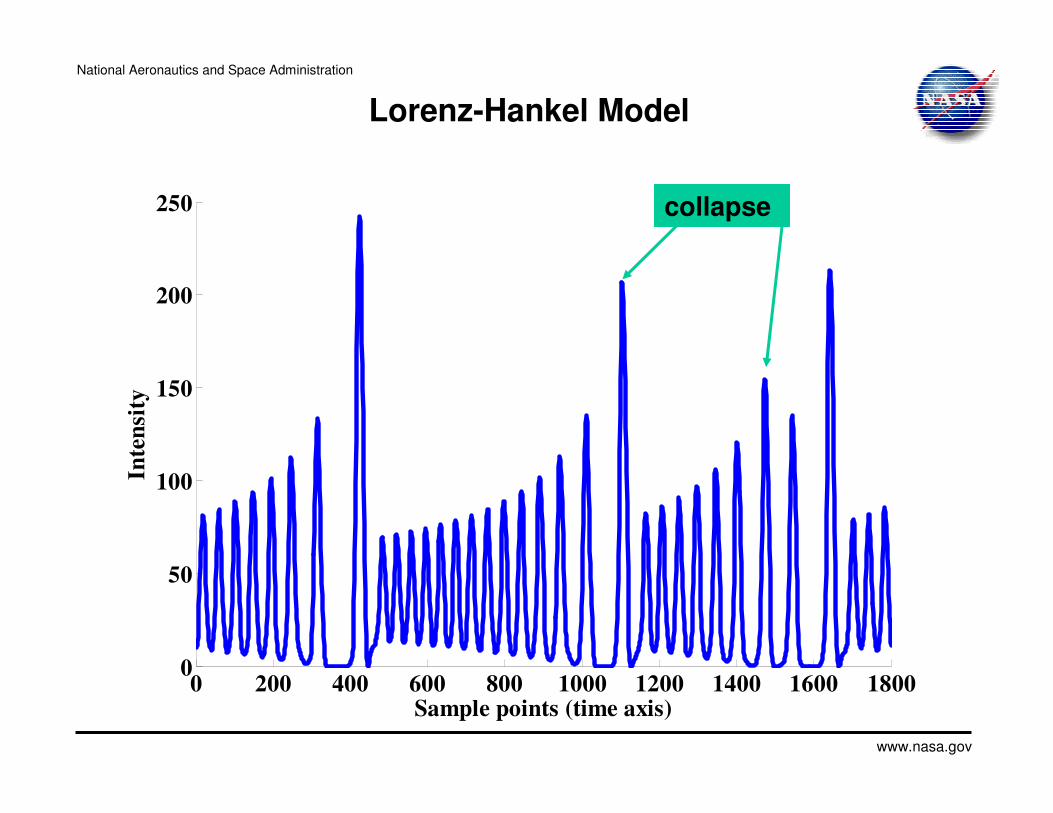
0 200 400 600 800 1000 1200 1400 1600 18000
50
100
150
200
250
Sample points (time axis)
Inte
nsi
tyLorenz-Hankel Model
collapse
National Aeronautics and Space Administration
www.nasa.gov
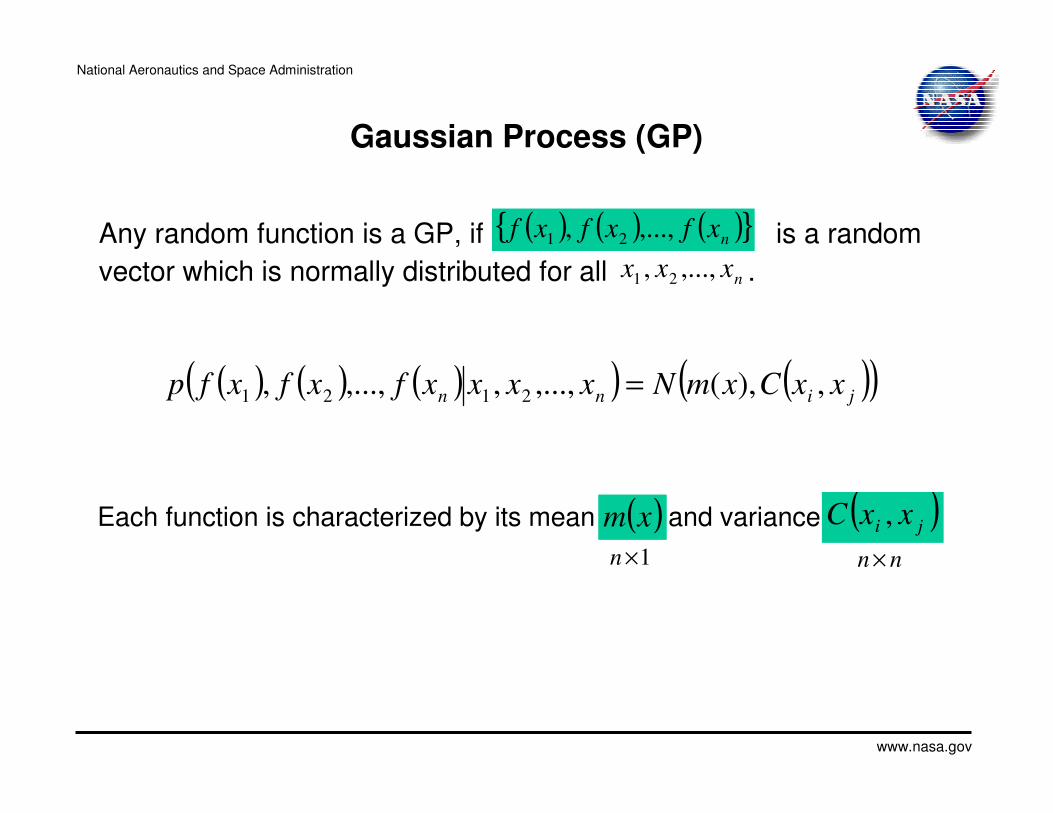
Any random function is a GP, if is a random
vector which is normally distributed for all .
Gaussian Process (GP)
( ) ( ) ( ){ }nxfxfxf ,...,, 21
( )xm ( )ji xxC ,
( ) ( ) ( )( ) ( )( )jinn xxCxmNxxxxfxfxfp ,),(,...,,,...,, 2121 =
1×n nn ×
Each function is characterized by its mean and variance
nxxx ,...,, 21
National Aeronautics and Space Administration
www.nasa.gov
0 0.2 0.4 0.6 0.8 1-1.5
-1
-0.5
0
0.5
1
1.5
Input
Ta
rget
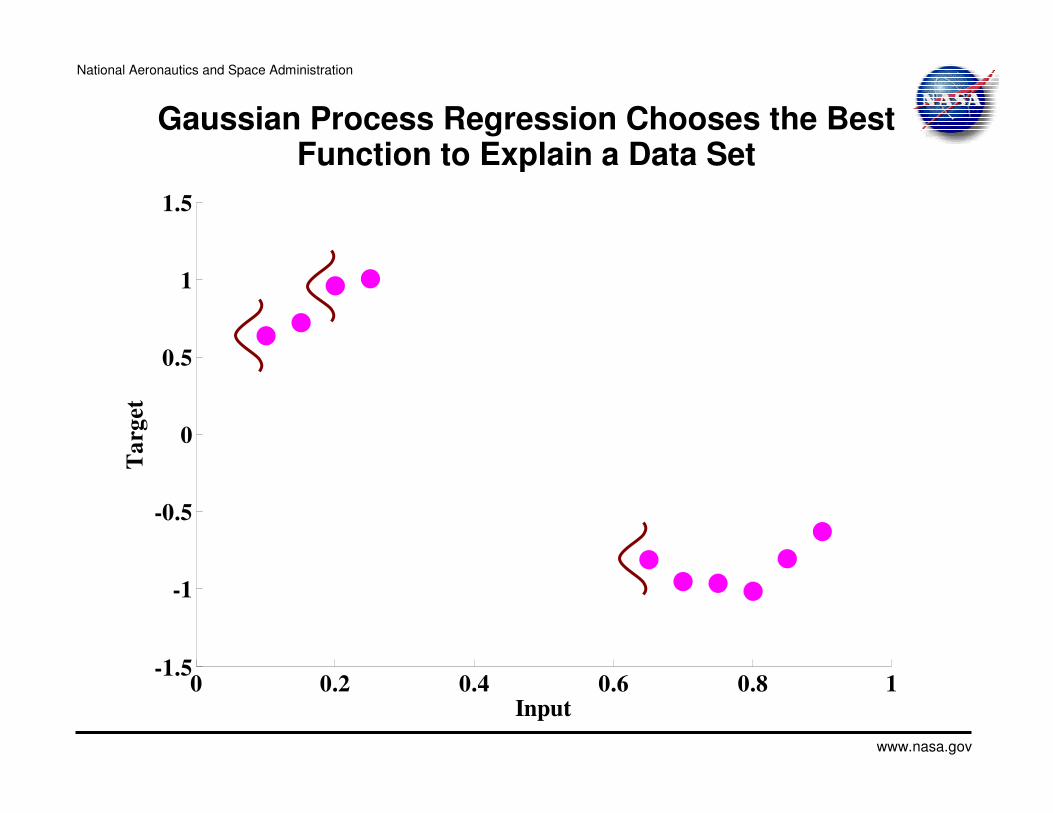
Gaussian Process Regression Chooses the Best Function to Explain a Data Set
National Aeronautics and Space Administration
www.nasa.gov
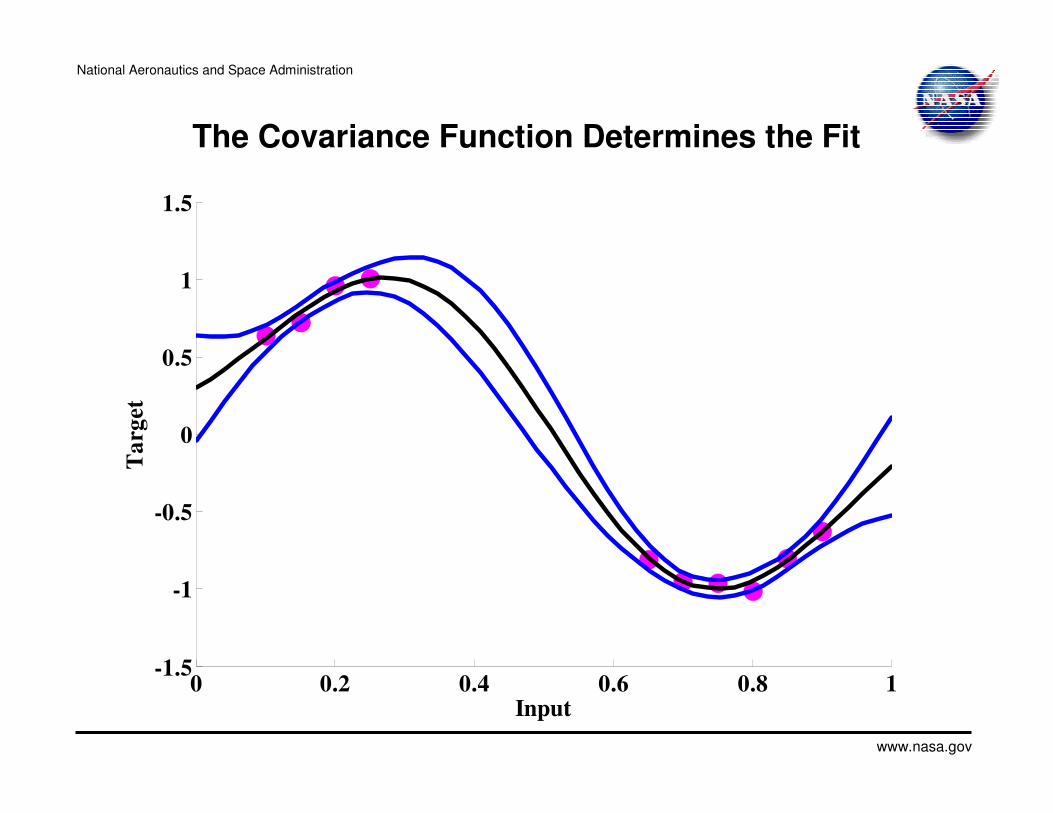
The Covariance Function Determines the Fit
0 0.2 0.4 0.6 0.8 1-1.5
-1
-0.5
0
0.5
1
1.5
Input
Ta
rget
National Aeronautics and Space Administration
www.nasa.gov
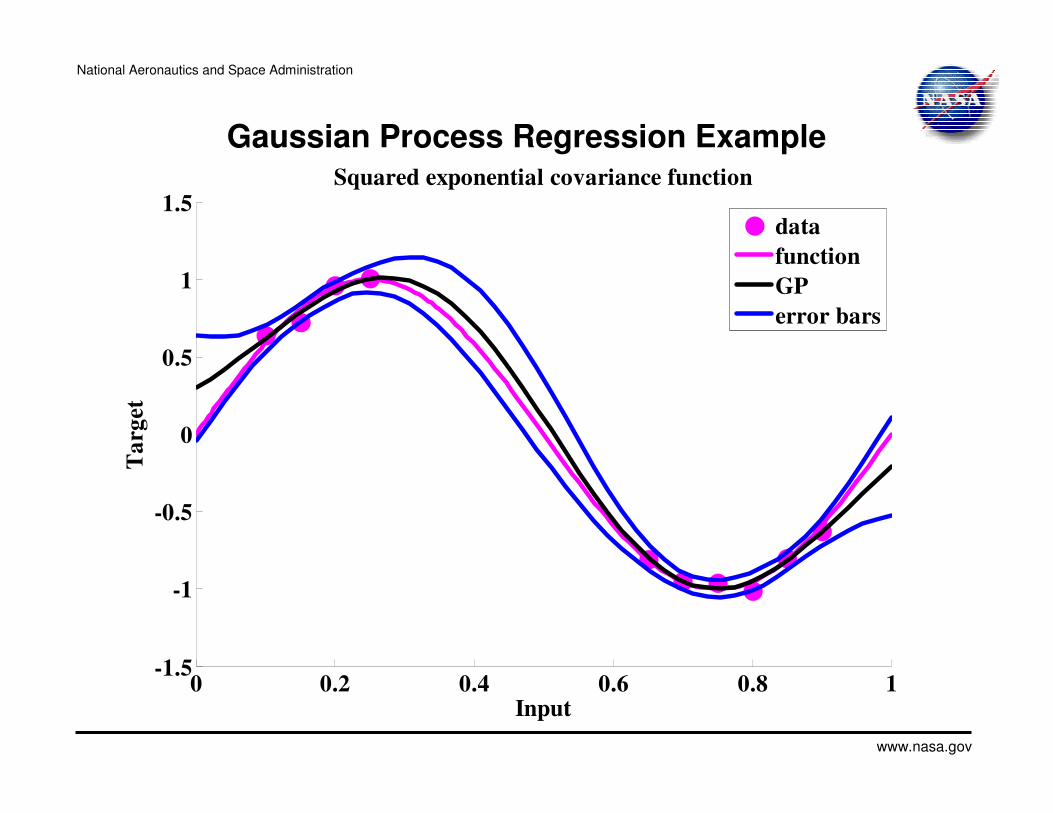
Gaussian Process Regression Example
0 0.2 0.4 0.6 0.8 1-1.5
-1
-0.5
0
0.5
1
1.5
Input
Ta
rget
Squared exponential covariance function
data
function
GP
error bars
National Aeronautics and Space Administration
www.nasa.gov
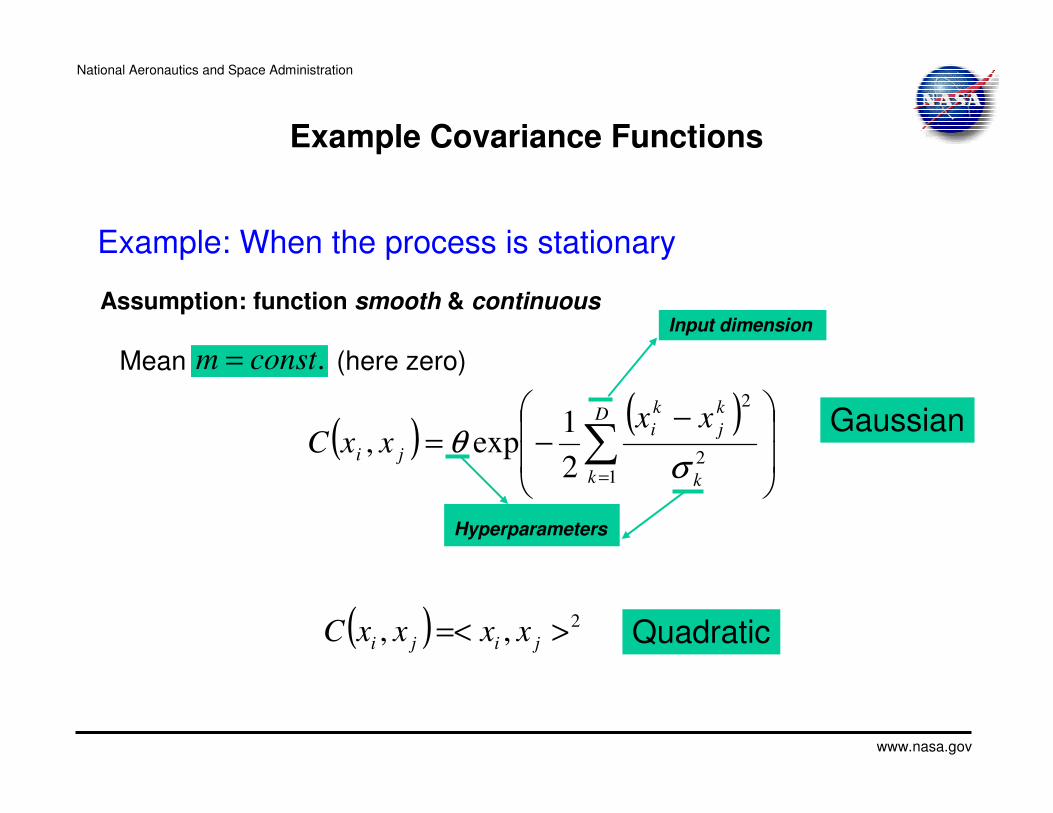
Example: When the process is stationary
Assumption: function smooth & continuous
( )( )
−−= ∑
=
D
k k
k
j
k
i
ji
xxxxC
12
2
2
1exp,
σθ
Mean (here zero).constm =
Hyperparameters
Input dimension
Example Covariance Functions
( ) 2,, >=< jiji xxxxC
Gaussian
Quadratic
National Aeronautics and Space Administration
www.nasa.gov
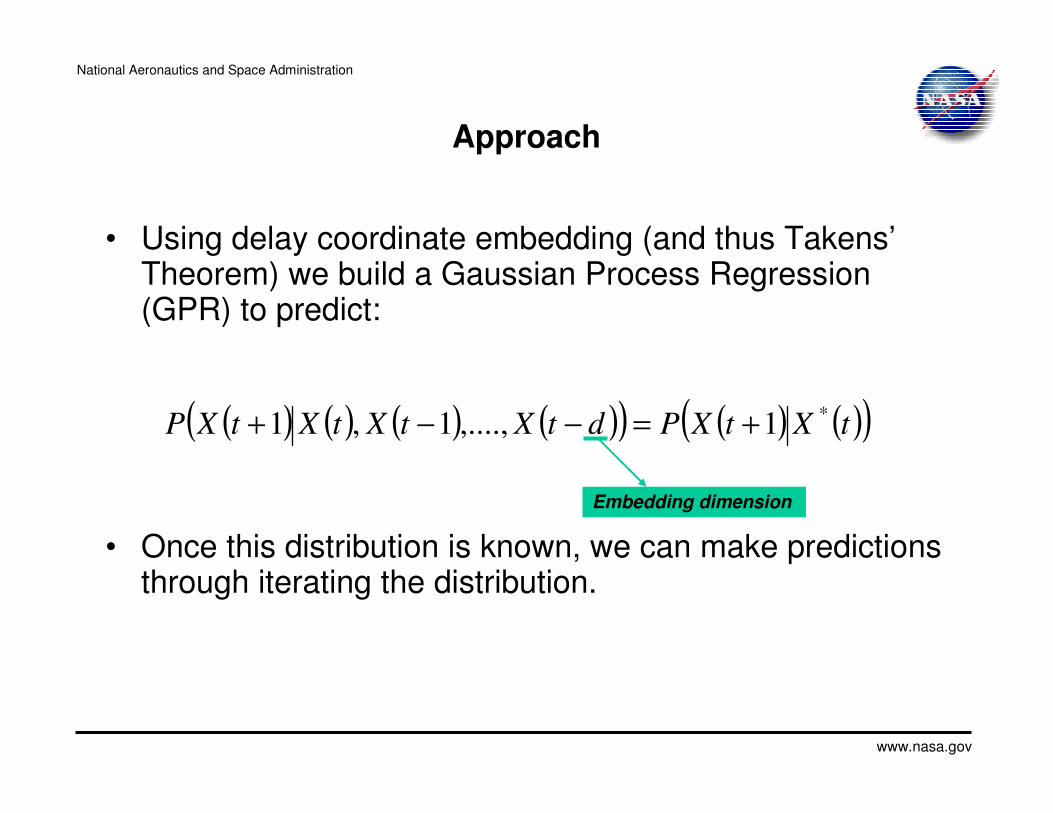
Approach
• Using delay coordinate embedding (and thus Takens’Theorem) we build a Gaussian Process Regression (GPR) to predict:
• Once this distribution is known, we can make predictions through iterating the distribution.
( ) ( ) ( ) ( )( ) ( ) ( )( )tXtXPdtXtXtXtXP*1,....,1,1 +=−−+
Embedding dimension
National Aeronautics and Space Administration
www.nasa.gov
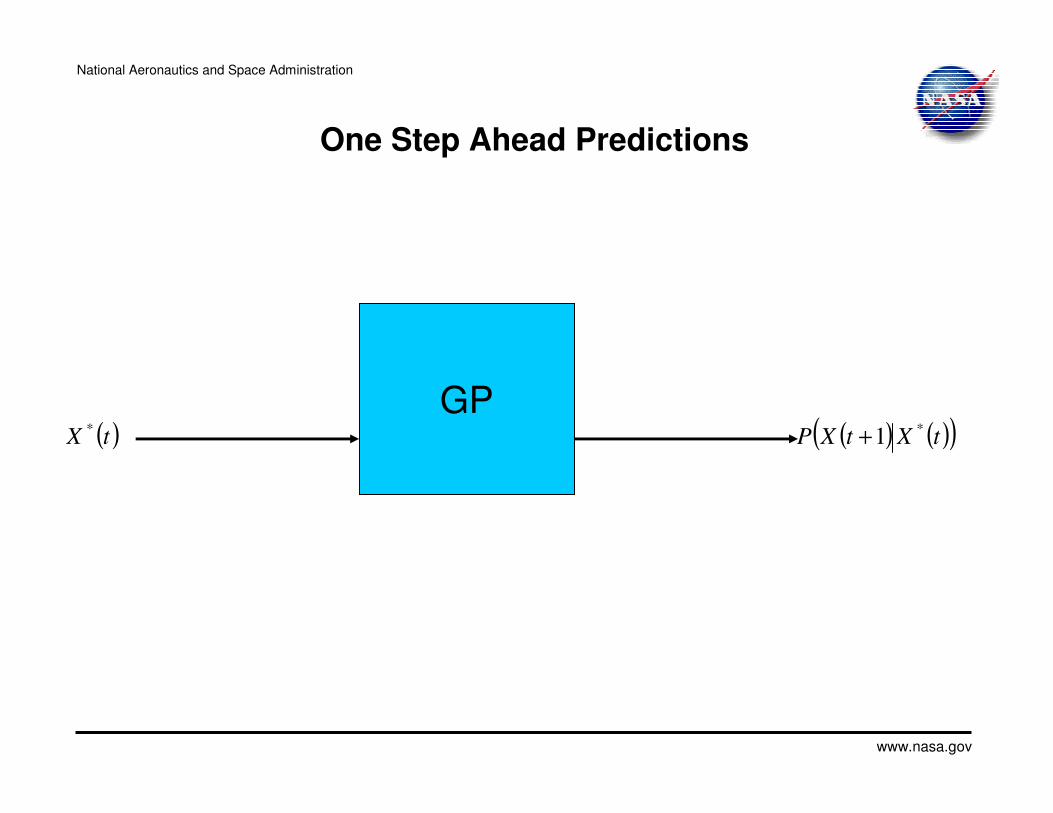
One Step Ahead Predictions
GP( ) ( )( )tXtXP
*1+( )tX*
National Aeronautics and Space Administration
www.nasa.gov
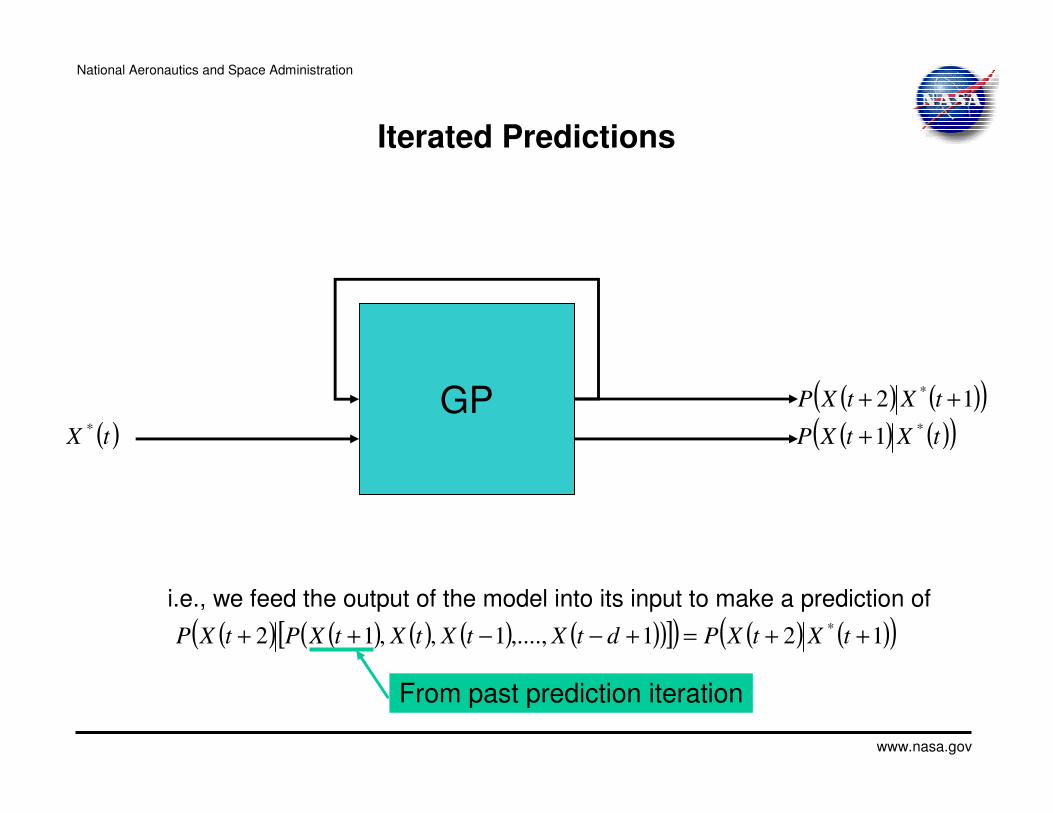
Iterated Predictions
GP
i.e., we feed the output of the model into its input to make a prediction of
From past prediction iteration
( )tX* ( ) ( )( )tXtXP
*1+
( ) ( )( )12 * ++ tXtXP
( ) ( ) ( ) ( ) ( )( )[ ]( ) ( ) ( )( )121,....,1,,12 * ++=+−−++ tXtXPdtXtXtXtXPtXP
National Aeronautics and Space Administration
www.nasa.gov
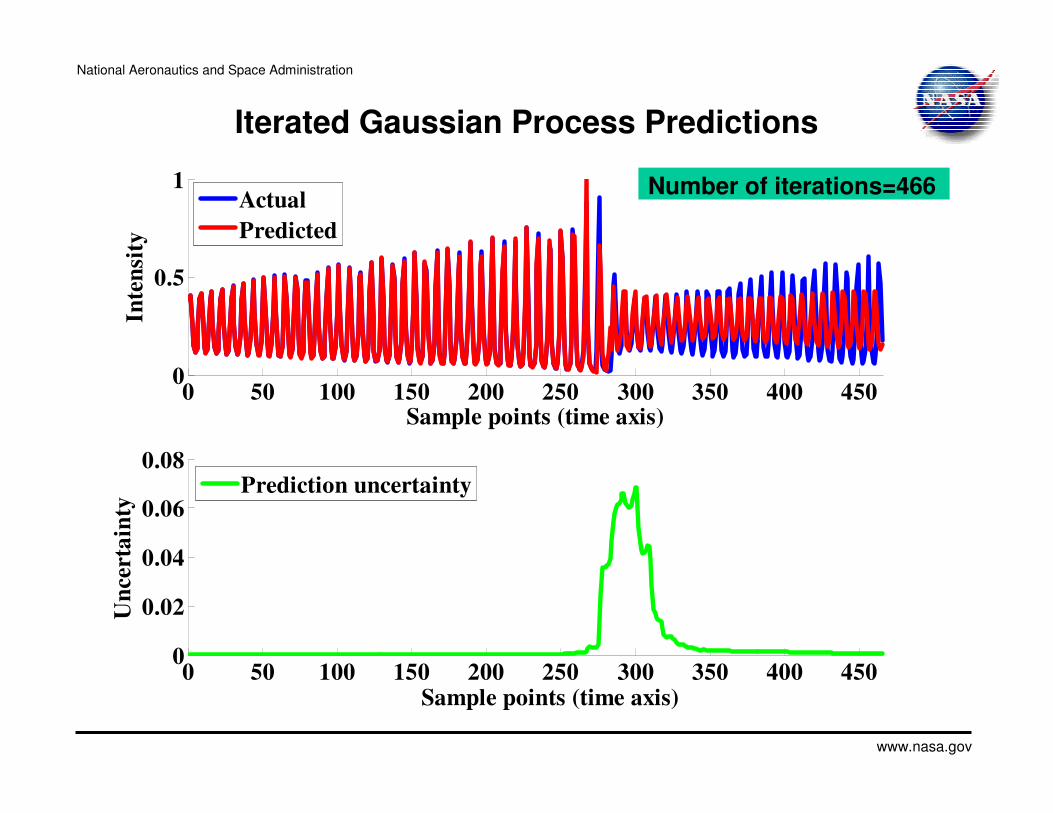
0 50 100 150 200 250 300 350 400 4500
0.5
1
Sample points (time axis)
Inte
nsi
ty
0 50 100 150 200 250 300 350 400 4500
0.02
0.04
0.06
0.08
Sample points (time axis)
Un
cert
ain
ty
Prediction uncertainty
Actual
Predicted
Iterated Gaussian Process Predictions
Number of iterations=466
National Aeronautics and Space Administration
www.nasa.gov
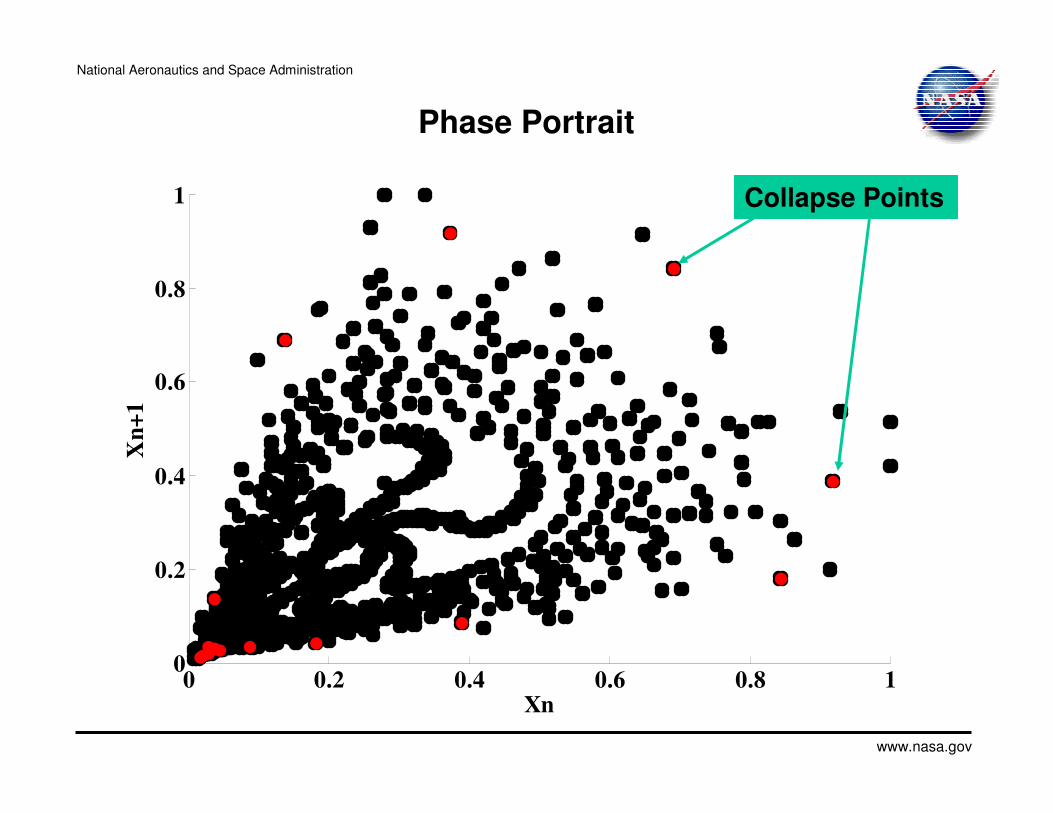
0 0.2 0.4 0.6 0.8 10
0.2
0.4
0.6
0.8
1
Xn
Xn
+1
Collapse Points
Phase Portrait
National Aeronautics and Space Administration
www.nasa.gov
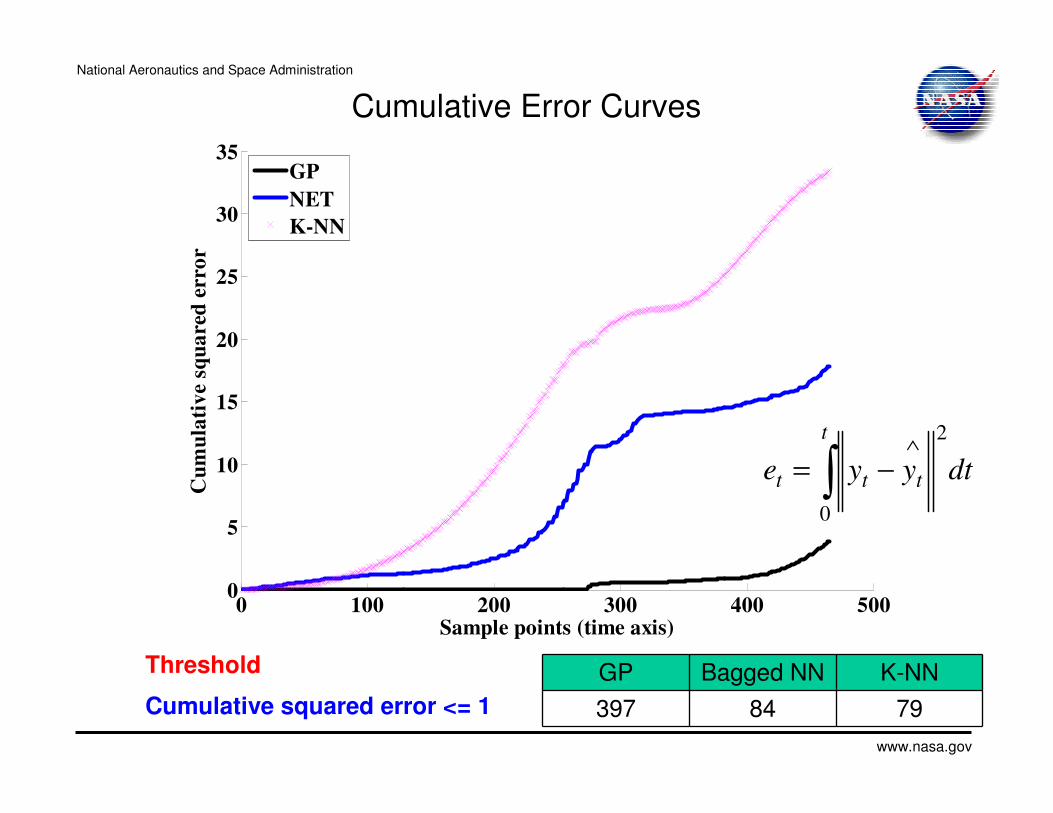
0 100 200 300 400 5000
5
10
15
20
25
30
35
Sample points (time axis)
Cu
mu
lati
ve
squ
are
d e
rro
r
GP
NET
K-NN
Cumulative Error Curves
7984397
K-NNBagged NNGPThreshold
Cumulative squared error <= 1
dtyye
t
ttt ∫∧
−=
0
2
National Aeronautics and Space Administration
www.nasa.gov
Results
• We have shown that we can make iterated forecasts and detect a precursor to the sudden drop in intensity using kernel methods.
• We can generate a meaningful measure of prediction certainty.
• This quantity seems to indicate substantial increases in uncertainty near the collapse.
National Aeronautics and Space Administration
www.nasa.gov
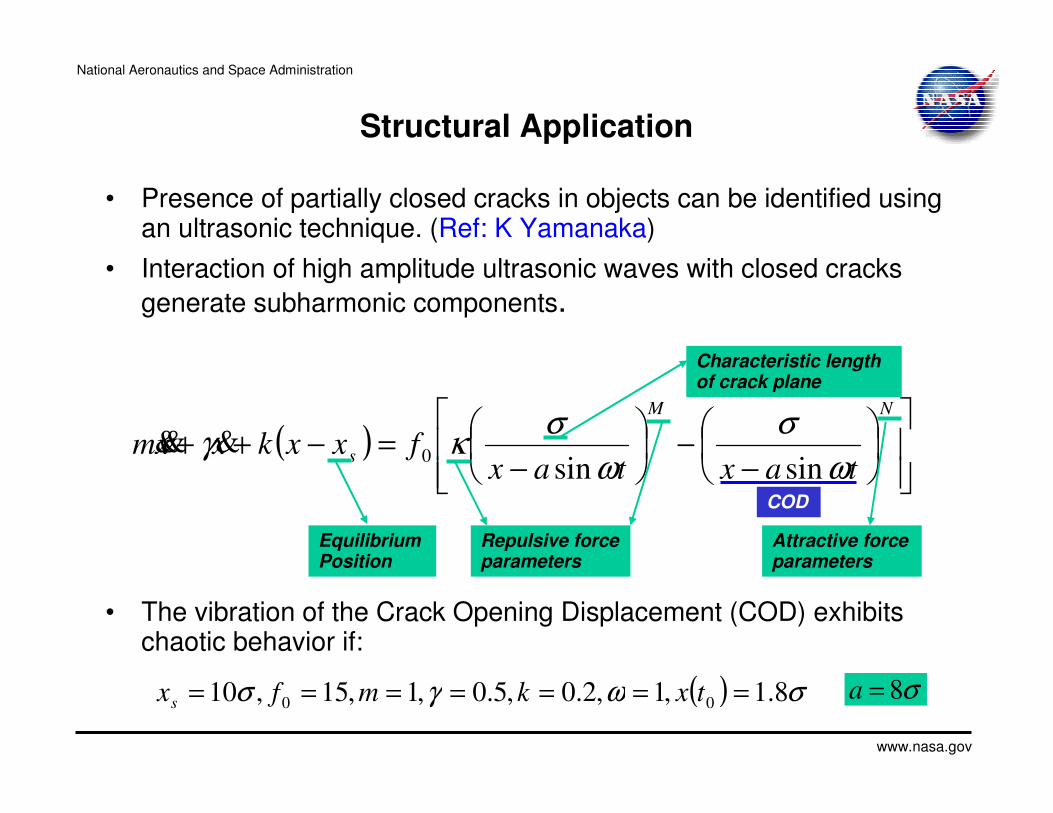
Structural Application
• Presence of partially closed cracks in objects can be identified using an ultrasonic technique. (Ref: K Yamanaka)
• Interaction of high amplitude ultrasonic waves with closed cracks
generate subharmonic components.
( )
−−
−=−++
NM
staxtax
fxxkxxmω
σ
ω
σκγ
sinsin0
&&&
Repulsive force parameters
Attractive force parameters
Equilibrium Position
Characteristic length of crack plane
• The vibration of the Crack Opening Displacement (COD) exhibits chaotic behavior if:
COD
( ) σωγσ 8.1,1,2.0,5.0,1,15,10 00 ======= txkmfxsσ8=a

National Aeronautics and Space Administration
www.nasa.gov
Further Work
• Understanding the limits of predictability for these systems
• Significant testing with respect to forecast variability and quality of precursor detection.
• Analysis of forecast horizon.
• Test methods on data from aircraft propulsion systems.
National Aeronautics and Space Administration
www.nasa.gov
IVHM Data Mining Lab
National Aeronautics and Space Administration
www.nasa.gov
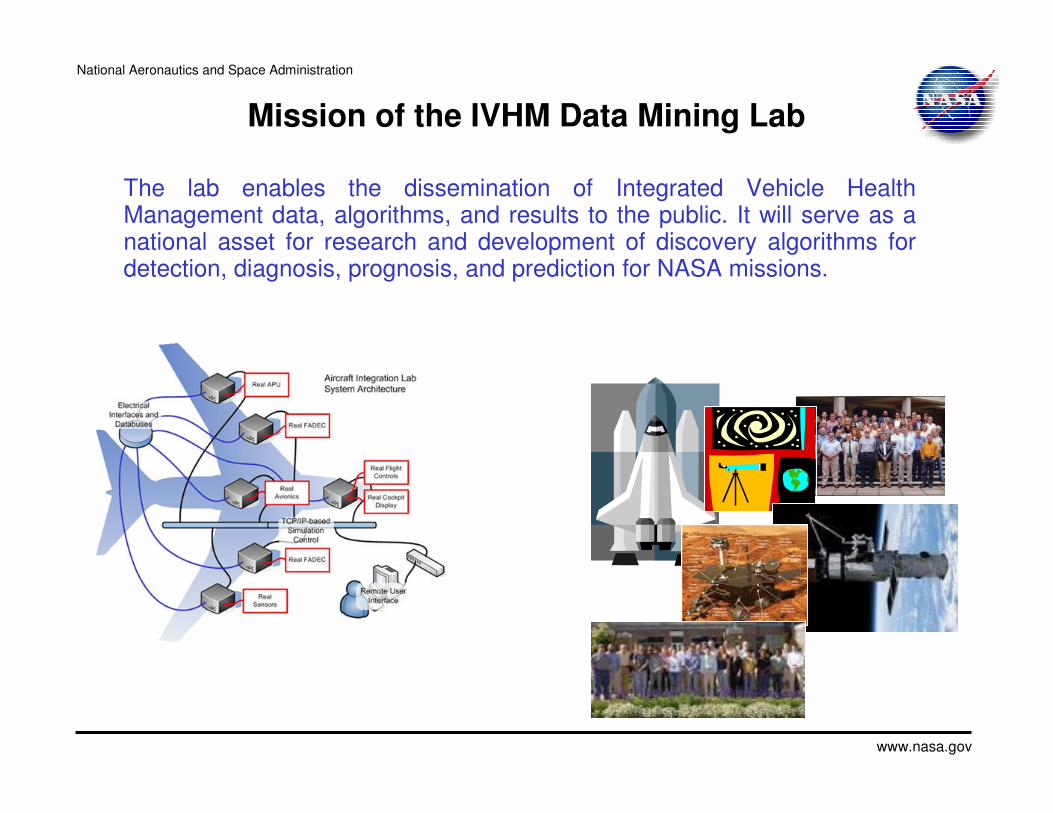
Mission of the IVHM Data Mining Lab
The lab enables the dissemination of Integrated Vehicle Health Management data, algorithms, and results to the public. It will serve as a national asset for research and development of discovery algorithms for detection, diagnosis, prognosis, and prediction for NASA missions.
National Aeronautics and Space Administration
www.nasa.gov
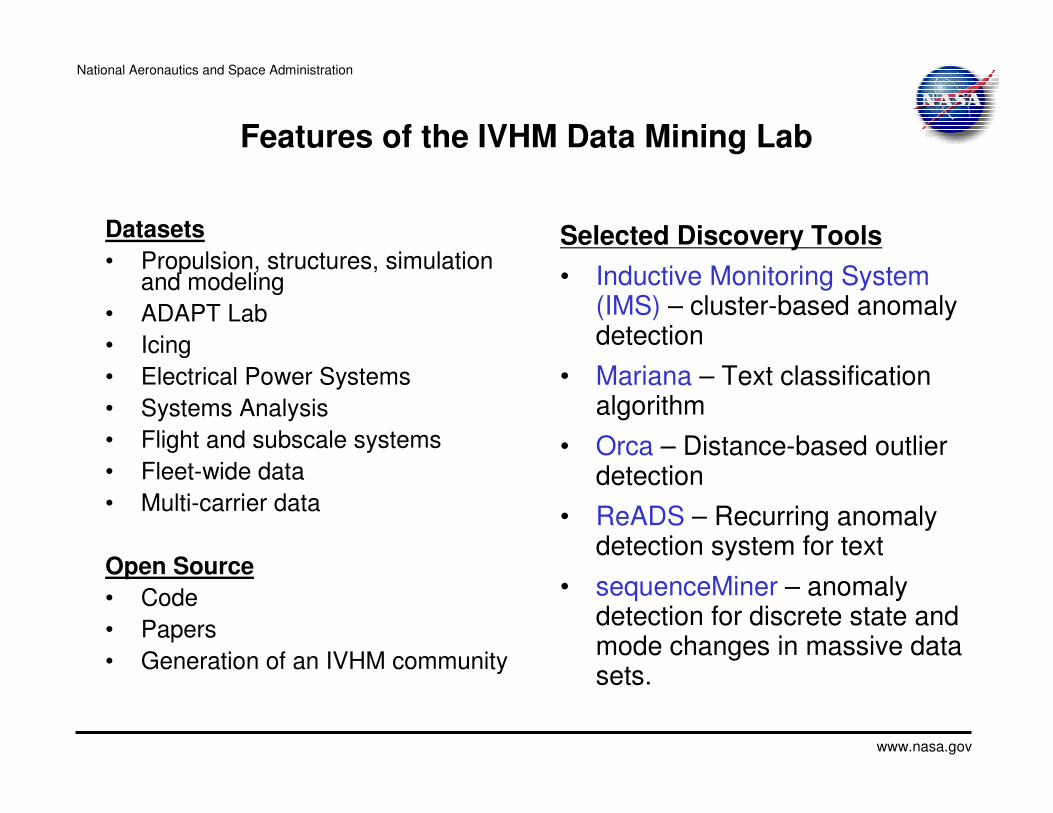
Features of the IVHM Data Mining Lab
Datasets
• Propulsion, structures, simulation and modeling
• ADAPT Lab
• Icing
• Electrical Power Systems
• Systems Analysis
• Flight and subscale systems
• Fleet-wide data
• Multi-carrier data
Open Source
• Code
• Papers
• Generation of an IVHM community
Selected Discovery Tools
• Inductive Monitoring System (IMS) – cluster-based anomaly detection
• Mariana – Text classification algorithm
• Orca – Distance-based outlier detection
• ReADS – Recurring anomaly detection system for text
• sequenceMiner – anomaly detection for discrete state and mode changes in massive data sets.
National Aeronautics and Space Administration
www.nasa.gov
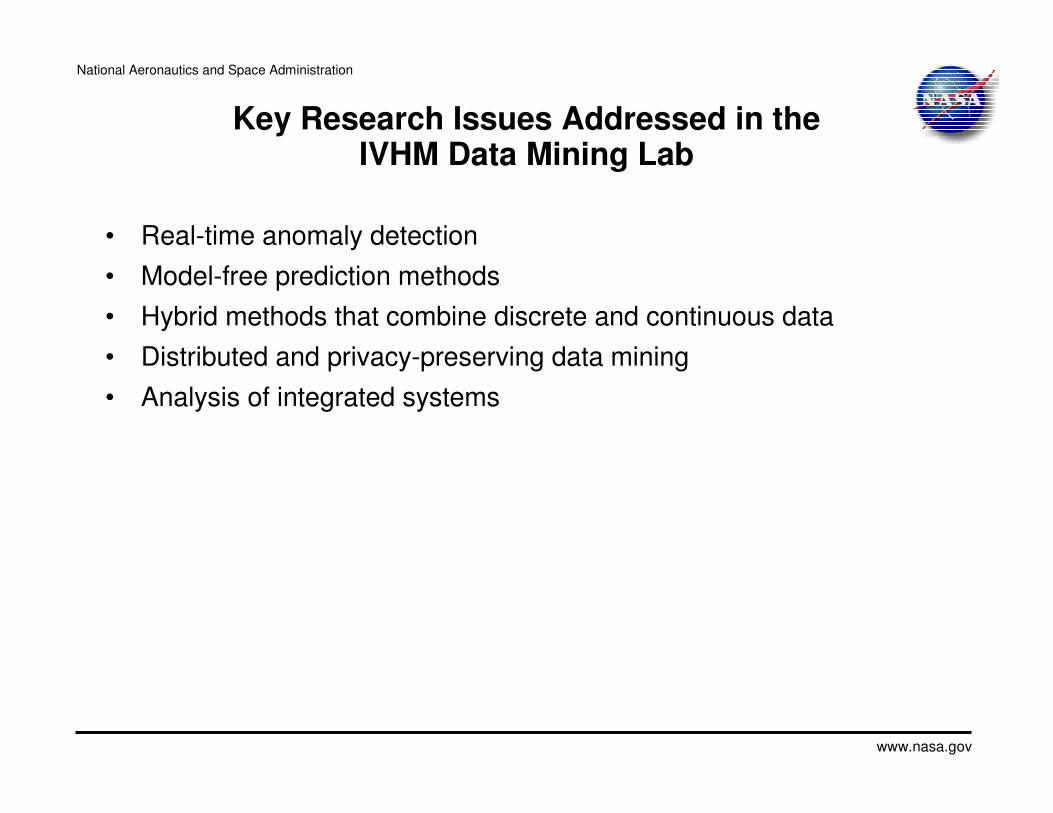
Key Research Issues Addressed in the IVHM Data Mining Lab
• Real-time anomaly detection
• Model-free prediction methods
• Hybrid methods that combine discrete and continuous data
• Distributed and privacy-preserving data mining
• Analysis of integrated systems

National Aeronautics and Space Administration
www.nasa.gov
Appendix
National Aeronautics and Space Administration
www.nasa.gov
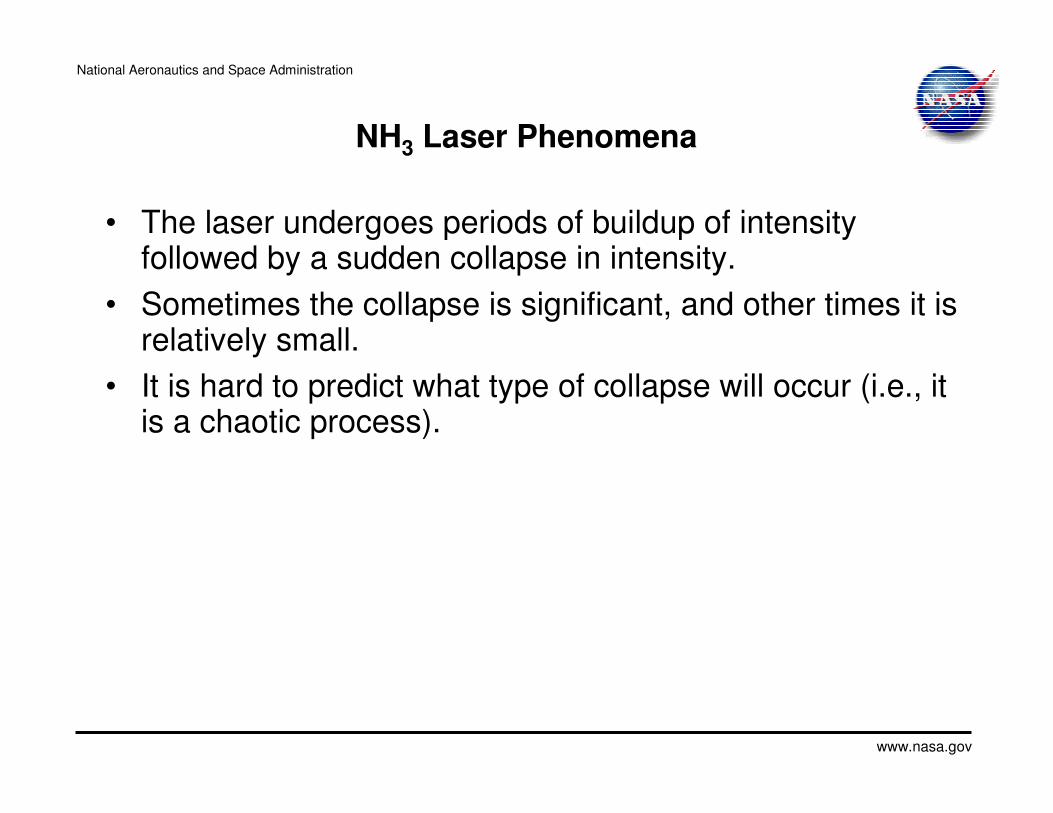
NH3 Laser Phenomena
• The laser undergoes periods of buildup of intensity followed by a sudden collapse in intensity.
• Sometimes the collapse is significant, and other times it is relatively small.
• It is hard to predict what type of collapse will occur (i.e., itis a chaotic process).
National Aeronautics and Space Administration
www.nasa.gov
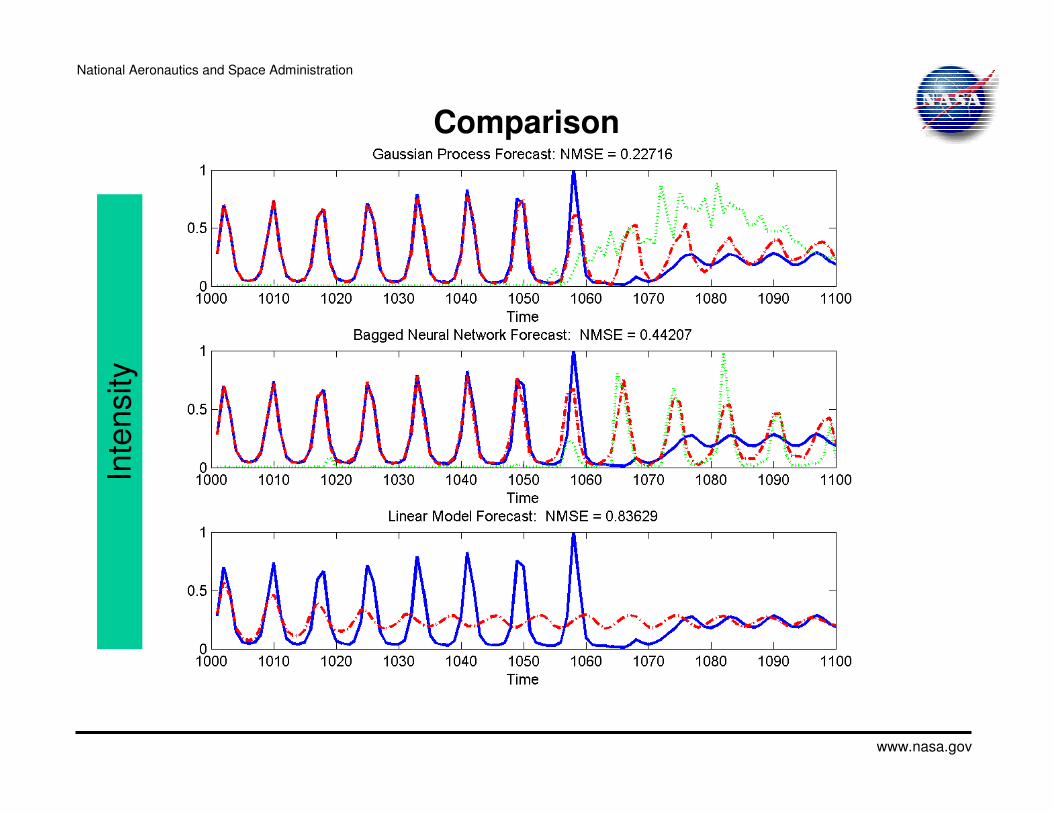
ComparisonIn
tensity

National Aeronautics and Space Administration
www.nasa.gov
Statistical Comparison of GP’s and Neural NetworksP
red
ictio
n E
rror
National Aeronautics and Space Administration
www.nasa.gov
0 50 100 150 200 250 300 350 400 4500
0.5
1
Sample points (time axis)
Inte
nsi
ty
Actual
Prediction
0 50 100 150 200 250 300 350 400 4500
0.5
1
Sample points (time axis)
Dig
ita
l si
gn
al
Prognosis signal
Collapse point
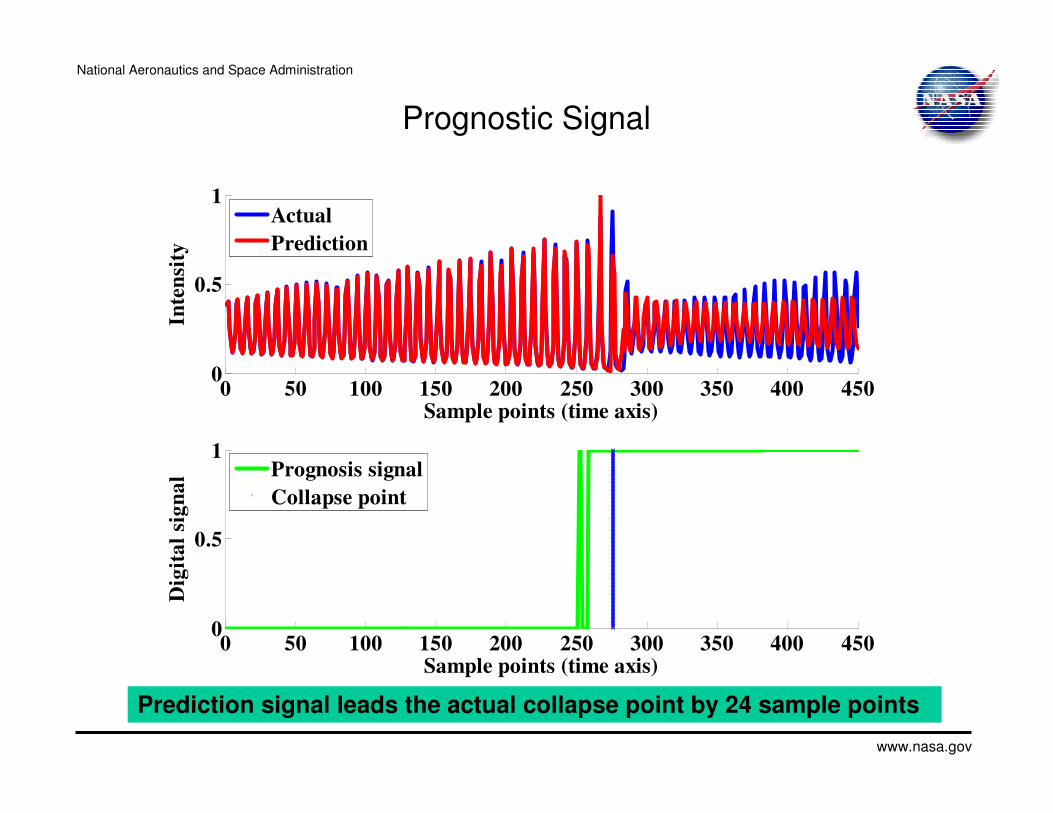
Prognostic Signal
Prediction signal leads the actual collapse point by 24 sample points
National Aeronautics and Space Administration
www.nasa.gov
K-step ahead forecasts
• We iterate the Gaussian Process K times to generate this time series.
• Performance comparison» Bagged Neural Networks
» Linear Model
• Forecasting metric: normalized mean squared error

National Aeronautics and Space Administration
www.nasa.gov
Using characteristic functions of random variables, we can formulate the
Gaussian property as follows:{Xt}t � T is Gaussian if and only if for every finite
set of indices t1, ..., tk there are positive reals σl j and reals µj such that
The numbers σl j and µj can be shown to be the covariances and means of the
variables in the process.
Method
• We address this problem using the theory of Gaussian Processes which assumes that any subset of data for a vector X is Gaussian distributed (from wikipedia).

National Aeronautics and Space Administration
www.nasa.gov
References
• A. S. Weigend and N. Gershenfeld, “Time Series Prediction: Forecasting the Future and Understanding the Past”, 1994
• Gaussian Process Regression, J.S. Taylor, 2002