Embed Size (px)
Citation preview

NREL is a national laboratory of the U.S. Department of Energy, Office of Energy Efficiency and Renewable Energy, operated by the Alliance for Sustainable Energy, LLC.
NREL/TP-6A20-62566
O C T O B E R 2 0 1 4A N A LY S I S I N S I G H T S
MAKING SUSTAINABLE ENERGY CHOICESInsights on the Energy/Water/Land Nexus

2 MAKING SUSTAINABLE ENERGY CHOICES
Energy heats and lights our homes, fuels our vehicles, and powers our businesses and factories. Affordable, reliable energy underpins the economy, security, and our quality of life. Meanwhile, growing global populations and economic development are increasing demand for energy around the world, and climate change is altering our way of thinking about energy options. The Department of Energy’s National Renewable Energy Laboratory helps policymakers and investors understand and evaluate energy choices within this complex web of connections, or nexus, between energy, water, and land. Economics, energy markets and policies, system performance, environmental regulations, carbon emissions, and social impacts are all important components of this nexus. NREL’s analysis, datasets, and advanced integrated modeling capabilities help illuminate the connections between energy, environment, economy, security, and quality of life.
A key contributor to the global energy dialogue, NREL enables informed decision-making at the local, regional, national, and international levels.
ENERGY CHOICES CAN BE FRAMED
WITHIN A ‘NEXUS’ OF ENVIRONMENTAL,
ECONOMIC, AND SECURITY PRIORITIES
O C T O B E R 2 0 1 4A N A LY S I S I N S I G H T S
Figure 1. Connecting the dots — NREL helps illuminate the web of connections between energy, environment, economy, security, and quality of life
DRIVING FACTORS
GROWING PRESSURES
Governance
ENERGYLANDfood/fiber
WATER
Environment TechnologySocial ImpactsEconomy
Biomass, Plant Siting
Greenhouse GasEmissions
Greenhouse GasEmissions
Irrigation
Fertilizer, Harvesting,Storing, Processing
Resource Extraction,Cooling Water, Transport
Pumping, Water Treatment, Water Distribution,
Desalinization
Growing PopulationIncreasing Demand for Energy, Clean Water, Food
Climate ChangeIncreasing Temperature, Floods,Draught Severity, Sea Level Rise, Land Loss

3MAKING SUSTAINABLE ENERGY CHOICES
Navajo Generating Station: Helping Stakeholders Understand Complex Implications of Energy Options
NREL’s analytical support helped the U.S. Environmental Protection Agency (EPA) establish a final best available retrofit technology (BART) rule for reducing NOx emissions from Arizona’s Navajo Generating Station, a 2,250 MW coal plant near Page, AZ. The initial effort, which began in 2012, focused on objectively assessing a broad range of interrelated technical, environmental, and economic issues related to potential options for power in the region—primarily replacing the coal-fired plant versus installing NOx reduction retrofits. Several factors make this case unusually complex. The Navajo Generating Station came into being at the initiative of the federal government, which retains the largest share of ownership. Low-cost energy from the
station powers a major water delivery project that helps sustain a multistate water agreement. In addition, the plant and the coal mine that supplies it are located on tribal lands and support tribal jobs and economies. NREL helped federal agencies unravel the complex interconnections and understand the implications for various courses of action in terms of power supply and prices, water supply and prices, air quality, and economic impacts. This work helped to attract diverse support for EPA’s final rule. A follow-on effort, which will examine strategies for transitioning the federal government’s share of the station to clean energy alternatives, is now underway.
Electric Sector Factors Emissions, Land, Water into Energy Choices
Lowering carbon emissions is one of many drivers for deploying renewable energy technologies. However, more robust energy decisions also factor in water and land use. Life cycle assessment (LCA) provides a well-established and comprehensive framework to compare the impacts of energy technologies. Using LCA methodologies, including techniques the laboratory has developed, analysts can examine emissions, water, and land impacts of energy on a “cradle-to-grave” basis—from raw material extraction, manufacturing, transport, and construction to operation and end-of-life disposal.
On a life cycle basis, renewable technologies, nuclear generators, and coal generators with clean coal technologies produce fewer carbon emissions than traditional fossil fuel combustion technologies. However, water used in power plant operations varies widely based on the electricity generation technology and cooling system. Life cycle comparison of water consumption illustrates the potential for renewable electricity generation technologies to reduce the water intensity of the U.S. energy sector (Figure 2). Solar photovoltaic and wind technologies have the lowest total life cycle water use. But as can be seen, the technologies with the lowest carbon emissions don’t always have the lowest water consumption.
Calculating land use impacts is more challenging, and results vary widely—particularly for wind and geothermal systems—depending on assumptions used. NREL’s preliminary work in this area indicates that land use for renewables makes up a small fraction of total U.S. land area. In addition, recent studies have identified workable strategies for minimizing land use for large-scale renewable deployment, including co-location of PV and wind on farms and ranches, and deployment on underutilized or degraded land sites (such as highway medians or landfills).

4 MAKING SUSTAINABLE ENERGY CHOICES
O C T O B E R 2 0 1 4A N A LY S I S I N S I G H T S
Future Impacts of Today’s Energy Choices in a Changing Climate
Water Use in Low-Carbon Futures
NREL has completed a series of studies to better understand the impact of different low-carbon electricity generation pathways on future power sector water use. Figure 3 compares the water consumption impacts of a “business- as-usual” baseline scenario to three alternative scenarios based on use of different generating technologies to comply with assumed carbon constraints. The different scenarios lead to significantly different water profiles due to the wide variation in water use between thermochemical power plants and low- or no-water technologies such as wind and energy efficiency measures.
Overall, investing in renewable energy and energy efficiency to meet carbon emission reduction targets is projected to result in significant water savings, lower energy costs, and net savings to consumers. Investing in new nuclear and coal with CCS facilities is projected to result in the highest long-term water consumption and highest electricity costs. Shifting from once-through cooled thermal generation to recirculating cooling technologies by 2050 reduces water withdrawals in all scenarios considered.
Figure 2. Life cycle emissions, water use, and land use comparisons for electricity generation technologies.1 The low and high estimates reflect a range in published analyses. 1. Lifecycle GHG emissions: IPCC Special Report on Renewables (and NREL website) http://srren.ipcc-wg3.de/report/IPCC_SRREN_Ch09.pdf
Lifecycle Water: http://iopscience.iop.org/1748-9326/8/1/015031/pdf/1748-9326_8_1_015031.pdf Lifecycle Land: http://www.iea.org/publications/freepublications/publication/Renew_Policies.pdf
PV
CSP
Geothermal
Wind
Nuclear
Natural Gas
Coal
GHG Emissions(million gCO2e/GWh)
Water Consumption(thousand gal/GWh)
Land Use(M2/GWh)
0 200 400 600 800 1,000 1,200 200 400 600 800 1,000 500 1,000 1,500 2,000 2,500 3,0000 01,200
Upstream Operations Total (no data by LC stage available)DownstreamOperations-HighUpstream-High

5MAKING SUSTAINABLE ENERGY CHOICES
Will Climate Change Alter the Water Supply Available for Electricity Generation? It Depends on Where You Live.
Electricity generation can be water intensive, and climate change could lead to changes in precipitation or increases in surface water temperatures that limit the amount of water that is available and suitable for electricity generation. To support long-term, “what if” decision-making, NREL developed and demonstrated an integrated modeling approach to investigate the trade-offs among climate, water, and electricity systems [see text box]. Analysts found that, at both national and regional levels, average climate
change projections have little impact on capacity growth and water withdrawal and consumption in 2050. In general, abundant unappropriated surface water rights overshadow the comparably small changes in surface water resources. Potential climate impacts were notable only for select southwestern states (Arizona, California, Nevada, New Mexico, and Texas), which tend to be more arid and where water supplies tend to be more strictly allocated. NREL can use the methodology developed for this study to investigate more extreme climate scenarios and a more rigorous representation of legal and physical water availability.
Figure 3. Future electricity choices can place different demands on regional water supplies (forecast for 2050). In general, relying primarily on nuclear and coal with CCS to meet assumed carbon constraints increases water consumption and withdrawals. Carbon constraints alone and carbon constraints with high renewable and energy efficiency show more consistent reductions in water use.
Jordan Macknick, Sandra Sattler, Kristen Averyt, Steve Clemmer, John Rogers. (2012). “The water implications of generating electricity: water use across the United States based on different electricity pathways through 2050.” Environmental Research Letters (7:4). NREL/ JA-6A20-56211.
Business-as-usual Water Consumption for Electricity Producers (billions of gallons)
Scenarios - Change from Business-as-usual in Consumption (%)
0-39 40-79 80-119 120-159 160-199 200-239 240-279 280-319 320-359 360-400
-100 to -81 -80 to -61 -60 to -41 -40 to -21 -20-0 0-75 76-150 151-225 226-300 301-400
CARBON CONSTRAINTS ONLY CARBON CONSTRAINTS +NUCLEAR AND COAL WITH CCS
CARBON CONSTRAINTS +HIGH RENEWABLES AND EFFICIENCY
6 MAKING SUSTAINABLE ENERGY CHOICES
O C T O B E R 2 0 1 4A N A LY S I S I N S I G H T S
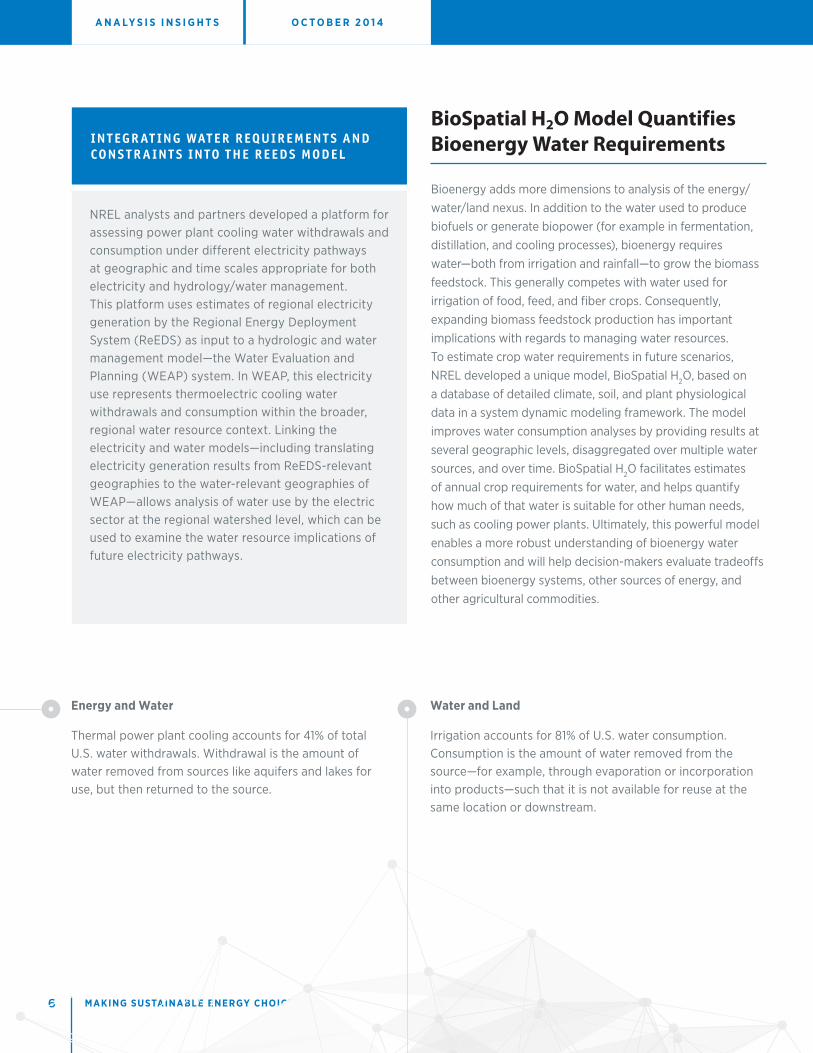
BioSpatial H2O Model Quantifies Bioenergy Water Requirements
Bioenergy adds more dimensions to analysis of the energy/water/land nexus. In addition to the water used to produce biofuels or generate biopower (for example in fermentation, distillation, and cooling processes), bioenergy requires water—both from irrigation and rainfall—to grow the biomass feedstock. This generally competes with water used for irrigation of food, feed, and fiber crops. Consequently, expanding biomass feedstock production has important implications with regards to managing water resources. To estimate crop water requirements in future scenarios, NREL developed a unique model, BioSpatial H2O, based on a database of detailed climate, soil, and plant physiological data in a system dynamic modeling framework. The model improves water consumption analyses by providing results at several geographic levels, disaggregated over multiple water sources, and over time. BioSpatial H2O facilitates estimates of annual crop requirements for water, and helps quantify how much of that water is suitable for other human needs, such as cooling power plants. Ultimately, this powerful model enables a more robust understanding of bioenergy water consumption and will help decision-makers evaluate tradeoffs between bioenergy systems, other sources of energy, and other agricultural commodities.
I N T E G R AT I N G WAT E R R E Q U I R E M E N T S A N D C O N S T R A I N T S I N T O T H E R E E D S M O D E L
NREL analysts and partners developed a platform for assessing power plant cooling water withdrawals and consumption under different electricity pathways at geographic and time scales appropriate for both electricity and hydrology/water management. This platform uses estimates of regional electricity generation by the Regional Energy Deployment System (ReEDS) as input to a hydrologic and water management model—the Water Evaluation and Planning (WEAP) system. In WEAP, this electricity use represents thermoelectric cooling water withdrawals and consumption within the broader, regional water resource context. Linking the electricity and water models—including translating electricity generation results from ReEDS-relevant geographies to the water-relevant geographies of WEAP—allows analysis of water use by the electric sector at the regional watershed level, which can be used to examine the water resource implications of future electricity pathways.
Energy and Water
Thermal power plant cooling accounts for 41% of total U.S. water withdrawals. Withdrawal is the amount of water removed from sources like aquifers and lakes for use, but then returned to the source.
Water and Land
Irrigation accounts for 81% of U.S. water consumption. Consumption is the amount of water removed from the source—for example, through evaporation or incorporation into products—such that it is not available for reuse at the same location or downstream.
7MAKING SUSTAINABLE ENERGY CHOICES
Systems Approaches to Making Energy Decisions in Broader Contexts
Mathematical models like ReEDS and BioSpatial H2O enable analyses of a variety of energy futures. NREL is also engaged around the world using less data- and resource-intensive tools and approaches to enable energy decisions within broader contexts. Low emission development strategies (LEDS) lay out pathways for countries to achieve long-term national development goals, while also minimizing greenhouse gas (GHG) emissions historically associated with economic growth. LEDS are typically economy-wide approaches, encompassing all economic sectors, aligned with a country’s development priorities such as poverty alleviation, job creation, and energy security.
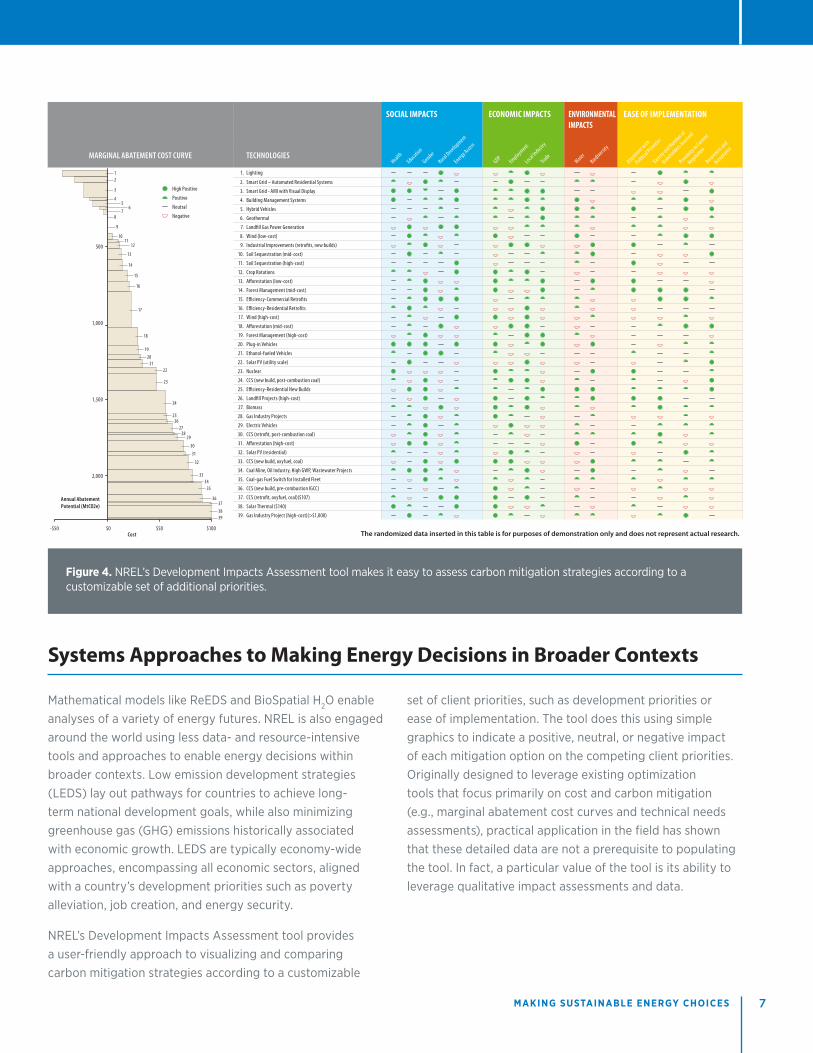
NREL’s Development Impacts Assessment tool provides a user-friendly approach to visualizing and comparing carbon mitigation strategies according to a customizable
set of client priorities, such as development priorities or ease of implementation. The tool does this using simple graphics to indicate a positive, neutral, or negative impact of each mitigation option on the competing client priorities. Originally designed to leverage existing optimization tools that focus primarily on cost and carbon mitigation (e.g., marginal abatement cost curves and technical needs assessments), practical application in the field has shown that these detailed data are not a prerequisite to populating the tool. In fact, a particular value of the tool is its ability to leverage qualitative impact assessments and data.
Figure 4. NREL’s Development Impacts Assessment tool makes it easy to assess carbon mitigation strategies according to a customizable set of additional priorities.
$100$50$0-$50
500
High Positive
Positive
Neutral
Negative
1,000
1,500
2,000
Annual Abatement Potential (MtCO2e)
Cost
3938
3736
35
33
32
31
30
2928
2726
25
24
23
2221
20
19
18
17
16
15
14
13
1211
10
9
87
65
4
3
21
34
MARGINAL ABATEMENT COST CURVE TECHNOLOGIES
1. Lighting
2. Smart Grid – Automated Residential Systems
3. Smart Grid - AMI with Visual Display
4. Building Management Systems
5. Hybrid Vehicles
6. Geothermal
7. Landfill Gas Power Generation
8. Wind (low-cost)
9. Industrial Improvements (retrofits, new builds)
10. Soil Sequestration (mid-cost)
11. Soil Sequestration (high-cost)
12. Crop Rotations
13. Afforestation (low-cost)
14. Forest Management (mid-cost)
15. Efficiency-Commercial Retrofits
16. Efficiency-Residential Retrofits
17. Wind (high-cost)
18. Afforestation (mid-cost)
19. Forest Management (high-cost)
20. Plug-in Vehicles
21. Ethanol-fueled Vehicles
22. Solar PV (utility scale)
23. Nuclear
24. CCS (new build, post-combustion coal)
25. Efficiency-Residential New Builds
26. Landfill Projects (high-cost)
27. Biomass
28. Gas Industry Projects
29. Electric Vehicles
30. CCS (retrofit, post-combustion coal)
31. Afforestation (high-cost)
32. Solar PV (residential)
33. CCS (new build, oxyfuel, coal)
34. Coal Mine, Oil Industry, High GWP, Wastewater Projects
35. Coal-gas Fuel Switch for Installed Fleet
36. CCS (new build, pre-combustion IGCC)
37. CCS (retrofit, oxyfuel, coal)($107)
38. Solar Thermal ($140)
39. Gas Industry Project (high-cost)(>$1,000)
The randomized data inserted in this table is for purposes of demonstration only and does not represent actual research.
SOCIAL IMPACTS ECONOMIC IMPACTS ENVIRONMENTALIMPACTS
EASE OF IMPLEMENTATION
HealthAlig
nment with
Politi
cal Prioriti
es
GDPWater
Education
Variety and Number o
f
Stakeholders I
nvolved
Employment
Biodiversity
Gender
Proximity
to Curre
nt
Regulatio
n
Local Industr
y
Rural Development
Awareness and
Acce
ptance
TradeEnergy Acce
ss

2 0 1 4 F I R S T Q U A R T E RA N A LY S I S I N S I G H T S O C T O B E R 2 0 1 4A N A LY S I S I N S I G H T S
National Renewable Energy Laboratory15013 Denver West Parkway, Golden, CO 80401
303-275-3000 • www.nrel.gov
NREL is a national laboratory of the U.S. Department of Energy, Office of Energy Efficiency and Renewable Energy, operated by the Alliance for Sustainable Energy, LLC
Front page photo by iStock_000006927873 • NREL/TP-6A20-62566 • October 2014
NREL prints on paper that contains recycled content.
Helping Policymakers and Investors Evaluate Energy Choices in Framework of Sustainability
Renewable energy technologies have the potential to reduce the environmental impacts of the energy sector. NREL is engaging stakeholders, developing tools, and conducting robust analysis to help today’s energy leaders understand the trade-offs of energy choices in the context of broader social, economic and environmental priorities and increasing pressures of a changing climate.
Learn More about the Energy/Water/Land Nexus
Doug Arent, Jacquelyn Pless, Trieu Mai, Ryan Wiser, Maureen Hand, Sam Baldwin, Garvin Heath, Jordan Macknick, Morgan Bazilian, Adam Schlosser, Paul Denholm. (2014) “Implications of high renewable electricity penetration in the U.S. for water use, greenhouse gas emissions, land-use, and materials supply.” Applied Energy (123). NREL/ JA-6A20-59175.
Kristen Averyt, Jordan Macknick, John Rogers, Nadia Madden, Jeremy Fisher, James Meldrum, Robin Newmark. (2013). “Water Use for Electricity in the United States: An Analysis of Reported and Calculated Water Use Information for 2008.” Environmental Research Letters (8:1). NREL/JA-6A20-56405.
Stuart Cohen, Jordan Macknick, Kristen Averyt, James Meldrum. (2014). Modeling Climate-Water Impacts on Electricity Sector Capacity Expansion: Preprint. NREL/CP-6A20-61435
Shannon Cowlin, Jaquelin Cochran, Sadie Cox, and Carolyn Davidson, Wytze van der Gaast . (2012). Broadening the Appeal of Marginal Abatement Cost Curves: Capturing Both Carbon Mitigation and Development Benefits of Clean Energy Technologies. NREL/CP-6A20-54487.
David J. Hurlbut, Scott Haase, Gregory Brinkman, Kip Funk, Rachel Gelman, Eric Lantz, Christina Larney, David Peterson, Christopher Worley, Ed Liebsch. (2012). Navajo Generating Station and Air Visibility Regulations: Alternatives and Impacts. NREL/TP-6A20-53024.
Jordan Macknick, Courtney Lee, Gail Mosey, Jenny Melius. (2013). Solar Development on Contaminated and Disturbed Lands. NREL/TP-6A20-58485.
Jordan Macknick, Brenda Beatty, Graham Hill. (2013). Overview of Opportunities for Co-Location of Solar Energy Technologies and Vegetation. NREL/TP-6A20-60240.
Anelia Milbrandt, Donna Heimiller, Andrew Perry, Christopher Field. (2014). “Renewable energy potential on marginal lands in the United States.” Renewable and Sustainable Energy Reviews (29:1).
Sean Ong, Clinton Campbell, Paul Denholm, Robert Margolis, Garvin Heath. (2013). Land-Use Requirements for Solar Power Plants in the United States. NREL/TP-6A20-56290.
John Rogers, Kristen Averyt, Steve Clemmer, Michelle Davis, Francisco Flores-Lopez, Doug Kenney, Jordan Macknick, Nadia Madden, James Meldrum, Sandra Sattler, Erika Spanger-Siegfried, David Yates. (2013). Water-Smart Power: Strengthening the U.S. Electricity System in a Warming World. Cambridge, MA: Union of Concerned Scientists. Accessed September 2014: http://www.ucsusa.org/clean_energy/our-energy-choices/energy-and-water-use/water-smart-power.html.
Mark Ruth, Trieu Mai, Emily Newes, Andy Aden, Ethan Warner, Caroline Uriarte, Daniel Inman, Travis Simpkins, Andrew Argo. (2013). Transportation Energy Futures Series: Projected Biomass Utilization for Fuels and Power in a Mature Market. NREL/TP-6A20-53336; DOE/GO-102013-3707.
Sandra Sattler, Jordan Macknick, David Yates, Francisco Flores-Lopez, Anthony Lopez, John Rogers. (2012). “Linking electricity and water models to assess electricity choices at water-relevant scales.” Environmental Research Letters (7:4). NREL/JA-6A20-56242.
U.S. Energy Sector Vulnerabilities to Climate Change and Extreme Weather. (2013). DOE/PI-0013. Washington, D.C.: U.S. Department of Energy. Accessed September 2014: http://energy.gov/downloads/us-energy-sector-vulnerabilities-climate-change-and-extreme-weather
Ethan Warner, Yimin Zhang, Daniel Inman, Garvin Heath. (2014). “Challenges in the Estimation of Greenhouse Gas Emissions from Biofuel-Induced Global Land-Use Change.” Biofuels, Bioproducts and Biorefining (8:1). NREL/JA-5100-61691.
LEGEND:
Energy Water Social Land Climate