Embed Size (px)
Citation preview
2015MALAYSIA ENERGY STATISTICS
HANDBOOK

2015MALAYSIA ENERGY STATISTICS
HANDBOOK
© All rights reserved. Reproduction of all or any part of this publication via electronic, mechanical, recording or other
medium is strictly prohibited without consent from the Energy Commission.
Published by:
SURUHANJAYA TENAGA (ENERGY COMMISSION)
No. 12, Jalan Tun Hussein, Presint 2, 62100 Putrajaya, Malaysia
Tel: (03) 8870 8500
Fax: (03) 8888 8637
Toll Free Number: 1-800-2222-78 (ST)
Email: [email protected]
www.st.gov.my
ISSN No.: 2289-6953
ST(P)09/10/2015
PRINTED IN MALAYSIA
Malaysia Energy Statistics Handbook 2015 3
This handbook which is published for the second time consists of selected data from the National Energy Balance
2013, Statistical Information and Performance of Electricity Supply Industry 2014 and Piped Gas Distribution Industry
Statistics 2014.
The handbook covers 10 sections as follows:
1. Energy Resources
2. Key Economic and Energy Data
3. Primary Energy Supply
4. Energy Transformation
5. Final Energy Consumption
6. Energy Balances
7. Energy Indicators
8. Energy Prices
9. Electricity Supply Performance
10. Piped Gas Supply Performance
The Supply part describes Total Primary Energy Supply by type of fuels, net imports and exports while the
Transformation part shows Conversions in Gas Plants, in Refineries and in Power Stations. The Consumption part
indicates both Final Energy Consumption of commercial energy by Sectors and by Type of Fuels. The Energy Balances
part includes Malaysia’s annual and quaterly energy balance tables for the year 2013. The Energy Indicators part
contains several indicators based on Population and Gross Domestic Products (GDP).
The purpose of this publication is to provide users with a handy and convenient reference.
Inquiries about figures and graphs in this publication could be addressed to:
Malaysia Energy Information Hub UnitEnergy Management Development and Service Quality Department
Suruhanjaya Tenaga (Energy Commission)
No. 12, Jalan Tun Hussein, Precinct 2
62100 Putrajaya, Malaysia
www.st.gov.my
www.meih.st.gov.my
Tel: +603-8870 8500
Fax: +603-8888 8648
PREFACE
4 Malaysia Energy Statistics Handbook 2015
TABLE OF CONTENTS
ENERGY RESOURCES• Reserves of Crude Oil and Condensates• Reserves of Natural Gas• Reserves of Coal as of 31st December 2013• Installed Capacity as of 31st December 2013 in MW• Available Capacity as of 31st December 2013
6789
10
KEY ECONOMIC AND ENERGY DATA• Key Economic and Energy Data• Key Economic and Energy Data by Region
1112
ENERGY SUPPLY• Primary Production by Fuel Type• Import and Export of Crude Oil• Import and Export of Petroleum Products• Import and Export Natural Gas and LNG• Import and Export of Coal and Coke• Total Primary Energy Supply by Fuel Type
161820222426
ENERGY TRANSFORMATION• Fuel Input to Power Stations by Fuel Type• Electricity Generation by Plant Type• Electricity Generation Mix• Input of Crude Oil in Refineries• Production of Petroleum Products from Refineries• Conversion in Gas Plants
283032343638
ENERGY CONSUMPTION • Final Energy Consumption by Fuel Type• Final Energy Consumption for Petroleum Products• Final Energy Consumption by Sectors
404244
ENERGY BALANCES• Commercial Energy Balance for Malaysia in 2013 ( Thousand Tonnes of Oil Equivalent)• Commercial Energy Balance for Malaysia in Quarter 1 2013 ( Thousand Tonnes of Oil Equivalent) • Commercial Energy Balance for Malaysia in Quarter 2 2013 ( Thousand Tonnes of Oil Equivalent)• Commercial Energy Balance for Malaysia in Quarter 3 2013 ( Thousand Tonnes of Oil Equivalent)• Commercial Energy Balance for Malaysia in Quarter 4 2013 ( Thousand Tonnes of Oil Equivalent)• Energy Balance Flow Chart 2013
46
48
50
52
5456
Malaysia Energy Statistics Handbook 2015 5
ENERGY INDICATORS• Average Annual Growth Rates (%)• Per Capita • Energy Intensity• Energy Elasticity• Final Energy Consumption per Capita in ASEAN• Final Energy Intensity in ASEAN
5758 59 60 61 61
ENERGY PRICES• Ex-Singapore Prices of Major Petroleum Products• Annual Liquefied Petroleum Gas (LPG) Contract Prices-Arab Gulf• Average Annual Natural Gas Price in Malaysia • Official Selling Prices of Malaysian Crude Oil• Average Selling Prices of TNB, SESB, SESCO and Other Utilities
6263646567
ELECTRICITY SUPPLY PERFORMANCE• Number of Consumers for TNB, SESB and SEB from 2009 until 2014• Transmission System Capacity of TNB, SESB and SEB from 2011 until 2014• Distribution System Capacity of TNB, SESB and SEB from 2011 until 2014• Performance Highlights of TNB, SESB and SEB from 2011 until 2014• Revenue, Asset Size, Employment and Annual Investment for TNB and SESB from 2010 until 2014• Number of Supply Interruptions of TNB, SESB and SEB from 2010 until 2014• Number of Electricity Supply Interruptions in Peninsular Malaysia• SAIDI (Minutes/Customer/Year) by State in Peninsular Malaysia• SAIFI (Number of Interruptions/Customer/Year) by State in Peninsular Malaysia• CAIDI (Minutes/Interrupted Consumer/Year) by State in Peninsular Malaysia • Electricity Supply Interruptions per 1,000 Consumers in Sabah• Electricity Supply Interruptions per 1,000 Consumers in Sarawak
73747576
777778 78 79798080
PIPED GAS SUPPLY PERFORMANCE• Number of Natural Gas Consumer by Sector for GMB and SEC from 2008 -2014• Natural Gas Consumption by Sector of GMB and SEC from 2008 -2014 in mmBTU• Natural Gas Pipe Length (km) • Performance Highlights of GMB and SEC from 2011 until 2014• Number of Supply Interruptions for Peninsular Malaysia and Sabah from 2008 until 2014• Gas Supply Interruptions per 1,000 Consumers• SAIDI, SAIFI, CAIDI• Industrial Sales Volume by Industry Grouping from 2008 until 2014 (mmBTU)
81 81 82 82 82 83 83 84
NOTES OF ENERGY BALANCECONVERSION COEFFICIENTS AND EQUIVALENCEDEFINITION
858889
• E
NE
RG
Y R
ESO
UR
CE
S
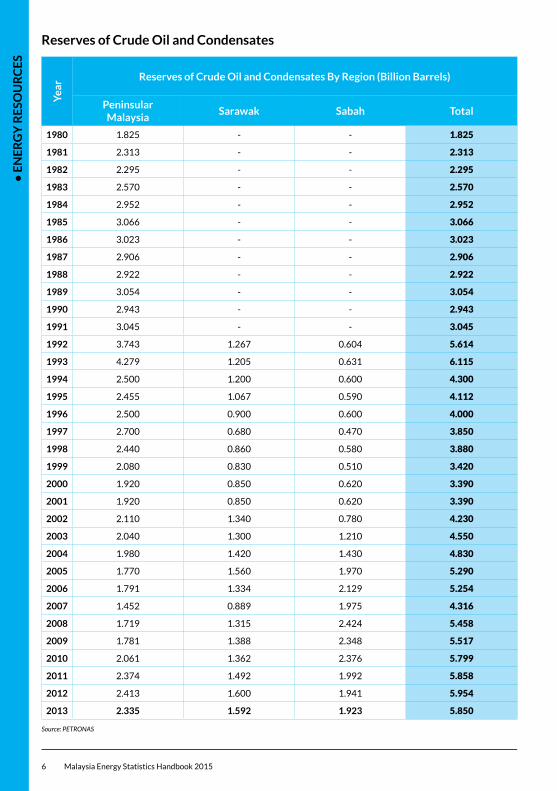
6 Malaysia Energy Statistics Handbook 2015
Yea
r Reserves of Crude Oil and Condensates By Region (Billion Barrels)
Peninsular Malaysia
Sarawak Sabah Total
1980 1.825 - - 1.825
1981 2.313 - - 2.313
1982 2.295 - - 2.295
1983 2.570 - - 2.570
1984 2.952 - - 2.952
1985 3.066 - - 3.066
1986 3.023 - - 3.023
1987 2.906 - - 2.906
1988 2.922 - - 2.922
1989 3.054 - - 3.054
1990 2.943 - - 2.943
1991 3.045 - - 3.045
1992 3.743 1.267 0.604 5.614
1993 4.279 1.205 0.631 6.115
1994 2.500 1.200 0.600 4.300
1995 2.455 1.067 0.590 4.112
1996 2.500 0.900 0.600 4.000
1997 2.700 0.680 0.470 3.850
1998 2.440 0.860 0.580 3.880
1999 2.080 0.830 0.510 3.420
2000 1.920 0.850 0.620 3.390
2001 1.920 0.850 0.620 3.390
2002 2.110 1.340 0.780 4.230
2003 2.040 1.300 1.210 4.550
2004 1.980 1.420 1.430 4.830
2005 1.770 1.560 1.970 5.290
2006 1.791 1.334 2.129 5.254
2007 1.452 0.889 1.975 4.316
2008 1.719 1.315 2.424 5.458
2009 1.781 1.388 2.348 5.517
2010 2.061 1.362 2.376 5.799
2011 2.374 1.492 1.992 5.858
2012 2.413 1.600 1.941 5.954
2013 2.335 1.592 1.923 5.850 Source: PETRONAS
Reserves of Crude Oil and Condensates
• E
NE
RG
Y R
ESO
UR
CE
S
Malaysia Energy Statistics Handbook 2015 7
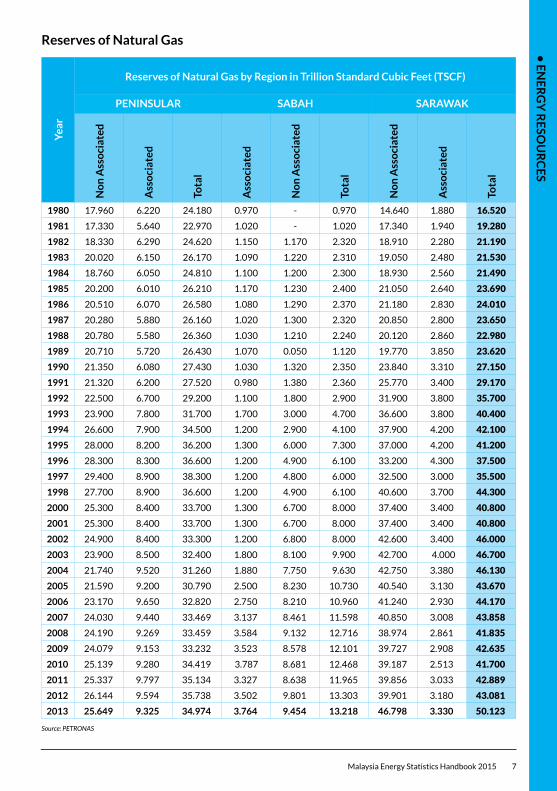
Yea
r
Reserves of Natural Gas by Region in Trillion Standard Cubic Feet (TSCF)
PENINSULAR SABAH SARAWAKN
on
Ass
oci
ated
Ass
oci
ated
Tota
l
Ass
oci
ated
No
n A
sso
ciat
ed
Tota
l
No
n A
sso
ciat
ed
Ass
oci
ated
Tota
l
1980 17.960 6.220 24.180 0.970 - 0.970 14.640 1.880 16.520
1981 17.330 5.640 22.970 1.020 - 1.020 17.340 1.940 19.280
1982 18.330 6.290 24.620 1.150 1.170 2.320 18.910 2.280 21.190
1983 20.020 6.150 26.170 1.090 1.220 2.310 19.050 2.480 21.530
1984 18.760 6.050 24.810 1.100 1.200 2.300 18.930 2.560 21.490
1985 20.200 6.010 26.210 1.170 1.230 2.400 21.050 2.640 23.690
1986 20.510 6.070 26.580 1.080 1.290 2.370 21.180 2.830 24.010
1987 20.280 5.880 26.160 1.020 1.300 2.320 20.850 2.800 23.650
1988 20.780 5.580 26.360 1.030 1.210 2.240 20.120 2.860 22.980
1989 20.710 5.720 26.430 1.070 0.050 1.120 19.770 3.850 23.620
1990 21.350 6.080 27.430 1.030 1.320 2.350 23.840 3.310 27.150
1991 21.320 6.200 27.520 0.980 1.380 2.360 25.770 3.400 29.170
1992 22.500 6.700 29.200 1.100 1.800 2.900 31.900 3.800 35.700
1993 23.900 7.800 31.700 1.700 3.000 4.700 36.600 3.800 40.400
1994 26.600 7.900 34.500 1.200 2.900 4.100 37.900 4.200 42.100
1995 28.000 8.200 36.200 1.300 6.000 7.300 37.000 4.200 41.200
1996 28.300 8.300 36.600 1.200 4.900 6.100 33.200 4.300 37.500
1997 29.400 8.900 38.300 1.200 4.800 6.000 32.500 3.000 35.500
1998 27.700 8.900 36.600 1.200 4.900 6.100 40.600 3.700 44.300
2000 25.300 8.400 33.700 1.300 6.700 8.000 37.400 3.400 40.800
2001 25.300 8.400 33.700 1.300 6.700 8.000 37.400 3.400 40.800
2002 24.900 8.400 33.300 1.200 6.800 8.000 42.600 3.400 46.000
2003 23.900 8.500 32.400 1.800 8.100 9.900 42.700 4.000 46.700
2004 21.740 9.520 31.260 1.880 7.750 9.630 42.750 3.380 46.130
2005 21.590 9.200 30.790 2.500 8.230 10.730 40.540 3.130 43.670
2006 23.170 9.650 32.820 2.750 8.210 10.960 41.240 2.930 44.170
2007 24.030 9.440 33.469 3.137 8.461 11.598 40.850 3.008 43.858
2008 24.190 9.269 33.459 3.584 9.132 12.716 38.974 2.861 41.835
2009 24.079 9.153 33.232 3.523 8.578 12.101 39.727 2.908 42.635
2010 25.139 9.280 34.419 3.787 8.681 12.468 39.187 2.513 41.700
2011 25.337 9.797 35.134 3.327 8.638 11.965 39.856 3.033 42.889
2012 26.144 9.594 35.738 3.502 9.801 13.303 39.901 3.180 43.081
2013 25.649 9.325 34.974 3.764 9.454 13.218 46.798 3.330 50.123 Source: PETRONAS
Reserves of Natural Gas
• E
NE
RG
Y R
ESO
UR
CE
S
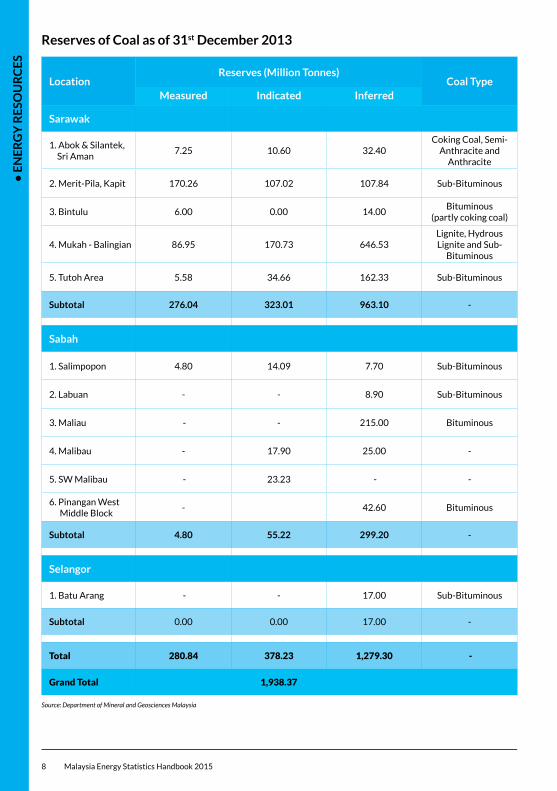
8 Malaysia Energy Statistics Handbook 2015
LocationReserves (Million Tonnes)
Coal TypeMeasured Indicated Inferred
Sarawak
1. Abok & Silantek, Sri Aman
7.25 10.60 32.40Coking Coal, Semi-
Anthracite and Anthracite
2. Merit-Pila, Kapit 170.26 107.02 107.84 Sub-Bituminous
3. Bintulu 6.00 0.00 14.00Bituminous
(partly coking coal)
4. Mukah - Balingian 86.95 170.73 646.53Lignite, Hydrous Lignite and Sub-
Bituminous
5. Tutoh Area 5.58 34.66 162.33 Sub-Bituminous
Subtotal 276.04 323.01 963.10 -
Sabah
1. Salimpopon 4.80 14.09 7.70 Sub-Bituminous
2. Labuan - - 8.90 Sub-Bituminous
3. Maliau - - 215.00 Bituminous
4. Malibau - 17.90 25.00 -
5. SW Malibau - 23.23 - -
6. Pinangan West Middle Block
- 42.60 Bituminous
Subtotal 4.80 55.22 299.20 -
Selangor
1. Batu Arang - - 17.00 Sub-Bituminous
Subtotal 0.00 0.00 17.00 -
Total 280.84 378.23 1,279.30 -
Grand Total 1,938.37
Source: Department of Mineral and Geosciences Malaysia
Reserves of Coal as of 31st December 2013
• E
NE
RG
Y R
ESO
UR
CE
S
Malaysia Energy Statistics Handbook 2015 9
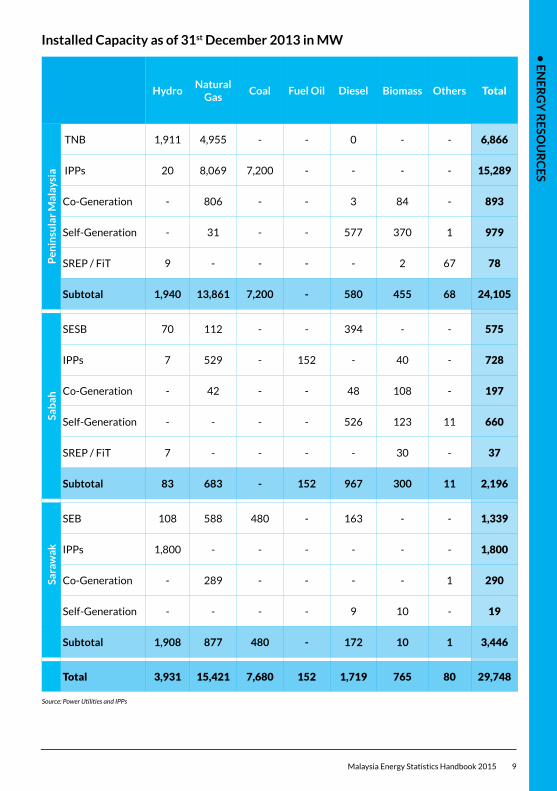
HydroNatural
GasCoal Fuel Oil Diesel Biomass Others Total
Pen
insu
lar
Mal
aysi
a
TNB 1,911 4,955 - - 0 - - 6,866
IPPs 20 8,069 7,200 - - - - 15,289
Co-Generation - 806 - - 3 84 - 893
Self-Generation - 31 - - 577 370 1 979
SREP / FiT 9 - - - - 2 67 78
Subtotal 1,940 13,861 7,200 - 580 455 68 24,105
Sab
ah
SESB 70 112 - - 394 - - 575
IPPs 7 529 - 152 - 40 - 728
Co-Generation - 42 - - 48 108 - 197
Self-Generation - - - - 526 123 11 660
SREP / FiT 7 - - - - 30 - 37
Subtotal 83 683 - 152 967 300 11 2,196
Sara
wak
SEB 108 588 480 - 163 - - 1,339
IPPs 1,800 - - - - - - 1,800
Co-Generation - 289 - - - - 1 290
Self-Generation - - - - 9 10 - 19
Subtotal 1,908 877 480 - 172 10 1 3,446
Total 3,931 15,421 7,680 152 1,719 765 80 29,748
Source: Power Utilities and IPPs
Installed Capacity as of 31st December 2013 in MW
• E
NE
RG
Y R
ESO
UR
CE
S
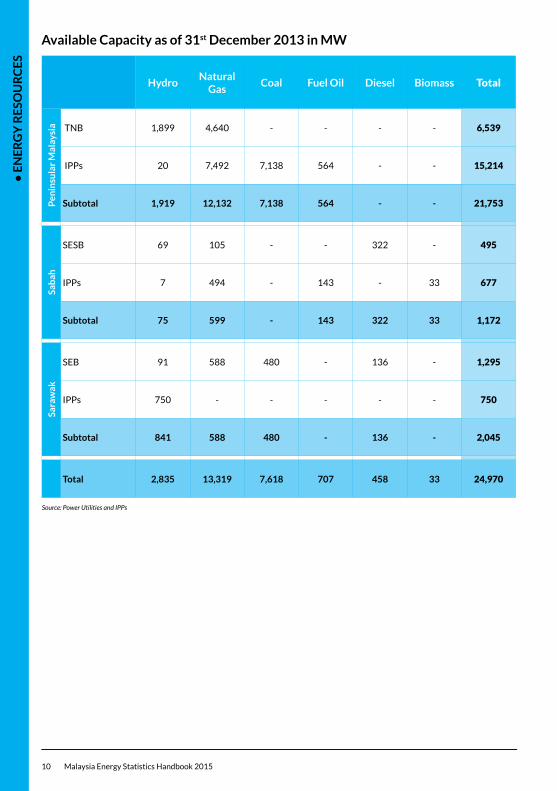
10 Malaysia Energy Statistics Handbook 2015
HydroNatural
GasCoal Fuel Oil Diesel Biomass Total
Pen
insu
lar
Mal
aysi
a TNB 1,899 4,640 - - - - 6,539
IPPs 20 7,492 7,138 564 - - 15,214
Subtotal 1,919 12,132 7,138 564 - - 21,753
Sab
ah
SESB 69 105 - - 322 - 495
IPPs 7 494 - 143 - 33 677
Subtotal 75 599 - 143 322 33 1,172
Sara
wak
SEB 91 588 480 - 136 - 1,295
IPPs 750 - - - - - 750
Subtotal 841 588 480 - 136 - 2,045
Total 2,835 13,319 7,618 707 458 33 24,970
Source: Power Utilities and IPPs
Available Capacity as of 31st December 2013 in MW
• K
EY
EC
ON
OM
IC A
ND
EN
ER
GY
DA
TA
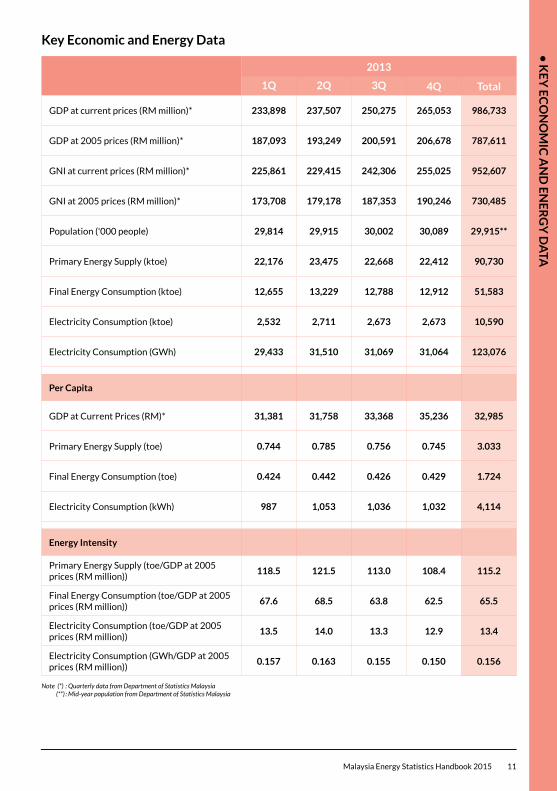
Malaysia Energy Statistics Handbook 2015 11
2013
1Q 2Q 3Q 4Q Total
GDP at current prices (RM million)* 233,898 237,507 250,275 265,053 986,733
GDP at 2005 prices (RM million)* 187,093 193,249 200,591 206,678 787,611
GNI at current prices (RM million)* 225,861 229,415 242,306 255,025 952,607
GNI at 2005 prices (RM million)* 173,708 179,178 187,353 190,246 730,485
Population ('000 people) 29,814 29,915 30,002 30,089 29,915**
Primary Energy Supply (ktoe) 22,176 23,475 22,668 22,412 90,730
Final Energy Consumption (ktoe) 12,655 13,229 12,788 12,912 51,583
Electricity Consumption (ktoe) 2,532 2,711 2,673 2,673 10,590
Electricity Consumption (GWh) 29,433 31,510 31,069 31,064 123,076
Per Capita
GDP at Current Prices (RM)* 31,381 31,758 33,368 35,236 32,985
Primary Energy Supply (toe) 0.744 0.785 0.756 0.745 3.033
Final Energy Consumption (toe) 0.424 0.442 0.426 0.429 1.724
Electricity Consumption (kWh) 987 1,053 1,036 1,032 4,114
Energy Intensity
Primary Energy Supply (toe/GDP at 2005 prices (RM million))
118.5 121.5 113.0 108.4 115.2
Final Energy Consumption (toe/GDP at 2005 prices (RM million))
67.6 68.5 63.8 62.5 65.5
Electricity Consumption (toe/GDP at 2005 prices (RM million))
13.5 14.0 13.3 12.9 13.4
Electricity Consumption (GWh/GDP at 2005 prices (RM million))
0.157 0.163 0.155 0.150 0.156
Note (*) : Quarterly data from Department of Statistics Malaysia (**) : Mid-year population from Department of Statistics Malaysia
Key Economic and Energy Data
• K
EY
EC
ON
OM
IC A
ND
EN
ER
GY
DA
TA
12 Malaysia Energy Statistics Handbook 2015
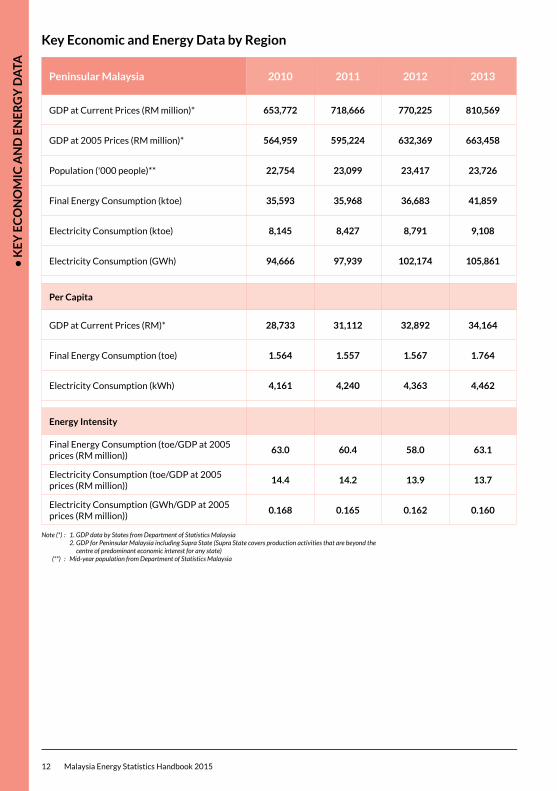
Peninsular Malaysia 2010 2011 2012 2013
GDP at Current Prices (RM million)* 653,772 718,666 770,225 810,569
GDP at 2005 Prices (RM million)* 564,959 595,224 632,369 663,458
Population ('000 people)** 22,754 23,099 23,417 23,726
Final Energy Consumption (ktoe) 35,593 35,968 36,683 41,859
Electricity Consumption (ktoe) 8,145 8,427 8,791 9,108
Electricity Consumption (GWh) 94,666 97,939 102,174 105,861
Per Capita
GDP at Current Prices (RM)* 28,733 31,112 32,892 34,164
Final Energy Consumption (toe) 1.564 1.557 1.567 1.764
Electricity Consumption (kWh) 4,161 4,240 4,363 4,462
Energy Intensity
Final Energy Consumption (toe/GDP at 2005 prices (RM million))
63.0 60.4 58.0 63.1
Electricity Consumption (toe/GDP at 2005 prices (RM million))
14.4 14.2 13.9 13.7
Electricity Consumption (GWh/GDP at 2005 prices (RM million))
0.168 0.165 0.162 0.160
Note (*) : 1. GDP data by States from Department of Statistics Malaysia 2. GDP for Peninsular Malaysia including Supra State (Supra State covers production activities that are beyond the centre of predominant economic interest for any state) (**) : Mid-year population from Department of Statistics Malaysia
Key Economic and Energy Data by Region
• K
EY
EC
ON
OM
IC A
ND
EN
ER
GY
DA
TA
Malaysia Energy Statistics Handbook 2015 13
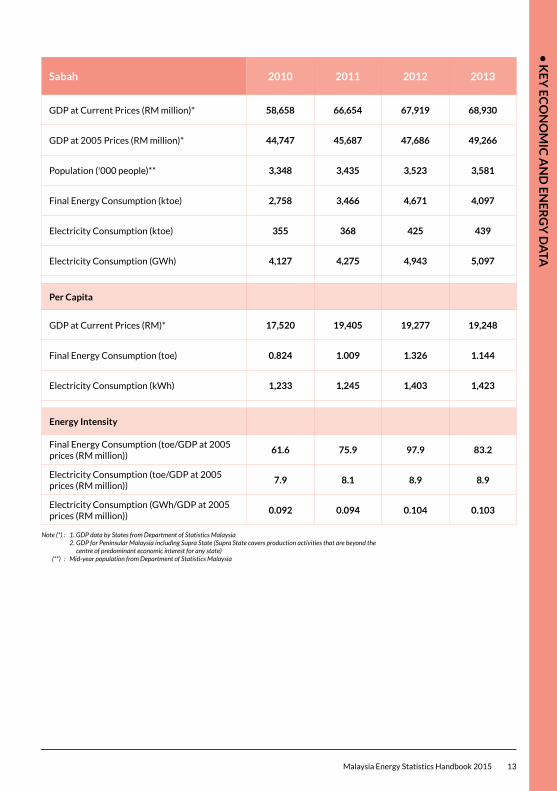
Sabah 2010 2011 2012 2013
GDP at Current Prices (RM million)* 58,658 66,654 67,919 68,930
GDP at 2005 Prices (RM million)* 44,747 45,687 47,686 49,266
Population ('000 people)** 3,348 3,435 3,523 3,581
Final Energy Consumption (ktoe) 2,758 3,466 4,671 4,097
Electricity Consumption (ktoe) 355 368 425 439
Electricity Consumption (GWh) 4,127 4,275 4,943 5,097
Per Capita
GDP at Current Prices (RM)* 17,520 19,405 19,277 19,248
Final Energy Consumption (toe) 0.824 1.009 1.326 1.144
Electricity Consumption (kWh) 1,233 1,245 1,403 1,423
Energy Intensity
Final Energy Consumption (toe/GDP at 2005 prices (RM million))
61.6 75.9 97.9 83.2
Electricity Consumption (toe/GDP at 2005 prices (RM million))
7.9 8.1 8.9 8.9
Electricity Consumption (GWh/GDP at 2005 prices (RM million))
0.092 0.094 0.104 0.103
Note (*) : 1. GDP data by States from Department of Statistics Malaysia 2. GDP for Peninsular Malaysia including Supra State (Supra State covers production activities that are beyond the centre of predominant economic interest for any state) (**) : Mid-year population from Department of Statistics Malaysia
• K
EY
EC
ON
OM
IC A
ND
EN
ER
GY
DA
TA
14 Malaysia Energy Statistics Handbook 2015
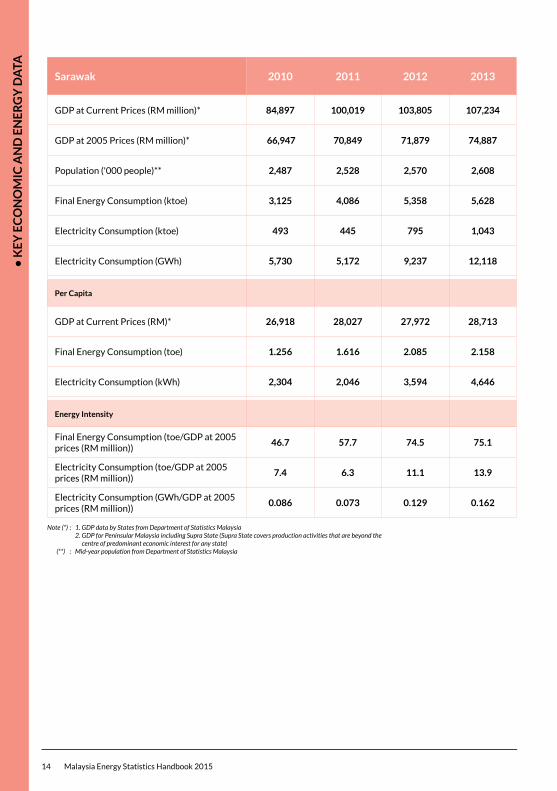
Sarawak 2010 2011 2012 2013
GDP at Current Prices (RM million)* 84,897 100,019 103,805 107,234
GDP at 2005 Prices (RM million)* 66,947 70,849 71,879 74,887
Population ('000 people)** 2,487 2,528 2,570 2,608
Final Energy Consumption (ktoe) 3,125 4,086 5,358 5,628
Electricity Consumption (ktoe) 493 445 795 1,043
Electricity Consumption (GWh) 5,730 5,172 9,237 12,118
Per Capita
GDP at Current Prices (RM)* 26,918 28,027 27,972 28,713
Final Energy Consumption (toe) 1.256 1.616 2.085 2.158
Electricity Consumption (kWh) 2,304 2,046 3,594 4,646
Energy Intensity
Final Energy Consumption (toe/GDP at 2005 prices (RM million))
46.7 57.7 74.5 75.1
Electricity Consumption (toe/GDP at 2005 prices (RM million))
7.4 6.3 11.1 13.9
Electricity Consumption (GWh/GDP at 2005 prices (RM million))
0.086 0.073 0.129 0.162
Note (*) : 1. GDP data by States from Department of Statistics Malaysia 2. GDP for Peninsular Malaysia including Supra State (Supra State covers production activities that are beyond the centre of predominant economic interest for any state) (**) : Mid-year population from Department of Statistics Malaysia

This page has been intentionally left blank.
• E
NE
RG
Y S
UP
PLY
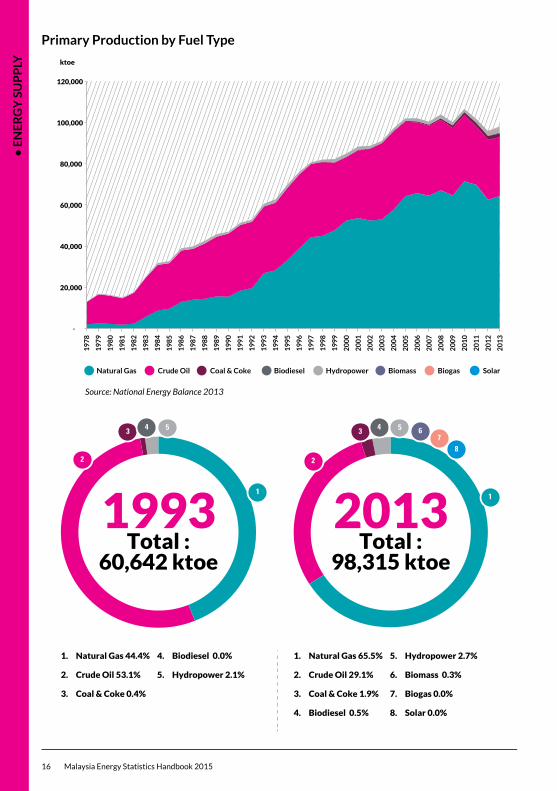
16 Malaysia Energy Statistics Handbook 2015
Primary Production by Fuel Type
-
20,000
40,000
60,000
80,000
100,000
120,000 1
97
8
19
79
19
80
19
81
19
82
19
83
19
84
19
85
19
86
19
87
19
88
19
89
19
90
19
91
19
92
19
93
19
94
19
95
19
96
19
97
19
98
19
99
20
00
20
01
20
02
20
03
20
04
20
05
20
06
20
07
20
08
20
09
20
10
20
11
20
12
20
13
ktoe
Natural Gas Crude Oil Coal & Coke Biodiesel Hydropower Biomass Biogas Solar
Source: National Energy Balance 2013
1. Natural Gas 44.4%
2. Crude Oil 53.1%
3. Coal & Coke 0.4%
4. Biodiesel 0.0%
5. Hydropower 2.1%
1. Natural Gas 65.5%
2. Crude Oil 29.1%
3. Coal & Coke 1.9%
4. Biodiesel 0.5%
5. Hydropower 2.7%
6. Biomass 0.3%
7. Biogas 0.0%
8. Solar 0.0%
1993Total :
60,642 ktoe
2013Total :
98,315 ktoe
11
2 2
3 4 5 3 4 5 67
8
• E
NE
RG
Y SU
PP
LY
Malaysia Energy Statistics Handbook 2015 17
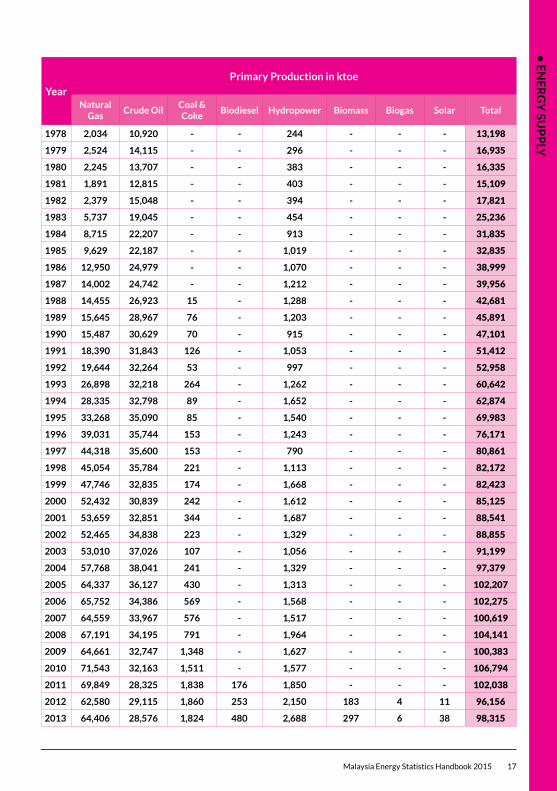
Year
Primary Production in ktoe
Natural Gas
Crude OilCoal & Coke
Biodiesel Hydropower Biomass Biogas Solar Total
1978 2,034 10,920 - - 244 - - - 13,198
1979 2,524 14,115 - - 296 - - - 16,935
1980 2,245 13,707 - - 383 - - - 16,335
1981 1,891 12,815 - - 403 - - - 15,109
1982 2,379 15,048 - - 394 - - - 17,821
1983 5,737 19,045 - - 454 - - - 25,236
1984 8,715 22,207 - - 913 - - - 31,835
1985 9,629 22,187 - - 1,019 - - - 32,835
1986 12,950 24,979 - - 1,070 - - - 38,999
1987 14,002 24,742 - - 1,212 - - - 39,956
1988 14,455 26,923 15 - 1,288 - - - 42,681
1989 15,645 28,967 76 - 1,203 - - - 45,891
1990 15,487 30,629 70 - 915 - - - 47,101
1991 18,390 31,843 126 - 1,053 - - - 51,412
1992 19,644 32,264 53 - 997 - - - 52,958
1993 26,898 32,218 264 - 1,262 - - - 60,642
1994 28,335 32,798 89 - 1,652 - - - 62,874
1995 33,268 35,090 85 - 1,540 - - - 69,983
1996 39,031 35,744 153 - 1,243 - - - 76,171
1997 44,318 35,600 153 - 790 - - - 80,861
1998 45,054 35,784 221 - 1,113 - - - 82,172
1999 47,746 32,835 174 - 1,668 - - - 82,423
2000 52,432 30,839 242 - 1,612 - - - 85,125
2001 53,659 32,851 344 - 1,687 - - - 88,541
2002 52,465 34,838 223 - 1,329 - - - 88,855
2003 53,010 37,026 107 - 1,056 - - - 91,199
2004 57,768 38,041 241 - 1,329 - - - 97,379
2005 64,337 36,127 430 - 1,313 - - - 102,207
2006 65,752 34,386 569 - 1,568 - - - 102,275
2007 64,559 33,967 576 - 1,517 - - - 100,619
2008 67,191 34,195 791 - 1,964 - - - 104,141
2009 64,661 32,747 1,348 - 1,627 - - - 100,383
2010 71,543 32,163 1,511 - 1,577 - - - 106,794
2011 69,849 28,325 1,838 176 1,850 - - - 102,038
2012 62,580 29,115 1,860 253 2,150 183 4 11 96,156
2013 64,406 28,576 1,824 480 2,688 297 6 38 98,315
• E
NE
RG
Y S
UP
PLY
18 Malaysia Energy Statistics Handbook 2015
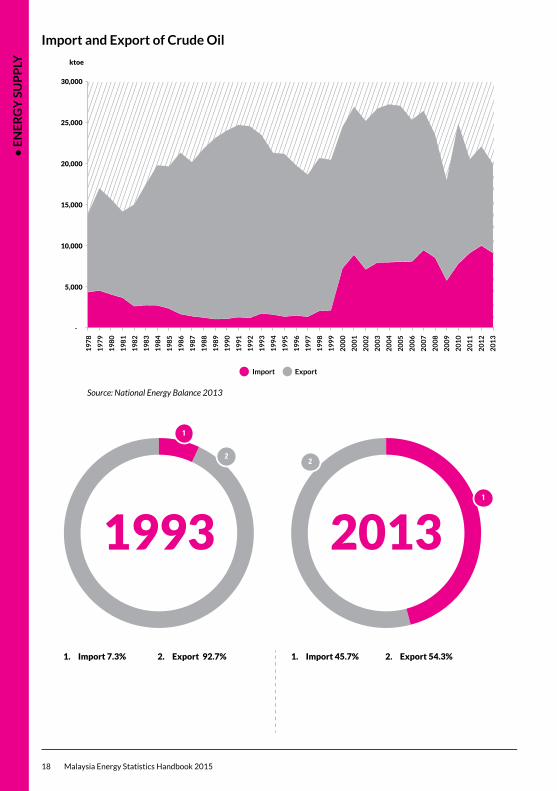
Import and Export of Crude Oil
19
78
19
79
19
80
19
81
19
82
19
83
19
84
19
85
19
86
19
87
19
88
19
89
19
90
19
91
19
92
19
93
19
94
19
95
19
96
19
97
19
98
19
99
20
00
20
01
20
02
20
03
20
04
20
05
20
06
20
07
20
08
20
09
20
10
20
11
20
12
20
13
Import Export
Source: National Energy Balance 2013
1. Import 7.3% 2. Export 92.7% 1. Import 45.7% 2. Export 54.3%
1993 2013
1
1
22
-
5,000
10,000
15,000
20,000
25,000
30,000
ktoe
• E
NE
RG
Y SU
PP
LY
Malaysia Energy Statistics Handbook 2015 19
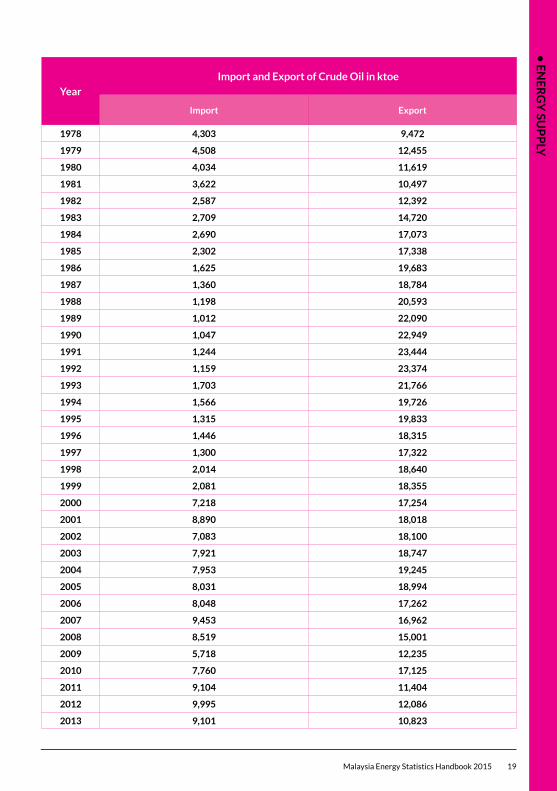
Year
Import and Export of Crude Oil in ktoe
Import Export
1978 4,303 9,472
1979 4,508 12,455
1980 4,034 11,619
1981 3,622 10,497
1982 2,587 12,392
1983 2,709 14,720
1984 2,690 17,073
1985 2,302 17,338
1986 1,625 19,683
1987 1,360 18,784
1988 1,198 20,593
1989 1,012 22,090
1990 1,047 22,949
1991 1,244 23,444
1992 1,159 23,374
1993 1,703 21,766
1994 1,566 19,726
1995 1,315 19,833
1996 1,446 18,315
1997 1,300 17,322
1998 2,014 18,640
1999 2,081 18,355
2000 7,218 17,254
2001 8,890 18,018
2002 7,083 18,100
2003 7,921 18,747
2004 7,953 19,245
2005 8,031 18,994
2006 8,048 17,262
2007 9,453 16,962
2008 8,519 15,001
2009 5,718 12,235
2010 7,760 17,125
2011 9,104 11,404
2012 9,995 12,086
2013 9,101 10,823
• E
NE
RG
Y S
UP
PLY
20 Malaysia Energy Statistics Handbook 2015
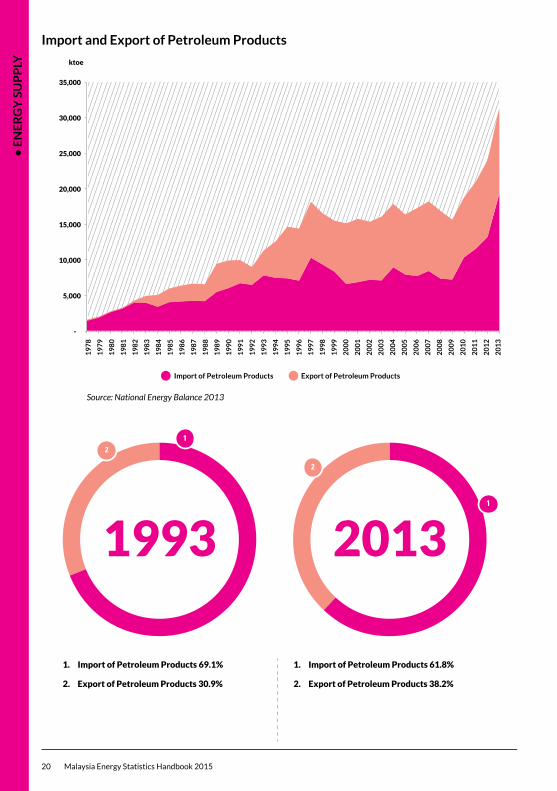
Import and Export of Petroleum Products
19
78
19
79
19
80
19
81
19
82
19
83
19
84
19
85
19
86
19
87
19
88
19
89
19
90
19
91
19
92
19
93
19
94
19
95
19
96
19
97
19
98
19
99
20
00
20
01
20
02
20
03
20
04
20
05
20
06
20
07
20
08
20
09
20
10
20
11
20
12
20
13
Import of Petroleum Products Export of Petroleum Products
Source: National Energy Balance 2013
1. Import of Petroleum Products 69.1%
2. Export of Petroleum Products 30.9%
1. Import of Petroleum Products 61.8%
2. Export of Petroleum Products 38.2%
1993 2013
1
1
2
2
-
5,000
10,000
15,000
20,000
25,000
30,000
35,000
ktoe
• E
NE
RG
Y SU
PP
LY
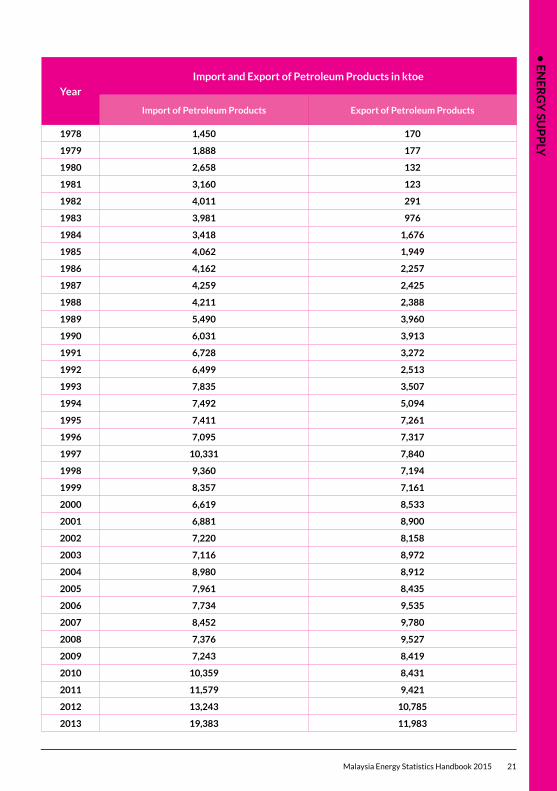
Malaysia Energy Statistics Handbook 2015 21
Year
Import and Export of Petroleum Products in ktoe
Import of Petroleum Products Export of Petroleum Products
1978 1,450 170
1979 1,888 177
1980 2,658 132
1981 3,160 123
1982 4,011 291
1983 3,981 976
1984 3,418 1,676
1985 4,062 1,949
1986 4,162 2,257
1987 4,259 2,425
1988 4,211 2,388
1989 5,490 3,960
1990 6,031 3,913
1991 6,728 3,272
1992 6,499 2,513
1993 7,835 3,507
1994 7,492 5,094
1995 7,411 7,261
1996 7,095 7,317
1997 10,331 7,840
1998 9,360 7,194
1999 8,357 7,161
2000 6,619 8,533
2001 6,881 8,900
2002 7,220 8,158
2003 7,116 8,972
2004 8,980 8,912
2005 7,961 8,435
2006 7,734 9,535
2007 8,452 9,780
2008 7,376 9,527
2009 7,243 8,419
2010 10,359 8,431
2011 11,579 9,421
2012 13,243 10,785
2013 19,383 11,983
• E
NE
RG
Y S
UP
PLY
22 Malaysia Energy Statistics Handbook 2015
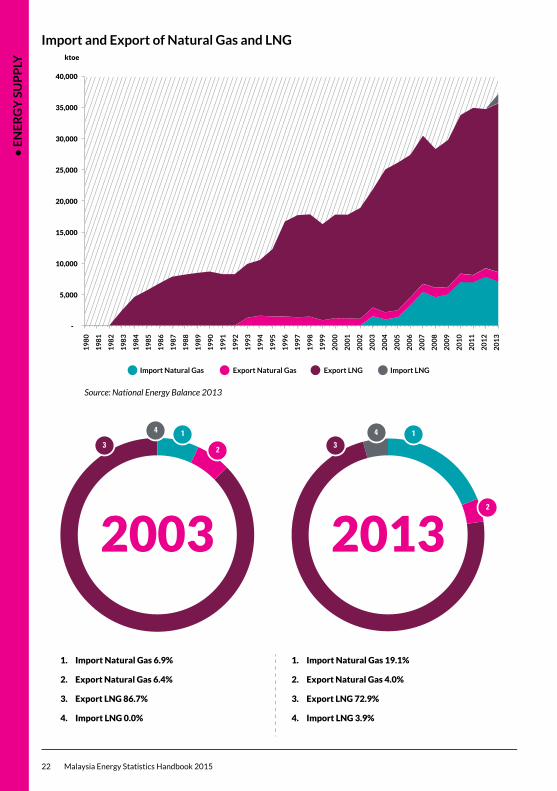
Import and Export of Natural Gas and LNG
19
80
19
81
19
82
19
83
19
84
19
85
19
86
19
87
19
88
19
89
19
90
19
91
19
92
19
93
19
94
19
95
19
96
19
97
19
98
19
99
20
00
20
01
20
02
20
03
20
04
20
05
20
06
20
07
20
08
20
09
20
10
20
11
20
12
20
13
Source: National Energy Balance 2013
1. Import Natural Gas 6.9%
2. Export Natural Gas 6.4%
3. Export LNG 86.7%
4. Import LNG 0.0%
1. Import Natural Gas 19.1%
2. Export Natural Gas 4.0%
3. Export LNG 72.9%
4. Import LNG 3.9%
2003
1
1
3 2
4 13
2
4
2
-
5,000
10,000
15,000
20,000
25,000
30,000
35,000
40,000
ktoe
Import Natural Gas Export Natural Gas Export LNG Import LNG
2013
• E
NE
RG
Y SU
PP
LY
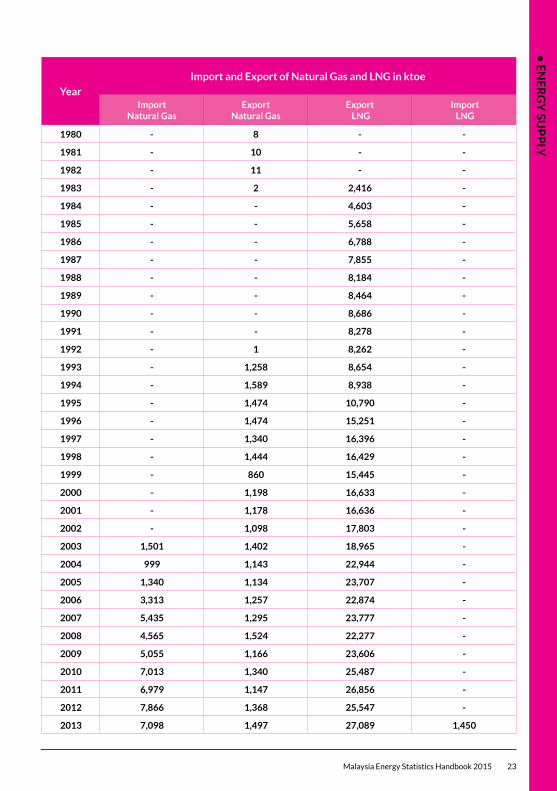
Malaysia Energy Statistics Handbook 2015 23
Year
Import and Export of Natural Gas and LNG in ktoe
Import Natural Gas
Export Natural Gas
Export LNG
Import LNG
1980 - 8 - -
1981 - 10 - -
1982 - 11 - -
1983 - 2 2,416 -
1984 - - 4,603 -
1985 - - 5,658 -
1986 - - 6,788 -
1987 - - 7,855 -
1988 - - 8,184 -
1989 - - 8,464 -
1990 - - 8,686 -
1991 - - 8,278 -
1992 - 1 8,262 -
1993 - 1,258 8,654 -
1994 - 1,589 8,938 -
1995 - 1,474 10,790 -
1996 - 1,474 15,251 -
1997 - 1,340 16,396 -
1998 - 1,444 16,429 -
1999 - 860 15,445 -
2000 - 1,198 16,633 -
2001 - 1,178 16,636 -
2002 - 1,098 17,803 -
2003 1,501 1,402 18,965 -
2004 999 1,143 22,944 -
2005 1,340 1,134 23,707 -
2006 3,313 1,257 22,874 -
2007 5,435 1,295 23,777 -
2008 4,565 1,524 22,277 -
2009 5,055 1,166 23,606 -
2010 7,013 1,340 25,487 -
2011 6,979 1,147 26,856 -
2012 7,866 1,368 25,547 -
2013 7,098 1,497 27,089 1,450
• E
NE
RG
Y S
UP
PLY
24 Malaysia Energy Statistics Handbook 2015
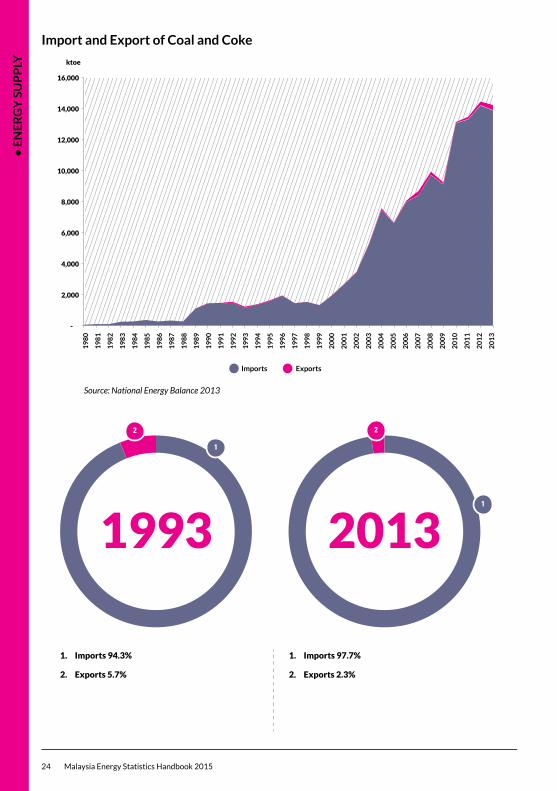
Import and Export of Coal and Coke
19
80
19
81
19
82
19
83
19
84
19
85
19
86
19
87
19
88
19
89
19
90
19
91
19
92
19
93
19
94
19
95
19
96
19
97
19
98
19
99
20
00
20
01
20
02
20
03
20
04
20
05
20
06
20
07
20
08
20
09
20
10
20
11
20
12
20
13
Source: National Energy Balance 2013
1. Imports 94.3%
2. Exports 5.7%
1. Imports 97.7%
2. Exports 2.3%
19931
2
1
1
2
2
Imports Exports
2013
-
2,000
4,000
6,000
8,000
10,000
12,000
14,000
16,000
ktoe
• E
NE
RG
Y SU
PP
LY
Malaysia Energy Statistics Handbook 2015 25
Year
Import and Export of Coal and Coke in ktoe
Imports Exports
1980 53 -
1981 99 -
1982 93 -
1983 249 -
1984 270 -
1985 362 -
1986 268 -
1987 327 -
1988 260 15
1989 1,093 11
1990 1,424 28
1991 1,407 66
1992 1,485 60
1993 1,158 70
1994 1,351 40
1995 1,588 50
1996 1,938 15
1997 1,446 9
1998 1,529 7
1999 1,321 8
2000 1,943 19
2001 2,665 34
2002 3,442 37
2003 5,268 36
2004 7,498 85
2005 6,612 44
2006 7,988 71
2007 8,425 273
2008 9,725 206
2009 9,126 119
2010 13,073 62
2011 13,330 141
2012 14,221 233
2013 13,909 326
• E
NE
RG
Y S
UP
PLY
26 Malaysia Energy Statistics Handbook 2015
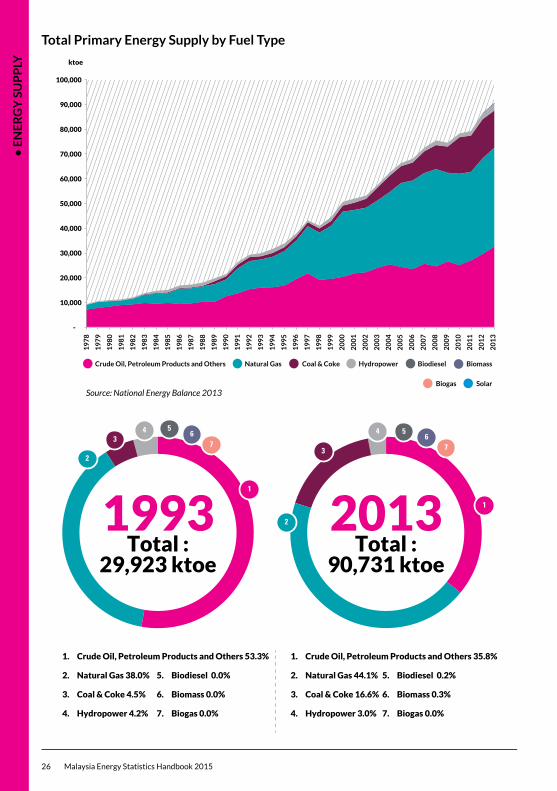
Total Primary Energy Supply by Fuel Type
19
80
19
79
19
78
19
81
19
82
19
83
19
84
19
85
19
86
19
87
19
88
19
89
19
90
19
91
19
92
19
93
19
94
19
95
19
96
19
97
19
98
19
99
20
00
20
01
20
02
20
03
20
04
20
05
20
06
20
07
20
08
20
09
20
10
20
11
20
12
20
13
Source: National Energy Balance 2013
1. Crude Oil, Petroleum Products and Others 35.8%
2. Natural Gas 44.1%
3. Coal & Coke 16.6%
4. Hydropower 3.0%
1
2
3
2
3
4 56
7
56
7
1
1
4
2
Natural Gas Coal & Coke BiodieselCrude Oil, Petroleum Products and Others Hydropower Biomass
Biogas Solar
-
10,000
20,000
30,000
40,000
50,000
60,000
70,000
80,000
90,000
100,000
ktoe
1993Total :
29,923 ktoe
2013Total :
90,731 ktoe
1. Crude Oil, Petroleum Products and Others 53.3%
2. Natural Gas 38.0%
3. Coal & Coke 4.5%
4. Hydropower 4.2%
5. Biodiesel 0.0%
6. Biomass 0.0%
7. Biogas 0.0%
5. Biodiesel 0.2%
6. Biomass 0.3%
7. Biogas 0.0%
• E
NE
RG
Y SU
PP
LY
Malaysia Energy Statistics Handbook 2015 27
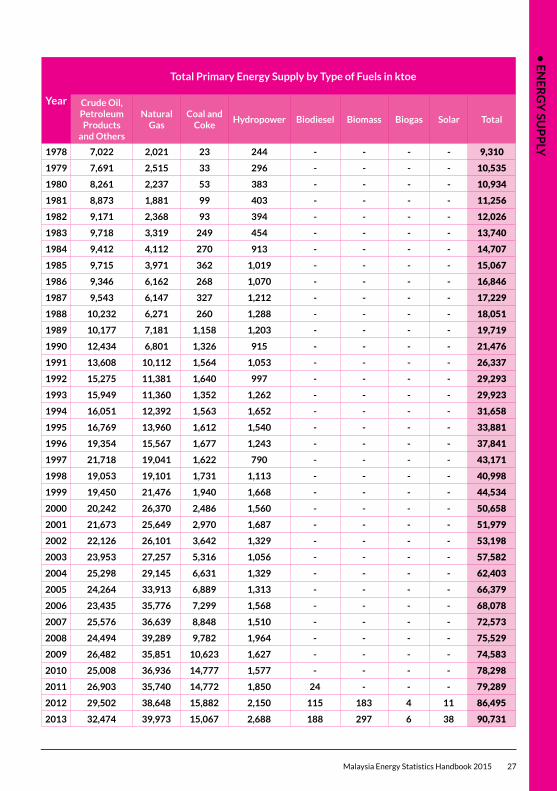
Year
Total Primary Energy Supply by Type of Fuels in ktoe
Crude Oil, Petroleum Products
and Others
Natural Gas
Coal and Coke
Hydropower Biodiesel Biomass Biogas Solar Total
1978 7,022 2,021 23 244 - - - - 9,310
1979 7,691 2,515 33 296 - - - - 10,535
1980 8,261 2,237 53 383 - - - - 10,934
1981 8,873 1,881 99 403 - - - - 11,256
1982 9,171 2,368 93 394 - - - - 12,026
1983 9,718 3,319 249 454 - - - - 13,740
1984 9,412 4,112 270 913 - - - - 14,707
1985 9,715 3,971 362 1,019 - - - - 15,067
1986 9,346 6,162 268 1,070 - - - - 16,846
1987 9,543 6,147 327 1,212 - - - - 17,229
1988 10,232 6,271 260 1,288 - - - - 18,051
1989 10,177 7,181 1,158 1,203 - - - - 19,719
1990 12,434 6,801 1,326 915 - - - - 21,476
1991 13,608 10,112 1,564 1,053 - - - - 26,337
1992 15,275 11,381 1,640 997 - - - - 29,293
1993 15,949 11,360 1,352 1,262 - - - - 29,923
1994 16,051 12,392 1,563 1,652 - - - - 31,658
1995 16,769 13,960 1,612 1,540 - - - - 33,881
1996 19,354 15,567 1,677 1,243 - - - - 37,841
1997 21,718 19,041 1,622 790 - - - - 43,171
1998 19,053 19,101 1,731 1,113 - - - - 40,998
1999 19,450 21,476 1,940 1,668 - - - - 44,534
2000 20,242 26,370 2,486 1,560 - - - - 50,658
2001 21,673 25,649 2,970 1,687 - - - - 51,979
2002 22,126 26,101 3,642 1,329 - - - - 53,198
2003 23,953 27,257 5,316 1,056 - - - - 57,582
2004 25,298 29,145 6,631 1,329 - - - - 62,403
2005 24,264 33,913 6,889 1,313 - - - - 66,379
2006 23,435 35,776 7,299 1,568 - - - - 68,078
2007 25,576 36,639 8,848 1,510 - - - - 72,573
2008 24,494 39,289 9,782 1,964 - - - - 75,529
2009 26,482 35,851 10,623 1,627 - - - - 74,583
2010 25,008 36,936 14,777 1,577 - - - - 78,298
2011 26,903 35,740 14,772 1,850 24 - - - 79,289
2012 29,502 38,648 15,882 2,150 115 183 4 11 86,495
2013 32,474 39,973 15,067 2,688 188 297 6 38 90,731
• E
NE
RG
Y T
RA
NSF
OR
MA
TIO
N
28 Malaysia Energy Statistics Handbook 2015
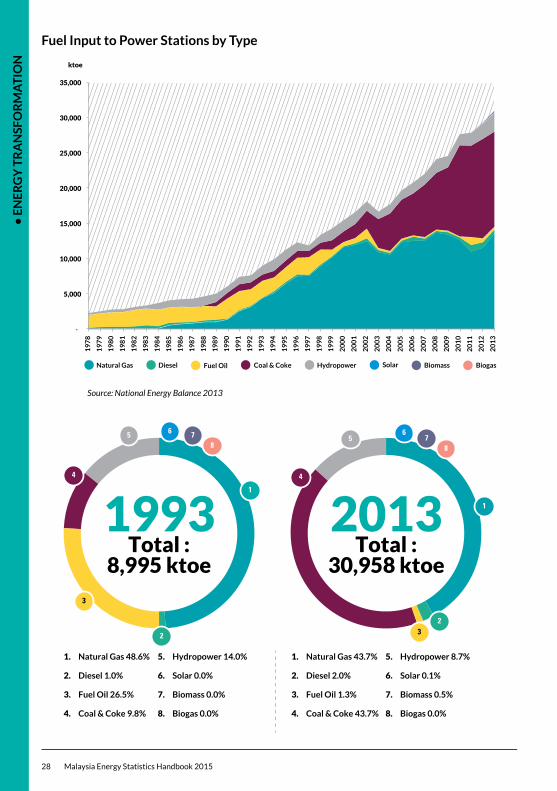
Fuel Input to Power Stations by Type
19
80
19
79
19
78
19
81
19
82
19
83
19
84
19
85
19
86
19
87
19
88
19
89
19
90
19
91
19
92
19
93
19
94
19
95
19
96
19
97
19
98
19
99
20
00
20
01
20
02
20
03
20
04
20
05
20
06
20
07
20
08
20
09
20
10
20
11
20
12
20
13
1
2
2
3
3
44
5 76
8
67
8
1
1
5
2
DieselNatural Gas Coal & Coke Hydropower Biomass BiogasSolarFuel Oil
1993Total :
8,995 ktoe
2013Total :
30,958 ktoe
1. Natural Gas 48.6%
2. Diesel 1.0%
3. Fuel Oil 26.5%
4. Coal & Coke 9.8%
5. Hydropower 14.0%
6. Solar 0.0%
7. Biomass 0.0%
8. Biogas 0.0%
1. Natural Gas 43.7%
2. Diesel 2.0%
3. Fuel Oil 1.3%
4. Coal & Coke 43.7%
5. Hydropower 8.7%
6. Solar 0.1%
7. Biomass 0.5%
8. Biogas 0.0%
-
5,000
10,000
15,000
20,000
25,000
30,000
35,000
ktoe
Source: National Energy Balance 2013
• E
NE
RG
Y T
RA
NSF
OR
MA
TIO
N
Malaysia Energy Statistics Handbook 2015 29
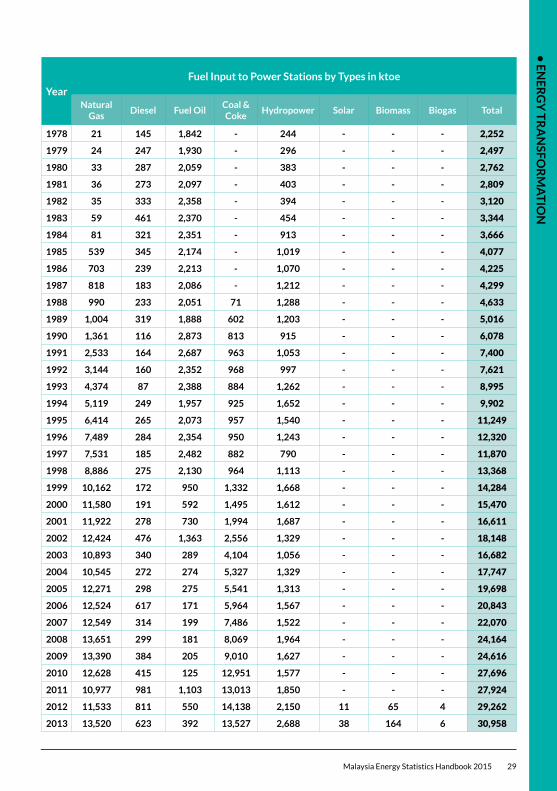
Year
Fuel Input to Power Stations by Types in ktoe
Natural Gas
Diesel Fuel OilCoal & Coke
Hydropower Solar Biomass Biogas Total
1978 21 145 1,842 - 244 - - - 2,252
1979 24 247 1,930 - 296 - - - 2,497
1980 33 287 2,059 - 383 - - - 2,762
1981 36 273 2,097 - 403 - - - 2,809
1982 35 333 2,358 - 394 - - - 3,120
1983 59 461 2,370 - 454 - - - 3,344
1984 81 321 2,351 - 913 - - - 3,666
1985 539 345 2,174 - 1,019 - - - 4,077
1986 703 239 2,213 - 1,070 - - - 4,225
1987 818 183 2,086 - 1,212 - - - 4,299
1988 990 233 2,051 71 1,288 - - - 4,633
1989 1,004 319 1,888 602 1,203 - - - 5,016
1990 1,361 116 2,873 813 915 - - - 6,078
1991 2,533 164 2,687 963 1,053 - - - 7,400
1992 3,144 160 2,352 968 997 - - - 7,621
1993 4,374 87 2,388 884 1,262 - - - 8,995
1994 5,119 249 1,957 925 1,652 - - - 9,902
1995 6,414 265 2,073 957 1,540 - - - 11,249
1996 7,489 284 2,354 950 1,243 - - - 12,320
1997 7,531 185 2,482 882 790 - - - 11,870
1998 8,886 275 2,130 964 1,113 - - - 13,368
1999 10,162 172 950 1,332 1,668 - - - 14,284
2000 11,580 191 592 1,495 1,612 - - - 15,470
2001 11,922 278 730 1,994 1,687 - - - 16,611
2002 12,424 476 1,363 2,556 1,329 - - - 18,148
2003 10,893 340 289 4,104 1,056 - - - 16,682
2004 10,545 272 274 5,327 1,329 - - - 17,747
2005 12,271 298 275 5,541 1,313 - - - 19,698
2006 12,524 617 171 5,964 1,567 - - - 20,843
2007 12,549 314 199 7,486 1,522 - - - 22,070
2008 13,651 299 181 8,069 1,964 - - - 24,164
2009 13,390 384 205 9,010 1,627 - - - 24,616
2010 12,628 415 125 12,951 1,577 - - - 27,696
2011 10,977 981 1,103 13,013 1,850 - - - 27,924
2012 11,533 811 550 14,138 2,150 11 65 4 29,262
2013 13,520 623 392 13,527 2,688 38 164 6 30,958
• E
NE
RG
Y T
RA
NSF
OR
MA
TIO
N
30 Malaysia Energy Statistics Handbook 2015
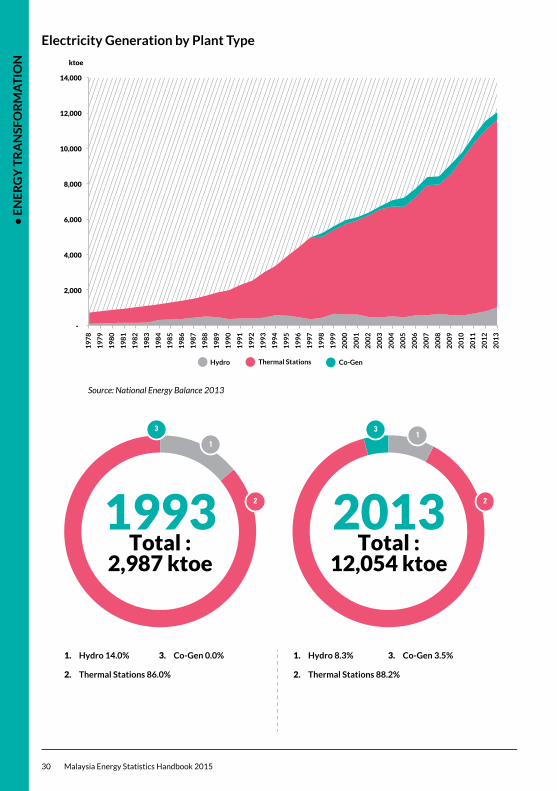
Electricity Generation by Plant Type
19
80
19
79
19
78
19
81
19
82
19
83
19
84
19
85
19
86
19
87
19
88
19
89
19
90
19
91
19
92
19
93
19
94
19
95
19
96
19
97
19
98
19
99
20
00
20
01
20
02
20
03
20
04
20
05
20
06
20
07
20
08
20
09
20
10
20
11
20
12
20
13
22
3
1
31
Hydro Co-GenThermal Stations
1993Total :
2,987 ktoe
2013Total :
12,054 ktoe
1. Hydro 14.0%
2. Thermal Stations 86.0%
3. Co-Gen 0.0% 1. Hydro 8.3%
2. Thermal Stations 88.2%
3. Co-Gen 3.5%
-
Source: National Energy Balance 2013
-
2,000
4,000
6,000
8,000
10,000
12,000
14,000
ktoe
• E
NE
RG
Y T
RA
NSF
OR
MA
TIO
N
Malaysia Energy Statistics Handbook 2015 31
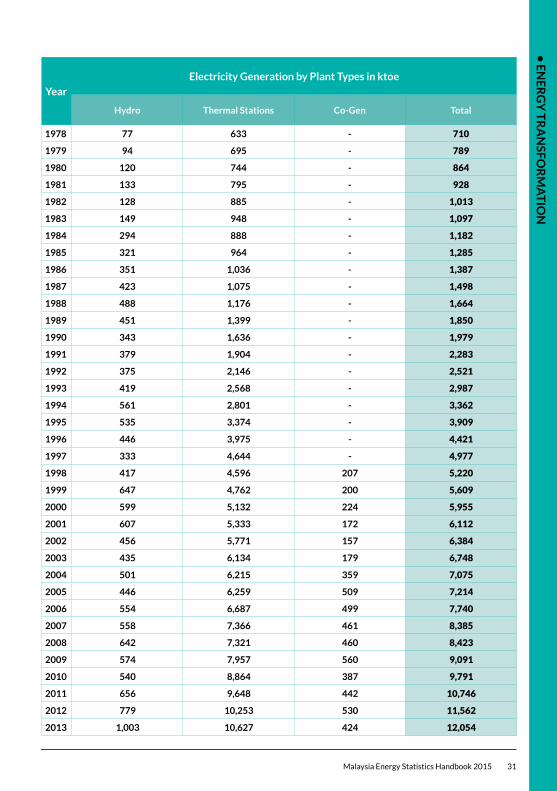
Year
Electricity Generation by Plant Types in ktoe
Hydro Thermal Stations Co-Gen Total
1978 77 633 - 710
1979 94 695 - 789
1980 120 744 - 864
1981 133 795 - 928
1982 128 885 - 1,013
1983 149 948 - 1,097
1984 294 888 - 1,182
1985 321 964 - 1,285
1986 351 1,036 - 1,387
1987 423 1,075 - 1,498
1988 488 1,176 - 1,664
1989 451 1,399 - 1,850
1990 343 1,636 - 1,979
1991 379 1,904 - 2,283
1992 375 2,146 - 2,521
1993 419 2,568 - 2,987
1994 561 2,801 - 3,362
1995 535 3,374 - 3,909
1996 446 3,975 - 4,421
1997 333 4,644 - 4,977
1998 417 4,596 207 5,220
1999 647 4,762 200 5,609
2000 599 5,132 224 5,955
2001 607 5,333 172 6,112
2002 456 5,771 157 6,384
2003 435 6,134 179 6,748
2004 501 6,215 359 7,075
2005 446 6,259 509 7,214
2006 554 6,687 499 7,740
2007 558 7,366 461 8,385
2008 642 7,321 460 8,423
2009 574 7,957 560 9,091
2010 540 8,864 387 9,791
2011 656 9,648 442 10,746
2012 779 10,253 530 11,562
2013 1,003 10,627 424 12,054
• E
NE
RG
Y T
RA
NSF
OR
MA
TIO
N
32 Malaysia Energy Statistics Handbook 2015
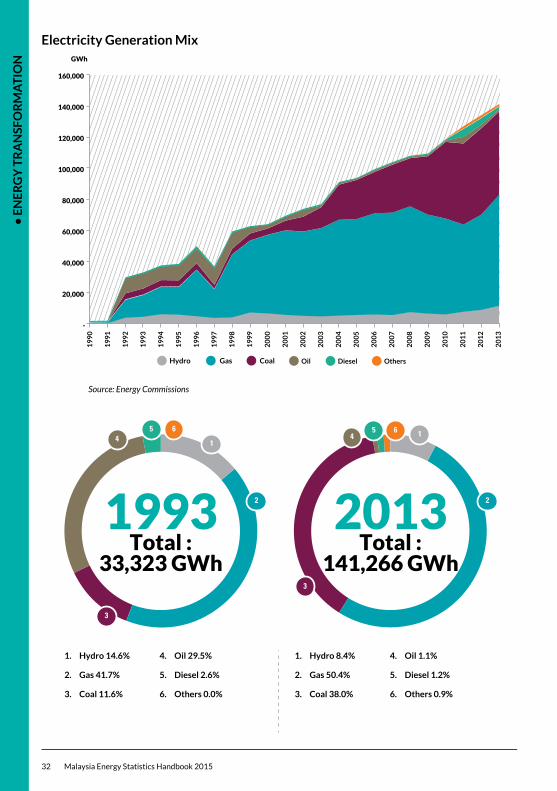
Electricity Generation Mix
19
90
19
91
19
92
19
93
19
94
19
95
19
96
19
97
19
98
19
99
20
00
20
01
20
02
20
03
20
04
20
05
20
06
20
07
20
08
20
09
20
10
20
11
20
12
20
13
22
45 6
3
1
3
45 6 1
1993Total :
33,323 GWh
2013Total :
141,266 GWh
1. Hydro 14.6%
2. Gas 41.7%
3. Coal 11.6%
4. Oil 29.5%
5. Diesel 2.6%
6. Others 0.0%
1. Hydro 8.4%
2. Gas 50.4%
3. Coal 38.0%
4. Oil 1.1%
5. Diesel 1.2%
6. Others 0.9%
Source: Energy Commissions
-
20,000
40,000
60,000
80,000
100,000
120,000
140,000
160,000
GWh
Gas CoalHydro Oil Diesel Others
• E
NE
RG
Y T
RA
NSF
OR
MA
TIO
N
Malaysia Energy Statistics Handbook 2015 33
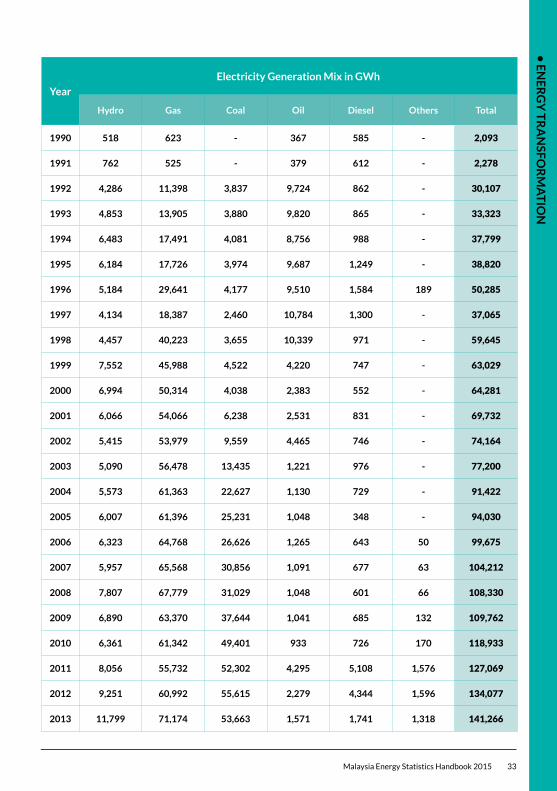
Year
Electricity Generation Mix in GWh
Hydro Gas Coal Oil Diesel Others Total
1990 518 623 - 367 585 - 2,093
1991 762 525 - 379 612 - 2,278
1992 4,286 11,398 3,837 9,724 862 - 30,107
1993 4,853 13,905 3,880 9,820 865 - 33,323
1994 6,483 17,491 4,081 8,756 988 - 37,799
1995 6,184 17,726 3,974 9,687 1,249 - 38,820
1996 5,184 29,641 4,177 9,510 1,584 189 50,285
1997 4,134 18,387 2,460 10,784 1,300 - 37,065
1998 4,457 40,223 3,655 10,339 971 - 59,645
1999 7,552 45,988 4,522 4,220 747 - 63,029
2000 6,994 50,314 4,038 2,383 552 - 64,281
2001 6,066 54,066 6,238 2,531 831 - 69,732
2002 5,415 53,979 9,559 4,465 746 - 74,164
2003 5,090 56,478 13,435 1,221 976 - 77,200
2004 5,573 61,363 22,627 1,130 729 - 91,422
2005 6,007 61,396 25,231 1,048 348 - 94,030
2006 6,323 64,768 26,626 1,265 643 50 99,675
2007 5,957 65,568 30,856 1,091 677 63 104,212
2008 7,807 67,779 31,029 1,048 601 66 108,330
2009 6,890 63,370 37,644 1,041 685 132 109,762
2010 6,361 61,342 49,401 933 726 170 118,933
2011 8,056 55,732 52,302 4,295 5,108 1,576 127,069
2012 9,251 60,992 55,615 2,279 4,344 1,596 134,077
2013 11,799 71,174 53,663 1,571 1,741 1,318 141,266
• E
NE
RG
Y T
RA
NSF
OR
MA
TIO
N
34 Malaysia Energy Statistics Handbook 2015
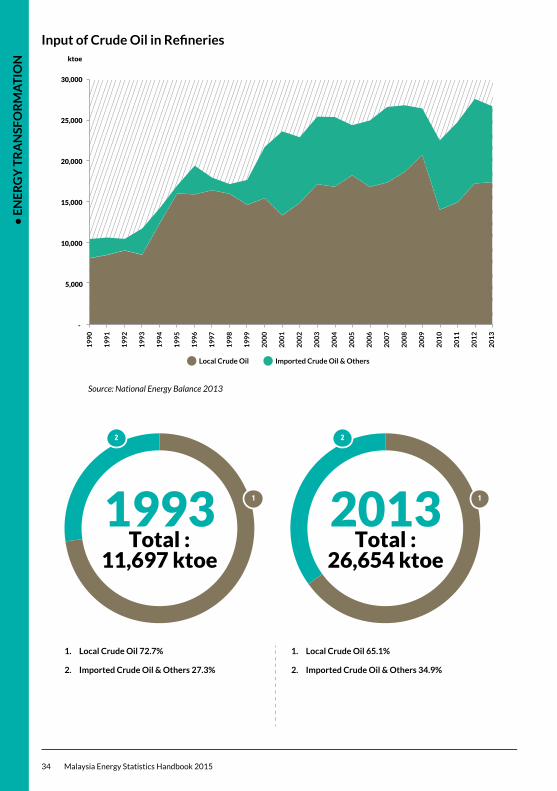
InputofCrudeOilinRefineries
19
90
19
91
19
92
19
93
19
94
19
95
19
96
19
97
19
98
19
99
20
00
20
01
20
02
20
03
20
04
20
05
20
06
20
07
20
08
20
09
20
10
20
11
20
12
20
13
1
2
1
2
1993Total :
11,697 ktoe
2013Total :
26,654 ktoe
1. Local Crude Oil 72.7%
2. Imported Crude Oil & Others 27.3%
1. Local Crude Oil 65.1%
2. Imported Crude Oil & Others 34.9%
Source: National Energy Balance 2013
Local Crude Oil Imported Crude Oil & Others
-
5,000
10,000
15,000
20,000
25,000
30,000
ktoe
• E
NE
RG
Y T
RA
NSF
OR
MA
TIO
N
Malaysia Energy Statistics Handbook 2015 35
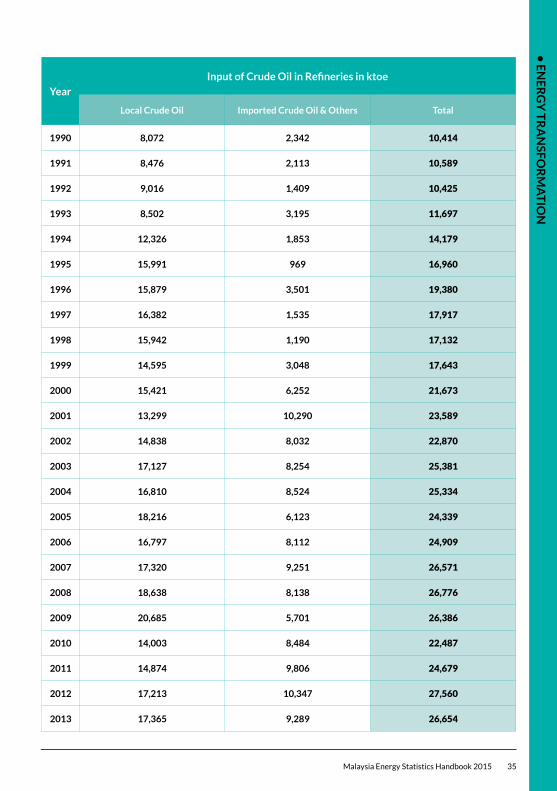
Year
InputofCrudeOilinRefineriesinktoe
Local Crude Oil Imported Crude Oil & Others Total
1990 8,072 2,342 10,414
1991 8,476 2,113 10,589
1992 9,016 1,409 10,425
1993 8,502 3,195 11,697
1994 12,326 1,853 14,179
1995 15,991 969 16,960
1996 15,879 3,501 19,380
1997 16,382 1,535 17,917
1998 15,942 1,190 17,132
1999 14,595 3,048 17,643
2000 15,421 6,252 21,673
2001 13,299 10,290 23,589
2002 14,838 8,032 22,870
2003 17,127 8,254 25,381
2004 16,810 8,524 25,334
2005 18,216 6,123 24,339
2006 16,797 8,112 24,909
2007 17,320 9,251 26,571
2008 18,638 8,138 26,776
2009 20,685 5,701 26,386
2010 14,003 8,484 22,487
2011 14,874 9,806 24,679
2012 17,213 10,347 27,560
2013 17,365 9,289 26,654
• E
NE
RG
Y T
RA
NSF
OR
MA
TIO
N
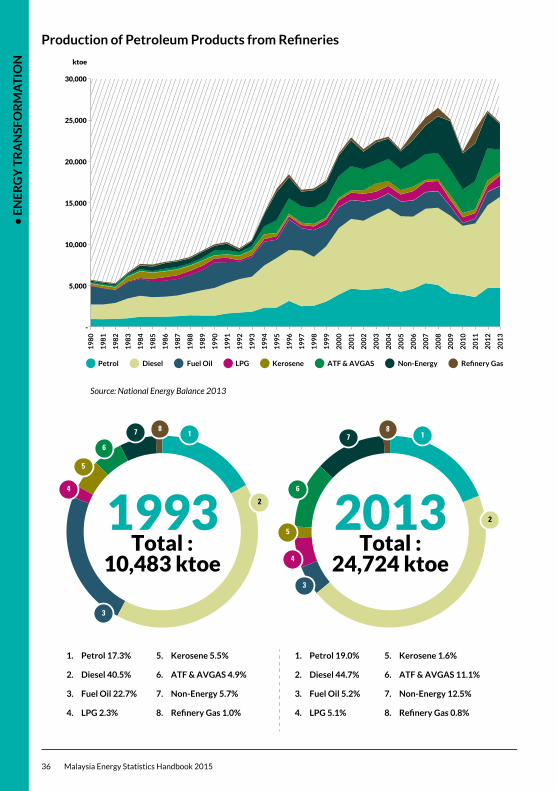
36 Malaysia Energy Statistics Handbook 2015
ProductionofPetroleumProductsfromRefineries
1 1
2
2
3
3
4
4
5
5
6
6
77
8 8
1993Total :
10,483 ktoe
2013Total :
24,724 ktoe
1. Petrol 17.3%
2. Diesel 40.5%
3. Fuel Oil 22.7%
4. LPG 2.3%
5. Kerosene 5.5%
6. ATF & AVGAS 4.9%
7. Non-Energy 5.7%
8. Refinery Gas 1.0%
1. Petrol 19.0%
2. Diesel 44.7%
3. Fuel Oil 5.2%
4. LPG 5.1%
5. Kerosene 1.6%
6. ATF & AVGAS 11.1%
7. Non-Energy 12.5%
8. Refinery Gas 0.8%
Source: National Energy Balance 2013
-
5,000
10,000
15,000
20,000
25,000
30,000
ktoe
19
80
19
81
19
82
19
83
19
84
19
85
19
86
19
87
19
88
19
89
19
90
19
91
19
92
19
93
19
94
19
95
19
96
19
97
19
98
19
99
20
00
20
01
20
02
20
03
20
04
20
05
20
06
20
07
20
08
20
09
20
10
20
11
20
12
20
13
Petrol Diesel Fuel Oil LPG Kerosene ATF & AVGAS Non-Energy Refinery Gas
• E
NE
RG
Y T
RA
NSF
OR
MA
TIO
N
Malaysia Energy Statistics Handbook 2015 37
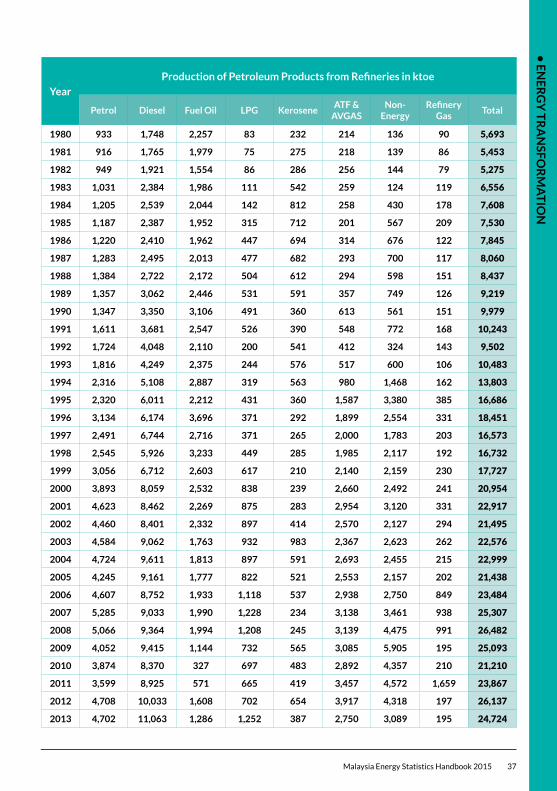
Year
ProductionofPetroleumProductsfromRefineriesinktoe
Petrol Diesel Fuel Oil LPG KeroseneATF &
AVGASNon-
EnergyRefinery
GasTotal
1980 933 1,748 2,257 83 232 214 136 90 5,693
1981 916 1,765 1,979 75 275 218 139 86 5,453
1982 949 1,921 1,554 86 286 256 144 79 5,275
1983 1,031 2,384 1,986 111 542 259 124 119 6,556
1984 1,205 2,539 2,044 142 812 258 430 178 7,608
1985 1,187 2,387 1,952 315 712 201 567 209 7,530
1986 1,220 2,410 1,962 447 694 314 676 122 7,845
1987 1,283 2,495 2,013 477 682 293 700 117 8,060
1988 1,384 2,722 2,172 504 612 294 598 151 8,437
1989 1,357 3,062 2,446 531 591 357 749 126 9,219
1990 1,347 3,350 3,106 491 360 613 561 151 9,979
1991 1,611 3,681 2,547 526 390 548 772 168 10,243
1992 1,724 4,048 2,110 200 541 412 324 143 9,502
1993 1,816 4,249 2,375 244 576 517 600 106 10,483
1994 2,316 5,108 2,887 319 563 980 1,468 162 13,803
1995 2,320 6,011 2,212 431 360 1,587 3,380 385 16,686
1996 3,134 6,174 3,696 371 292 1,899 2,554 331 18,451
1997 2,491 6,744 2,716 371 265 2,000 1,783 203 16,573
1998 2,545 5,926 3,233 449 285 1,985 2,117 192 16,732
1999 3,056 6,712 2,603 617 210 2,140 2,159 230 17,727
2000 3,893 8,059 2,532 838 239 2,660 2,492 241 20,954
2001 4,623 8,462 2,269 875 283 2,954 3,120 331 22,917
2002 4,460 8,401 2,332 897 414 2,570 2,127 294 21,495
2003 4,584 9,062 1,763 932 983 2,367 2,623 262 22,576
2004 4,724 9,611 1,813 897 591 2,693 2,455 215 22,999
2005 4,245 9,161 1,777 822 521 2,553 2,157 202 21,438
2006 4,607 8,752 1,933 1,118 537 2,938 2,750 849 23,484
2007 5,285 9,033 1,990 1,228 234 3,138 3,461 938 25,307
2008 5,066 9,364 1,994 1,208 245 3,139 4,475 991 26,482
2009 4,052 9,415 1,144 732 565 3,085 5,905 195 25,093
2010 3,874 8,370 327 697 483 2,892 4,357 210 21,210
2011 3,599 8,925 571 665 419 3,457 4,572 1,659 23,867
2012 4,708 10,033 1,608 702 654 3,917 4,318 197 26,137
2013 4,702 11,063 1,286 1,252 387 2,750 3,089 195 24,724
• E
NE
RG
Y T
RA
NSF
OR
MA
TIO
N
38 Malaysia Energy Statistics Handbook 2015
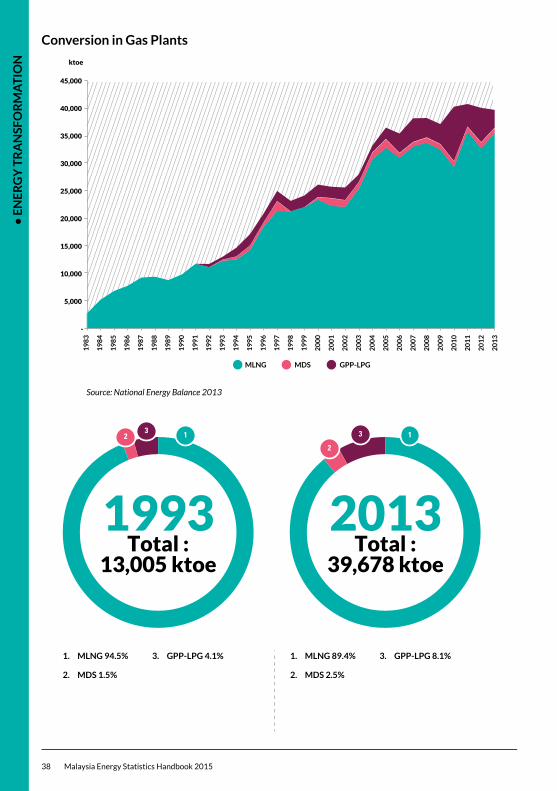
Conversion in Gas Plants
1 123
2
3
4
1993Total :
13,005 ktoe
2013Total :
39,678 ktoe
1. MLNG 94.5%
2. MDS 1.5%
3. GPP-LPG 4.1% 1. MLNG 89.4%
2. MDS 2.5%
3. GPP-LPG 8.1%
Source: National Energy Balance 2013
19
83
19
84
19
85
19
86
19
87
19
88
19
89
19
90
19
91
19
92
19
93
19
94
19
95
19
96
19
97
19
98
19
99
20
00
20
01
20
02
20
03
20
04
20
05
20
06
20
07
20
08
20
09
20
10
20
11
20
12
20
13
MLNG MDS GPP-LPG
-
ktoe
5,000
10,000
15,000
20,000
25,000
30,000
35,000
40,000
45,000
• E
NE
RG
Y T
RA
NSF
OR
MA
TIO
N
Malaysia Energy Statistics Handbook 2015 39
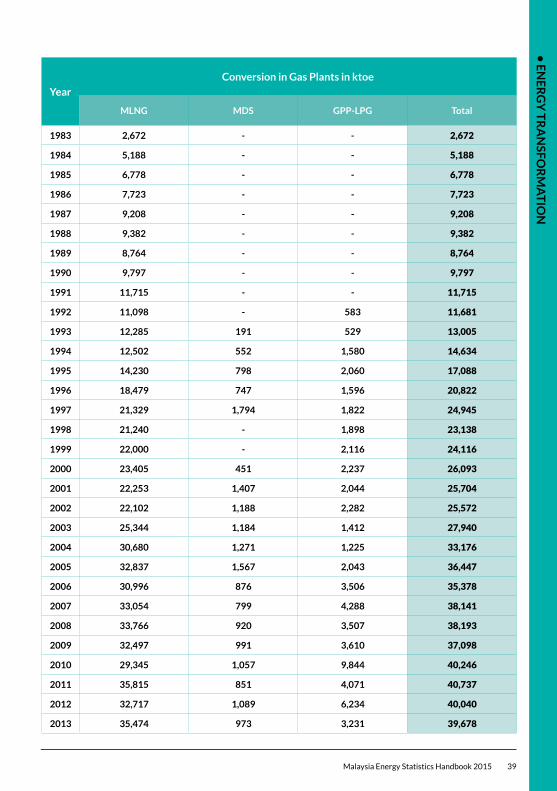
Year
Conversion in Gas Plants in ktoe
MLNG MDS GPP-LPG Total
1983 2,672 - - 2,672
1984 5,188 - - 5,188
1985 6,778 - - 6,778
1986 7,723 - - 7,723
1987 9,208 - - 9,208
1988 9,382 - - 9,382
1989 8,764 - - 8,764
1990 9,797 - - 9,797
1991 11,715 - - 11,715
1992 11,098 - 583 11,681
1993 12,285 191 529 13,005
1994 12,502 552 1,580 14,634
1995 14,230 798 2,060 17,088
1996 18,479 747 1,596 20,822
1997 21,329 1,794 1,822 24,945
1998 21,240 - 1,898 23,138
1999 22,000 - 2,116 24,116
2000 23,405 451 2,237 26,093
2001 22,253 1,407 2,044 25,704
2002 22,102 1,188 2,282 25,572
2003 25,344 1,184 1,412 27,940
2004 30,680 1,271 1,225 33,176
2005 32,837 1,567 2,043 36,447
2006 30,996 876 3,506 35,378
2007 33,054 799 4,288 38,141
2008 33,766 920 3,507 38,193
2009 32,497 991 3,610 37,098
2010 29,345 1,057 9,844 40,246
2011 35,815 851 4,071 40,737
2012 32,717 1,089 6,234 40,040
2013 35,474 973 3,231 39,678
• E
NE
RG
Y C
ON
SUM
PT
ION
40 Malaysia Energy Statistics Handbook 2015
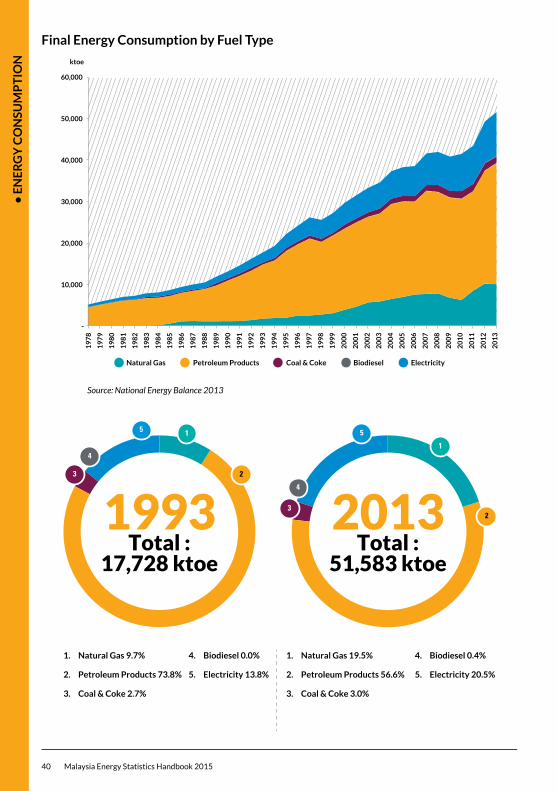
Final Energy Consumption by Fuel Type
1
1
2
2
3
5 5
4
3
4
4
1993Total :
17,728 ktoe
2013Total :
51,583 ktoe
1. Natural Gas 9.7%
2. Petroleum Products 73.8%
3. Coal & Coke 2.7%
4. Biodiesel 0.0%
5. Electricity 13.8%
1. Natural Gas 19.5%
2. Petroleum Products 56.6%
3. Coal & Coke 3.0%
4. Biodiesel 0.4%
5. Electricity 20.5%
Source: National Energy Balance 2013
-
10,000
20,000
30,000
40,000
50,000
60,000
ktoe
19
78
19
79
19
80
19
81
19
82
19
83
19
84
19
85
19
86
19
87
19
88
19
89
19
90
19
91
19
92
19
93
19
94
19
95
19
96
19
97
19
98
19
99
20
00
20
01
20
02
20
03
20
04
20
05
20
06
20
07
20
08
20
09
20
10
20
11
20
12
20
13
Natural Gas Petroleum Products Coal & Coke Biodiesel Electricity
• E
NE
RG
Y C
ON
SUM
PT
ION
Malaysia Energy Statistics Handbook 2015 41
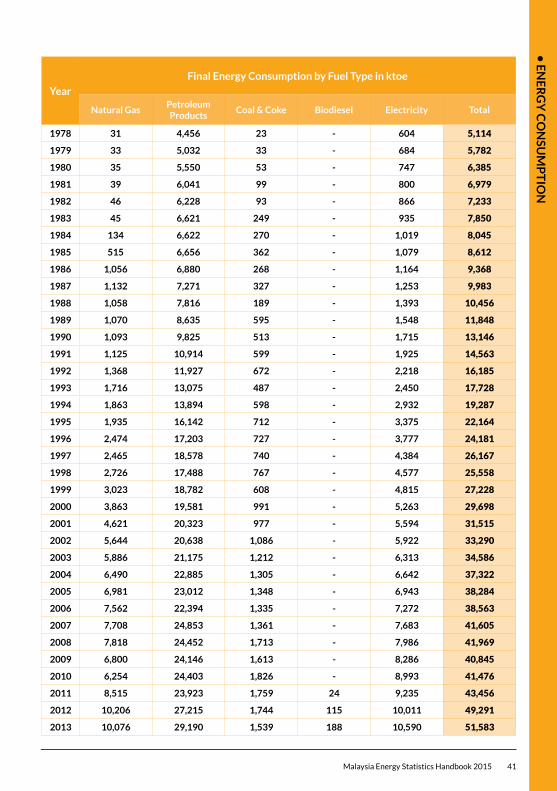
Year
Final Energy Consumption by Fuel Type in ktoe
Natural GasPetroleum Products
Coal & Coke Biodiesel Electricity Total
1978 31 4,456 23 - 604 5,114
1979 33 5,032 33 - 684 5,782
1980 35 5,550 53 - 747 6,385
1981 39 6,041 99 - 800 6,979
1982 46 6,228 93 - 866 7,233
1983 45 6,621 249 - 935 7,850
1984 134 6,622 270 - 1,019 8,045
1985 515 6,656 362 - 1,079 8,612
1986 1,056 6,880 268 - 1,164 9,368
1987 1,132 7,271 327 - 1,253 9,983
1988 1,058 7,816 189 - 1,393 10,456
1989 1,070 8,635 595 - 1,548 11,848
1990 1,093 9,825 513 - 1,715 13,146
1991 1,125 10,914 599 - 1,925 14,563
1992 1,368 11,927 672 - 2,218 16,185
1993 1,716 13,075 487 - 2,450 17,728
1994 1,863 13,894 598 - 2,932 19,287
1995 1,935 16,142 712 - 3,375 22,164
1996 2,474 17,203 727 - 3,777 24,181
1997 2,465 18,578 740 - 4,384 26,167
1998 2,726 17,488 767 - 4,577 25,558
1999 3,023 18,782 608 - 4,815 27,228
2000 3,863 19,581 991 - 5,263 29,698
2001 4,621 20,323 977 - 5,594 31,515
2002 5,644 20,638 1,086 - 5,922 33,290
2003 5,886 21,175 1,212 - 6,313 34,586
2004 6,490 22,885 1,305 - 6,642 37,322
2005 6,981 23,012 1,348 - 6,943 38,284
2006 7,562 22,394 1,335 - 7,272 38,563
2007 7,708 24,853 1,361 - 7,683 41,605
2008 7,818 24,452 1,713 - 7,986 41,969
2009 6,800 24,146 1,613 - 8,286 40,845
2010 6,254 24,403 1,826 - 8,993 41,476
2011 8,515 23,923 1,759 24 9,235 43,456
2012 10,206 27,215 1,744 115 10,011 49,291
2013 10,076 29,190 1,539 188 10,590 51,583
• E
NE
RG
Y C
ON
SUM
PT
ION
42 Malaysia Energy Statistics Handbook 2015
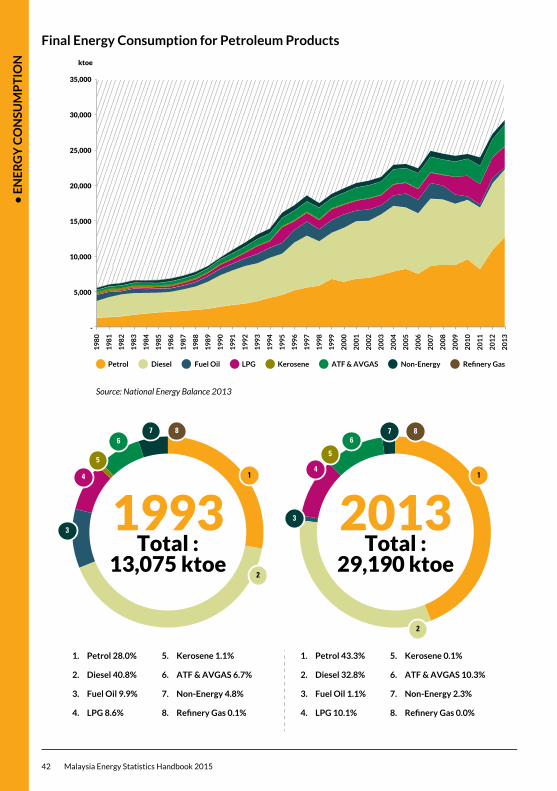
Final Energy Consumption for Petroleum Products
2
1
2
1
3
3
7 8 7 8
44
55
6 6
4
1993Total :
13,075 ktoe
2013Total :
29,190 ktoe
Source: National Energy Balance 2013
19
80
19
81
19
82
19
83
19
84
19
85
19
86
19
87
19
88
19
89
19
90
19
91
19
92
19
93
19
94
19
95
19
96
19
97
19
98
19
99
20
00
20
01
20
02
20
03
20
04
20
05
20
06
20
07
20
08
20
09
20
10
20
11
20
12
20
13
-
5,000
10,000
15,000
20,000
25,000
30,000
35,000
ktoe
Petrol Diesel Fuel Oil LPG Kerosene ATF & AVGAS Non-Energy Refinery Gas
1. Petrol 28.0%
2. Diesel 40.8%
3. Fuel Oil 9.9%
4. LPG 8.6%
5. Kerosene 1.1%
6. ATF & AVGAS 6.7%
7. Non-Energy 4.8%
8. Refinery Gas 0.1%
1. Petrol 43.3%
2. Diesel 32.8%
3. Fuel Oil 1.1%
4. LPG 10.1%
5. Kerosene 0.1%
6. ATF & AVGAS 10.3%
7. Non-Energy 2.3%
8. Refinery Gas 0.0%
• E
NE
RG
Y C
ON
SUM
PT
ION
Malaysia Energy Statistics Handbook 2015 43
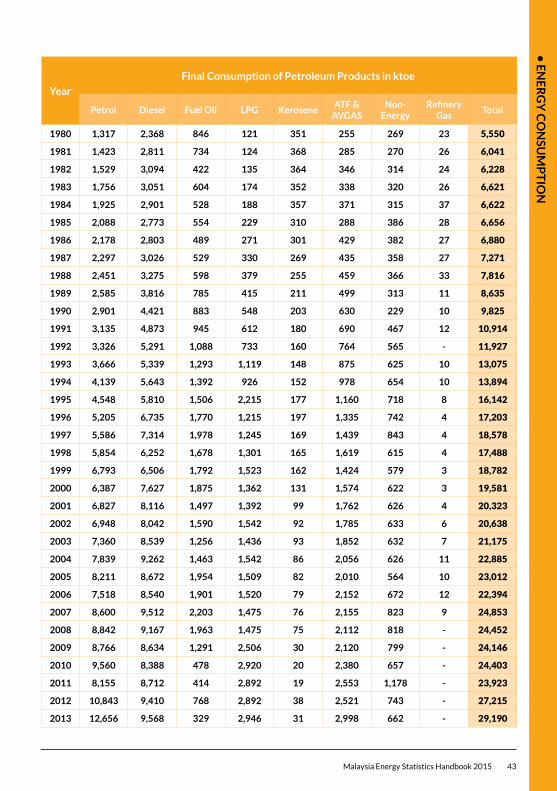
Year
Final Consumption of Petroleum Products in ktoe
Petrol Diesel Fuel Oil LPG KeroseneATF &
AVGASNon-
EnergyRefinery
GasTotal
1980 1,317 2,368 846 121 351 255 269 23 5,550
1981 1,423 2,811 734 124 368 285 270 26 6,041
1982 1,529 3,094 422 135 364 346 314 24 6,228
1983 1,756 3,051 604 174 352 338 320 26 6,621
1984 1,925 2,901 528 188 357 371 315 37 6,622
1985 2,088 2,773 554 229 310 288 386 28 6,656
1986 2,178 2,803 489 271 301 429 382 27 6,880
1987 2,297 3,026 529 330 269 435 358 27 7,271
1988 2,451 3,275 598 379 255 459 366 33 7,816
1989 2,585 3,816 785 415 211 499 313 11 8,635
1990 2,901 4,421 883 548 203 630 229 10 9,825
1991 3,135 4,873 945 612 180 690 467 12 10,914
1992 3,326 5,291 1,088 733 160 764 565 - 11,927
1993 3,666 5,339 1,293 1,119 148 875 625 10 13,075
1994 4,139 5,643 1,392 926 152 978 654 10 13,894
1995 4,548 5,810 1,506 2,215 177 1,160 718 8 16,142
1996 5,205 6,735 1,770 1,215 197 1,335 742 4 17,203
1997 5,586 7,314 1,978 1,245 169 1,439 843 4 18,578
1998 5,854 6,252 1,678 1,301 165 1,619 615 4 17,488
1999 6,793 6,506 1,792 1,523 162 1,424 579 3 18,782
2000 6,387 7,627 1,875 1,362 131 1,574 622 3 19,581
2001 6,827 8,116 1,497 1,392 99 1,762 626 4 20,323
2002 6,948 8,042 1,590 1,542 92 1,785 633 6 20,638
2003 7,360 8,539 1,256 1,436 93 1,852 632 7 21,175
2004 7,839 9,262 1,463 1,542 86 2,056 626 11 22,885
2005 8,211 8,672 1,954 1,509 82 2,010 564 10 23,012
2006 7,518 8,540 1,901 1,520 79 2,152 672 12 22,394
2007 8,600 9,512 2,203 1,475 76 2,155 823 9 24,853
2008 8,842 9,167 1,963 1,475 75 2,112 818 - 24,452
2009 8,766 8,634 1,291 2,506 30 2,120 799 - 24,146
2010 9,560 8,388 478 2,920 20 2,380 657 - 24,403
2011 8,155 8,712 414 2,892 19 2,553 1,178 - 23,923
2012 10,843 9,410 768 2,892 38 2,521 743 - 27,215
2013 12,656 9,568 329 2,946 31 2,998 662 - 29,190
• E
NE
RG
Y C
ON
SUM
PT
ION
44 Malaysia Energy Statistics Handbook 2015
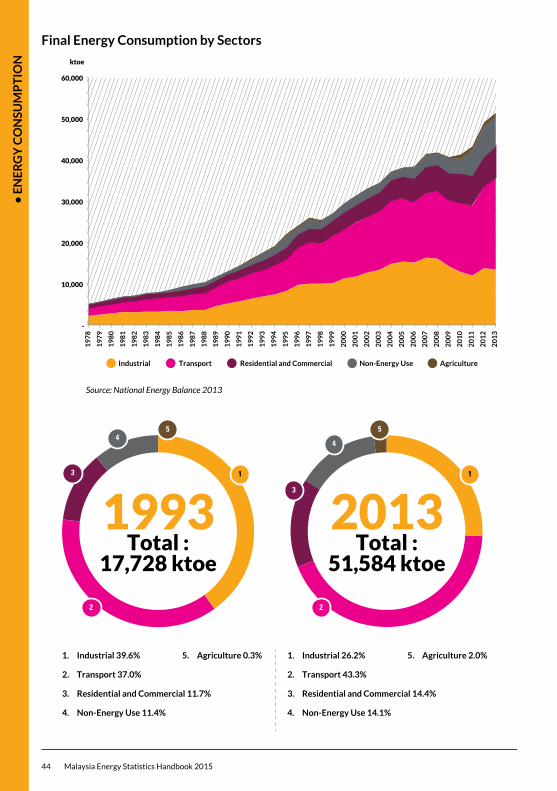
Final Energy Consumption by Sectors
2
13
45
2
1
3
4
5
1993Total :
17,728 ktoe
2013Total :
51,584 ktoe
Source: National Energy Balance 2013
1. Industrial 39.6%
2. Transport 37.0%
3. Residential and Commercial 11.7%
4. Non-Energy Use 11.4%
5. Agriculture 0.3% 1. Industrial 26.2%
2. Transport 43.3%
3. Residential and Commercial 14.4%
4. Non-Energy Use 14.1%
5. Agriculture 2.0%
-
10,000
20,000
30,000
40,000
50,000
60,000
ktoe
19
78
19
79
19
80
19
81
19
82
19
83
19
84
19
85
19
86
19
87
19
88
19
89
19
90
19
91
19
92
19
93
19
94
19
95
19
96
19
97
19
98
19
99
20
00
20
01
20
02
20
03
20
04
20
05
20
06
20
07
20
08
20
09
20
10
20
11
20
12
20
13
Industrial Transport Residential and Commercial Non-Energy Use Agriculture
• E
NE
RG
Y C
ON
SUM
PT
ION
Malaysia Energy Statistics Handbook 2015 45
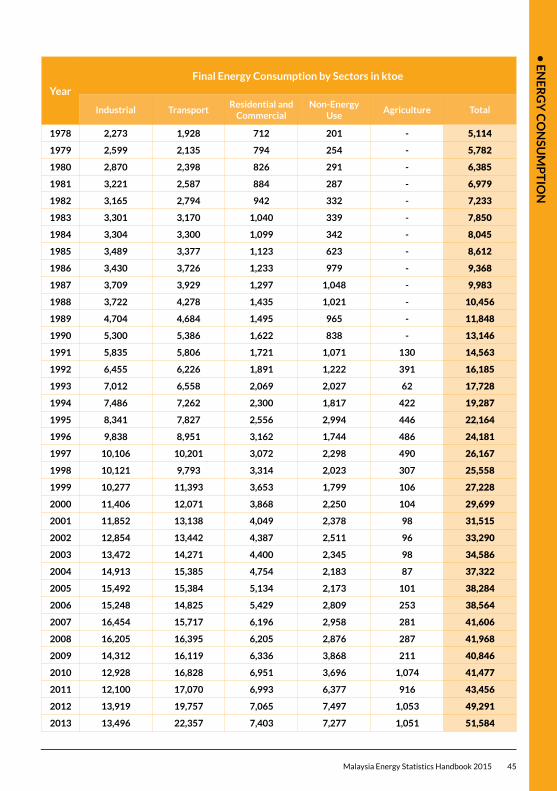
Year
Final Energy Consumption by Sectors in ktoe
Industrial TransportResidential and
CommercialNon-Energy
UseAgriculture Total
1978 2,273 1,928 712 201 - 5,114
1979 2,599 2,135 794 254 - 5,782
1980 2,870 2,398 826 291 - 6,385
1981 3,221 2,587 884 287 - 6,979
1982 3,165 2,794 942 332 - 7,233
1983 3,301 3,170 1,040 339 - 7,850
1984 3,304 3,300 1,099 342 - 8,045
1985 3,489 3,377 1,123 623 - 8,612
1986 3,430 3,726 1,233 979 - 9,368
1987 3,709 3,929 1,297 1,048 - 9,983
1988 3,722 4,278 1,435 1,021 - 10,456
1989 4,704 4,684 1,495 965 - 11,848
1990 5,300 5,386 1,622 838 - 13,146
1991 5,835 5,806 1,721 1,071 130 14,563
1992 6,455 6,226 1,891 1,222 391 16,185
1993 7,012 6,558 2,069 2,027 62 17,728
1994 7,486 7,262 2,300 1,817 422 19,287
1995 8,341 7,827 2,556 2,994 446 22,164
1996 9,838 8,951 3,162 1,744 486 24,181
1997 10,106 10,201 3,072 2,298 490 26,167
1998 10,121 9,793 3,314 2,023 307 25,558
1999 10,277 11,393 3,653 1,799 106 27,228
2000 11,406 12,071 3,868 2,250 104 29,699
2001 11,852 13,138 4,049 2,378 98 31,515
2002 12,854 13,442 4,387 2,511 96 33,290
2003 13,472 14,271 4,400 2,345 98 34,586
2004 14,913 15,385 4,754 2,183 87 37,322
2005 15,492 15,384 5,134 2,173 101 38,284
2006 15,248 14,825 5,429 2,809 253 38,564
2007 16,454 15,717 6,196 2,958 281 41,606
2008 16,205 16,395 6,205 2,876 287 41,968
2009 14,312 16,119 6,336 3,868 211 40,846
2010 12,928 16,828 6,951 3,696 1,074 41,477
2011 12,100 17,070 6,993 6,377 916 43,456
2012 13,919 19,757 7,065 7,497 1,053 49,291
2013 13,496 22,357 7,403 7,277 1,051 51,584

• E
NE
RG
Y B
ALA
NC
ES
46 Malaysia Energy Statistics Handbook 2015
Commercial Energy Balance for Malaysia 2013 (Thousand Tonnes of Oil Equivalent)
ENERGY SOURCE
NA
TU
RA
LG
AS
LNG
CR
UD
E O
IL(1
/)
OT
HE
RS
(2/)
TOTA
LP
ET
RO
LEU
MP
RO
DU
CT
S
PETROLEUM PRODUCTS
CO
AL
&C
OK
E
HY
DR
OP
OW
ER
SOLA
R
BIO
MA
SS
BIO
GA
S
BIO
DIE
SEL
ELE
CT
RIC
ITY
TOTA
L
PE
TR
OL
DIE
SEL
FU
EL
OIL
LPG
KE
RO
SEN
E
AT
F &
AV
GA
S
NO
N-
EN
ER
GY
RE
FIN
ER
Y
GA
S
PRIMARY SUPPLY
1. Primary Production 64,406 0 28,576 0 0 0 0 0 0 0 0 0 0 1,824 2,688 38 297 6 480 0 98,314
2. Gas Flaring, Reinjection & Use -4,395 0 0 0 0 0 0 0 0 0 0 0 0 0 0 0 0 0 0 0 -4,395
3. Imports 7,098 1,450 9,101 8 19,383 8,811 5,106 2,955 422 289 858 942 0 13,909 0 0 0 0 0 19 50,968
4. Exports -1,497 -27,089 -10,785 -38 -11,983 -86 -5,318 -3,039 -340 -538 -572 -2,090 0 -326 0 0 0 0 -178 -2 -51,899
5. Bunkers 0 0 0 0 -349 0 -2 -346 0 0 0 0 0 0 0 0 0 0 0 0 -349
6. Stock Change 0 0 527 0 -1,717 -735 -850 -171 223 -6 -20 -159 0 -107 0 0 0 0 -114 0 -1,411
7. Statistical Discrepancy 0 0 -264 0 0 0 0 0 0 0 0 0 0 -234 0 0 0 0 0 0 -498
8. Primary Supply 65,612 -25,639 27,154 -30 5,334 7,990 -1,064 -601 304 -254 267 -1,307 0 15,067 2,688 38 297 6 188 16 90,730
TRANSFORMATION9. Gas Plants
9.1 LNG -34,938 28,037 0 0 172 0 0 0 172 0 0 0 0 0 0 0 0 0 0 0 -6,729
9.2 MDS -973 0 0 0 478 0 133 0 0 50 0 295 0 0 0 0 0 0 0 0 -494
9.3 GPP-LPG (3&4/) -1,829 0 0 0 1,174 0 0 0 1,174 0 0 0 0 0 0 0 0 0 0 0 -655
Subtotal -37,740 28,037 0 0 1,824 0 133 0 1,346 50 0 295 0 0 0 0 0 0 0 0 -7,879
10. Refineries 0 0 -26,654 30 24,727 4,702 11,063 1,286 1,252 387 2,750 3,089 195 0 0 0 0 0 0 0 -1,897
11. Power Stations & Self-Generation
11.1 Hydro Stations 0 0 0 0 0 0 0 0 0 0 0 0 0 0 -2,688 0 0 0 0 1,003 -1,685
11.2 Thermal Stations -13,520 -1,450 0 0 -1,016 0 -623 -392 0 0 0 0 0 -13,527 0 -38 -164 -6 0 10,627 -19,095
11.3 Self-Generation (5/) -1,650 0 0 0 -23 0 -23 0 0 0 0 0 0 0 0 0 -133 0 0 424 -1,381
Subtotal -15,170 -1,450 0 0 -1,038 0 -646 -392 0 0 0 0 0 -13,527 -2,688 -38 -297 -6 0 12,054 -22,160
12. Losses & Own Use -688 -947 -500 0 -1,617 0 0 -17 0 0 0 -1,405 -195 0 0 0 0 0 0 -978 -4,730
13. Statistical Discrepancy 0 0 0 0 -42 -36 80 52 44 -153 -19 -11 0 0 0 0 0 0 0 -502 -544
14. Secondary Supply -53,597 27,089 -27,154 30 23,854 4,666 10,630 930 2,643 285 2,731 1,969 0 -13,527 -2,688 -19 -161 -4 0 10,573 -35,498
FINAL USE CONSUMPTION
15. Residential 1 0 0 0 736 0 0 0 735 1 0 0 0 0 0 0 0 0 0 2,262 2,999
16. Commercial 22 0 0 0 916 0 217 5 693 0 0 0 0 0 0 0 0 0 0 3,466 4,404
17. Industrial 4,488 0 0 0 2,660 273 1,921 258 179 29 0 0 0 1,539 0 0 0 0 0 4,809 13,496
18. Transport 289 0 0 0 21,856 12,288 6,510 60 0 0 2,998 0 0 0 0 0 0 0 188 20.774 22,354
19. Agriculture 0 0 0 0 6 0 0 6 0 0 0 0 0 0 0 0 0 0 0 32.24 38
20. Fishery 0 0 0 0 1,013 95 918 0 0 0 0 0 0 0 0 0 0 0 0 0 1,013
21. Non-Energy Use 7,215 0 0 0 2,001 0 0 0 1,339 0 0 662 0 0 0 0 0 0 0 0 9,216
22. Total Final Use 12,015 0 0 0 29,188 12,656 9,566 329 2,946 31 2,998 662 0 1,539 0 0 0 0 188 10,590 53,520
ELECTRICITY OUTPUT
Main Activity ProducerGross Electricity Generation - GWh 63,321 0 0 0 5,255 0 2,783 2,472 0 0 0 0 0 53,372 10,586 141 612 23 0 0 133,311AutoproducerGross Electricity Generation - GWh 4,440 0 0 0 84 0 84 0 0 0 0 0 0 0 0 0 496 0 0 0 5,020
1/ Crude production includes Condensates comprising Pentane and Heavier Hydrocarbons. 2/ Others Refer to Non-Crude Energy Forms (consist of Imported Light Diesel, Slop Reprocess, Crude Residuum & Middle East Residue) Which are Used as Refinary Intake. 3/ GPP-LPG Extracts Liquid Products i.e Condensates, Ethane, Butane, Propane from Natural Gas, Ethane is not included under LPG Production. 4/ Butane and Propane as MTBE Feedstocks are Presented as Non-Energy use under LPG column. Ethane is Presented under Natural Gas Column. 5/ Estimated figures based from the Energy Commission, Statistics of Electricity Supply Industry in Malaysia 2013.
Note : Total may not necessarily add up due to rounding

• E
NE
RG
Y B
ALA
NC
ES
Malaysia Energy Statistics Handbook 2015 47
Commercial Energy Balance for Malaysia 2013 (Thousand Tonnes of Oil Equivalent)
ENERGY SOURCE
NA
TU
RA
LG
AS
LNG
CR
UD
E O
IL(1
/)
OT
HE
RS
(2/)
TOTA
LP
ET
RO
LEU
MP
RO
DU
CT
S
PETROLEUM PRODUCTS
CO
AL
&C
OK
E
HY
DR
OP
OW
ER
SOLA
R
BIO
MA
SS
BIO
GA
S
BIO
DIE
SEL
ELE
CT
RIC
ITY
TOTA
L
PE
TR
OL
DIE
SEL
FU
EL
OIL
LPG
KE
RO
SEN
E
AT
F &
AV
GA
S
NO
N-
EN
ER
GY
RE
FIN
ER
Y
GA
S
PRIMARY SUPPLY
1. Primary Production 64,406 0 28,576 0 0 0 0 0 0 0 0 0 0 1,824 2,688 38 297 6 480 0 98,314
2. Gas Flaring, Reinjection & Use -4,395 0 0 0 0 0 0 0 0 0 0 0 0 0 0 0 0 0 0 0 -4,395
3. Imports 7,098 1,450 9,101 8 19,383 8,811 5,106 2,955 422 289 858 942 0 13,909 0 0 0 0 0 19 50,968
4. Exports -1,497 -27,089 -10,785 -38 -11,983 -86 -5,318 -3,039 -340 -538 -572 -2,090 0 -326 0 0 0 0 -178 -2 -51,899
5. Bunkers 0 0 0 0 -349 0 -2 -346 0 0 0 0 0 0 0 0 0 0 0 0 -349
6. Stock Change 0 0 527 0 -1,717 -735 -850 -171 223 -6 -20 -159 0 -107 0 0 0 0 -114 0 -1,411
7. Statistical Discrepancy 0 0 -264 0 0 0 0 0 0 0 0 0 0 -234 0 0 0 0 0 0 -498
8. Primary Supply 65,612 -25,639 27,154 -30 5,334 7,990 -1,064 -601 304 -254 267 -1,307 0 15,067 2,688 38 297 6 188 16 90,730
TRANSFORMATION9. Gas Plants
9.1 LNG -34,938 28,037 0 0 172 0 0 0 172 0 0 0 0 0 0 0 0 0 0 0 -6,729
9.2 MDS -973 0 0 0 478 0 133 0 0 50 0 295 0 0 0 0 0 0 0 0 -494
9.3 GPP-LPG (3&4/) -1,829 0 0 0 1,174 0 0 0 1,174 0 0 0 0 0 0 0 0 0 0 0 -655
Subtotal -37,740 28,037 0 0 1,824 0 133 0 1,346 50 0 295 0 0 0 0 0 0 0 0 -7,879
10. Refineries 0 0 -26,654 30 24,727 4,702 11,063 1,286 1,252 387 2,750 3,089 195 0 0 0 0 0 0 0 -1,897
11. Power Stations & Self-Generation
11.1 Hydro Stations 0 0 0 0 0 0 0 0 0 0 0 0 0 0 -2,688 0 0 0 0 1,003 -1,685
11.2 Thermal Stations -13,520 -1,450 0 0 -1,016 0 -623 -392 0 0 0 0 0 -13,527 0 -38 -164 -6 0 10,627 -19,095
11.3 Self-Generation (5/) -1,650 0 0 0 -23 0 -23 0 0 0 0 0 0 0 0 0 -133 0 0 424 -1,381
Subtotal -15,170 -1,450 0 0 -1,038 0 -646 -392 0 0 0 0 0 -13,527 -2,688 -38 -297 -6 0 12,054 -22,160
12. Losses & Own Use -688 -947 -500 0 -1,617 0 0 -17 0 0 0 -1,405 -195 0 0 0 0 0 0 -978 -4,730
13. Statistical Discrepancy 0 0 0 0 -42 -36 80 52 44 -153 -19 -11 0 0 0 0 0 0 0 -502 -544
14. Secondary Supply -53,597 27,089 -27,154 30 23,854 4,666 10,630 930 2,643 285 2,731 1,969 0 -13,527 -2,688 -19 -161 -4 0 10,573 -35,498
FINAL USE CONSUMPTION
15. Residential 1 0 0 0 736 0 0 0 735 1 0 0 0 0 0 0 0 0 0 2,262 2,999
16. Commercial 22 0 0 0 916 0 217 5 693 0 0 0 0 0 0 0 0 0 0 3,466 4,404
17. Industrial 4,488 0 0 0 2,660 273 1,921 258 179 29 0 0 0 1,539 0 0 0 0 0 4,809 13,496
18. Transport 289 0 0 0 21,856 12,288 6,510 60 0 0 2,998 0 0 0 0 0 0 0 188 20.774 22,354
19. Agriculture 0 0 0 0 6 0 0 6 0 0 0 0 0 0 0 0 0 0 0 32.24 38
20. Fishery 0 0 0 0 1,013 95 918 0 0 0 0 0 0 0 0 0 0 0 0 0 1,013
21. Non-Energy Use 7,215 0 0 0 2,001 0 0 0 1,339 0 0 662 0 0 0 0 0 0 0 0 9,216
22. Total Final Use 12,015 0 0 0 29,188 12,656 9,566 329 2,946 31 2,998 662 0 1,539 0 0 0 0 188 10,590 53,520
ELECTRICITY OUTPUT
Main Activity ProducerGross Electricity Generation - GWh 63,321 0 0 0 5,255 0 2,783 2,472 0 0 0 0 0 53,372 10,586 141 612 23 0 0 133,311AutoproducerGross Electricity Generation - GWh 4,440 0 0 0 84 0 84 0 0 0 0 0 0 0 0 0 496 0 0 0 5,020
1/ Crude production includes Condensates comprising Pentane and Heavier Hydrocarbons. 2/ Others Refer to Non-Crude Energy Forms (consist of Imported Light Diesel, Slop Reprocess, Crude Residuum & Middle East Residue) Which are Used as Refinary Intake. 3/ GPP-LPG Extracts Liquid Products i.e Condensates, Ethane, Butane, Propane from Natural Gas, Ethane is not included under LPG Production. 4/ Butane and Propane as MTBE Feedstocks are Presented as Non-Energy use under LPG column. Ethane is Presented under Natural Gas Column. 5/ Estimated figures based from the Energy Commission, Statistics of Electricity Supply Industry in Malaysia 2013.
Note : Total may not necessarily add up due to rounding
• E
NE
RG
Y B
ALA
NC
ES
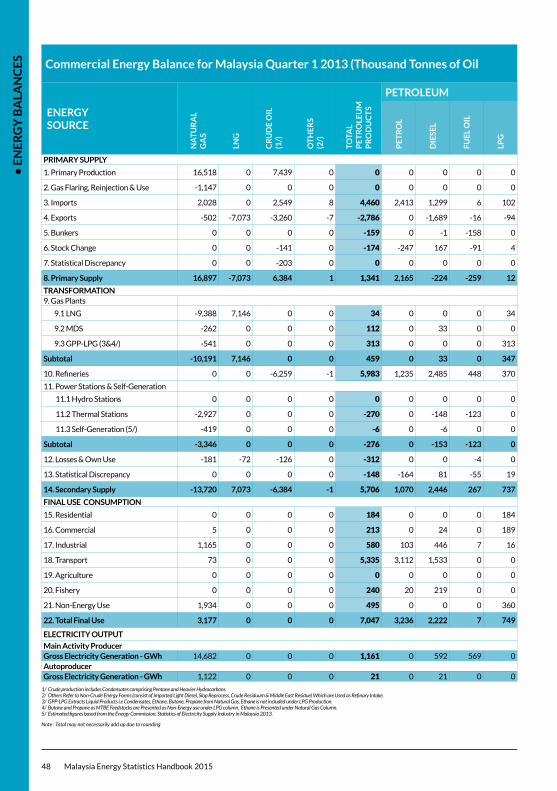
48 Malaysia Energy Statistics Handbook 2015
Commercial Energy Balance for Malaysia Quarter 1 2013 (Thousand Tonnes of Oil Equivalent)
ENERGY SOURCE
NA
TU
RA
LG
AS
LNG
CR
UD
E O
IL(1
/)
OT
HE
RS
(2/)
TOTA
LP
ET
RO
LEU
MP
RO
DU
CT
S
PETROLEUM PRODUCTS
CO
AL
&C
OK
E
HY
DR
OP
OW
ER
SOLA
R
BIO
MA
SS
BIO
GA
S
BIO
DIE
SEL
ELE
CT
RIC
ITY
TOTA
L
PE
TR
OL
DIE
SEL
FU
EL
OIL
LPG
KE
RO
SEN
E
AT
F &
AV
GA
S
NO
N-
EN
ER
GY
RE
FIN
ER
Y
GA
S
PRIMARY SUPPLY
1. Primary Production 16,518 0 7,439 0 0 0 0 0 0 0 0 0 0 450 572 9 94 1 90 0 25,174
2. Gas Flaring, Reinjection & Use -1,147 0 0 0 0 0 0 0 0 0 0 0 0 0 0 0 0 0 0 0 -1,147
3. Imports 2,028 0 2,549 8 4,460 2,413 1,299 6 102 145 220 276 0 3,395 0 0 0 0 0 0 12,440
4. Exports -502 -7,073 -3,260 -7 -2,786 0 -1,689 -16 -94 -176 -128 -683 0 -71 0 0 0 0 -32 0 -13,731
5. Bunkers 0 0 0 0 -159 0 -1 -158 0 0 0 0 0 0 0 0 0 0 0 0 -159
6. Stock Change 0 0 -141 0 -174 -247 167 -91 4 -8 35 -33 0 235 0 0 0 0 -23 0 -102
7. Statistical Discrepancy 0 0 -203 0 0 0 0 0 0 0 0 0 0 -96 0 0 0 0 0 0 -299
8. Primary Supply 16,897 -7,073 6,384 1 1,341 2,165 -224 -259 12 -39 126 -440 0 3,914 572 9 94 1 36 0 22,176
TRANSFORMATION9. Gas Plants
9.1 LNG -9,388 7,146 0 0 34 0 0 0 34 0 0 0 0 0 0 0 0 0 0 0 -2,208
9.2 MDS -262 0 0 0 112 0 33 0 0 12 0 67 0 0 0 0 0 0 0 0 -150
9.3 GPP-LPG (3&4/) -541 0 0 0 313 0 0 0 313 0 0 0 0 0 0 0 0 0 0 0 -228
Subtotal -10,191 7,146 0 0 459 0 33 0 347 12 0 67 0 0 0 0 0 0 0 0 -2,587
10. Refineries 0 0 -6,259 -1 5,983 1,235 2,485 448 370 103 532 760 49 0 0 0 0 0 0 0 -277
11. Power Stations & Self-Generation
11.1 Hydro Stations 0 0 0 0 0 0 0 0 0 0 0 0 0 0 -572 0 0 0 0 213 -359
11.2 Thermal Stations -2,927 0 0 0 -270 0 -148 -123 0 0 0 0 0 -3,559 0 -9 -41 -2 0 2,556 -4,253
11.3 Self-Generation (5/) -419 0 0 0 -6 0 -6 0 0 0 0 0 0 0 0 0 -53 0 0 107 -370
Subtotal -3,346 0 0 0 -276 0 -153 -123 0 0 0 0 0 -3,559 -572 -9 -94 -2 0 2,876 -4,982
12. Losses & Own Use -181 -72 -126 0 -312 0 0 -4 0 0 0 -258 -49 0 0 0 0 0 0 -215 -906
13. Statistical Discrepancy 0 0 0 0 -148 -164 81 -55 19 -69 33 7 0 0 0 0 0 0 0 -129 -277
14. Secondary Supply -13,720 7,073 -6,384 -1 5,706 1,070 2,446 267 737 46 565 575 0 -3,559 -572 -9 -94 -2 0 2,533 -8,925
FINAL USE CONSUMPTION
15. Residential 0 0 0 0 184 0 0 0 184 0 0 0 0 0 0 0 0 0 0 546 730
16. Commercial 5 0 0 0 213 0 24 0 189 0 0 0 0 0 0 0 0 0 0 831 1,050
17. Industrial 1,165 0 0 0 580 103 446 7 16 7 0 0 0 355 0 0 0 0 0 1,143 3,243
18. Transport 73 0 0 0 5,335 3,112 1,533 0 0 0 691 0 0 0 0 0 0 0 36 5 5,449
19. Agriculture 0 0 0 0 0 0 0 0 0 0 0 0 0 0 0 0 0 0 0 7 7
20. Fishery 0 0 0 0 240 20 219 0 0 0 0 0 0 0 0 0 0 0 0 0 240
21. Non-Energy Use 1,934 0 0 0 495 0 0 0 360 0 0 135 0 0 0 0 0 0 0 0 2,429
22. Total Final Use 3,177 0 0 0 7,047 3,236 2,222 7 749 7 691 135 0 355 0 0 0 0 36 2,532 13,147
ELECTRICITY OUTPUT
Main Activity ProducerGross Electricity Generation - GWh 14,682 0 0 0 1,161 0 592 569 0 0 0 0 0 13,896 2,488 35 153 6 0 0 32,422AutoproducerGross Electricity Generation - GWh 1,122 0 0 0 21 0 21 0 0 0 0 0 0 0 0 0 196 0 0 0 1,338
1/ Crude production includes Condensates comprising Pentane and Heavier Hydrocarbons. 2/ Others Refer to Non-Crude Energy Forms (consist of Imported Light Diesel, Slop Reprocess, Crude Residuum & Middle East Residue) Which are Used as Refinary Intake. 3/ GPP-LPG Extracts Liquid Products i.e Condensates, Ethane, Butane, Propane from Natural Gas, Ethane is not included under LPG Production. 4/ Butane and Propane as MTBE Feedstocks are Presented as Non-Energy use under LPG column. Ethane is Presented under Natural Gas Column. 5/ Estimated figures based from the Energy Commission, Statistics of Electricity Supply Industry in Malaysia 2013.
Note : Total may not necessarily add up due to rounding

• E
NE
RG
Y B
ALA
NC
ES
Malaysia Energy Statistics Handbook 2015 49
Commercial Energy Balance for Malaysia Quarter 1 2013 (Thousand Tonnes of Oil Equivalent)
ENERGY SOURCE
NA
TU
RA
LG
AS
LNG
CR
UD
E O
IL(1
/)
OT
HE
RS
(2/)
TOTA
LP
ET
RO
LEU
MP
RO
DU
CT
S
PETROLEUM PRODUCTS
CO
AL
&C
OK
E
HY
DR
OP
OW
ER
SOLA
R
BIO
MA
SS
BIO
GA
S
BIO
DIE
SEL
ELE
CT
RIC
ITY
TOTA
L
PE
TR
OL
DIE
SEL
FU
EL
OIL
LPG
KE
RO
SEN
E
AT
F &
AV
GA
S
NO
N-
EN
ER
GY
RE
FIN
ER
Y
GA
S
PRIMARY SUPPLY
1. Primary Production 16,518 0 7,439 0 0 0 0 0 0 0 0 0 0 450 572 9 94 1 90 0 25,174
2. Gas Flaring, Reinjection & Use -1,147 0 0 0 0 0 0 0 0 0 0 0 0 0 0 0 0 0 0 0 -1,147
3. Imports 2,028 0 2,549 8 4,460 2,413 1,299 6 102 145 220 276 0 3,395 0 0 0 0 0 0 12,440
4. Exports -502 -7,073 -3,260 -7 -2,786 0 -1,689 -16 -94 -176 -128 -683 0 -71 0 0 0 0 -32 0 -13,731
5. Bunkers 0 0 0 0 -159 0 -1 -158 0 0 0 0 0 0 0 0 0 0 0 0 -159
6. Stock Change 0 0 -141 0 -174 -247 167 -91 4 -8 35 -33 0 235 0 0 0 0 -23 0 -102
7. Statistical Discrepancy 0 0 -203 0 0 0 0 0 0 0 0 0 0 -96 0 0 0 0 0 0 -299
8. Primary Supply 16,897 -7,073 6,384 1 1,341 2,165 -224 -259 12 -39 126 -440 0 3,914 572 9 94 1 36 0 22,176
TRANSFORMATION9. Gas Plants
9.1 LNG -9,388 7,146 0 0 34 0 0 0 34 0 0 0 0 0 0 0 0 0 0 0 -2,208
9.2 MDS -262 0 0 0 112 0 33 0 0 12 0 67 0 0 0 0 0 0 0 0 -150
9.3 GPP-LPG (3&4/) -541 0 0 0 313 0 0 0 313 0 0 0 0 0 0 0 0 0 0 0 -228
Subtotal -10,191 7,146 0 0 459 0 33 0 347 12 0 67 0 0 0 0 0 0 0 0 -2,587
10. Refineries 0 0 -6,259 -1 5,983 1,235 2,485 448 370 103 532 760 49 0 0 0 0 0 0 0 -277
11. Power Stations & Self-Generation
11.1 Hydro Stations 0 0 0 0 0 0 0 0 0 0 0 0 0 0 -572 0 0 0 0 213 -359
11.2 Thermal Stations -2,927 0 0 0 -270 0 -148 -123 0 0 0 0 0 -3,559 0 -9 -41 -2 0 2,556 -4,253
11.3 Self-Generation (5/) -419 0 0 0 -6 0 -6 0 0 0 0 0 0 0 0 0 -53 0 0 107 -370
Subtotal -3,346 0 0 0 -276 0 -153 -123 0 0 0 0 0 -3,559 -572 -9 -94 -2 0 2,876 -4,982
12. Losses & Own Use -181 -72 -126 0 -312 0 0 -4 0 0 0 -258 -49 0 0 0 0 0 0 -215 -906
13. Statistical Discrepancy 0 0 0 0 -148 -164 81 -55 19 -69 33 7 0 0 0 0 0 0 0 -129 -277
14. Secondary Supply -13,720 7,073 -6,384 -1 5,706 1,070 2,446 267 737 46 565 575 0 -3,559 -572 -9 -94 -2 0 2,533 -8,925
FINAL USE CONSUMPTION
15. Residential 0 0 0 0 184 0 0 0 184 0 0 0 0 0 0 0 0 0 0 546 730
16. Commercial 5 0 0 0 213 0 24 0 189 0 0 0 0 0 0 0 0 0 0 831 1,050
17. Industrial 1,165 0 0 0 580 103 446 7 16 7 0 0 0 355 0 0 0 0 0 1,143 3,243
18. Transport 73 0 0 0 5,335 3,112 1,533 0 0 0 691 0 0 0 0 0 0 0 36 5 5,449
19. Agriculture 0 0 0 0 0 0 0 0 0 0 0 0 0 0 0 0 0 0 0 7 7
20. Fishery 0 0 0 0 240 20 219 0 0 0 0 0 0 0 0 0 0 0 0 0 240
21. Non-Energy Use 1,934 0 0 0 495 0 0 0 360 0 0 135 0 0 0 0 0 0 0 0 2,429
22. Total Final Use 3,177 0 0 0 7,047 3,236 2,222 7 749 7 691 135 0 355 0 0 0 0 36 2,532 13,147
ELECTRICITY OUTPUT
Main Activity ProducerGross Electricity Generation - GWh 14,682 0 0 0 1,161 0 592 569 0 0 0 0 0 13,896 2,488 35 153 6 0 0 32,422AutoproducerGross Electricity Generation - GWh 1,122 0 0 0 21 0 21 0 0 0 0 0 0 0 0 0 196 0 0 0 1,338
1/ Crude production includes Condensates comprising Pentane and Heavier Hydrocarbons. 2/ Others Refer to Non-Crude Energy Forms (consist of Imported Light Diesel, Slop Reprocess, Crude Residuum & Middle East Residue) Which are Used as Refinary Intake. 3/ GPP-LPG Extracts Liquid Products i.e Condensates, Ethane, Butane, Propane from Natural Gas, Ethane is not included under LPG Production. 4/ Butane and Propane as MTBE Feedstocks are Presented as Non-Energy use under LPG column. Ethane is Presented under Natural Gas Column. 5/ Estimated figures based from the Energy Commission, Statistics of Electricity Supply Industry in Malaysia 2013.
Note : Total may not necessarily add up due to rounding
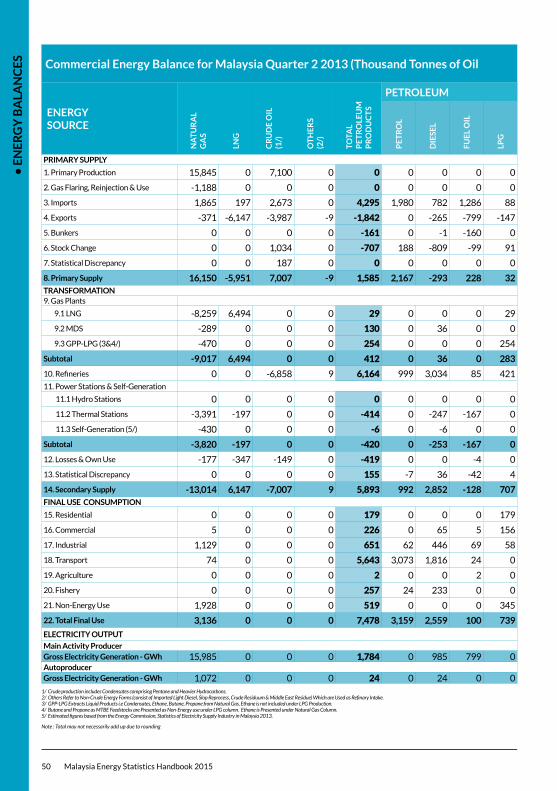
• E
NE
RG
Y B
ALA
NC
ES
50 Malaysia Energy Statistics Handbook 2015
Commercial Energy Balance for Malaysia Quarter 2 2013 (Thousand Tonnes of Oil Equivalent)
ENERGY SOURCE
NA
TU
RA
LG
AS
LNG
CR
UD
E O
IL(1
/)
OT
HE
RS
(2/)
TOTA
LP
ET
RO
LEU
MP
RO
DU
CT
S
PETROLEUM PRODUCTS
CO
AL
&C
OK
E
HY
DR
OP
OW
ER
SOLA
R
BIO
MA
SS
BIO
GA
S
BIO
DIE
SEL
ELE
CT
RIC
ITY
TOTA
L
PE
TR
OL
DIE
SEL
FU
EL
OIL
LPG
KE
RO
SEN
E
AT
F &
AV
GA
S
NO
N-
EN
ER
GY
RE
FIN
ER
Y
GA
S
PRIMARY SUPPLY
1. Primary Production 15,845 0 7,100 0 0 0 0 0 0 0 0 0 0 475 683 9 67 2 124 0 24,305
2. Gas Flaring, Reinjection & Use -1,188 0 0 0 0 0 0 0 0 0 0 0 0 0 0 0 0 0 0 0 -1,188
3. Imports 1,865 197 2,673 0 4,295 1,980 782 1,286 88 0 52 107 0 3,835 0 0 0 0 0 19 12,883
4. Exports -371 -6,147 -3,987 -9 -1,842 0 -265 -799 -147 -176 -73 -383 0 -112 0 0 0 0 -50 0 -12,518
5. Bunkers 0 0 0 0 -161 0 -1 -160 0 0 0 0 0 0 0 0 0 0 0 0 -161
6. Stock Change 0 0 1,034 0 -707 188 -809 -99 91 1 -71 -8 0 -236 0 0 0 0 -34 0 57
7. Statistical Discrepancy 0 0 187 0 0 0 0 0 0 0 0 0 0 -89 0 0 0 0 0 0 97
8. Primary Supply 16,150 -5,951 7,007 -9 1,585 2,167 -293 228 32 -175 -92 -283 0 3,872 683 9 67 2 41 19 23,475TRANSFORMATION9. Gas Plants
9.1 LNG -8,259 6,494 0 0 29 0 0 0 29 0 0 0 0 0 0 0 0 0 0 0 -1,735
9.2 MDS -289 0 0 0 130 0 36 0 0 12 0 81 0 0 0 0 0 0 0 0 -159
9.3 GPP-LPG (3&4/) -470 0 0 0 254 0 0 0 254 0 0 0 0 0 0 0 0 0 0 0 -216
Subtotal -9,017 6,494 0 0 412 0 36 0 283 12 0 81 0 0 0 0 0 0 0 0 -2,111
10. Refineries 0 0 -6,858 9 6,164 999 3,034 85 421 93 785 701 47 0 0 0 0 0 0 0 -68411. Power Stations & Self-Generation
11.1 Hydro Stations 0 0 0 0 0 0 0 0 0 0 0 0 0 0 -683 0 0 0 0 255 -428
11.2 Thermal Stations -3,391 -197 0 0 -414 0 -247 -167 0 0 0 0 0 -3,508 0 -9 -41 -2 0 2,710 -4,850
11.3 Self-Generation (5/) -430 0 0 0 -6 0 -6 0 0 0 0 0 0 0 0 0 -26 0 0 103 -360
Subtotal -3,820 -197 0 0 -420 0 -253 -167 0 0 0 0 0 -3,508 -683 -9 -67 -2 0 3,068 -5,638
12. Losses & Own Use -177 -347 -149 0 -419 0 0 -4 0 0 0 -368 -47 0 0 0 0 0 0 -231 -1,323
13. Statistical Discrepancy 0 0 0 0 155 -7 36 -42 4 85 37 43 0 0 0 0 0 0 0 -144 11
14. Secondary Supply -13,014 6,147 -7,007 9 5,893 992 2,852 -128 707 190 822 458 0 -3,508 -683 -9 -67 -2 0 2,693 -9,548FINAL USE CONSUMPTION
15. Residential 0 0 0 0 179 0 0 0 179 0 0 0 0 0 0 0 0 0 0 574 754
16. Commercial 5 0 0 0 226 0 65 5 156 0 0 0 0 0 0 0 0 0 0 887 1,119
17. Industrial 1,129 0 0 0 651 62 446 69 58 16 0 0 0 364 0 0 0 0 0 1,236 3,379
18. Transport 74 0 0 0 5,643 3,073 1,816 24 0 0 731 0 0 0 0 0 0 0 41 5 5,763
19. Agriculture 0 0 0 0 2 0 0 2 0 0 0 0 0 0 0 0 0 0 0 8 10
20. Fishery 0 0 0 0 257 24 233 0 0 0 0 0 0 0 0 0 0 0 0 0 257
21. Non-Energy Use 1,928 0 0 0 519 0 0 0 345 0 0 174 0 0 0 0 0 0 0 0 2,448
22. Total Final Use 3,136 0 0 0 7,478 3,159 2,559 100 739 16 731 174 0 364 0 0 0 0 41 2,711 13,730
ELECTRICITY OUTPUT
Main Activity ProducerGross Electricity Generation - GWh 15,985 0 0 0 1,784 0 985 799 0 0 0 0 0 13,763 2,980 35 153 6 0 0 34,705AutoproducerGross Electricity Generation - GWh 1,072 0 0 0 24 0 24 0 0 0 0 0 0 0 0 0 99 0 0 0 1,195
1/ Crude production includes Condensates comprising Pentane and Heavier Hydrocarbons. 2/ Others Refer to Non-Crude Energy Forms (consist of Imported Light Diesel, Slop Reprocess, Crude Residuum & Middle East Residue) Which are Used as Refinary Intake. 3/ GPP-LPG Extracts Liquid Products i.e Condensates, Ethane, Butane, Propane from Natural Gas, Ethane is not included under LPG Production. 4/ Butane and Propane as MTBE Feedstocks are Presented as Non-Energy use under LPG column. Ethane is Presented under Natural Gas Column. 5/ Estimated figures based from the Energy Commission, Statistics of Electricity Supply Industry in Malaysia 2013.
Note : Total may not necessarily add up due to rounding
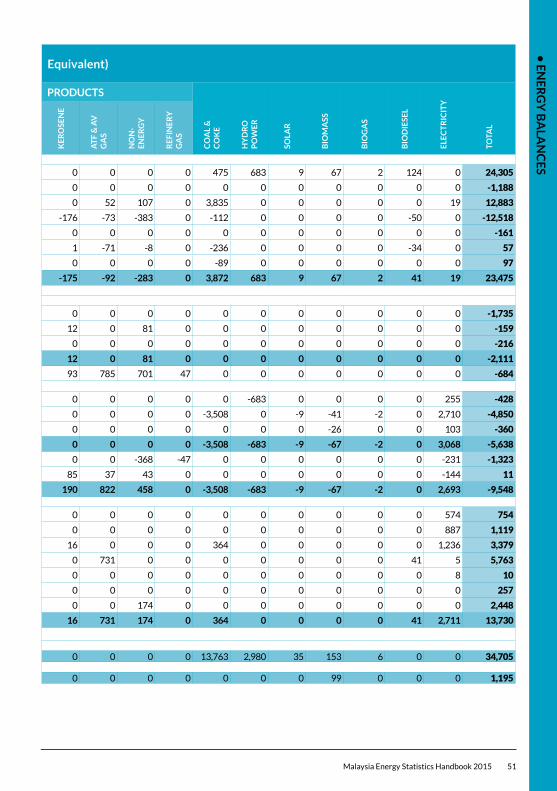
• E
NE
RG
Y B
ALA
NC
ES
Malaysia Energy Statistics Handbook 2015 51
Commercial Energy Balance for Malaysia Quarter 2 2013 (Thousand Tonnes of Oil Equivalent)
ENERGY SOURCE
NA
TU
RA
LG
AS
LNG
CR
UD
E O
IL(1
/)
OT
HE
RS
(2/)
TOTA
LP
ET
RO
LEU
MP
RO
DU
CT
S
PETROLEUM PRODUCTS
CO
AL
&C
OK
E
HY
DR
OP
OW
ER
SOLA
R
BIO
MA
SS
BIO
GA
S
BIO
DIE
SEL
ELE
CT
RIC
ITY
TOTA
L
PE
TR
OL
DIE
SEL
FU
EL
OIL
LPG
KE
RO
SEN
E
AT
F &
AV
GA
S
NO
N-
EN
ER
GY
RE
FIN
ER
Y
GA
S
PRIMARY SUPPLY
1. Primary Production 15,845 0 7,100 0 0 0 0 0 0 0 0 0 0 475 683 9 67 2 124 0 24,305
2. Gas Flaring, Reinjection & Use -1,188 0 0 0 0 0 0 0 0 0 0 0 0 0 0 0 0 0 0 0 -1,188
3. Imports 1,865 197 2,673 0 4,295 1,980 782 1,286 88 0 52 107 0 3,835 0 0 0 0 0 19 12,883
4. Exports -371 -6,147 -3,987 -9 -1,842 0 -265 -799 -147 -176 -73 -383 0 -112 0 0 0 0 -50 0 -12,518
5. Bunkers 0 0 0 0 -161 0 -1 -160 0 0 0 0 0 0 0 0 0 0 0 0 -161
6. Stock Change 0 0 1,034 0 -707 188 -809 -99 91 1 -71 -8 0 -236 0 0 0 0 -34 0 57
7. Statistical Discrepancy 0 0 187 0 0 0 0 0 0 0 0 0 0 -89 0 0 0 0 0 0 97
8. Primary Supply 16,150 -5,951 7,007 -9 1,585 2,167 -293 228 32 -175 -92 -283 0 3,872 683 9 67 2 41 19 23,475TRANSFORMATION9. Gas Plants
9.1 LNG -8,259 6,494 0 0 29 0 0 0 29 0 0 0 0 0 0 0 0 0 0 0 -1,735
9.2 MDS -289 0 0 0 130 0 36 0 0 12 0 81 0 0 0 0 0 0 0 0 -159
9.3 GPP-LPG (3&4/) -470 0 0 0 254 0 0 0 254 0 0 0 0 0 0 0 0 0 0 0 -216
Subtotal -9,017 6,494 0 0 412 0 36 0 283 12 0 81 0 0 0 0 0 0 0 0 -2,111
10. Refineries 0 0 -6,858 9 6,164 999 3,034 85 421 93 785 701 47 0 0 0 0 0 0 0 -68411. Power Stations & Self-Generation
11.1 Hydro Stations 0 0 0 0 0 0 0 0 0 0 0 0 0 0 -683 0 0 0 0 255 -428
11.2 Thermal Stations -3,391 -197 0 0 -414 0 -247 -167 0 0 0 0 0 -3,508 0 -9 -41 -2 0 2,710 -4,850
11.3 Self-Generation (5/) -430 0 0 0 -6 0 -6 0 0 0 0 0 0 0 0 0 -26 0 0 103 -360
Subtotal -3,820 -197 0 0 -420 0 -253 -167 0 0 0 0 0 -3,508 -683 -9 -67 -2 0 3,068 -5,638
12. Losses & Own Use -177 -347 -149 0 -419 0 0 -4 0 0 0 -368 -47 0 0 0 0 0 0 -231 -1,323
13. Statistical Discrepancy 0 0 0 0 155 -7 36 -42 4 85 37 43 0 0 0 0 0 0 0 -144 11
14. Secondary Supply -13,014 6,147 -7,007 9 5,893 992 2,852 -128 707 190 822 458 0 -3,508 -683 -9 -67 -2 0 2,693 -9,548FINAL USE CONSUMPTION
15. Residential 0 0 0 0 179 0 0 0 179 0 0 0 0 0 0 0 0 0 0 574 754
16. Commercial 5 0 0 0 226 0 65 5 156 0 0 0 0 0 0 0 0 0 0 887 1,119
17. Industrial 1,129 0 0 0 651 62 446 69 58 16 0 0 0 364 0 0 0 0 0 1,236 3,379
18. Transport 74 0 0 0 5,643 3,073 1,816 24 0 0 731 0 0 0 0 0 0 0 41 5 5,763
19. Agriculture 0 0 0 0 2 0 0 2 0 0 0 0 0 0 0 0 0 0 0 8 10
20. Fishery 0 0 0 0 257 24 233 0 0 0 0 0 0 0 0 0 0 0 0 0 257
21. Non-Energy Use 1,928 0 0 0 519 0 0 0 345 0 0 174 0 0 0 0 0 0 0 0 2,448
22. Total Final Use 3,136 0 0 0 7,478 3,159 2,559 100 739 16 731 174 0 364 0 0 0 0 41 2,711 13,730
ELECTRICITY OUTPUT
Main Activity ProducerGross Electricity Generation - GWh 15,985 0 0 0 1,784 0 985 799 0 0 0 0 0 13,763 2,980 35 153 6 0 0 34,705AutoproducerGross Electricity Generation - GWh 1,072 0 0 0 24 0 24 0 0 0 0 0 0 0 0 0 99 0 0 0 1,195
1/ Crude production includes Condensates comprising Pentane and Heavier Hydrocarbons. 2/ Others Refer to Non-Crude Energy Forms (consist of Imported Light Diesel, Slop Reprocess, Crude Residuum & Middle East Residue) Which are Used as Refinary Intake. 3/ GPP-LPG Extracts Liquid Products i.e Condensates, Ethane, Butane, Propane from Natural Gas, Ethane is not included under LPG Production. 4/ Butane and Propane as MTBE Feedstocks are Presented as Non-Energy use under LPG column. Ethane is Presented under Natural Gas Column. 5/ Estimated figures based from the Energy Commission, Statistics of Electricity Supply Industry in Malaysia 2013.
Note : Total may not necessarily add up due to rounding
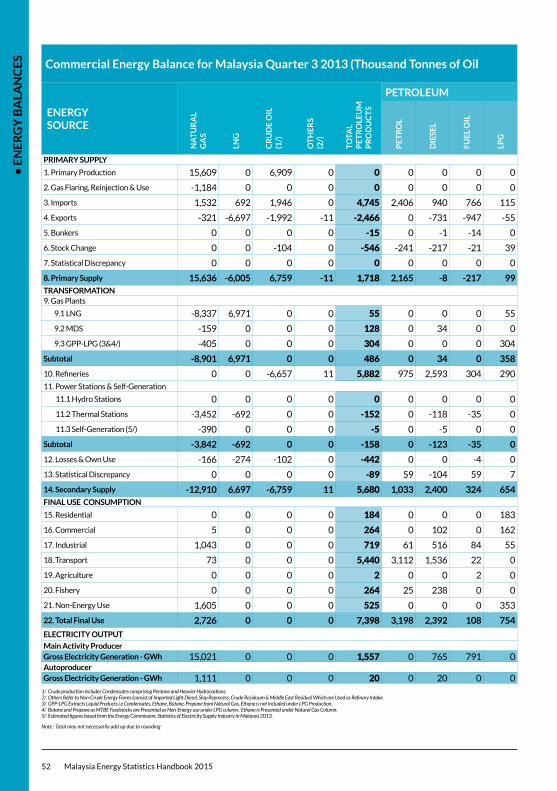
• E
NE
RG
Y B
ALA
NC
ES
52 Malaysia Energy Statistics Handbook 2015
Commercial Energy Balance for Malaysia Quarter 3 2013 (Thousand Tonnes of Oil Equivalent)
ENERGY SOURCE
NA
TU
RA
LG
AS
LNG
CR
UD
E O
IL(1
/)
OT
HE
RS
(2/)
TOTA
LP
ET
RO
LEU
MP
RO
DU
CT
S
PETROLEUM PRODUCTS
CO
AL
&C
OK
E
HY
DR
OP
OW
ER
SOLA
R
BIO
MA
SS
BIO
GA
S
BIO
DIE
SEL
ELE
CT
RIC
ITY
TOTA
L
PE
TR
OL
DIE
SEL
FU
EL
OIL
LPG
KE
RO
SEN
E
AT
F &
AV
GA
S
NO
N-
EN
ER
GY
RE
FIN
ER
Y
GA
S
PRIMARY SUPPLY
1. Primary Production 15,609 0 6,909 0 0 0 0 0 0 0 0 0 0 432 633 9 66 2 129 0 23,789
2. Gas Flaring, Reinjection & Use -1,184 0 0 0 0 0 0 0 0 0 0 0 0 0 0 0 0 0 0 0 -1,184
3. Imports 1,532 692 1,946 0 4,745 2,406 940 766 115 0 262 255 0 3,638 0 0 0 0 0 0 12,553
4. Exports -321 -6,697 -1,992 -11 -2,466 0 -731 -947 -55 -11 -225 -496 0 -56 0 0 0 0 -56 -1 -11,600
5. Bunkers 0 0 0 0 -15 0 -1 -14 0 0 0 0 0 0 0 0 0 0 0 0 -15
6. Stock Change 0 0 -104 0 -546 -241 -217 -21 39 -1 26 -132 0 -241 0 0 0 0 -19 0 -910
7. Statistical Discrepancy 0 0 0 0 0 0 0 0 0 0 0 0 0 35 0 0 0 0 0 0 35
8. Primary Supply 15,636 -6,005 6,759 -11 1,718 2,165 -8 -217 99 -12 63 -373 0 3,808 633 9 66 2 54 -1 22,668TRANSFORMATION9. Gas Plants
9.1 LNG -8,337 6,971 0 0 55 0 0 0 55 0 0 0 0 0 0 0 0 0 0 0 -1,312
9.2 MDS -159 0 0 0 128 0 34 0 0 14 0 80 0 0 0 0 0 0 0 0 -31
9.3 GPP-LPG (3&4/) -405 0 0 0 304 0 0 0 304 0 0 0 0 0 0 0 0 0 0 0 -102
Subtotal -8,901 6,971 0 0 486 0 34 0 358 14 0 80 0 0 0 0 0 0 0 0 -1,445
10. Refineries 0 0 -6,657 11 5,882 975 2,593 304 290 95 707 870 49 0 0 0 0 0 0 0 -76411. Power Stations & Self-Generation
11.1 Hydro Stations 0 0 0 0 0 0 0 0 0 0 0 0 0 0 -633 0 0 0 0 249 -384
11.2 Thermal Stations -3,452 -692 0 0 -152 0 -118 -35 0 0 0 0 0 -3,409 0 -9 -40 -2 0 2,815 -4,941
11.3 Self-Generation (5/) -390 0 0 0 -5 0 -5 0 0 0 0 0 0 0 0 0 -26 0 0 106 -315
Subtotal -3,842 -692 0 0 -158 0 -123 -35 0 0 0 0 0 -3,409 -633 -9 -66 -2 0 3,170 -5,640
12. Losses & Own Use -166 -274 -102 0 -442 0 0 -4 0 0 0 -389 -49 0 0 0 0 0 0 -310 -1,293
13. Statistical Discrepancy 0 0 0 0 -89 59 -104 59 7 -93 0 -16 0 0 0 0 0 0 0 -186 -275
14. Secondary Supply -12,910 6,697 -6,759 11 5,680 1,033 2,400 324 654 16 707 544 0 -3,409 -633 0 0 0 0 2,674 -8,648FINAL USE CONSUMPTION
15. Residential 0 0 0 0 184 0 0 0 183 0 0 0 0 0 0 0 0 0 0 584 768
16. Commercial 5 0 0 0 264 0 102 0 162 0 0 0 0 0 0 0 0 0 0 877 1,147
17. Industrial 1,043 0 0 0 719 61 516 84 55 4 0 0 0 400 0 0 0 0 0 1,198 3,360
18. Transport 73 0 0 0 5,440 3,112 1,536 22 0 0 771 0 0 0 0 0 0 0 54 5 5,572
19. Agriculture 0 0 0 0 2 0 0 2 0 0 0 0 0 0 0 0 0 0 0 8 11
20. Fishery 0 0 0 0 264 25 238 0 0 0 0 0 0 0 0 0 0 0 0 0 264
21. Non-Energy Use 1,605 0 0 0 525 0 0 0 353 0 0 172 0 0 0 0 0 0 0 0 2,130
22. Total Final Use 2,726 0 0 0 7,398 3,198 2,392 108 754 4 771 172 0 400 0 0 0 0 54 2,673 13,251
ELECTRICITY OUTPUT
Main Activity ProducerGross Electricity Generation - GWh 15,021 0 0 0 1,557 0 765 791 0 0 0 0 0 13,474 1,796 35 153 6 0 0 32,041AutoproducerGross Electricity Generation - GWh 1,111 0 0 0 20 0 20 0 0 0 0 0 0 0 0 0 100 0 0 0 1,231
1/ Crude production includes Condensates comprising Pentane and Heavier Hydrocarbons. 2/ Others Refer to Non-Crude Energy Forms (consist of Imported Light Diesel, Slop Reprocess, Crude Residuum & Middle East Residue) Which are Used as Refinary Intake. 3/ GPP-LPG Extracts Liquid Products i.e Condensates, Ethane, Butane, Propane from Natural Gas, Ethane is not included under LPG Production. 4/ Butane and Propane as MTBE Feedstocks are Presented as Non-Energy use under LPG column. Ethane is Presented under Natural Gas Column. 5/ Estimated figures based from the Energy Commission, Statistics of Electricity Supply Industry in Malaysia 2013.
Note : Total may not necessarily add up due to rounding
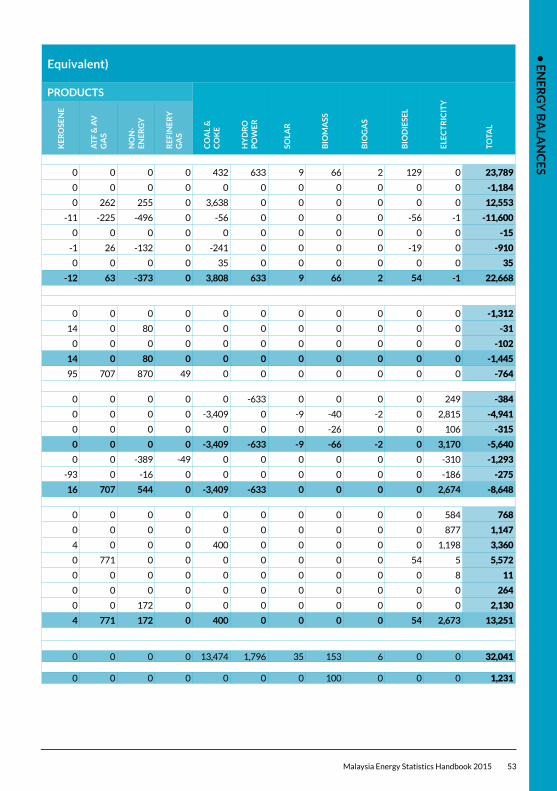
• E
NE
RG
Y B
ALA
NC
ES
Malaysia Energy Statistics Handbook 2015 53
Commercial Energy Balance for Malaysia Quarter 3 2013 (Thousand Tonnes of Oil Equivalent)
ENERGY SOURCE
NA
TU
RA
LG
AS
LNG
CR
UD
E O
IL(1
/)
OT
HE
RS
(2/)
TOTA
LP
ET
RO
LEU
MP
RO
DU
CT
S
PETROLEUM PRODUCTS
CO
AL
&C
OK
E
HY
DR
OP
OW
ER
SOLA
R
BIO
MA
SS
BIO
GA
S
BIO
DIE
SEL
ELE
CT
RIC
ITY
TOTA
L
PE
TR
OL
DIE
SEL
FU
EL
OIL
LPG
KE
RO
SEN
E
AT
F &
AV
GA
S
NO
N-
EN
ER
GY
RE
FIN
ER
Y
GA
S
PRIMARY SUPPLY
1. Primary Production 15,609 0 6,909 0 0 0 0 0 0 0 0 0 0 432 633 9 66 2 129 0 23,789
2. Gas Flaring, Reinjection & Use -1,184 0 0 0 0 0 0 0 0 0 0 0 0 0 0 0 0 0 0 0 -1,184
3. Imports 1,532 692 1,946 0 4,745 2,406 940 766 115 0 262 255 0 3,638 0 0 0 0 0 0 12,553
4. Exports -321 -6,697 -1,992 -11 -2,466 0 -731 -947 -55 -11 -225 -496 0 -56 0 0 0 0 -56 -1 -11,600
5. Bunkers 0 0 0 0 -15 0 -1 -14 0 0 0 0 0 0 0 0 0 0 0 0 -15
6. Stock Change 0 0 -104 0 -546 -241 -217 -21 39 -1 26 -132 0 -241 0 0 0 0 -19 0 -910
7. Statistical Discrepancy 0 0 0 0 0 0 0 0 0 0 0 0 0 35 0 0 0 0 0 0 35
8. Primary Supply 15,636 -6,005 6,759 -11 1,718 2,165 -8 -217 99 -12 63 -373 0 3,808 633 9 66 2 54 -1 22,668TRANSFORMATION9. Gas Plants
9.1 LNG -8,337 6,971 0 0 55 0 0 0 55 0 0 0 0 0 0 0 0 0 0 0 -1,312
9.2 MDS -159 0 0 0 128 0 34 0 0 14 0 80 0 0 0 0 0 0 0 0 -31
9.3 GPP-LPG (3&4/) -405 0 0 0 304 0 0 0 304 0 0 0 0 0 0 0 0 0 0 0 -102
Subtotal -8,901 6,971 0 0 486 0 34 0 358 14 0 80 0 0 0 0 0 0 0 0 -1,445
10. Refineries 0 0 -6,657 11 5,882 975 2,593 304 290 95 707 870 49 0 0 0 0 0 0 0 -76411. Power Stations & Self-Generation
11.1 Hydro Stations 0 0 0 0 0 0 0 0 0 0 0 0 0 0 -633 0 0 0 0 249 -384
11.2 Thermal Stations -3,452 -692 0 0 -152 0 -118 -35 0 0 0 0 0 -3,409 0 -9 -40 -2 0 2,815 -4,941
11.3 Self-Generation (5/) -390 0 0 0 -5 0 -5 0 0 0 0 0 0 0 0 0 -26 0 0 106 -315
Subtotal -3,842 -692 0 0 -158 0 -123 -35 0 0 0 0 0 -3,409 -633 -9 -66 -2 0 3,170 -5,640
12. Losses & Own Use -166 -274 -102 0 -442 0 0 -4 0 0 0 -389 -49 0 0 0 0 0 0 -310 -1,293
13. Statistical Discrepancy 0 0 0 0 -89 59 -104 59 7 -93 0 -16 0 0 0 0 0 0 0 -186 -275
14. Secondary Supply -12,910 6,697 -6,759 11 5,680 1,033 2,400 324 654 16 707 544 0 -3,409 -633 0 0 0 0 2,674 -8,648FINAL USE CONSUMPTION
15. Residential 0 0 0 0 184 0 0 0 183 0 0 0 0 0 0 0 0 0 0 584 768
16. Commercial 5 0 0 0 264 0 102 0 162 0 0 0 0 0 0 0 0 0 0 877 1,147
17. Industrial 1,043 0 0 0 719 61 516 84 55 4 0 0 0 400 0 0 0 0 0 1,198 3,360
18. Transport 73 0 0 0 5,440 3,112 1,536 22 0 0 771 0 0 0 0 0 0 0 54 5 5,572
19. Agriculture 0 0 0 0 2 0 0 2 0 0 0 0 0 0 0 0 0 0 0 8 11
20. Fishery 0 0 0 0 264 25 238 0 0 0 0 0 0 0 0 0 0 0 0 0 264
21. Non-Energy Use 1,605 0 0 0 525 0 0 0 353 0 0 172 0 0 0 0 0 0 0 0 2,130
22. Total Final Use 2,726 0 0 0 7,398 3,198 2,392 108 754 4 771 172 0 400 0 0 0 0 54 2,673 13,251
ELECTRICITY OUTPUT
Main Activity ProducerGross Electricity Generation - GWh 15,021 0 0 0 1,557 0 765 791 0 0 0 0 0 13,474 1,796 35 153 6 0 0 32,041AutoproducerGross Electricity Generation - GWh 1,111 0 0 0 20 0 20 0 0 0 0 0 0 0 0 0 100 0 0 0 1,231
1/ Crude production includes Condensates comprising Pentane and Heavier Hydrocarbons. 2/ Others Refer to Non-Crude Energy Forms (consist of Imported Light Diesel, Slop Reprocess, Crude Residuum & Middle East Residue) Which are Used as Refinary Intake. 3/ GPP-LPG Extracts Liquid Products i.e Condensates, Ethane, Butane, Propane from Natural Gas, Ethane is not included under LPG Production. 4/ Butane and Propane as MTBE Feedstocks are Presented as Non-Energy use under LPG column. Ethane is Presented under Natural Gas Column. 5/ Estimated figures based from the Energy Commission, Statistics of Electricity Supply Industry in Malaysia 2013.
Note : Total may not necessarily add up due to rounding
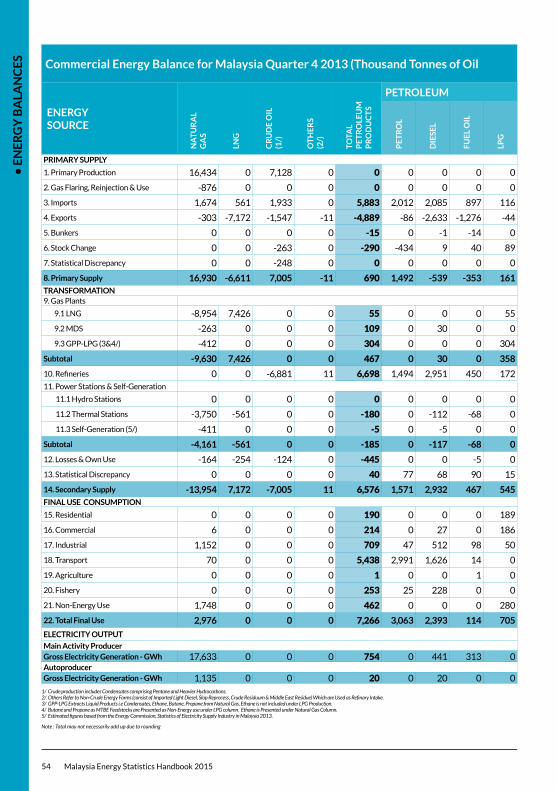
• E
NE
RG
Y B
ALA
NC
ES
54 Malaysia Energy Statistics Handbook 2015
Commercial Energy Balance for Malaysia Quarter 4 2013 (Thousand Tonnes of Oil Equivalent)
ENERGY SOURCE
NA
TU
RA
LG
AS
LNG
CR
UD
E O
IL(1
/)
OT
HE
RS
(2/)
TOTA
LP
ET
RO
LEU
MP
RO
DU
CT
S
PETROLEUM PRODUCTS
CO
AL
&C
OK
E
HY
DR
OP
OW
ER
SOLA
R
BIO
MA
SS
BIO
GA
S
BIO
DIE
SEL
ELE
CT
RIC
ITY
TOTA
L
PE
TR
OL
DIE
SEL
FU
EL
OIL
LPG
KE
RO
SEN
E
AT
F &
AV
GA
S
NO
N-
EN
ER
GY
RE
FIN
ER
Y
GA
S
PRIMARY SUPPLY
1. Primary Production 16,434 0 7,128 0 0 0 0 0 0 0 0 0 0 467 800 10 70 2 136 0 25,047
2. Gas Flaring, Reinjection & Use -876 0 0 0 0 0 0 0 0 0 0 0 0 0 0 0 0 0 0 0 -876
3. Imports 1,674 561 1,933 0 5,883 2,012 2,085 897 116 145 324 304 0 3,040 0 0 0 0 0 0 13,092
4. Exports -303 -7,172 -1,547 -11 -4,889 -86 -2,633 -1,276 -44 -176 -145 -528 0 -87 0 0 0 0 -40 -1 -14,050
5. Bunkers 0 0 0 0 -15 0 -1 -14 0 0 0 0 0 0 0 0 0 0 0 0 -15
6. Stock Change 0 0 -263 0 -290 -434 9 40 89 2 -9 14 0 135 0 0 0 0 -39 0 -456
7. Statistical Discrepancy 0 0 -248 0 0 0 0 0 0 0 0 0 0 -83 0 0 0 0 0 0 -331
8. Primary Supply 16,930 -6,611 7,005 -11 690 1,492 -539 -353 161 -29 169 -210 0 3,472 800 10 70 2 57 -1 22,412TRANSFORMATION9. Gas Plants
9.1 LNG -8,954 7,426 0 0 55 0 0 0 55 0 0 0 0 0 0 0 0 0 0 0 -1,474
9.2 MDS -263 0 0 0 109 0 30 0 0 12 0 67 0 0 0 0 0 0 0 0 -154
9.3 GPP-LPG (3&4/) -412 0 0 0 304 0 0 0 304 0 0 0 0 0 0 0 0 0 0 0 -109
Subtotal -9,630 7,426 0 0 467 0 30 0 358 12 0 67 0 0 0 0 0 0 0 0 -1,737
10. Refineries 0 0 -6,881 11 6,698 1,494 2,951 450 172 96 726 758 50 0 0 0 0 0 0 0 -17211. Power Stations & Self-Generation
11.1 Hydro Stations 0 0 0 0 0 0 0 0 0 0 0 0 0 0 -800 0 0 0 0 286 -514
11.2 Thermal Stations -3,750 -561 0 0 -180 0 -112 -68 0 0 0 0 0 -3,051 0 -10 -42 -2 0 2,546 -5,050
11.3 Self-Generation (5/) -411 0 0 0 -5 0 -5 0 0 0 0 0 0 0 0 0 -28 0 0 108 -336
Subtotal -4,161 -561 0 0 -185 0 -117 -68 0 0 0 0 0 -3,051 -800 -10 -70 -2 0 2,940 -5,900
12. Losses & Own Use -164 -254 -124 0 -445 0 0 -5 0 0 0 -389 -50 0 0 0 0 0 0 -223 -1,208
13. Statistical Discrepancy 0 0 0 0 40 77 68 90 15 -76 -89 -44 0 0 0 0 0 0 0 -43 -2
14. Secondary Supply -13,954 7,172 -7,005 11 6,576 1,571 2,932 467 545 33 637 392 0 -3,051 -800 0 0 0 0 2,674 -8,377FINAL USE CONSUMPTION
15. Residential 0 0 0 0 190 0 0 0 189 0 0 0 0 0 0 0 0 0 0 557 747
16. Commercial 6 0 0 0 214 0 27 0 186 0 0 0 0 0 0 0 0 0 0 870 1,089
17. Industrial 1,152 0 0 0 709 47 512 98 50 3 0 0 0 421 0 0 0 0 0 1,232 3,514
18. Transport 70 0 0 0 5,438 2,991 1,626 14 0 0 806 0 0 0 0 0 0 0 57 5 5,570
19. Agriculture 0 0 0 0 1 0 0 1 0 0 0 0 0 0 0 0 0 0 0 8 10
20. Fishery 0 0 0 0 253 25 228 0 0 0 0 0 0 0 0 0 0 0 0 0 253
21. Non-Energy Use 1,748 0 0 0 462 0 0 0 280 0 0 181 0 0 0 0 0 0 0 0 2,210
22. Total Final Use 2,976 0 0 0 7,266 3,063 2,393 114 705 4 806 181 0 421 0 0 0 0 57 2,673 13,393
ELECTRICITY OUTPUT
Main Activity ProducerGross Electricity Generation - GWh 17,633 0 0 0 754 0 441 313 0 0 0 0 0 12,239 3,323 35 153 6 0 0 34,143AutoproducerGross Electricity Generation - GWh 1,135 0 0 0 20 0 20 0 0 0 0 0 0 0 0 0 101 0 0 0 1,256
1/ Crude production includes Condensates comprising Pentane and Heavier Hydrocarbons. 2/ Others Refer to Non-Crude Energy Forms (consist of Imported Light Diesel, Slop Reprocess, Crude Residuum & Middle East Residue) Which are Used as Refinary Intake. 3/ GPP-LPG Extracts Liquid Products i.e Condensates, Ethane, Butane, Propane from Natural Gas, Ethane is not included under LPG Production. 4/ Butane and Propane as MTBE Feedstocks are Presented as Non-Energy use under LPG column. Ethane is Presented under Natural Gas Column. 5/ Estimated figures based from the Energy Commission, Statistics of Electricity Supply Industry in Malaysia 2013.
Note : Total may not necessarily add up due to rounding

• E
NE
RG
Y B
ALA
NC
ES
Malaysia Energy Statistics Handbook 2015 55
Commercial Energy Balance for Malaysia Quarter 4 2013 (Thousand Tonnes of Oil Equivalent)
ENERGY SOURCE
NA
TU
RA
LG
AS
LNG
CR
UD
E O
IL(1
/)
OT
HE
RS
(2/)
TOTA
LP
ET
RO
LEU
MP
RO
DU
CT
S
PETROLEUM PRODUCTS
CO
AL
&C
OK
E
HY
DR
OP
OW
ER
SOLA
R
BIO
MA
SS
BIO
GA
S
BIO
DIE
SEL
ELE
CT
RIC
ITY
TOTA
L
PE
TR
OL
DIE
SEL
FU
EL
OIL
LPG
KE
RO
SEN
E
AT
F &
AV
GA
S
NO
N-
EN
ER
GY
RE
FIN
ER
Y
GA
S
PRIMARY SUPPLY
1. Primary Production 16,434 0 7,128 0 0 0 0 0 0 0 0 0 0 467 800 10 70 2 136 0 25,047
2. Gas Flaring, Reinjection & Use -876 0 0 0 0 0 0 0 0 0 0 0 0 0 0 0 0 0 0 0 -876
3. Imports 1,674 561 1,933 0 5,883 2,012 2,085 897 116 145 324 304 0 3,040 0 0 0 0 0 0 13,092
4. Exports -303 -7,172 -1,547 -11 -4,889 -86 -2,633 -1,276 -44 -176 -145 -528 0 -87 0 0 0 0 -40 -1 -14,050
5. Bunkers 0 0 0 0 -15 0 -1 -14 0 0 0 0 0 0 0 0 0 0 0 0 -15
6. Stock Change 0 0 -263 0 -290 -434 9 40 89 2 -9 14 0 135 0 0 0 0 -39 0 -456
7. Statistical Discrepancy 0 0 -248 0 0 0 0 0 0 0 0 0 0 -83 0 0 0 0 0 0 -331
8. Primary Supply 16,930 -6,611 7,005 -11 690 1,492 -539 -353 161 -29 169 -210 0 3,472 800 10 70 2 57 -1 22,412TRANSFORMATION9. Gas Plants
9.1 LNG -8,954 7,426 0 0 55 0 0 0 55 0 0 0 0 0 0 0 0 0 0 0 -1,474
9.2 MDS -263 0 0 0 109 0 30 0 0 12 0 67 0 0 0 0 0 0 0 0 -154
9.3 GPP-LPG (3&4/) -412 0 0 0 304 0 0 0 304 0 0 0 0 0 0 0 0 0 0 0 -109
Subtotal -9,630 7,426 0 0 467 0 30 0 358 12 0 67 0 0 0 0 0 0 0 0 -1,737
10. Refineries 0 0 -6,881 11 6,698 1,494 2,951 450 172 96 726 758 50 0 0 0 0 0 0 0 -17211. Power Stations & Self-Generation
11.1 Hydro Stations 0 0 0 0 0 0 0 0 0 0 0 0 0 0 -800 0 0 0 0 286 -514
11.2 Thermal Stations -3,750 -561 0 0 -180 0 -112 -68 0 0 0 0 0 -3,051 0 -10 -42 -2 0 2,546 -5,050
11.3 Self-Generation (5/) -411 0 0 0 -5 0 -5 0 0 0 0 0 0 0 0 0 -28 0 0 108 -336
Subtotal -4,161 -561 0 0 -185 0 -117 -68 0 0 0 0 0 -3,051 -800 -10 -70 -2 0 2,940 -5,900
12. Losses & Own Use -164 -254 -124 0 -445 0 0 -5 0 0 0 -389 -50 0 0 0 0 0 0 -223 -1,208
13. Statistical Discrepancy 0 0 0 0 40 77 68 90 15 -76 -89 -44 0 0 0 0 0 0 0 -43 -2
14. Secondary Supply -13,954 7,172 -7,005 11 6,576 1,571 2,932 467 545 33 637 392 0 -3,051 -800 0 0 0 0 2,674 -8,377FINAL USE CONSUMPTION
15. Residential 0 0 0 0 190 0 0 0 189 0 0 0 0 0 0 0 0 0 0 557 747
16. Commercial 6 0 0 0 214 0 27 0 186 0 0 0 0 0 0 0 0 0 0 870 1,089
17. Industrial 1,152 0 0 0 709 47 512 98 50 3 0 0 0 421 0 0 0 0 0 1,232 3,514
18. Transport 70 0 0 0 5,438 2,991 1,626 14 0 0 806 0 0 0 0 0 0 0 57 5 5,570
19. Agriculture 0 0 0 0 1 0 0 1 0 0 0 0 0 0 0 0 0 0 0 8 10
20. Fishery 0 0 0 0 253 25 228 0 0 0 0 0 0 0 0 0 0 0 0 0 253
21. Non-Energy Use 1,748 0 0 0 462 0 0 0 280 0 0 181 0 0 0 0 0 0 0 0 2,210
22. Total Final Use 2,976 0 0 0 7,266 3,063 2,393 114 705 4 806 181 0 421 0 0 0 0 57 2,673 13,393
ELECTRICITY OUTPUT
Main Activity ProducerGross Electricity Generation - GWh 17,633 0 0 0 754 0 441 313 0 0 0 0 0 12,239 3,323 35 153 6 0 0 34,143AutoproducerGross Electricity Generation - GWh 1,135 0 0 0 20 0 20 0 0 0 0 0 0 0 0 0 101 0 0 0 1,256
1/ Crude production includes Condensates comprising Pentane and Heavier Hydrocarbons. 2/ Others Refer to Non-Crude Energy Forms (consist of Imported Light Diesel, Slop Reprocess, Crude Residuum & Middle East Residue) Which are Used as Refinary Intake. 3/ GPP-LPG Extracts Liquid Products i.e Condensates, Ethane, Butane, Propane from Natural Gas, Ethane is not included under LPG Production. 4/ Butane and Propane as MTBE Feedstocks are Presented as Non-Energy use under LPG column. Ethane is Presented under Natural Gas Column. 5/ Estimated figures based from the Energy Commission, Statistics of Electricity Supply Industry in Malaysia 2013.
Note : Total may not necessarily add up due to rounding
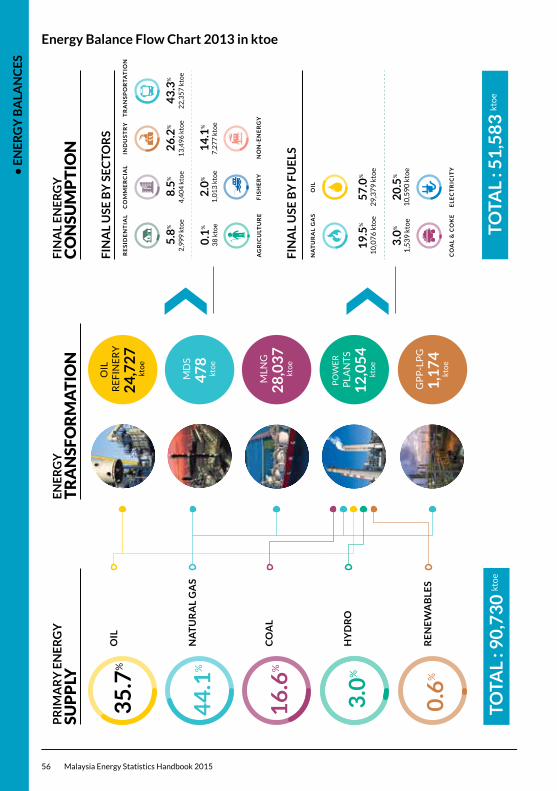
• E
NE
RG
Y B
ALA
NC
ES
56 Malaysia Energy Statistics Handbook 2015
Energy Balance Flow Chart 2013 in ktoeP
RIM
AR
Y E
NE
RG
YSU
PP
LYE
NE
RG
Y
TR
AN
SFO
RM
AT
ION
FIN
AL
EN
ER
GY
C
ON
SUM
PT
ION
TOTA
L : 5
1,5
83
kto
e
NA
TU
RA
L G
AS
CO
AL
HY
DR
O
RE
NE
WA
BLE
S
OIL
35
.7%
44
.1%
16
.6%
3.0
%
0.6
%
PO
WE
R
PLA
NT
S
12
,05
4
kto
e
MLN
G
28
,03
7
kto
e
MD
S
47
8
kto
e
GP
P-L
PG
1,1
74
kt
oe
OIL
R
EF
INE
RY
24
,72
7
kto
e
TOTA
L : 9
0,7
30
kto
e
TR
AN
SP
OR
TA
TIO
N
43
.3%
22
,35
7 k
toe
1,0
13
kto
e7
,27
7 k
toe
13
,49
6 k
toe
2.0
%
IND
US
TR
Y
26
.2%
FIS
HE
RY
38
kto
e0
.1%
AG
RIC
ULT
UR
E N
ON
-EN
ER
GY
14
.1%
FIN
AL
USE
BY
SE
CTO
RS
2,9
99
kto
e
RE
SID
EN
TIA
L
5.8
%
4,4
04
kto
e
CO
MM
ER
CIA
L
8.5
%
10
,59
0 k
toe
1,5
39
kto
e
FIN
AL
USE
BY
FU
ELS
10
,07
6 k
toe
29
,37
9 k
toe
20
.5%
EL
EC
TR
ICIT
Y
NA
TU
RA
L G
AS
19
.5%
3.0
%
CO
AL
& C
OK
E
OIL
57
.0%
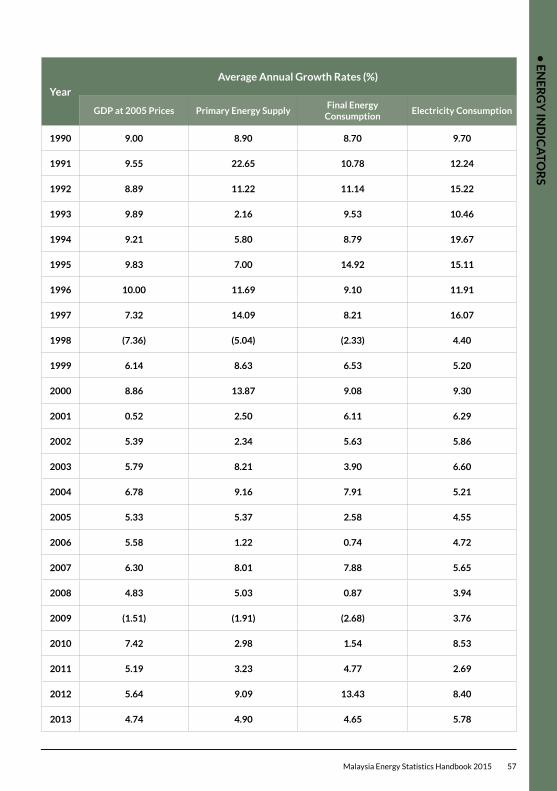
• E
NE
RG
Y IN
DIC
ATO
RS
Malaysia Energy Statistics Handbook 2015 57
Year
Average Annual Growth Rates (%)
GDP at 2005 Prices Primary Energy SupplyFinal Energy
ConsumptionElectricity Consumption
1990 9.00 8.90 8.70 9.70
1991 9.55 22.65 10.78 12.24
1992 8.89 11.22 11.14 15.22
1993 9.89 2.16 9.53 10.46
1994 9.21 5.80 8.79 19.67
1995 9.83 7.00 14.92 15.11
1996 10.00 11.69 9.10 11.91
1997 7.32 14.09 8.21 16.07
1998 (7.36) (5.04) (2.33) 4.40
1999 6.14 8.63 6.53 5.20
2000 8.86 13.87 9.08 9.30
2001 0.52 2.50 6.11 6.29
2002 5.39 2.34 5.63 5.86
2003 5.79 8.21 3.90 6.60
2004 6.78 9.16 7.91 5.21
2005 5.33 5.37 2.58 4.55
2006 5.58 1.22 0.74 4.72
2007 6.30 8.01 7.88 5.65
2008 4.83 5.03 0.87 3.94
2009 (1.51) (1.91) (2.68) 3.76
2010 7.42 2.98 1.54 8.53
2011 5.19 3.23 4.77 2.69
2012 5.64 9.09 13.43 8.40
2013 4.74 4.90 4.65 5.78
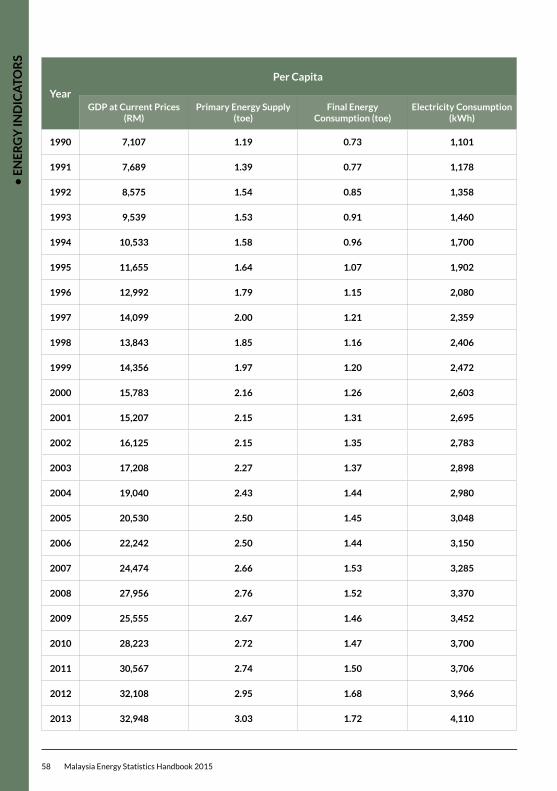
• E
NE
RG
Y IN
DIC
ATO
RS
58 Malaysia Energy Statistics Handbook 2015
Year
Per Capita
GDP at Current Prices (RM)
Primary Energy Supply (toe)
Final Energy Consumption (toe)
Electricity Consumption (kWh)
1990 7,107 1.19 0.73 1,101
1991 7,689 1.39 0.77 1,178
1992 8,575 1.54 0.85 1,358
1993 9,539 1.53 0.91 1,460
1994 10,533 1.58 0.96 1,700
1995 11,655 1.64 1.07 1,902
1996 12,992 1.79 1.15 2,080
1997 14,099 2.00 1.21 2,359
1998 13,843 1.85 1.16 2,406
1999 14,356 1.97 1.20 2,472
2000 15,783 2.16 1.26 2,603
2001 15,207 2.15 1.31 2,695
2002 16,125 2.15 1.35 2,783
2003 17,208 2.27 1.37 2,898
2004 19,040 2.43 1.44 2,980
2005 20,530 2.50 1.45 3,048
2006 22,242 2.50 1.44 3,150
2007 24,474 2.66 1.53 3,285
2008 27,956 2.76 1.52 3,370
2009 25,555 2.67 1.46 3,452
2010 28,223 2.72 1.47 3,700
2011 30,567 2.74 1.50 3,706
2012 32,108 2.95 1.68 3,966
2013 32,948 3.03 1.72 4,110
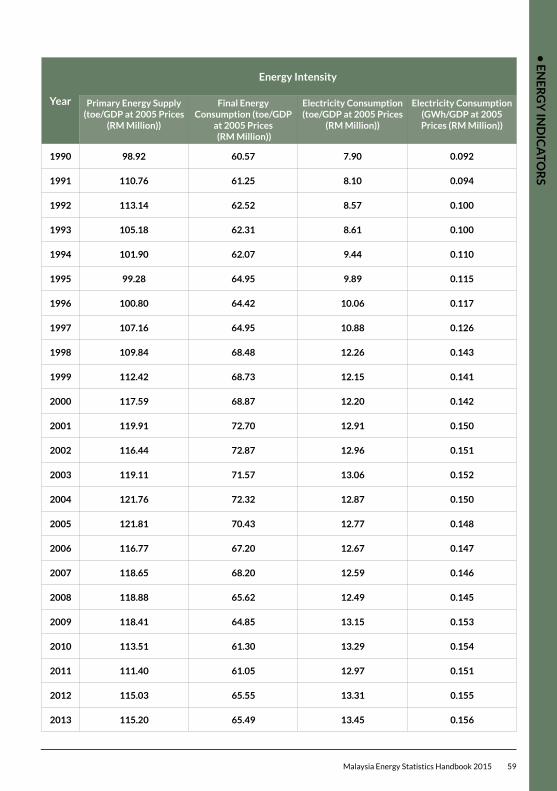
• E
NE
RG
Y IN
DIC
ATO
RS
Malaysia Energy Statistics Handbook 2015 59
Year
Energy Intensity
Primary Energy Supply (toe/GDP at 2005 Prices
(RM Million))
Final Energy Consumption (toe/GDP
at 2005 Prices (RM Million))
Electricity Consumption (toe/GDP at 2005 Prices
(RM Million))
Electricity Consumption (GWh/GDP at 2005 Prices (RM Million))
1990 98.92 60.57 7.90 0.092
1991 110.76 61.25 8.10 0.094
1992 113.14 62.52 8.57 0.100
1993 105.18 62.31 8.61 0.100
1994 101.90 62.07 9.44 0.110
1995 99.28 64.95 9.89 0.115
1996 100.80 64.42 10.06 0.117
1997 107.16 64.95 10.88 0.126
1998 109.84 68.48 12.26 0.143
1999 112.42 68.73 12.15 0.141
2000 117.59 68.87 12.20 0.142
2001 119.91 72.70 12.91 0.150
2002 116.44 72.87 12.96 0.151
2003 119.11 71.57 13.06 0.152
2004 121.76 72.32 12.87 0.150
2005 121.81 70.43 12.77 0.148
2006 116.77 67.20 12.67 0.147
2007 118.65 68.20 12.59 0.146
2008 118.88 65.62 12.49 0.145
2009 118.41 64.85 13.15 0.153
2010 113.51 61.30 13.29 0.154
2011 111.40 61.05 12.97 0.151
2012 115.03 65.55 13.31 0.155
2013 115.20 65.49 13.45 0.156
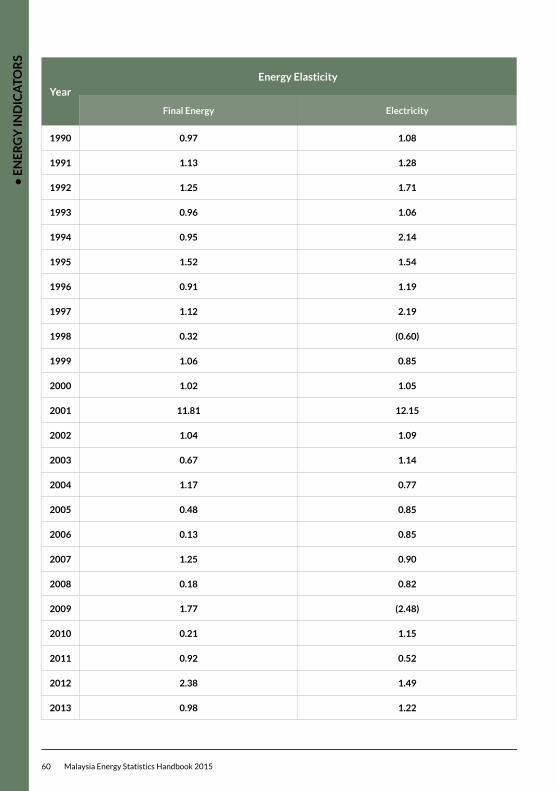
• E
NE
RG
Y IN
DIC
ATO
RS
60 Malaysia Energy Statistics Handbook 2015
Year
Energy Elasticity
Final Energy Electricity
1990 0.97 1.08
1991 1.13 1.28
1992 1.25 1.71
1993 0.96 1.06
1994 0.95 2.14
1995 1.52 1.54
1996 0.91 1.19
1997 1.12 2.19
1998 0.32 (0.60)
1999 1.06 0.85
2000 1.02 1.05
2001 11.81 12.15
2002 1.04 1.09
2003 0.67 1.14
2004 1.17 0.77
2005 0.48 0.85
2006 0.13 0.85
2007 1.25 0.90
2008 0.18 0.82
2009 1.77 (2.48)
2010 0.21 1.15
2011 0.92 0.52
2012 2.38 1.49
2013 0.98 1.22
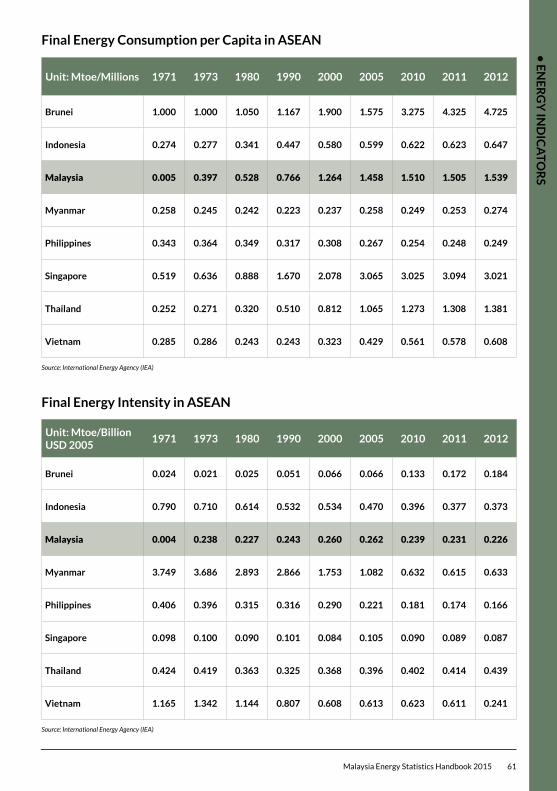
• E
NE
RG
Y IN
DIC
ATO
RS
Malaysia Energy Statistics Handbook 2015 61
Unit: Mtoe/Millions 1971 1973 1980 1990 2000 2005 2010 2011 2012
Brunei 1.000 1.000 1.050 1.167 1.900 1.575 3.275 4.325 4.725
Indonesia 0.274 0.277 0.341 0.447 0.580 0.599 0.622 0.623 0.647
Malaysia 0.005 0.397 0.528 0.766 1.264 1.458 1.510 1.505 1.539
Myanmar 0.258 0.245 0.242 0.223 0.237 0.258 0.249 0.253 0.274
Philippines 0.343 0.364 0.349 0.317 0.308 0.267 0.254 0.248 0.249
Singapore 0.519 0.636 0.888 1.670 2.078 3.065 3.025 3.094 3.021
Thailand 0.252 0.271 0.320 0.510 0.812 1.065 1.273 1.308 1.381
Vietnam 0.285 0.286 0.243 0.243 0.323 0.429 0.561 0.578 0.608
Source: International Energy Agency (IEA)
Unit: Mtoe/Billion USD 2005
1971 1973 1980 1990 2000 2005 2010 2011 2012
Brunei 0.024 0.021 0.025 0.051 0.066 0.066 0.133 0.172 0.184
Indonesia 0.790 0.710 0.614 0.532 0.534 0.470 0.396 0.377 0.373
Malaysia 0.004 0.238 0.227 0.243 0.260 0.262 0.239 0.231 0.226
Myanmar 3.749 3.686 2.893 2.866 1.753 1.082 0.632 0.615 0.633
Philippines 0.406 0.396 0.315 0.316 0.290 0.221 0.181 0.174 0.166
Singapore 0.098 0.100 0.090 0.101 0.084 0.105 0.090 0.089 0.087
Thailand 0.424 0.419 0.363 0.325 0.368 0.396 0.402 0.414 0.439
Vietnam 1.165 1.342 1.144 0.807 0.608 0.613 0.623 0.611 0.241
Source: International Energy Agency (IEA)
Final Energy Consumption per Capita in ASEAN
Final Energy Intensity in ASEAN
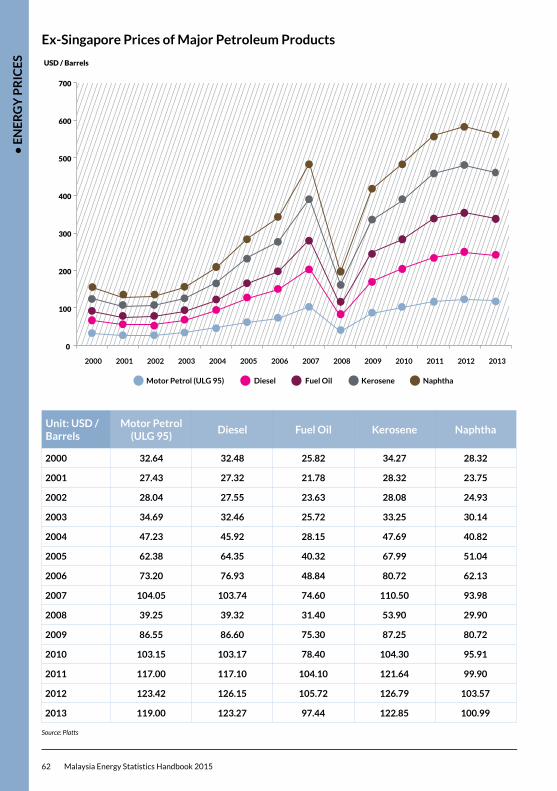
• E
NE
RG
Y P
RIC
ES
62 Malaysia Energy Statistics Handbook 2015
Unit: USD / Barrels
Motor Petrol (ULG 95)
Diesel Fuel Oil Kerosene Naphtha
2000 32.64 32.48 25.82 34.27 28.32
2001 27.43 27.32 21.78 28.32 23.75
2002 28.04 27.55 23.63 28.08 24.93
2003 34.69 32.46 25.72 33.25 30.14
2004 47.23 45.92 28.15 47.69 40.82
2005 62.38 64.35 40.32 67.99 51.04
2006 73.20 76.93 48.84 80.72 62.13
2007 104.05 103.74 74.60 110.50 93.98
2008 39.25 39.32 31.40 53.90 29.90
2009 86.55 86.60 75.30 87.25 80.72
2010 103.15 103.17 78.40 104.30 95.91
2011 117.00 117.10 104.10 121.64 99.90
2012 123.42 126.15 105.72 126.79 103.57
2013 119.00 123.27 97.44 122.85 100.99 Source: Platts
Ex-Singapore Prices of Major Petroleum Products
Motor Petrol (ULG 95) Diesel Fuel Oil Kerosene Naphtha
0
100
200
300
400
500
600
700
2000 2001 2002 2003 2004 2005 2006 2007 2008 2009 2010 2011 2012 2013
USD / Barrels
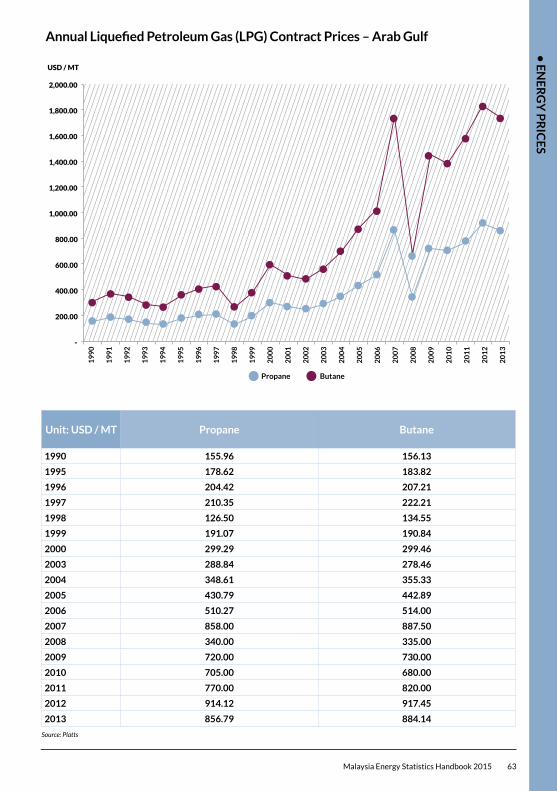
• E
NE
RG
Y P
RIC
ES
Malaysia Energy Statistics Handbook 2015 63
Unit: USD / MT Propane Butane
1990 155.96 156.13
1995 178.62 183.82
1996 204.42 207.21
1997 210.35 222.21
1998 126.50 134.55
1999 191.07 190.84
2000 299.29 299.46
2003 288.84 278.46
2004 348.61 355.33
2005 430.79 442.89
2006 510.27 514.00
2007 858.00 887.50
2008 340.00 335.00
2009 720.00 730.00
2010 705.00 680.00
2011 770.00 820.00
2012 914.12 917.45
2013 856.79 884.14 Source: Platts
AnnualLiquefiedPetroleumGas(LPG)ContractPrices–ArabGulf
19
90
19
91
19
92
19
93
19
94
19
95
19
96
19
97
19
98
19
99
20
00
20
01
20
02
20
03
20
04
20
05
20
06
20
07
20
08
20
09
20
10
20
11
20
12
20
13
-
200.00
400.00
600.00
800.00
1,000.00
1,200.00
1,400.00
1,600.00
1,800.00
2,000.00
USD / MT
Propane Butane
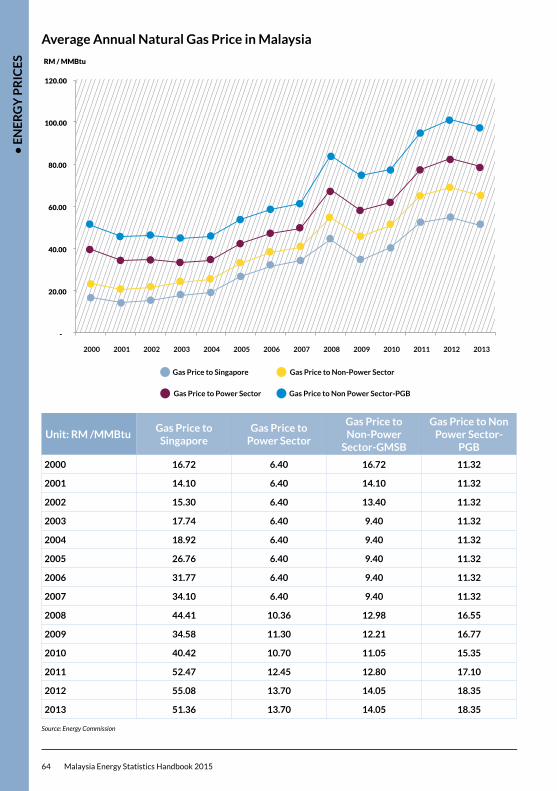
• E
NE
RG
Y P
RIC
ES
64 Malaysia Energy Statistics Handbook 2015
Unit: RM /MMBtuGas Price to
SingaporeGas Price to
Power Sector
Gas Price to Non-Power
Sector-GMSB
Gas Price to Non Power Sector-
PGB
2000 16.72 6.40 16.72 11.32
2001 14.10 6.40 14.10 11.32
2002 15.30 6.40 13.40 11.32
2003 17.74 6.40 9.40 11.32
2004 18.92 6.40 9.40 11.32
2005 26.76 6.40 9.40 11.32
2006 31.77 6.40 9.40 11.32
2007 34.10 6.40 9.40 11.32
2008 44.41 10.36 12.98 16.55
2009 34.58 11.30 12.21 16.77
2010 40.42 10.70 11.05 15.35
2011 52.47 12.45 12.80 17.10
2012 55.08 13.70 14.05 18.35
2013 51.36 13.70 14.05 18.35 Source: Energy Commission
Average Annual Natural Gas Price in Malaysia
-
20.00
40.00
60.00
80.00
100.00
120.00
2000 2001 2002 2003 2004 2005 2006 2007 2008 2009 2010 2011 2012 2013
RM / MMBtu
Gas Price to Singapore Gas Price to Non-Power Sector
Gas Price to Power Sector Gas Price to Non Power Sector-PGB
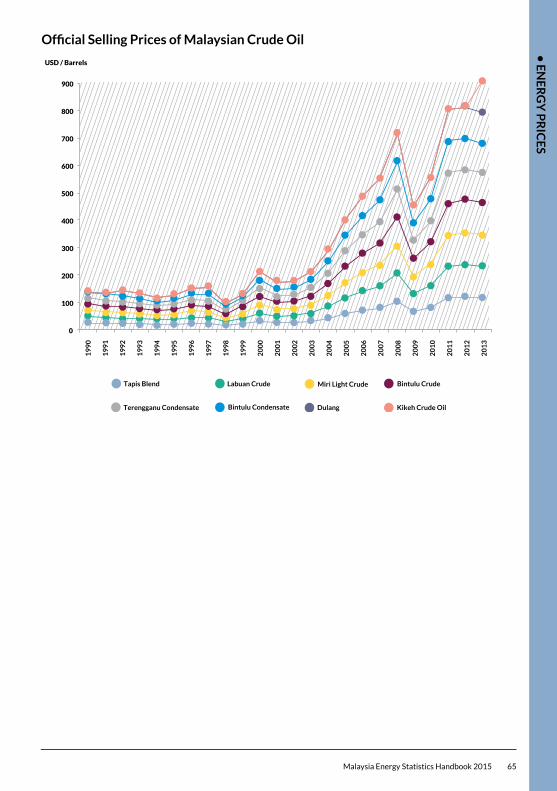
• E
NE
RG
Y P
RIC
ES
Malaysia Energy Statistics Handbook 2015 65
OfficialSellingPricesofMalaysianCrudeOil
0
100
200
300
400
500
600
700
800
900
USD / Barrels
Labuan CrudeTapis Blend Bintulu Crude
Terengganu Condensate Dulang Kikeh Crude OilBintulu Condensate
Miri Light Crude
19
90
19
91
19
92
19
93
19
94
19
95
19
96
19
97
19
98
19
99
20
00
20
01
20
02
20
03
20
04
20
05
20
06
20
07
20
08
20
09
20
10
20
11
20
12
20
13
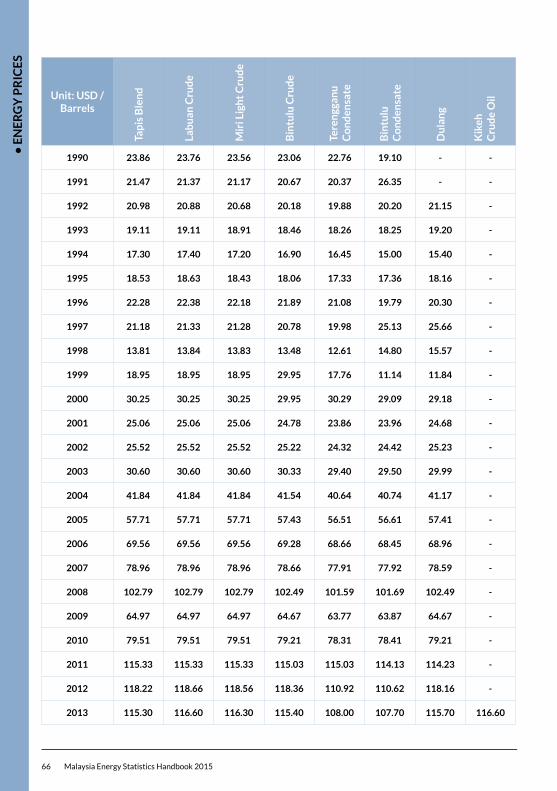
• E
NE
RG
Y P
RIC
ES
66 Malaysia Energy Statistics Handbook 2015
Unit: USD / Barrels
Tap
is B
len
d
Lab
uan
Cru
de
Mir
i Lig
ht
Cru
de
Bin
tulu
Cru
de
Tere
ngg
anu
C
on
den
sate
Bin
tulu
C
on
den
sate
Du
lan
g
Kik
eh
Cru
de
Oil
1990 23.86 23.76 23.56 23.06 22.76 19.10 - -
1991 21.47 21.37 21.17 20.67 20.37 26.35 - -
1992 20.98 20.88 20.68 20.18 19.88 20.20 21.15 -
1993 19.11 19.11 18.91 18.46 18.26 18.25 19.20 -
1994 17.30 17.40 17.20 16.90 16.45 15.00 15.40 -
1995 18.53 18.63 18.43 18.06 17.33 17.36 18.16 -
1996 22.28 22.38 22.18 21.89 21.08 19.79 20.30 -
1997 21.18 21.33 21.28 20.78 19.98 25.13 25.66 -
1998 13.81 13.84 13.83 13.48 12.61 14.80 15.57 -
1999 18.95 18.95 18.95 29.95 17.76 11.14 11.84 -
2000 30.25 30.25 30.25 29.95 30.29 29.09 29.18 -
2001 25.06 25.06 25.06 24.78 23.86 23.96 24.68 -
2002 25.52 25.52 25.52 25.22 24.32 24.42 25.23 -
2003 30.60 30.60 30.60 30.33 29.40 29.50 29.99 -
2004 41.84 41.84 41.84 41.54 40.64 40.74 41.17 -
2005 57.71 57.71 57.71 57.43 56.51 56.61 57.41 -
2006 69.56 69.56 69.56 69.28 68.66 68.45 68.96 -
2007 78.96 78.96 78.96 78.66 77.91 77.92 78.59 -
2008 102.79 102.79 102.79 102.49 101.59 101.69 102.49 -
2009 64.97 64.97 64.97 64.67 63.77 63.87 64.67 -
2010 79.51 79.51 79.51 79.21 78.31 78.41 79.21 -
2011 115.33 115.33 115.33 115.03 115.03 114.13 114.23 -
2012 118.22 118.66 118.56 118.36 110.92 110.62 118.16 -
2013 115.30 116.60 116.30 115.40 108.00 107.70 115.70 116.60
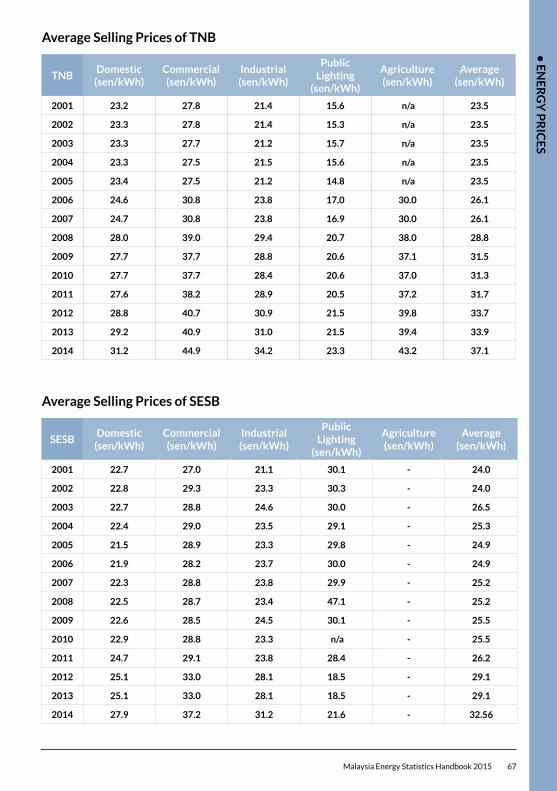
• E
NE
RG
Y P
RIC
ES
Malaysia Energy Statistics Handbook 2015 67
TNBDomestic
(sen/kWh)Commercial (sen/kWh)
Industrial (sen/kWh)
Public Lighting
(sen/kWh)
Agriculture (sen/kWh)
Average (sen/kWh)
2001 23.2 27.8 21.4 15.6 n/a 23.5
2002 23.3 27.8 21.4 15.3 n/a 23.5
2003 23.3 27.7 21.2 15.7 n/a 23.5
2004 23.3 27.5 21.5 15.6 n/a 23.5
2005 23.4 27.5 21.2 14.8 n/a 23.5
2006 24.6 30.8 23.8 17.0 30.0 26.1
2007 24.7 30.8 23.8 16.9 30.0 26.1
2008 28.0 39.0 29.4 20.7 38.0 28.8
2009 27.7 37.7 28.8 20.6 37.1 31.5
2010 27.7 37.7 28.4 20.6 37.0 31.3
2011 27.6 38.2 28.9 20.5 37.2 31.7
2012 28.8 40.7 30.9 21.5 39.8 33.7
2013 29.2 40.9 31.0 21.5 39.4 33.9
2014 31.2 44.9 34.2 23.3 43.2 37.1
SESBDomestic
(sen/kWh)Commercial (sen/kWh)
Industrial (sen/kWh)
Public Lighting
(sen/kWh)
Agriculture (sen/kWh)
Average (sen/kWh)
2001 22.7 27.0 21.1 30.1 - 24.0
2002 22.8 29.3 23.3 30.3 - 24.0
2003 22.7 28.8 24.6 30.0 - 26.5
2004 22.4 29.0 23.5 29.1 - 25.3
2005 21.5 28.9 23.3 29.8 - 24.9
2006 21.9 28.2 23.7 30.0 - 24.9
2007 22.3 28.8 23.8 29.9 - 25.2
2008 22.5 28.7 23.4 47.1 - 25.2
2009 22.6 28.5 24.5 30.1 - 25.5
2010 22.9 28.8 23.3 n/a - 25.5
2011 24.7 29.1 23.8 28.4 - 26.2
2012 25.1 33.0 28.1 18.5 - 29.1
2013 25.1 33.0 28.1 18.5 - 29.1
2014 27.9 37.2 31.2 21.6 - 32.56
Average Selling Prices of TNB
Average Selling Prices of SESB
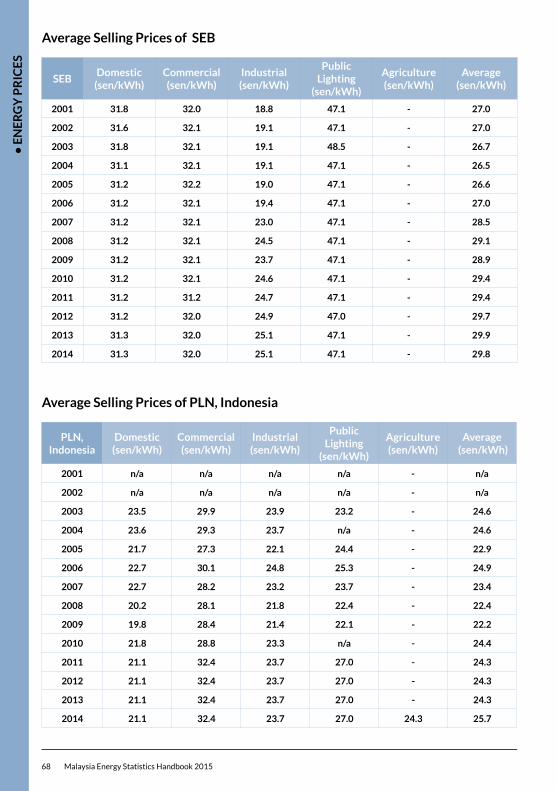
• E
NE
RG
Y P
RIC
ES
68 Malaysia Energy Statistics Handbook 2015
SEBDomestic
(sen/kWh)Commercial (sen/kWh)
Industrial (sen/kWh)
Public Lighting
(sen/kWh)
Agriculture (sen/kWh)
Average (sen/kWh)
2001 31.8 32.0 18.8 47.1 - 27.0
2002 31.6 32.1 19.1 47.1 - 27.0
2003 31.8 32.1 19.1 48.5 - 26.7
2004 31.1 32.1 19.1 47.1 - 26.5
2005 31.2 32.2 19.0 47.1 - 26.6
2006 31.2 32.1 19.4 47.1 - 27.0
2007 31.2 32.1 23.0 47.1 - 28.5
2008 31.2 32.1 24.5 47.1 - 29.1
2009 31.2 32.1 23.7 47.1 - 28.9
2010 31.2 32.1 24.6 47.1 - 29.4
2011 31.2 31.2 24.7 47.1 - 29.4
2012 31.2 32.0 24.9 47.0 - 29.7
2013 31.3 32.0 25.1 47.1 - 29.9
2014 31.3 32.0 25.1 47.1 - 29.8
PLN, Indonesia
Domestic (sen/kWh)
Commercial (sen/kWh)
Industrial (sen/kWh)
Public Lighting
(sen/kWh)
Agriculture (sen/kWh)
Average (sen/kWh)
2001 n/a n/a n/a n/a - n/a
2002 n/a n/a n/a n/a - n/a
2003 23.5 29.9 23.9 23.2 - 24.6
2004 23.6 29.3 23.7 n/a - 24.6
2005 21.7 27.3 22.1 24.4 - 22.9
2006 22.7 30.1 24.8 25.3 - 24.9
2007 22.7 28.2 23.2 23.7 - 23.4
2008 20.2 28.1 21.8 22.4 - 22.4
2009 19.8 28.4 21.4 22.1 - 22.2
2010 21.8 28.8 23.3 n/a - 24.4
2011 21.1 32.4 23.7 27.0 - 24.3
2012 21.1 32.4 23.7 27.0 - 24.3
2013 21.1 32.4 23.7 27.0 - 24.3
2014 21.1 32.4 23.7 27.0 24.3 25.7
Average Selling Prices of SEB
Average Selling Prices of PLN, Indonesia
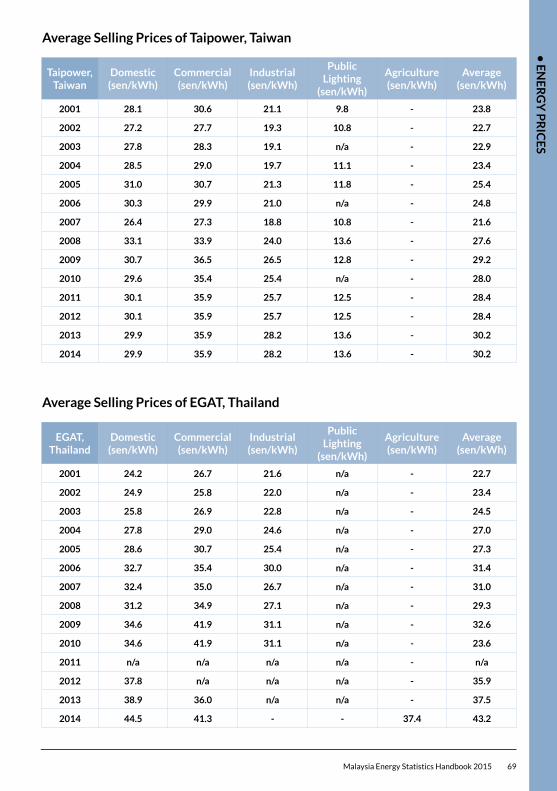
• E
NE
RG
Y P
RIC
ES
Malaysia Energy Statistics Handbook 2015 69
Average Selling Prices of Taipower, Taiwan
Average Selling Prices of EGAT, Thailand
Taipower, Taiwan
Domestic (sen/kWh)
Commercial (sen/kWh)
Industrial (sen/kWh)
Public Lighting
(sen/kWh)
Agriculture (sen/kWh)
Average (sen/kWh)
2001 28.1 30.6 21.1 9.8 - 23.8
2002 27.2 27.7 19.3 10.8 - 22.7
2003 27.8 28.3 19.1 n/a - 22.9
2004 28.5 29.0 19.7 11.1 - 23.4
2005 31.0 30.7 21.3 11.8 - 25.4
2006 30.3 29.9 21.0 n/a - 24.8
2007 26.4 27.3 18.8 10.8 - 21.6
2008 33.1 33.9 24.0 13.6 - 27.6
2009 30.7 36.5 26.5 12.8 - 29.2
2010 29.6 35.4 25.4 n/a - 28.0
2011 30.1 35.9 25.7 12.5 - 28.4
2012 30.1 35.9 25.7 12.5 - 28.4
2013 29.9 35.9 28.2 13.6 - 30.2
2014 29.9 35.9 28.2 13.6 - 30.2
EGAT, Thailand
Domestic (sen/kWh)
Commercial (sen/kWh)
Industrial (sen/kWh)
Public Lighting
(sen/kWh)
Agriculture (sen/kWh)
Average (sen/kWh)
2001 24.2 26.7 21.6 n/a - 22.7
2002 24.9 25.8 22.0 n/a - 23.4
2003 25.8 26.9 22.8 n/a - 24.5
2004 27.8 29.0 24.6 n/a - 27.0
2005 28.6 30.7 25.4 n/a - 27.3
2006 32.7 35.4 30.0 n/a - 31.4
2007 32.4 35.0 26.7 n/a - 31.0
2008 31.2 34.9 27.1 n/a - 29.3
2009 34.6 41.9 31.1 n/a - 32.6
2010 34.6 41.9 31.1 n/a - 23.6
2011 n/a n/a n/a n/a - n/a
2012 37.8 n/a n/a n/a - 35.9
2013 38.9 36.0 n/a n/a - 37.5
2014 44.5 41.3 - - 37.4 43.2
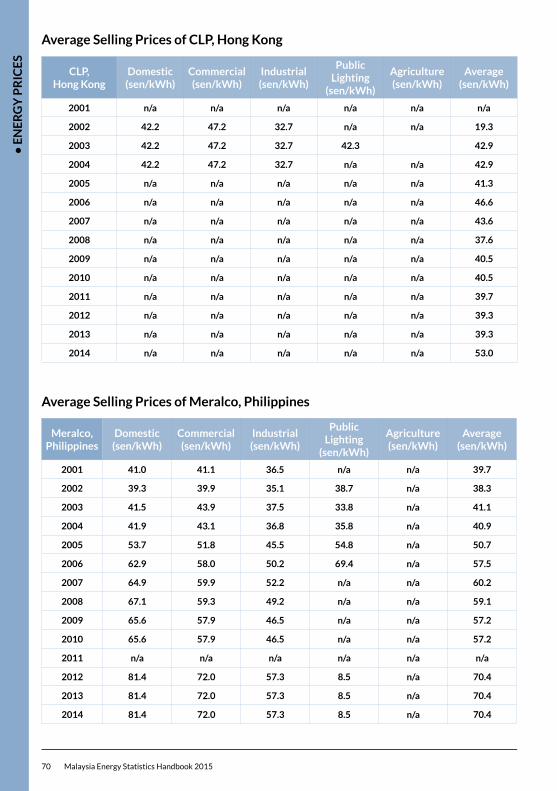
• E
NE
RG
Y P
RIC
ES
70 Malaysia Energy Statistics Handbook 2015
Average Selling Prices of CLP, Hong Kong
Average Selling Prices of Meralco, Philippines
CLP, Hong Kong
Domestic (sen/kWh)
Commercial (sen/kWh)
Industrial (sen/kWh)
Public Lighting
(sen/kWh)
Agriculture (sen/kWh)
Average (sen/kWh)
2001 n/a n/a n/a n/a n/a n/a
2002 42.2 47.2 32.7 n/a n/a 19.3
2003 42.2 47.2 32.7 42.3 42.9
2004 42.2 47.2 32.7 n/a n/a 42.9
2005 n/a n/a n/a n/a n/a 41.3
2006 n/a n/a n/a n/a n/a 46.6
2007 n/a n/a n/a n/a n/a 43.6
2008 n/a n/a n/a n/a n/a 37.6
2009 n/a n/a n/a n/a n/a 40.5
2010 n/a n/a n/a n/a n/a 40.5
2011 n/a n/a n/a n/a n/a 39.7
2012 n/a n/a n/a n/a n/a 39.3
2013 n/a n/a n/a n/a n/a 39.3
2014 n/a n/a n/a n/a n/a 53.0
Meralco, Philippines
Domestic (sen/kWh)
Commercial (sen/kWh)
Industrial (sen/kWh)
Public Lighting
(sen/kWh)
Agriculture (sen/kWh)
Average (sen/kWh)
2001 41.0 41.1 36.5 n/a n/a 39.7
2002 39.3 39.9 35.1 38.7 n/a 38.3
2003 41.5 43.9 37.5 33.8 n/a 41.1
2004 41.9 43.1 36.8 35.8 n/a 40.9
2005 53.7 51.8 45.5 54.8 n/a 50.7
2006 62.9 58.0 50.2 69.4 n/a 57.5
2007 64.9 59.9 52.2 n/a n/a 60.2
2008 67.1 59.3 49.2 n/a n/a 59.1
2009 65.6 57.9 46.5 n/a n/a 57.2
2010 65.6 57.9 46.5 n/a n/a 57.2
2011 n/a n/a n/a n/a n/a n/a
2012 81.4 72.0 57.3 8.5 n/a 70.4
2013 81.4 72.0 57.3 8.5 n/a 70.4
2014 81.4 72.0 57.3 8.5 n/a 70.4
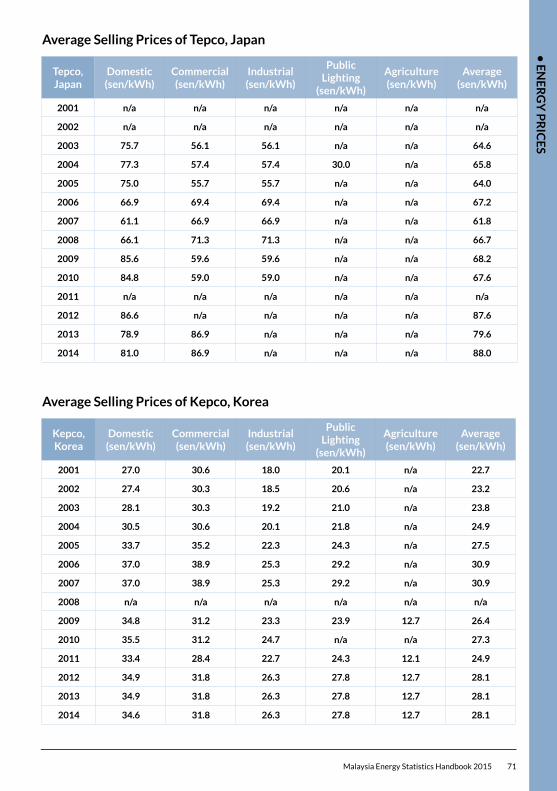
• E
NE
RG
Y P
RIC
ES
Malaysia Energy Statistics Handbook 2015 71
Average Selling Prices of Tepco, Japan
Average Selling Prices of Kepco, Korea
Tepco, Japan
Domestic (sen/kWh)
Commercial (sen/kWh)
Industrial (sen/kWh)
Public Lighting
(sen/kWh)
Agriculture (sen/kWh)
Average (sen/kWh)
2001 n/a n/a n/a n/a n/a n/a
2002 n/a n/a n/a n/a n/a n/a
2003 75.7 56.1 56.1 n/a n/a 64.6
2004 77.3 57.4 57.4 30.0 n/a 65.8
2005 75.0 55.7 55.7 n/a n/a 64.0
2006 66.9 69.4 69.4 n/a n/a 67.2
2007 61.1 66.9 66.9 n/a n/a 61.8
2008 66.1 71.3 71.3 n/a n/a 66.7
2009 85.6 59.6 59.6 n/a n/a 68.2
2010 84.8 59.0 59.0 n/a n/a 67.6
2011 n/a n/a n/a n/a n/a n/a
2012 86.6 n/a n/a n/a n/a 87.6
2013 78.9 86.9 n/a n/a n/a 79.6
2014 81.0 86.9 n/a n/a n/a 88.0
Kepco, Korea
Domestic (sen/kWh)
Commercial (sen/kWh)
Industrial (sen/kWh)
Public Lighting
(sen/kWh)
Agriculture (sen/kWh)
Average (sen/kWh)
2001 27.0 30.6 18.0 20.1 n/a 22.7
2002 27.4 30.3 18.5 20.6 n/a 23.2
2003 28.1 30.3 19.2 21.0 n/a 23.8
2004 30.5 30.6 20.1 21.8 n/a 24.9
2005 33.7 35.2 22.3 24.3 n/a 27.5
2006 37.0 38.9 25.3 29.2 n/a 30.9
2007 37.0 38.9 25.3 29.2 n/a 30.9
2008 n/a n/a n/a n/a n/a n/a
2009 34.8 31.2 23.3 23.9 12.7 26.4
2010 35.5 31.2 24.7 n/a n/a 27.3
2011 33.4 28.4 22.7 24.3 12.1 24.9
2012 34.9 31.8 26.3 27.8 12.7 28.1
2013 34.9 31.8 26.3 27.8 12.7 28.1
2014 34.6 31.8 26.3 27.8 12.7 28.1
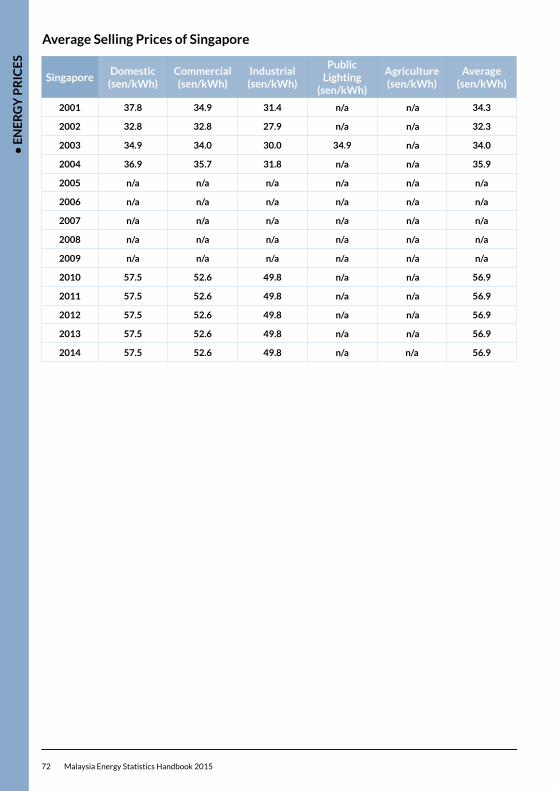
• E
NE
RG
Y P
RIC
ES
72 Malaysia Energy Statistics Handbook 2015
Average Selling Prices of Singapore
SingaporeDomestic
(sen/kWh)Commercial (sen/kWh)
Industrial (sen/kWh)
Public Lighting
(sen/kWh)
Agriculture (sen/kWh)
Average (sen/kWh)
2001 37.8 34.9 31.4 n/a n/a 34.3
2002 32.8 32.8 27.9 n/a n/a 32.3
2003 34.9 34.0 30.0 34.9 n/a 34.0
2004 36.9 35.7 31.8 n/a n/a 35.9
2005 n/a n/a n/a n/a n/a n/a
2006 n/a n/a n/a n/a n/a n/a
2007 n/a n/a n/a n/a n/a n/a
2008 n/a n/a n/a n/a n/a n/a
2009 n/a n/a n/a n/a n/a n/a
2010 57.5 52.6 49.8 n/a n/a 56.9
2011 57.5 52.6 49.8 n/a n/a 56.9
2012 57.5 52.6 49.8 n/a n/a 56.9
2013 57.5 52.6 49.8 n/a n/a 56.9
2014 57.5 52.6 49.8 n/a n/a 56.9
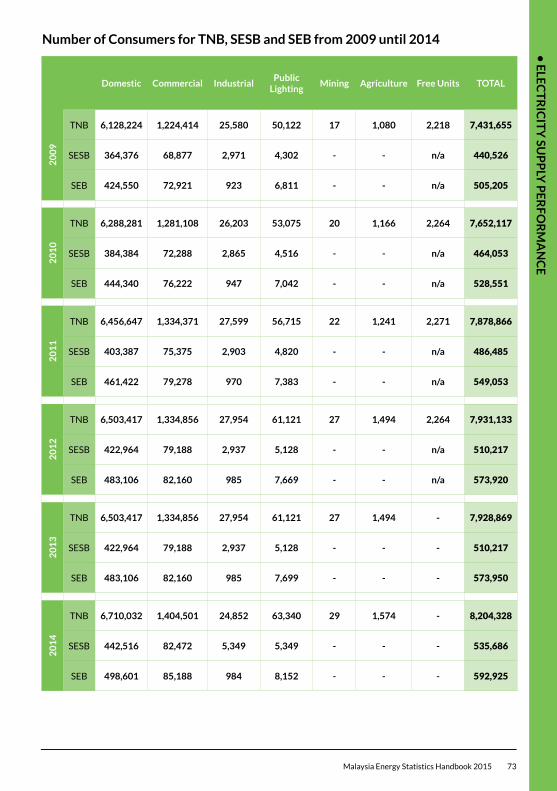
• E
LEC
TR
ICIT
Y SU
PP
LY P
ER
FO
RM
AN
CE
Malaysia Energy Statistics Handbook 2015 73
Domestic Commercial IndustrialPublic
LightingMining Agriculture Free Units TOTAL
20
09
TNB 6,128,224 1,224,414 25,580 50,122 17 1,080 2,218 7,431,655
SESB 364,376 68,877 2,971 4,302 - - n/a 440,526
SEB 424,550 72,921 923 6,811 - - n/a 505,205
20
10
TNB 6,288,281 1,281,108 26,203 53,075 20 1,166 2,264 7,652,117
SESB 384,384 72,288 2,865 4,516 - - n/a 464,053
SEB 444,340 76,222 947 7,042 - - n/a 528,551
20
11
TNB 6,456,647 1,334,371 27,599 56,715 22 1,241 2,271 7,878,866
SESB 403,387 75,375 2,903 4,820 - - n/a 486,485
SEB 461,422 79,278 970 7,383 - - n/a 549,053
20
12
TNB 6,503,417 1,334,856 27,954 61,121 27 1,494 2,264 7,931,133
SESB 422,964 79,188 2,937 5,128 - - n/a 510,217
SEB 483,106 82,160 985 7,669 - - n/a 573,920
20
13
TNB 6,503,417 1,334,856 27,954 61,121 27 1,494 - 7,928,869
SESB 422,964 79,188 2,937 5,128 - - - 510,217
SEB 483,106 82,160 985 7,699 - - - 573,950
20
14
TNB 6,710,032 1,404,501 24,852 63,340 29 1,574 - 8,204,328
SESB 442,516 82,472 5,349 5,349 - - - 535,686
SEB 498,601 85,188 984 8,152 - - - 592,925
Number of Consumers for TNB, SESB and SEB from 2009 until 2014
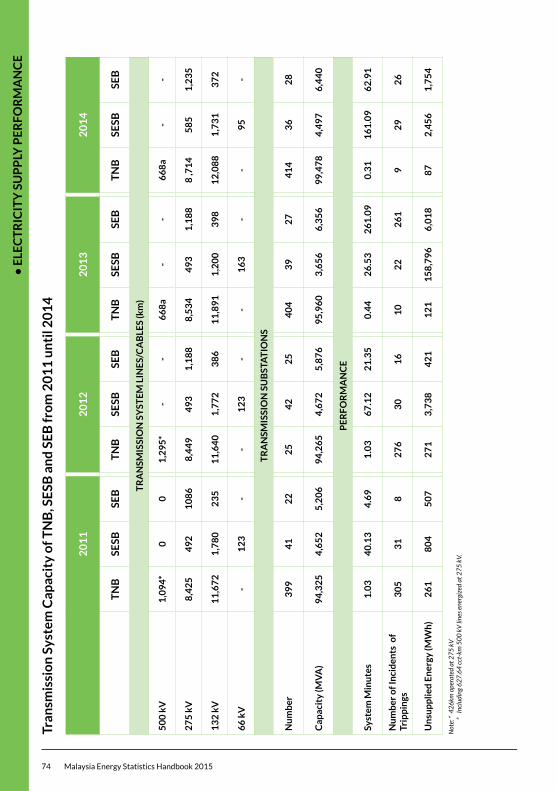
• E
LEC
TR
ICIT
Y S
UP
PLY
PE
RF
OR
MA
NC
E
74 Malaysia Energy Statistics Handbook 2015
20
11
20
12
20
13
20
14
TN
BSE
SBSE
BT
NB
SESB
SEB
TN
BSE
SBSE
BT
NB
SESB
SEB
TR
AN
SMIS
SIO
N S
YST
EM
LIN
ES/
CA
BLE
S (k
m)
50
0 k
V1
,09
4*
00
1,2
95
*-
-6
68
a-
-6
68
a-
-
27
5 k
V8
,42
54
92
10
86
8,4
49
49
31
,18
88
,53
44
93
1,1
88
8 ,7
14
58
51
,23
5
13
2 k
V1
1,6
72
1,7
80
23
51
1,6
40
1,7
72
38
61
1,8
91
1,2
00
39
81
2,0
88
1,7
31
37
2
66
kV
-1
23
--
12
3-
-1
63
--
95
-
TR
AN
SMIS
SIO
N S
UB
STA
TIO
NS
Nu
mb
er3
99
41
22
25
42
25
40
43
92
74
14
36
28
Cap
acit
y (M
VA
)9
4,3
25
4,6
52
5,2
06
94
,26
54
,67
25
,87
69
5,9
60
3,6
56
6,3
56
99
,47
84
,49
76
,44
0
PE
RF
OR
MA
NC
E
Syst
em M
inu
tes
1.0
34
0.1
34
.69
1.0
36
7.1
22
1.3
50
.44
26
.53
26
1.0
90
.31
16
1.0
96
2.9
1
Nu
mb
er o
f In
cid
ents
of
Trip
pin
gs
3
05
31
82
76
30
16
10
22
26
19
29
26
Un
sup
plie
d E
ner
gy (M
Wh
)2
61
80
45
07
27
13
,73
84
21
12
11
58
,79
66
,01
88
72
,45
61
,75
4
Not
e: *
426
km o
pera
ted
at 2
75 k
V
ª
Incl
udin
g 62
7.64
cct
-km
500
kV
line
s ene
rgiz
ed a
t 275
kV.
Tr
ansm
issi
on
Sys
tem
Cap
acit
y o
f TN
B, S
ESB
an
d S
EB
fro
m 2
01
1 u
nti
l 20
14
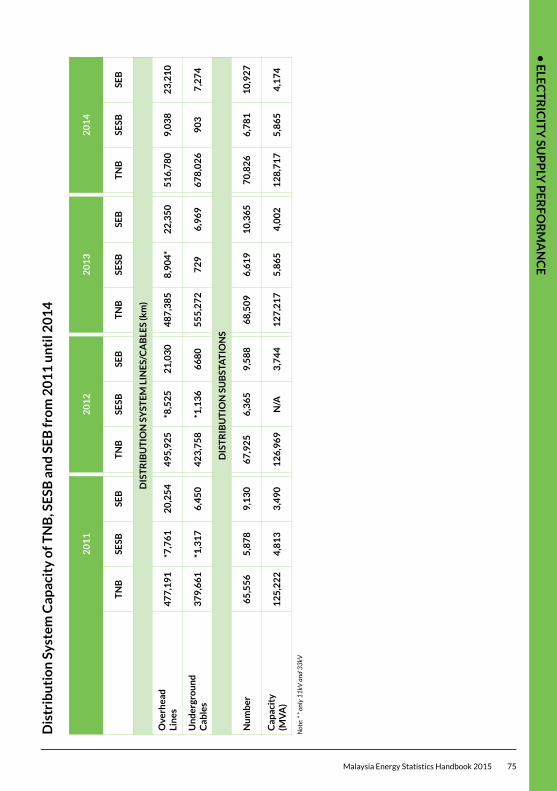
• E
LEC
TR
ICIT
Y SU
PP
LY P
ER
FO
RM
AN
CE
Malaysia Energy Statistics Handbook 2015 75
20
11
20
12
20
13
20
14
TN
BSE
SBSE
BT
NB
SESB
SEB
TN
BSE
SBSE
BT
NB
SESB
SEB
DIS
TR
IBU
TIO
N S
YST
EM
LIN
ES/
CA
BLE
S (k
m)
Ove
rhea
d
Lin
es4
77
,19
1*7
,76
12
0,2
54
49
5,9
25
*8,5
25
21
,03
04
87
,38
58
,90
4*
22
,35
05
16
,78
09
,03
82
3,2
10
Un
der
gro
un
d
Cab
les
37
9,6
61
*1,3
17
6,4
50
42
3,7
58
*1,1
36
66
80
55
5,2
72
72
96
,96
96
78
,02
69
03
7,2
74
DIS
TR
IBU
TIO
N S
UB
STA
TIO
NS
Nu
mb
er6
5,5
56
5,8
78
9,1
30
67
,92
56
,36
59
,58
86
8,5
09
6,6
19
10
,36
57
0,8
26
6,7
81
10
,92
7
Cap
acit
y
(MV
A)
12
5,2
22
4,8
13
3,4
90
12
6,9
69
N/A
3,7
44
12
7,2
17
5,8
65
4,0
02
12
8,7
17
5,8
65
4,1
74
Not
e: *
* onl
y 11
kV a
nd 3
3kV
Dis
trib
uti
on
Sys
tem
Cap
acit
y o
f TN
B, S
ESB
an
d S
EB
fro
m 2
01
1 u
nti
l 20
14
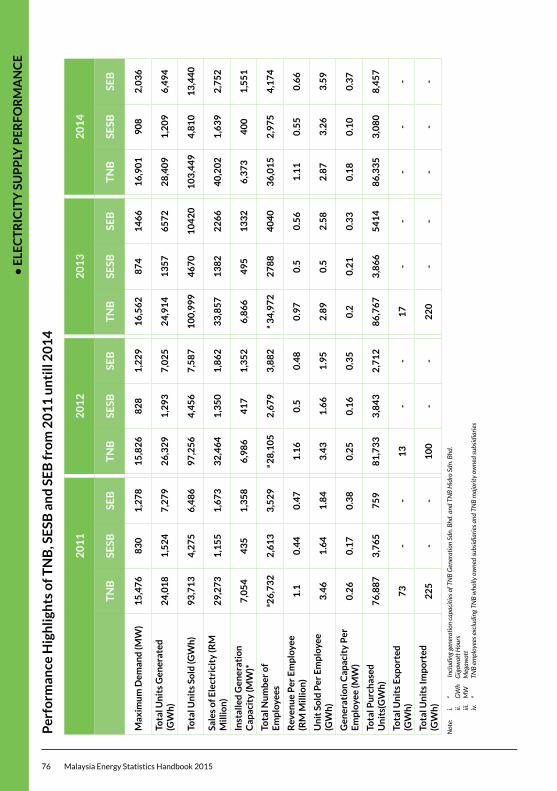
• E
LEC
TR
ICIT
Y S
UP
PLY
PE
RF
OR
MA
NC
E
76 Malaysia Energy Statistics Handbook 2015
20
11
20
12
20
13
20
14
TN
BSE
SBSE
BT
NB
SESB
SEB
TN
BSE
SBSE
BT
NB
SESB
SEB
Max
imu
m D
eman
d (M
W)
15
,47
68
30
1,2
78
15
,82
68
28
1,2
29
16
,56
28
74
14
66
16
,90
19
08
2,0
36
Tota
l Un
its
Gen
erat
ed
(GW
h)
24
,01
81
,52
47
,27
92
6,3
29
1,2
93
7,0
25
24
,91
41
35
76
57
22
8,4
09
1,2
09
6,4
94
Tota
l Un
its
Sold
(GW
h)
93
,71
34
,27
56
,48
69
7,2
56
4,4
56
7,5
87
10
0,9
99
46
70
10
42
01
03
,44
94
,81
01
3,4
40
Sale
s o
f Ele
ctri
city
(RM
M
illio
n)
29
,27
31
,15
51
,67
33
2,4
64
1,3
50
1,8
62
33
,85
71
38
22
26
64
0,2
02
1,6
39
2,7
52
Inst
alle
d G
ener
atio
n
Cap
acit
y (M
W)*
7,0
54
43
51
,35
86
,98
64
17
1,3
52
6,8
66
49
51
33
26
,37
34
00
1,5
51
Tota
l Nu
mb
er o
f E
mp
loye
esª2
6,7
32
2,6
13
3,5
29
ª 28
,10
52
,67
93
,88
2ª 3
4,9
72
27
88
40
40
36
,01
52
,97
54
,17
4
Rev
enu
e P
er E
mp
loye
e (R
M M
illio
n)
1.1
0.4
40
.47
1.1
60
.50
.48
0.9
70
.50
.56
1.1
10
.55
0.6
6
Un
it S
old
Per
Em
plo
yee
(GW
h)
3.4
61
.64
1.8
43
.43
1.6
61
.95
2.8
90
.52
.58
2.8
73
.26
3.5
9
Gen
erat
ion
Cap
acit
y P
er
Em
plo
yee
(MW
)0
.26
0.1
70
.38
0.2
50
.16
0.3
50
.20
.21
0.3
30
.18
0.1
00
.37
Tota
l Pu
rch
ased
U
nit
s(G
Wh
) 7
6,8
87
3,7
65
75
98
1,7
33
3,8
43
2,7
12
86
,76
73
,86
65
41
48
6,3
35
3,0
80
8,4
57
Tota
l Un
its
Exp
ort
ed
(GW
h)
73
--
13
--
17
--
--
-
Tota
l Un
its
Imp
ort
ed
(GW
h)
22
5-
-1
00
--
22
0-
--
--
Not
e:
i. *
Incl
udin
g ge
nera
tion
cap
acit
ies o
f TN
B G
ener
atio
n Sd
n. B
hd. a
nd T
NB
Hid
ro S
dn. B
hd.
ii.
G
Wh
Gig
awat
t Hou
rs
iii.
MW
M
egaw
att
iv.
ª TN
B e
mpl
oyee
s exc
ludi
ng T
NB
who
lly o
wne
d su
bsid
iari
es a
nd T
NB
maj
orit
y ow
ned
subs
idia
ries
Per
form
ance
Hig
hlig
hts
of T
NB
, SE
SB a
nd
SE
B fr
om
20
11
un
till
20
14
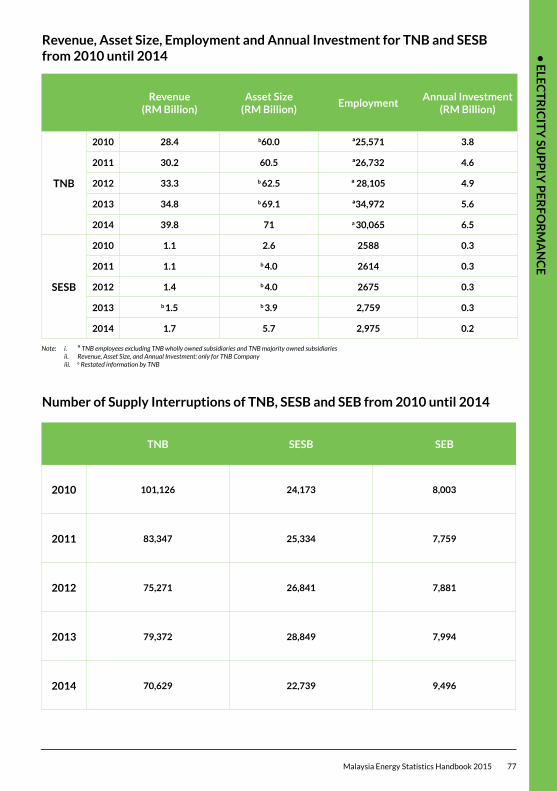
• E
LEC
TR
ICIT
Y SU
PP
LY P
ER
FO
RM
AN
CE
Malaysia Energy Statistics Handbook 2015 77
Revenue (RM Billion)
Asset Size (RM Billion)
EmploymentAnnual Investment
(RM Billion)
TNB
2010 28.4 b60.0 ª25,571 3.8
2011 30.2 60.5 ª26,732 4.6
2012 33.3 b 62.5 ª 28,105 4.9
2013 34.8 b 69.1 ª34,972 5.6
2014 39.8 71 a 30,065 6.5
SESB
2010 1.1 2.6 2588 0.3
2011 1.1 b 4.0 2614 0.3
2012 1.4 b 4.0 2675 0.3
2013 b 1.5 b 3.9 2,759 0.3
2014 1.7 5.7 2,975 0.2 Note: i. ª TNB employees excluding TNB wholly owned subsidiaries and TNB majority owned subsidiaries ii. Revenue, Asset Size, and Annual Investment: only for TNB Company iii. b Restated information by TNB
TNB SESB SEB
2010 101,126 24,173 8,003
2011 83,347 25,334 7,759
2012 75,271 26,841 7,881
2013 79,372 28,849 7,994
2014 70,629 22,739 9,496
Revenue, Asset Size, Employment and Annual Investment for TNB and SESB from 2010 until 2014
Number of Supply Interruptions of TNB, SESB and SEB from 2010 until 2014
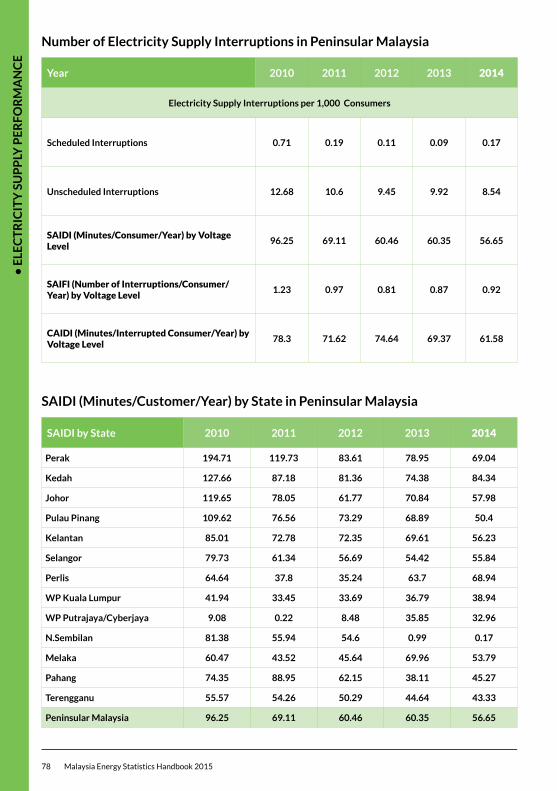
• E
LEC
TR
ICIT
Y S
UP
PLY
PE
RF
OR
MA
NC
E
78 Malaysia Energy Statistics Handbook 2015
Number of Electricity Supply Interruptions in Peninsular Malaysia
SAIDI (Minutes/Customer/Year) by State in Peninsular Malaysia
Year 2010 2011 2012 2013 2014
Electricity Supply Interruptions per 1,000 Consumers
Scheduled Interruptions 0.71 0.19 0.11 0.09 0.17
Unscheduled Interruptions 12.68 10.6 9.45 9.92 8.54
SAIDI (Minutes/Consumer/Year) by Voltage Level
96.25 69.11 60.46 60.35 56.65
SAIFI (Number of Interruptions/Consumer/Year) by Voltage Level
1.23 0.97 0.81 0.87 0.92
CAIDI (Minutes/Interrupted Consumer/Year) by Voltage Level
78.3 71.62 74.64 69.37 61.58
SAIDI by State 2010 2011 2012 2013 2014
Perak 194.71 119.73 83.61 78.95 69.04
Kedah 127.66 87.18 81.36 74.38 84.34
Johor 119.65 78.05 61.77 70.84 57.98
Pulau Pinang 109.62 76.56 73.29 68.89 50.4
Kelantan 85.01 72.78 72.35 69.61 56.23
Selangor 79.73 61.34 56.69 54.42 55.84
Perlis 64.64 37.8 35.24 63.7 68.94
WP Kuala Lumpur 41.94 33.45 33.69 36.79 38.94
WP Putrajaya/Cyberjaya 9.08 0.22 8.48 35.85 32.96
N.Sembilan 81.38 55.94 54.6 0.99 0.17
Melaka 60.47 43.52 45.64 69.96 53.79
Pahang 74.35 88.95 62.15 38.11 45.27
Terengganu 55.57 54.26 50.29 44.64 43.33
Peninsular Malaysia 96.25 69.11 60.46 60.35 56.65
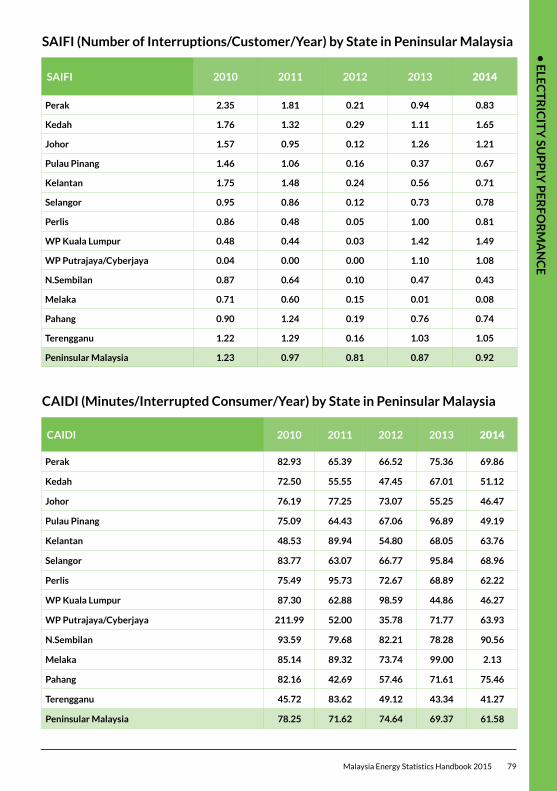
• E
LEC
TR
ICIT
Y SU
PP
LY P
ER
FO
RM
AN
CE
Malaysia Energy Statistics Handbook 2015 79
SAIFI (Number of Interruptions/Customer/Year) by State in Peninsular Malaysia
CAIDI (Minutes/Interrupted Consumer/Year) by State in Peninsular Malaysia
SAIFI 2010 2011 2012 2013 2014
Perak 2.35 1.81 0.21 0.94 0.83
Kedah 1.76 1.32 0.29 1.11 1.65
Johor 1.57 0.95 0.12 1.26 1.21
Pulau Pinang 1.46 1.06 0.16 0.37 0.67
Kelantan 1.75 1.48 0.24 0.56 0.71
Selangor 0.95 0.86 0.12 0.73 0.78
Perlis 0.86 0.48 0.05 1.00 0.81
WP Kuala Lumpur 0.48 0.44 0.03 1.42 1.49
WP Putrajaya/Cyberjaya 0.04 0.00 0.00 1.10 1.08
N.Sembilan 0.87 0.64 0.10 0.47 0.43
Melaka 0.71 0.60 0.15 0.01 0.08
Pahang 0.90 1.24 0.19 0.76 0.74
Terengganu 1.22 1.29 0.16 1.03 1.05
Peninsular Malaysia 1.23 0.97 0.81 0.87 0.92
CAIDI 2010 2011 2012 2013 2014
Perak 82.93 65.39 66.52 75.36 69.86
Kedah 72.50 55.55 47.45 67.01 51.12
Johor 76.19 77.25 73.07 55.25 46.47
Pulau Pinang 75.09 64.43 67.06 96.89 49.19
Kelantan 48.53 89.94 54.80 68.05 63.76
Selangor 83.77 63.07 66.77 95.84 68.96
Perlis 75.49 95.73 72.67 68.89 62.22
WP Kuala Lumpur 87.30 62.88 98.59 44.86 46.27
WP Putrajaya/Cyberjaya 211.99 52.00 35.78 71.77 63.93
N.Sembilan 93.59 79.68 82.21 78.28 90.56
Melaka 85.14 89.32 73.74 99.00 2.13
Pahang 82.16 42.69 57.46 71.61 75.46
Terengganu 45.72 83.62 49.12 43.34 41.27
Peninsular Malaysia 78.25 71.62 74.64 69.37 61.58
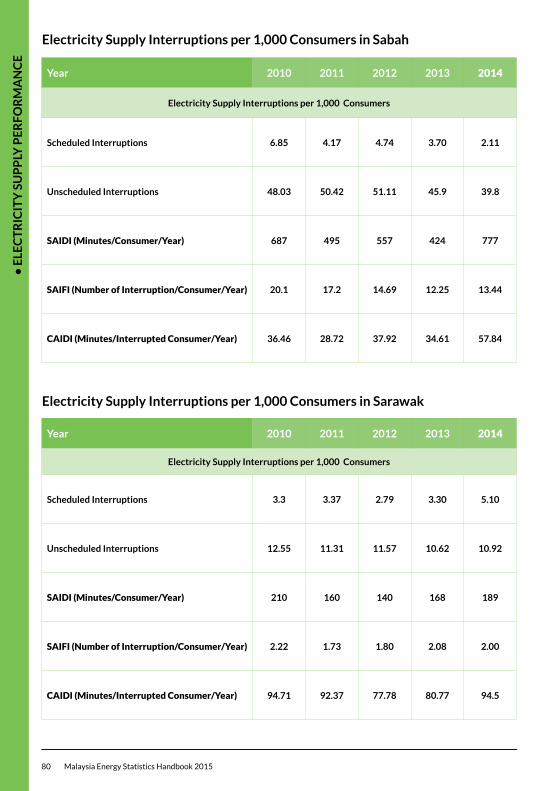
• E
LEC
TR
ICIT
Y S
UP
PLY
PE
RF
OR
MA
NC
E
80 Malaysia Energy Statistics Handbook 2015
Electricity Supply Interruptions per 1,000 Consumers in Sabah
Electricity Supply Interruptions per 1,000 Consumers in Sarawak
Year 2010 2011 2012 2013 2014
Electricity Supply Interruptions per 1,000 Consumers
Scheduled Interruptions 6.85 4.17 4.74 3.70 2.11
Unscheduled Interruptions 48.03 50.42 51.11 45.9 39.8
SAIDI (Minutes/Consumer/Year) 687 495 557 424 777
SAIFI (Number of Interruption/Consumer/Year) 20.1 17.2 14.69 12.25 13.44
CAIDI (Minutes/Interrupted Consumer/Year) 36.46 28.72 37.92 34.61 57.84
Year 2010 2011 2012 2013 2014
Electricity Supply Interruptions per 1,000 Consumers
Scheduled Interruptions 3.3 3.37 2.79 3.30 5.10
Unscheduled Interruptions 12.55 11.31 11.57 10.62 10.92
SAIDI (Minutes/Consumer/Year) 210 160 140 168 189
SAIFI (Number of Interruption/Consumer/Year) 2.22 1.73 1.80 2.08 2.00
CAIDI (Minutes/Interrupted Consumer/Year) 94.71 92.37 77.78 80.77 94.5
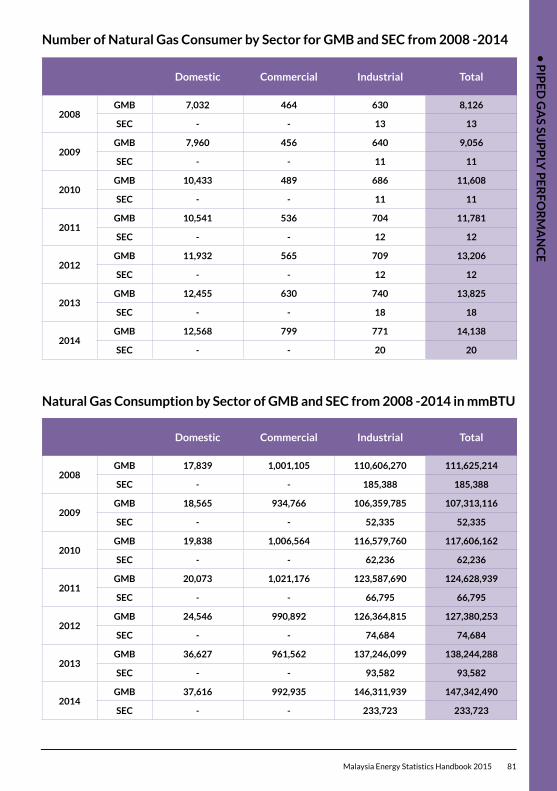
• P
IPE
D G
AS SU
PP
LY P
ER
FO
RM
AN
CE
Malaysia Energy Statistics Handbook 2015 81
Number of Natural Gas Consumer by Sector for GMB and SEC from 2008 -2014
Natural Gas Consumption by Sector of GMB and SEC from 2008 -2014 in mmBTU
Domestic Commercial Industrial Total
2008GMB 7,032 464 630 8,126
SEC - - 13 13
2009GMB 7,960 456 640 9,056
SEC - - 11 11
2010GMB 10,433 489 686 11,608
SEC - - 11 11
2011GMB 10,541 536 704 11,781
SEC - - 12 12
2012GMB 11,932 565 709 13,206
SEC - - 12 12
2013GMB 12,455 630 740 13,825
SEC - - 18 18
2014GMB 12,568 799 771 14,138
SEC - - 20 20
Domestic Commercial Industrial Total
2008GMB 17,839 1,001,105 110,606,270 111,625,214
SEC - - 185,388 185,388
2009GMB 18,565 934,766 106,359,785 107,313,116
SEC - - 52,335 52,335
2010GMB 19,838 1,006,564 116,579,760 117,606,162
SEC - - 62,236 62,236
2011GMB 20,073 1,021,176 123,587,690 124,628,939
SEC - - 66,795 66,795
2012GMB 24,546 990,892 126,364,815 127,380,253
SEC - - 74,684 74,684
2013GMB 36,627 961,562 137,246,099 138,244,288
SEC - - 93,582 93,582
2014GMB 37,616 992,935 146,311,939 147,342,490
SEC - - 233,723 233,723
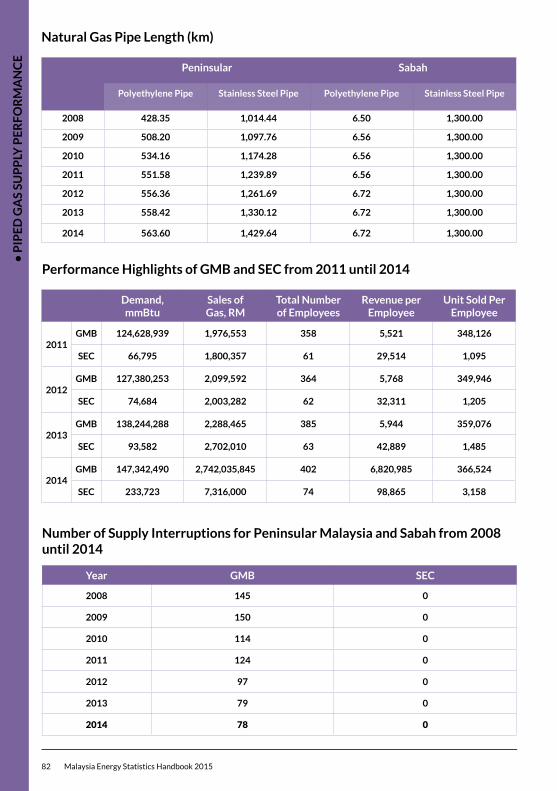
• P
IPE
D G
AS
SUP
PLY
PE
RF
OR
MA
NC
E
82 Malaysia Energy Statistics Handbook 2015
Natural Gas Pipe Length (km)
Performance Highlights of GMB and SEC from 2011 until 2014
Peninsular Sabah
Polyethylene Pipe Stainless Steel Pipe Polyethylene Pipe Stainless Steel Pipe
2008 428.35 1,014.44 6.50 1,300.00
2009 508.20 1,097.76 6.56 1,300.00
2010 534.16 1,174.28 6.56 1,300.00
2011 551.58 1,239.89 6.56 1,300.00
2012 556.36 1,261.69 6.72 1,300.00
2013 558.42 1,330.12 6.72 1,300.00
2014 563.60 1,429.64 6.72 1,300.00
Demand, mmBtu
Sales of Gas, RM
Total Number of Employees
Revenue per Employee
Unit Sold Per Employee
2011GMB 124,628,939 1,976,553 358 5,521 348,126
SEC 66,795 1,800,357 61 29,514 1,095
2012GMB 127,380,253 2,099,592 364 5,768 349,946
SEC 74,684 2,003,282 62 32,311 1,205
2013GMB 138,244,288 2,288,465 385 5,944 359,076
SEC 93,582 2,702,010 63 42,889 1,485
2014GMB 147,342,490 2,742,035,845 402 6,820,985 366,524
SEC 233,723 7,316,000 74 98,865 3,158
Number of Supply Interruptions for Peninsular Malaysia and Sabah from 2008 until 2014
Year GMB SEC
2008 145 0
2009 150 0
2010 114 0
2011 124 0
2012 97 0
2013 79 0
2014 78 0
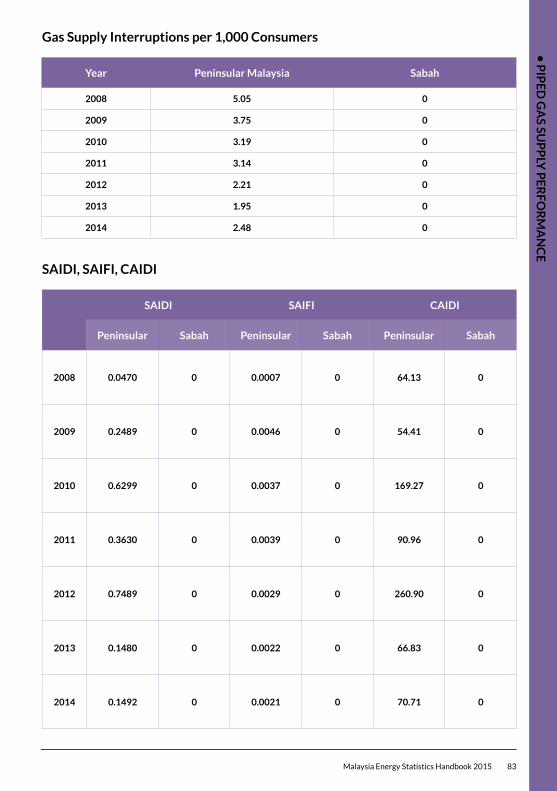
• P
IPE
D G
AS SU
PP
LY P
ER
FO
RM
AN
CE
Malaysia Energy Statistics Handbook 2015 83
Number of Supply Interruptions for Peninsular Malaysia and Sabah from 2008 until 2014
Gas Supply Interruptions per 1,000 Consumers
SAIDI, SAIFI, CAIDI
Year Peninsular Malaysia Sabah
2008 5.05 0
2009 3.75 0
2010 3.19 0
2011 3.14 0
2012 2.21 0
2013 1.95 0
2014 2.48 0
SAIDI SAIFI CAIDI
Peninsular Sabah Peninsular Sabah Peninsular Sabah
2008 0.0470 0 0.0007 0 64.13 0
2009 0.2489 0 0.0046 0 54.41 0
2010 0.6299 0 0.0037 0 169.27 0
2011 0.3630 0 0.0039 0 90.96 0
2012 0.7489 0 0.0029 0 260.90 0
2013 0.1480 0 0.0022 0 66.83 0
2014 0.1492 0 0.0021 0 70.71 0
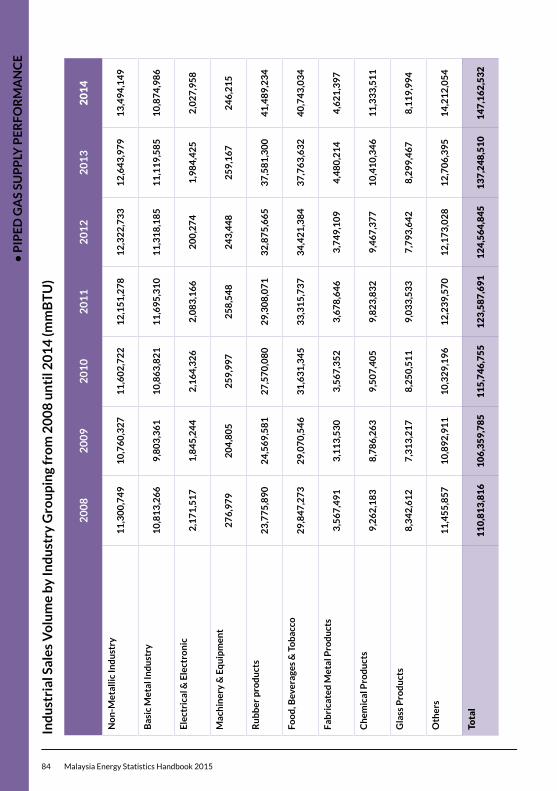
• P
IPE
D G
AS
SUP
PLY
PE
RF
OR
MA
NC
E
84 Malaysia Energy Statistics Handbook 2015
Ind
ust
rial
Sal
es V
olu
me
by In
du
stry
Gro
up
ing
fro
m 2
00
8 u
nti
l 20
14
(mm
BT
U)
20
08
20
09
20
10
20
11
20
12
20
13
20
14
No
n-M
etal
lic In
du
stry
11
,30
0,7
49
10
,76
0,3
27
11
,60
2,7
22
12
,15
1,2
78
12
,32
2,7
33
12
,64
3,9
79
13
,49
4,1
49
Bas
ic M
etal
Ind
ust
ry1
0,8
13
,26
69
,80
3,3
61
10
,86
3,8
21
11
,69
5,3
10
11
,31
8,1
85
11
,11
9,5
85
10
,87
4,9
86
Ele
ctri
cal &
Ele
ctro
nic
2,1
71
,51
71
,84
5,2
44
2,1
64
,32
62
,08
3,1
66
20
0,2
74
1,9
84
,42
52
,02
7,9
58
Mac
hin
ery
& E
qu
ipm
ent
27
6,9
79
20
4,8
05
25
9,9
97
25
8,5
48
24
3,4
48
25
9,1
67
24
6,2
15
Ru
bb
er p
rod
uct
s2
3,7
75
,89
02
4,5
69
,58
12
7,5
70
,08
02
9,3
08
,07
13
2,8
75
,66
53
7,5
81
,30
04
1,4
89
,23
4
Foo
d, B
ever
ages
& T
ob
acco
29
,84
7,2
73
29
,07
0,5
46
31
,63
1,3
45
33
,31
5,7
37
34
,42
1,3
84
37
,76
3,6
32
40
,74
3,0
34
Fab
rica
ted
Met
al P
rod
uct
s3
,56
7,4
91
3,1
13
,53
03
,56
7,3
52
3,6
78
,64
63
,74
9,1
09
4,4
80
,21
44
,62
1,3
97
Ch
emic
al P
rod
uct
s9
,26
2,1
83
8,7
86
,26
39
,50
7,4
05
9,8
23
,83
29
,46
7,3
77
10
,41
0,3
46
11
,33
3,5
11
Gla
ss P
rod
uct
s8
,34
2,6
12
7,3
13
,21
78
,25
0,5
11
9,0
33
,53
37
,79
3,6
42
8,2
99
,46
78
,11
9,9
94
Oth
ers
11
,45
5,8
57
10
,89
2,9
11
10
,32
9,1
96
12
,23
9,5
70
12
,17
3,0
28
12
,70
6,3
95
14
,21
2,0
54
Tota
l1
10
,81
3,8
16
10
6,3
59
,78
51
15
,74
6,7
55
12
3,5
87
,69
11
24
,56
4,8
45
13
7,2
48
,51
01
47
,16
2,5
32
• N
OT
ES O
F E
NE
RG
Y B
ALA
NC
E
Malaysia Energy Statistics Handbook 2015 85
The net calorific value (NCV) was chosen as the basis of calculations rather than the gross calorific value (GCV). The Joule was used as the rigorous accounting unit, while the “tonne oil equivalent” (1 toe = 41.84 Gigajoules) was chosen as the final unit for presentation in the Energy Balance.
COMMERCIAL ENERGY BALANCE FORMATThe rows of the Energy Balance tables contain the following items:
Primary supplyrefers to supply of energy that has not undergone the transformations / conversion process within the country.
Primary Production (1)refers to the quantity of fuels extracted. Data for natural gas excludes the amount of reinjected and flared gas. Gross production of hydro is shown in conventional fuel equivalent input.
Gas Flaring, Reinjection & Use (2)
refer to the quantity of gas flared, reinjected into the gas fields and used for production purpose.
Imports (3) and Exports (4)
refers to the amount of primary and secondary energy obtained from, or supplied to, other countries. In the energy balance format, imports always carry a positive and export a negative sign.
Bunkers (5)refer to the amount of fuels delivered to ocean-going ships of all flags engaged in international traffic.
Stock Change (6)
refers to the difference between the amounts of fuel in stocks at the beginning and end of year and should ideally cover producers, importers and industrial consumers. At this stage, however, only oil companies’ stocks are taken into account. A negative sign indicates net increases while a positive sign indicates net decreases in stocks.
Total under primary supply, ‘total’ is the addition of columns to obtain total availability. Under transformation, ‘total’ is the addition of columns to obtain transformation and conversion losses.
Gas Plants (9)shows the input of natural gas into the LNG, MDS and GPP-LPG plants and their respective outputs.
Refineries(10),Powerstations and Co-generation & Private licensees (11)
shows the input of any energy product (negative sign) for the purpose of converting it to one or more secondary products (positive sign).
Losses and own use (12)
refers to losses of electrical energy and natural gas which occur outside the utilities and plants (i.e. distribution losses) and the consumption of energy by utilities and plants for operating their installation (i.e. electricity for operating auxiliary equipment and petroleum products used in the crude distillation process respectively). It does not, however, include conversion loss that is accounted for in the ‘total’ column.
• N
OT
ES
OF
EN
ER
GY
BA
LAN
CE
86 Malaysia Energy Statistics Handbook 2015
Secondary supply (14)refers to the supply of energy from the transformation process and after deducting the energy sector’s own use and losses, including power station use.
Residential and commercial (15 & 16)
not only refers to energy used within households and commercial establishments but includes government buildings and institutions.
Industrial (17)is a very broad-based sector ranging from manufacturing to mining and construction. Diesel sales through distributors are assumed to be to industrial consumers.
Transport (18)basically refers to all sales of motor gasoline and diesel from service stations and sales of aviation fuel. It also includes diesel and motor gasoline sold directly to the government and military.
Agriculture (19)covers agriculture, forestry and fishing.
Non-energy use (20)use of products resulting from the transformation process for non-energy purpose (i.e. bitumen/lubricants, asphalt/greases) and use of energy products (such as natural gas) as industrial feed stocks
Final use (21)refers to the quantity of energy of all kinds delivered to the final user.
I) Non-commercial energy such as firewood and other biomass fuels have been excluded in the energy balance until more reliable data are made available.
II) The output side of the final user’s equipment of device i.e. useful energy will not be dealt with in the balance as it will involve assessing the efficiencies of end - use equipment operating under various different conditions.
• N
OT
ES O
F E
NE
RG
Y B
ALA
NC
E
Malaysia Energy Statistics Handbook 2015 87
Reserve Margin
Total capacity margin is defined as the amount of installed generation available over and above system peak load
ReserveMargin=InstalledCapacity–PeakDemand Peak Demand
Peak Demand
The maximum power demand registered by a customer or a group of customers or a system in a stated period of time such as a month or a year. The value may be the maximum instantaneous load or more usually, the average load over a designated interval of time, such as half an hour and is normally stated in kilowatts or megawatts.
Installed CapacityInstalled capacity is defined as the maximum possible capacity (nameplate rating) that can be provided by the plant.
Dependable CapacityThe maximum capacity, modified for ambient limitations for a specified period of time, such as a month or a season.
Available CapacityAvailable capacity refers to the Latest Tested Net Capacity. It is the dependable capacity, modified for equipment limitation at any time.
Unit Generated (Gross Generation)
The total amount of electric energy produced by generating units and measured at the generating terminal in kilowatt-hours (kWh) or megawatt hours (MWh)
Unit Sent Out From Station(s) (Net Generation)
The amount of gross generation less the electrical energy consumed at the generating station(s) for station service or auxiliaries.
Measured Resources
Refers to coal for which estimates of the rank and quantity have been computed to a high degree of geologic assurance, from sample analyses and measurements from closely spaced and geologically well known sample sites.
Indicated Resources
Refers to coal for which estimates of the rank, quality, and quantity have been computed to a moderate degree of geologic assurance, partly from sample analyses and measurements and partly from reasonable geologic projections.
Inferred Resources
Refers to coal of a low degree of geologic assurance in unexplored extensions of demonstrated resources for which estimates of the quality and size are based on geologic evidence and projection. Quantitative estimates are based on broad knowledge of the geologic character of the bed or region where few measurements or sampling points are available and on assumed continuation from demonstrated coal for which there is geologic evidence.
Notes of Electricity
Notes of Coal
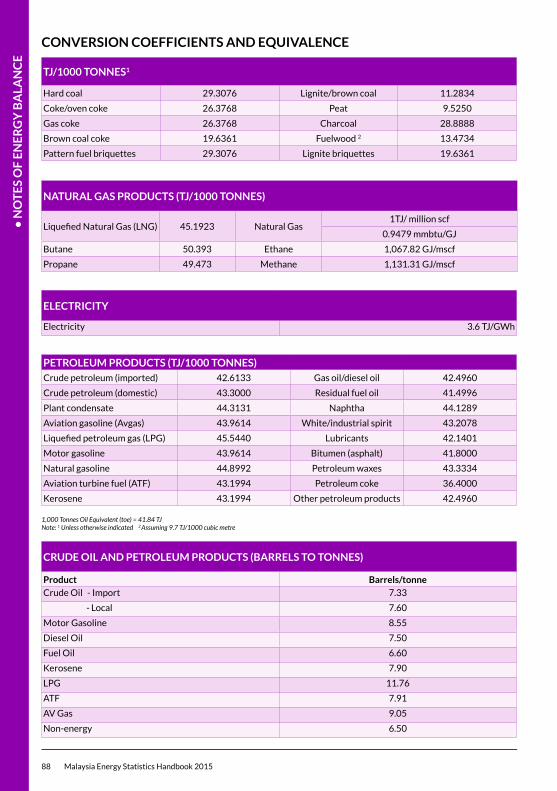
• N
OT
ES
OF
EN
ER
GY
BA
LAN
CE
88 Malaysia Energy Statistics Handbook 2015
CRUDE OIL AND PETROLEUM PRODUCTS (BARRELS TO TONNES)
Product Barrels/tonneCrude Oil - Import 7.33
- Local 7.60
Motor Gasoline 8.55
Diesel Oil 7.50
Fuel Oil 6.60
Kerosene 7.90
LPG 11.76
ATF 7.91
AV Gas 9.05
Non-energy 6.50
CONVERSION COEFFICIENTS AND EQUIVALENCE
TJ/1000 TONNES1
Hard coal 29.3076 Lignite/brown coal 11.2834
Coke/oven coke 26.3768 Peat 9.5250
Gas coke 26.3768 Charcoal 28.8888
Brown coal coke 19.6361 Fuelwood 2 13.4734
Pattern fuel briquettes 29.3076 Lignite briquettes 19.6361
PETROLEUM PRODUCTS (TJ/1000 TONNES)Crude petroleum (imported) 42.6133 Gas oil/diesel oil 42.4960
Crude petroleum (domestic) 43.3000 Residual fuel oil 41.4996
Plant condensate 44.3131 Naphtha 44.1289
Aviation gasoline (Avgas) 43.9614 White/industrial spirit 43.2078
Liquefied petroleum gas (LPG) 45.5440 Lubricants 42.1401
Motor gasoline 43.9614 Bitumen (asphalt) 41.8000
Natural gasoline 44.8992 Petroleum waxes 43.3334
Aviation turbine fuel (ATF) 43.1994 Petroleum coke 36.4000
Kerosene 43.1994 Other petroleum products 42.4960
1,000 Tonnes Oil Equivalent (toe) = 41.84 TJ Note: 1
Unless otherwise indicated 2 Assuming 9.7 TJ/1000 cubic metre
ELECTRICITY
Electricity 3.6 TJ/GWh
NATURAL GAS PRODUCTS (TJ/1000 TONNES)
Liquefied Natural Gas (LNG) 45.1923 Natural Gas1TJ/ million scf
0.9479 mmbtu/GJ
Butane 50.393 Ethane 1,067.82 GJ/mscf
Propane 49.473 Methane 1,131.31 GJ/mscf
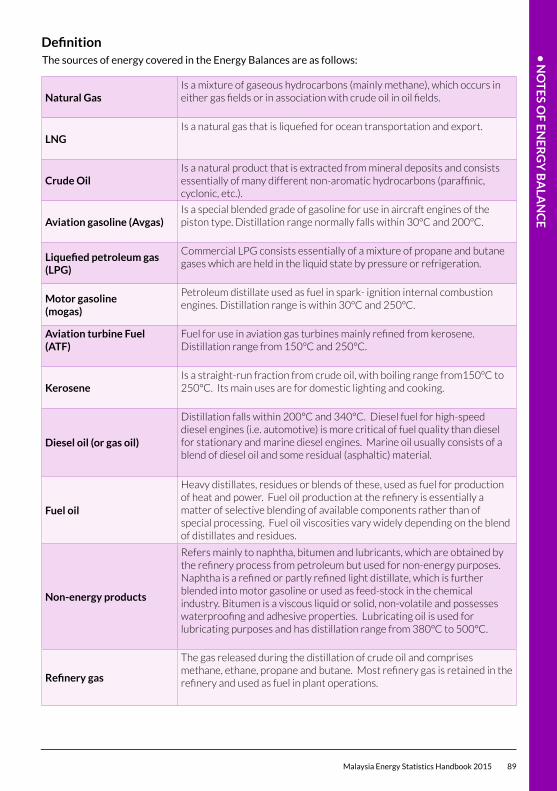
• N
OT
ES O
F E
NE
RG
Y B
ALA
NC
E
Malaysia Energy Statistics Handbook 2015 89
DefinitionThe sources of energy covered in the Energy Balances are as follows:
Natural GasIs a mixture of gaseous hydrocarbons (mainly methane), which occurs in either gas fields or in association with crude oil in oil fields.
LNGIs a natural gas that is liquefied for ocean transportation and export.
Crude OilIs a natural product that is extracted from mineral deposits and consists essentially of many different non-aromatic hydrocarbons (paraffinic, cyclonic, etc.).
Aviation gasoline (Avgas)Is a special blended grade of gasoline for use in aircraft engines of the piston type. Distillation range normally falls within 30°C and 200°C.
Liquefiedpetroleumgas(LPG)
Commercial LPG consists essentially of a mixture of propane and butane gases which are held in the liquid state by pressure or refrigeration.
Motor gasoline (mogas)
Petroleum distillate used as fuel in spark- ignition internal combustion engines. Distillation range is within 30°C and 250°C.
Aviation turbine Fuel (ATF)
Fuel for use in aviation gas turbines mainly refined from kerosene. Distillation range from 150°C and 250°C.
Kerosene Is a straight-run fraction from crude oil, with boiling range from150°C to 250°C. Its main uses are for domestic lighting and cooking.
Diesel oil (or gas oil)
Distillation falls within 200°C and 340°C. Diesel fuel for high-speed diesel engines (i.e. automotive) is more critical of fuel quality than diesel for stationary and marine diesel engines. Marine oil usually consists of a blend of diesel oil and some residual (asphaltic) material.
Fuel oil
Heavy distillates, residues or blends of these, used as fuel for production of heat and power. Fuel oil production at the refinery is essentially a matter of selective blending of available components rather than of special processing. Fuel oil viscosities vary widely depending on the blend of distillates and residues.
Non-energy products
Refers mainly to naphtha, bitumen and lubricants, which are obtained by the refinery process from petroleum but used for non-energy purposes. Naphtha is a refined or partly refined light distillate, which is further blended into motor gasoline or used as feed-stock in the chemical industry. Bitumen is a viscous liquid or solid, non-volatile and possesses waterproofing and adhesive properties. Lubricating oil is used for lubricating purposes and has distillation range from 380°C to 500°C.
Refinerygas
The gas released during the distillation of crude oil and comprises methane, ethane, propane and butane. Most refinery gas is retained in the refinery and used as fuel in plant operations.
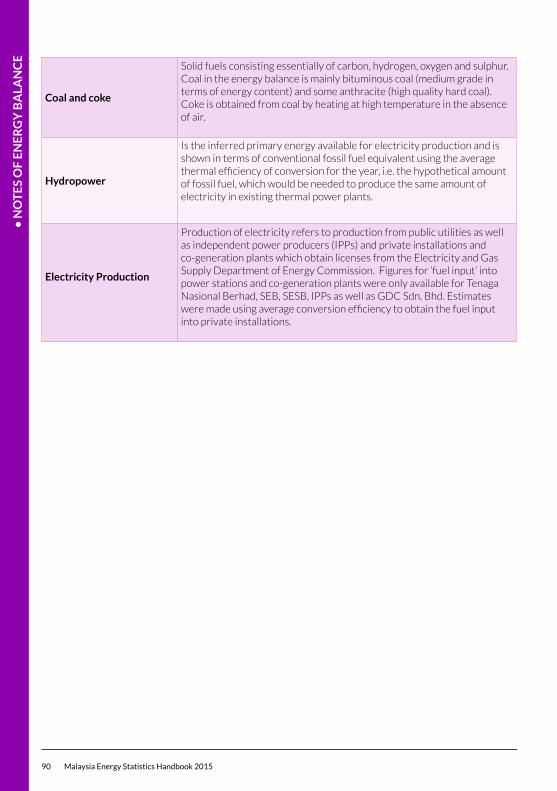
• N
OT
ES
OF
EN
ER
GY
BA
LAN
CE
90 Malaysia Energy Statistics Handbook 2015
Coal and coke
Solid fuels consisting essentially of carbon, hydrogen, oxygen and sulphur. Coal in the energy balance is mainly bituminous coal (medium grade in terms of energy content) and some anthracite (high quality hard coal). Coke is obtained from coal by heating at high temperature in the absence of air.
Hydropower
Is the inferred primary energy available for electricity production and is shown in terms of conventional fossil fuel equivalent using the average thermal efficiency of conversion for the year, i.e. the hypothetical amount of fossil fuel, which would be needed to produce the same amount of electricity in existing thermal power plants.
Electricity Production
Production of electricity refers to production from public utilities as well as independent power producers (IPPs) and private installations and co-generation plants which obtain licenses from the Electricity and Gas Supply Department of Energy Commission. Figures for ‘fuel input’ into power stations and co-generation plants were only available for Tenaga Nasional Berhad, SEB, SESB, IPPs as well as GDC Sdn. Bhd. Estimates were made using average conversion efficiency to obtain the fuel input into private installations.

SURUHANJAYA TENAGA (ENERGY COMMISSION)No.12, Jalan Tun Hussein, Precint 2
62100 Putrajaya, Malaysia.
T +603 - 8870 8500
F +603 - 8888 8637
Toll Free 1800 - 2222 - 78 (ST)


![Energy Statistics in Malaysia[1]](https://img.pdfslide.net/doc/110x75/577d1eed1a28ab4e1e8f8c8b/energy-statistics-in-malaysia1.jpg)