Embed Size (px)
Citation preview
Feng Li, MD, PhDShusuke Sone, MDHiroyuki Abe, MD, PhDHeber MacMahon, MDKunio Doi, PhD
Index terms:Cancer screeningComputed tomography (CT), thin-
sectionLung neoplasms, CT, 60.1211Lung neoplasms, diagnosis, 60.31,
60.32
Published online before print10.1148/radiol.2333031018
Radiology 2004; 233:793–798
Abbreviations:GGO � ground-glass opacityPPV � positive predictive value
1 From the Kurt Rossmann Laborato-ries for Radiologic Image Research,Department of Radiology, Universityof Chicago, 5841 S Maryland Ave,Chicago, IL 60637 (F.L., H.A., H.M.,K.D.), and J. A. Azumi General Hospi-tal, Ikeda, Nagano, Japan (S.S.). Fromthe 2002 RSNA scientific assembly. Re-ceived June 30, 2003; revision re-quested September 9; final revision re-ceived February 27, 2004; acceptedApril 12. Supported in part by USPHSgrant CA62625. Address correspon-dence to F.L. (e-mail: [email protected]).
H.M. and K.D. are shareholders of R2Technology, Los Altos, Calif. K.D is ashareholder of Deus Technology,Rockville, Md.
Author contributions:Guarantors of integrity of entire study,F.L., S.S., K.D.; study concepts and de-sign, F.L., K.D.; literature research,H.M., K.D.; clinical studies, F.L., S.S.,H.A., H.M.; data acquisition, F.L., S.S.;data analysis/interpretation, F.L., H.A.,H.M., K.D.; statistical analysis, F.L.;manuscript preparation, F.L.; manu-script definition of intellectual con-tent, F.L., H.M., K.D.; manuscript ed-iting, K.D., H.M.; manuscript revision/review and final version approval, allauthors© RSNA, 2004
Malignant versus BenignNodules at CT Screening forLung Cancer: Comparison ofThin-Section CT Findings1
PURPOSE: To evaluate thin-section computed tomographic (CT) characteristics ofmalignant nodules on the basis of overall appearance (pure ground-glass opacity[GGO], mixed GGO, or solid opacity) in comparison with the appearance of benignnodules.
MATERIALS AND METHODS: Institutional review board approval and patientconsent were obtained. Follow-up diagnostic CT was performed in 747 suspiciouspulmonary nodules detected at low-dose CT screening (17 892 examinations). Of747 nodules, 222 were evaluated at thin-section CT (1-mm collimation), whichincluded 59 cancers and 163 benign nodules (3–20 mm). Thin-section CT findingsof malignant versus benign nodules with pure GGO (17 vs 12 lesions), mixed GGO(27 vs 29 lesions), or solid opacity (15 vs 122 lesions) were analyzed. Fisher exacttest for independence was used to compare differences in shape, margin, andinternal features between benign and malignant nodules. Positive predictive value(PPV) was analyzed when a category was significantly different from the others.
RESULTS: Among nodules with pure GGO, a round shape was found morefrequently in malignant lesions (11 of 17, 65%) than in benign lesions (two of 12,17%; P � .02; PPV, 85%); mixed GGO, a subtype with GGO in the periphery anda high-attenuation zone in the center, was seen much more often in malignantlesions (11 of 27, 41%) than in benign lesions (two of 29, 7%; P � .004; PPV, 85%).Among solid nodules, a polygonal shape or a smooth or somewhat smooth marginwas present less frequently in malignant than in benign lesions (polygonal shape:7% vs 38%, P � .02; smooth or somewhat smooth margin: 0% vs 63%, P � .001),and 98% (46 of 47) of polygonal nodules and 100% (77 of 77) of nodules with asmooth or somewhat smooth margin were benign.
CONCLUSION: Recognition of certain characteristics at thin-section CT can behelpful in differentiating small malignant nodules from benign nodules.© RSNA, 2004
Computed tomographic (CT) screening has increased the detection rate of early peripherallung cancer in the United States and Japan (1,2). The results of the Early Lung CancerAction Project, or ELCAP (1), suggested that nodules with pure (nonsolid) or mixed(partially solid) ground-glass opacity (GGO) at thin-section CT are more likely to bemalignant than are those with solid opacity; among 44 nodules with GGO (19% of 233nodules identified at baseline screening), 15 (34%) were confirmed to be malignant. Onthe other hand, most of the benign lesions were solid at CT, although some (approxi-mately 15%) contained elements of GGO. According to the ELCAP data, 18% of nodules(five of 28) with pure GGO were malignant and 63% of nodules (10 of 16) with mixedGGO were malignant (1). To our knowledge, there are no previous studies that specificallycompare thin-section CT characteristics between malignant lesions and benign lesionswith pure GGO, mixed GGO, and solid opacity.
A 3-year lung cancer screening program has recently been completed in Japan by usinglow-dose CT and follow-up thin-section CT. We have previously reported that among 59
Thoracic Imaging
793
Ra
dio
logy
small (6–20 mm) lung adenocarcinomas,only 16 nodules (27%) showed solidopacity and the rest (73%) showed pureor mixed GGO at thin-section CT in thisscreening program (2). In another study(3), thin-section CT characteristics werecompared between 25 very small (�10mm) cancers, 24 of which were adenocar-cinomas, and 40 benign lesions, most ofwhich were solid nodules. We found thatby using a single CT feature, namely po-lygonal shape, and a three-dimensionalratio (maximum transverse diameter tomaximum z-axis dimension of a lesion,which was measured as the difference be-tween the cephalic extent and the caudalextent of the lesion in coronal reforma-tion) greater than 1.78, 100% specificitywas shown for benign nodules (3). How-ever, these features were not necessarilyapplicable to benign lesions with GGO,especially not to those larger than 10mm. Thus, the purpose of our study wasto evaluate the thin-section CT character-istics of malignant nodules on the basisof the overall appearance (pure GGO,mixed GGO, or solid opacity) comparedwith the appearance of benign nodules.
MATERIALS AND METHODS
Study Nodules
From May 1996 to March 1999, 17 892examinations were performed in 7847 in-dividuals (4288 men and 3559 women;mean age, 61 years) as part of an annuallow-dose CT screening program for lung
cancer in Nagano, Japan. A mobile unitequipped with a CT scanner (W950SR;Hitachi, Tokyo, Japan) was used to scanthe chest with a tube current of 25 or 50mA, a scanning time of 2 seconds perrotation of the x-ray tube (tube rotationtime, 2 seconds), a table speed of 10 mm/sec (pitch of 2), 10-mm collimation, anda 10-mm reconstruction interval. Theprogram was sponsored and supportedby the Telecommunications Advance-ment Organization of Japan and wascompleted after 3 years. All subjects gaveinformed consent. Approval for reviewand research of the cases used in thisstudy was obtained from our institu-tional review board at the University ofChicago.
Among those undergoing the exami-nations, 605 patients with 747 suspiciouspulmonary nodules detected at low-doseCT underwent follow-up diagnostic CT.Diagnostic work-up CT, which includedthin-section CT, was performed within 3months of low-dose CT screening; fol-low-up CT examinations were performedat 3, 6, 12, 18, and 24 months, as needed.Most of the follow-up CT examinationswere performed at Shinshu UniversityHospital, and some were performed atlocal hospitals. The results for follow-upwork were accrued until December 1999.
The follow-up results for the 747 nod-ules include six categories, as follows: 76primary lung cancers confirmed at biop-sy; 11 atypical adenomatous hyperplasiasconfirmed at biopsy; 444 lesions, which
included 167 resolved nodules, 230 nod-ules that were stable for 2 years or more,38 nodules with benign-pattern calcifica-tions (diffuse, central, popcorn, and lam-inar or concentric calcification), and ninenodules that were resected and con-firmed as benign; 27 nodules with find-ings suspicious for malignancy at thin-section CT but not confirmed at biopsy;176 nodules suspected of being benignbut with insufficient follow-up; and 13indeterminate nodules.
For this study, we used a database ofthin-section CT images obtained fromShinshu University Hospital as part ofthe Nagano CT screening program forlung cancer. A helical scanner (HiSpeedAdvantage; GE Medical Systems, Milwau-kee, Wis) was used for scanning the nod-ules with a 200-mA tube current, 1 sec-ond per tube rotation, table speed of 1
Figure 1. Typical appearance of the three patterns, four shapes, andfour margins used to classify lesions in this study.
Figure 2. Graphs show distribution of sizesamong, A, 29 nodules with pure GGO (17 ma-lignant and 12 benign); B, 56 nodules withmixed GGO (27 malignant and 29 benign);and C, 137 nodules with solid opacity (15 ma-lignant and 122 benign). Gray bars � malig-nant nodules, white bars � benign nodules.For pure and mixed GGO lesions, the size ofbenign nodules extensively overlaps that ofmalignant nodules in the 6–15-mm range.
794 � Radiology � December 2004 Li et al
Ra
dio
logy

mm/sec, 1-mm collimation, and 0.5-mminterval with a bone reconstruction algo-rithm. The database consisted of studiesperformed in 222 patients with 222 con-firmed malignant or confirmed benignnodules, which were small in size (3–20mm) on the first thin-section CT imageobtained within 3 months of low-doseCT screening. Among the 222 patients,there were 14 patients with two nodules
in different lung lobes, in which case thelarger of the two nodules was selected forthis study. Patients with two nodules inthe same lung lobe and patients withmore than two nodules were not in-cluded. On thin-section CT images, non-nodular lesions such as linear or scatteredopacities, which had been regarded assuspicious on the original 10-mm colli-mation screening CT images, were ex-
cluded from the analysis. Nodules withbenign-pattern calcifications were alsoexcluded. This database contained casesof 96 pulmonary nodules that were usedin two previous studies (2,3).
Among the 222 patients (mean age,62.4 years; age range, 30–84 years), therewere 119 men (mean age, 62.8 years; agerange, 30–84 years) and 103 women(mean age, 61.9 years; age range, 34–75years).
Data Analysis
Thin-section CT images for the 222nodules were displayed and interpretedwith use of “stacked” mode on a mono-chrome cathode ray tube monitor at awidth and level of 1500 HU and �550HU, respectively. The images of 222 nod-ules were randomly arranged for a read-ing sequence, and the final diagnosis forthe nodules, which included the his-
TABLE 1Thin-Section CT Findings in Malignant versus Benign Lesions with Pure GGO
Feature Malignant (n � 17) Benign (n � 12)
ShapeRound 11 2Oval 3 1Polygonal 0 3Complex 3 6
MarginSmooth 1 0Somewhat smooth 9 5Slightly irregular with spiculation 7 7Irregular with spiculation 0 0
TABLE 2Thin-Section CT Findings in Malignant versus Benign Lesions with Mixed GGO
Feature Malignant (n � 27) Benign (n � 29)
Central opacityPresent 11 2Absent 16 27
Air componentPresent 16 9Absent 11 20
ShapeRound 10 2Oval 1 2Polygonal 3 9Complex 13 16
MarginSmooth 0 0Somewhat smooth 4 7Slightly irregular with spiculation 9 14Irregular with spiculation 14 8
TABLE 3Thin-Section CT Findings in Malignant versus Benign Solid Nodules
Feature Malignant (n � 15) Benign (n � 122)
Air componentPresent 7 5Absent 8 117
ShapeRound 7 39Oval 0 24Polygonal 1 46Complex 7 13
MarginSmooth 0 27Somewhat smooth 0 50Slightly irregular with spiculation 7 37Irregular with spiculation 8 8
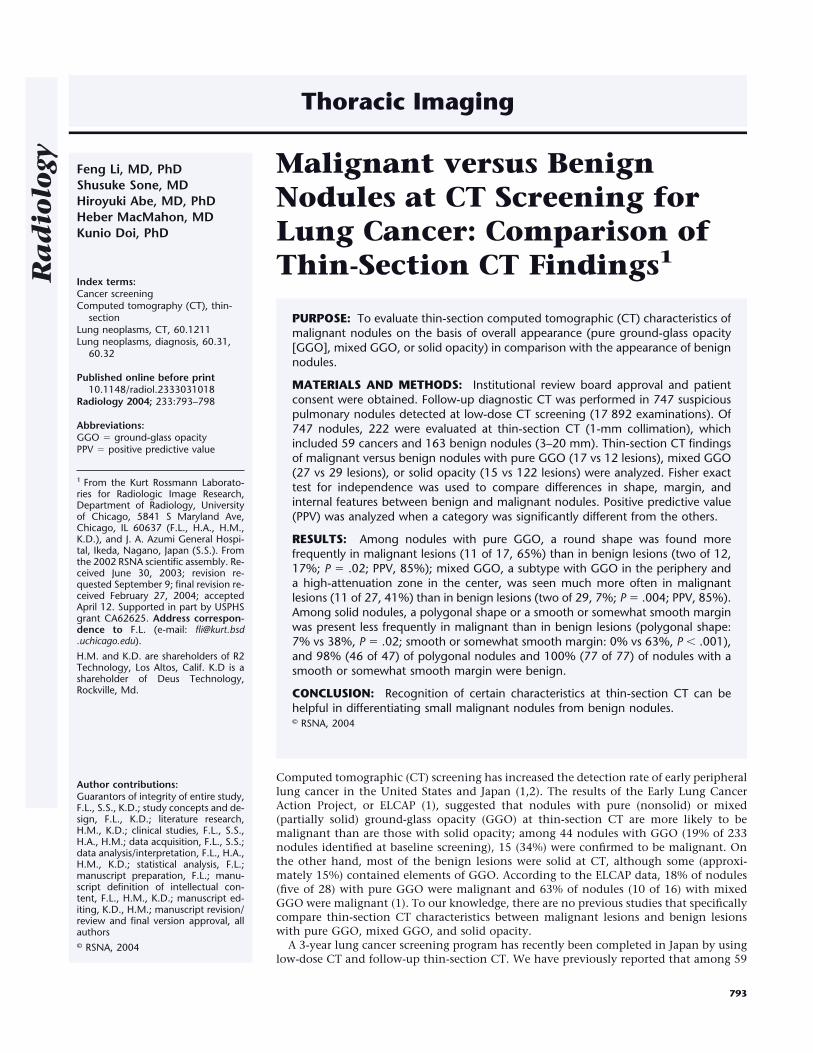
Figure 3. Transverse thin-section CT images.A, Image shows a malignant pure GGO lesion(adenocarcinoma) with a round shape (ar-rows). B, Image shows a benign pure GGOlesion (resolved within 3 months) with a po-lygonal-complex shape (arrows) that is con-fined to a secondary lobule.
Volume 233 � Number 3 Malignant Lung Nodules at Thin-Section CT � 795
Ra
dio
logy

topathologic results, was blinded to theradiologists. Three radiologists with 20,18, and 17 years of experience in generalradiology (F.L. and H.A. included) inde-pendently viewed these images and sub-jectively classified the nodules as one ofthree patterns: pure GGO, mixed GGO,or solid opacity. They also independentlydetermined the overall shape (round,oval, polygonal, or complex) and margin(smooth, somewhat smooth, somewhatirregular with slight spiculation, or irreg-ular with spiculation) of the nodules, aswell as the internal features. Internal fea-tures included a specific mixed GGO pat-tern characterized by GGO in the periph-ery, with a high-attenuation zone in thecenter and the presence or absence of air(air bronchogram, cavitation, or focalemphysema) within the nodule on thin-section CT images. The typical appear-ance of the three patterns, four shapes,and four margins used to classify the le-sions is illustrated in Figure 1.
For pattern, shape, and margins of thenodules, the same judgment was madeby all three radiologists for 75%, 40%,and 13% of cases, respectively, and thesame judgment was made by any two ofthe radiologists for 99%, 91%, and 73%of cases, respectively. Two radiologists(F.L., H.A.) worked together to reach aconsensus for the remaining 83 featuresin 76 nodules; these nodules were ini-tially classified differently by each of thethree radiologists. For internal features,the same judgment was made by all threeradiologists in 67% of cases and by anytwo radiologists in 100% of cases. Thefinal decision regarding the CT findingswas based on the consensus of at leasttwo radiologists. The mean size (averagelength and width) and clinical outcomefor 222 nodules were recorded by oneradiologist (F.L.).
Statistical Analysis
Statistical analysis was performed byusing the Student t test for comparison ofdifferences in size between benign andmalignant nodules. The �2 test for inde-pendence was used independently forcomparison of the differences in patterns(nodules with and those without GGO)between the benign nodules and the ma-lignant nodules. The data presented inTables 1–3 were analyzed first by usingthe Fisher exact test for independence todetermine whether there were any signif-icant differences in the proportion of ma-lignant lesions and benign lesions in thecategories of shape, margin, and internalfeatures. If such differences were estab-
lished (the difference was significant atP � .05), additional Fisher exact testswere performed to determine which cat-egories were significantly different fromthe others. Fisher exact test was used in-stead of �2 test because of the small sam-ple size. Positive predictive value (PPV)was further analyzed when a categorywas significantly different from the oth-ers.
RESULTS
Of the 222 patients evaluated, 59 (27men and 32 women; mean age, 64.6years) had malignant nodules and 163(92 men and 71 women; mean age, 61.6years) had benign nodules. The mean sizeof the 59 malignant nodules (12.3 mm)was larger than that of the 163 benignnodules (7.2 mm, P � .001). Among 59malignant nodules, there were 17 withpure GGO, 27 with mixed GGO, and 15
with solid opacity. Among 163 benignnodules, 12 showed pure GGO, 29showed mixed GGO, and 122 showedsolid opacity. The number of lesions withGGO was greater in the group of malig-nant nodules than in the group of benignnodules (P � .001).
All 17 malignant nodules with pureGGO were well-differentiated adenocar-cinomas. Among 27 malignant noduleswith mixed GGO, 26 were well-differen-tiated adenocarcinomas and one was amoderately differentiated adenocarcinoma.Of the 15 malignant nodules with solidopacity, four were well-differentiated ade-nocarcinomas, seven were other adenocar-cinomas, two were squamous cell carcino-mas, and two were small cell carcinomas.All 12 benign nodules with pure GGO hadresolved at the 3-month follow-up exami-nation. Among 29 benign nodules withmixed GGO, nodular fibrosis was con-firmed at surgery in three cases, was re-
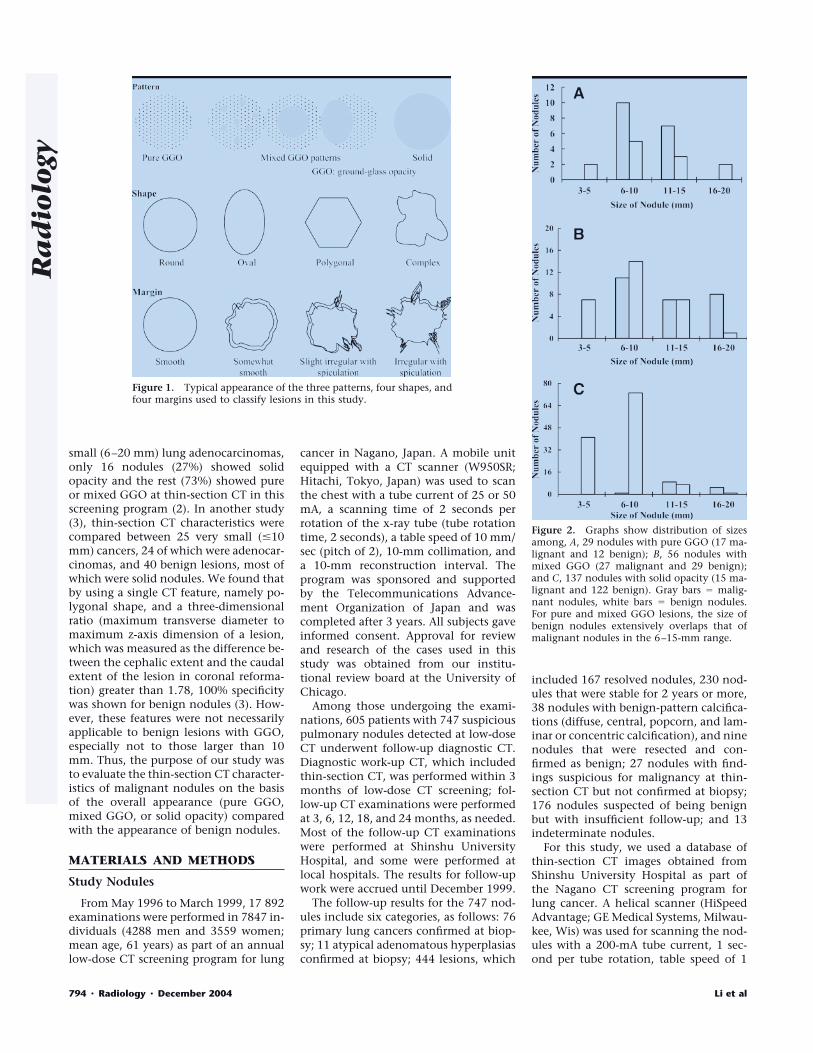
Figure 4. Transverse thin-section CT images. A, B, Images show a malignant mixed GGO lesion(adenocarcinoma) with irregular margins. The nodule shows both GGO in the periphery (arrows)and a high-attenuation zone (arrowhead) in the center. C, D, Images show a benign mixed GGOlesion (nodular fibrosis) with irregular margins. In C, a small air collection (arrowhead) is seen inthe nodule. In D, the nodule (arrows) is seen on another section.
796 � Radiology � December 2004 Li et al
Ra
dio
logy
solved at 3 months or more of follow-up in17 cases, and showed no change for 2 yearsor more in nine cases. Among the 122 be-nign solid nodules, five cases (one caseeach of inflammatory granuloma, crypto-coccoma, focal organizing pneumonia, in-flammatory pseudotumor, and sclerosinghemangioma) were confirmed at surgery,19 cases were resolved at 3 months or moreof follow-up, and 98 cases showed nochange for 2 years or more. All malignantnodules were confirmed at surgery.
The distribution of sizes among 29nodules with pure GGO, 56 with mixedGGO, and 137 with solid opacity isshown in Figure 2. For GGO lesions,there was extensive overlap between thesize of benign nodules and that of malig-nant nodules. On the other hand, forsolid lesions, there was relatively limitedoverlap between the size of benign nod-ules and that of malignant nodules.
Table 1 shows the thin-section CTfindings for malignant versus benign le-sions with pure GGO; Figure 3 shows amalignant nodule and a benign nodulewith pure GGO obtained at thin-sectionCT. The overall Fisher exact test indi-cated a significant association betweenlesion shape and malignancy (P � .008)but indicated no significant associationbetween margins and malignancy (P �.826). At further examination, we founda significant association between malig-nancy and round nodules (P � .022); thenumber of round nodules was greater inthe malignant group (65%, 11 of 17)than in the benign group (17%, two of12) of pure GGO lesions. If round shapewas used to discriminate between malig-nant lesions and benign lesions withpure GGO, the PPV (probability that anodule is malignant, given that it isround) of such a test would be 85% (95%confidence interval: 54.55%, 98.08%) inthis data set.
Table 2 lists thin-section CT findingsfor malignant lesions versus benign le-sions with mixed GGO; Figure 4 shows amalignant nodule and a benign nodulewith mixed GGO obtained at thin-sec-tion CT. The overall Fisher exact testagain showed a significant associationbetween nodule shape and malignancy(P � .020) but showed no significant as-sociation between margins and malig-nancy (P � .174). The association be-tween round nodules and malignancywas found to be significant (P � .009),and the proportion of round nodules washigher among malignant lesions (37%,10 of 27) than among benign lesions(7%, two of 29). The PPV was 83% (95%confidence interval: 51.59%, 97.91%).Furthermore, the presence of centralopacity with mixed GGO was signifi-cantly associated with malignancy (P �.004), with a higher proportion of nod-ules with this feature in the malignantgroup (41%, 11 of 27) than in the benigngroup (7%, two of 29). The PPV of thistest was 85% (95% confidence interval:54.55%, 98.08%). However, the presenceof air components within lesions was notsignificantly associated with malignancy(P � .059).
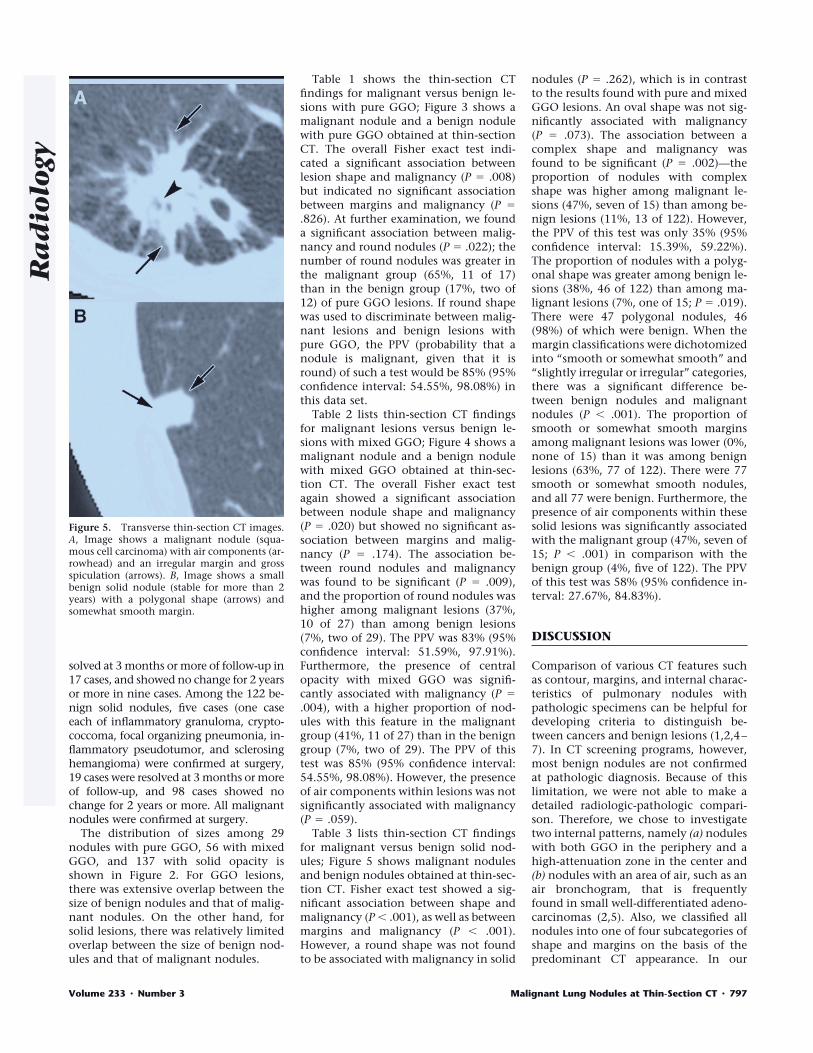
Table 3 lists thin-section CT findingsfor malignant versus benign solid nod-ules; Figure 5 shows malignant nodulesand benign nodules obtained at thin-sec-tion CT. Fisher exact test showed a sig-nificant association between shape andmalignancy (P � .001), as well as betweenmargins and malignancy (P � .001).However, a round shape was not foundto be associated with malignancy in solid
nodules (P � .262), which is in contrastto the results found with pure and mixedGGO lesions. An oval shape was not sig-nificantly associated with malignancy(P � .073). The association between acomplex shape and malignancy wasfound to be significant (P � .002)—theproportion of nodules with complexshape was higher among malignant le-sions (47%, seven of 15) than among be-nign lesions (11%, 13 of 122). However,the PPV of this test was only 35% (95%confidence interval: 15.39%, 59.22%).The proportion of nodules with a polyg-onal shape was greater among benign le-sions (38%, 46 of 122) than among ma-lignant lesions (7%, one of 15; P � .019).There were 47 polygonal nodules, 46(98%) of which were benign. When themargin classifications were dichotomizedinto “smooth or somewhat smooth” and“slightly irregular or irregular” categories,there was a significant difference be-tween benign nodules and malignantnodules (P � .001). The proportion ofsmooth or somewhat smooth marginsamong malignant lesions was lower (0%,none of 15) than it was among benignlesions (63%, 77 of 122). There were 77smooth or somewhat smooth nodules,and all 77 were benign. Furthermore, thepresence of air components within thesesolid lesions was significantly associatedwith the malignant group (47%, seven of15; P � .001) in comparison with thebenign group (4%, five of 122). The PPVof this test was 58% (95% confidence in-terval: 27.67%, 84.83%).
DISCUSSION
Comparison of various CT features suchas contour, margins, and internal charac-teristics of pulmonary nodules withpathologic specimens can be helpful fordeveloping criteria to distinguish be-tween cancers and benign lesions (1,2,4–7). In CT screening programs, however,most benign nodules are not confirmedat pathologic diagnosis. Because of thislimitation, we were not able to make adetailed radiologic-pathologic compari-son. Therefore, we chose to investigatetwo internal patterns, namely (a) noduleswith both GGO in the periphery and ahigh-attenuation zone in the center and(b) nodules with an area of air, such as anair bronchogram, that is frequentlyfound in small well-differentiated adeno-carcinomas (2,5). Also, we classified allnodules into one of four subcategories ofshape and margins on the basis of thepredominant CT appearance. In our
Figure 5. Transverse thin-section CT images.A, Image shows a malignant nodule (squa-mous cell carcinoma) with air components (ar-rowhead) and an irregular margin and grossspiculation (arrows). B, Image shows a smallbenign solid nodule (stable for more than 2years) with a polygonal shape (arrows) andsomewhat smooth margin.
Volume 233 � Number 3 Malignant Lung Nodules at Thin-Section CT � 797
Ra
dio
logy

study, we found that differences in theCT features between benign lesions andmalignant lesions were observed for eachof the three patterns on thin-section CTimages.
Results of previous clinical CT studies(8–10) have shown that malignant nod-ules commonly contain solid opacity andthat benign nodules have higher attenu-ation, often with visible calcifications,than do malignant nodules. Siegelman etal (10) reported that 61% of 279 benignnodules (including 153 nodules with dif-fuse calcifications) had smooth or mod-erately smooth margins and 65% of 283primary malignant tumors had irregularshapes with spiculation. Kuriyama et al(5), in a study of 20 peripheral lung can-cers and 20 benign nodules less than 20mm in diameter, reported that an airbronchogram was not observed as fre-quently in small benign lesions, such ashamartoma and tuberculoma, as it was inadenocarcinomas.
The number of solid benign noduleswas much greater than the total numberof malignant nodules in our database,which was obtained from a lung cancerCT screening program, and the frequencyof some features, such as internal airbronchograms, a complex shape, and anirregular margin, was much less in com-mon in benign lesions than in malignantlesions. However, these observations donot necessarily mean that these featuresare reliable for differentiating benignnodules from malignant nodules, be-cause the absolute numbers of benignnodules with such features may be com-parable to the numbers of malignantnodules with similar features. For exam-ple, the frequency of an irregular marginin solid nodules was 7% (eight of 122) forbenign nodules and 53% (eight of 15) formalignant nodules. However, if a radiol-ogist encountered such a case in a screen-ing examination, there would be an ap-proximately 50% (eight of 16) likelihoodthat the lesion was malignant, if all otherfactors were equal. We found that a po-lygonal shape or a smooth or somewhat
smooth margin (98%–100% likelihood ofbenignity) could be more helpful for dif-ferentiating solid benign nodules frommalignant nodules than would internalair bronchograms, a complex shape, oran irregular margin.
There were some limitations to thisstudy. For instance, no malignant lesions5 mm or smaller were found; this is prob-ably because the database used here wascompiled from images obtained withlow-dose single–detector row CT at a10-mm section thickness. Second, manyof the benign GGO lesions detected atthe initial screening CT had resolved be-fore thin-section diagnostic CT was per-formed. In a previous study, we reportedthat among 108 benign nodules (54, 27,and 27 of which showed pure GGO,mixed GGO, and solid opacity, respec-tively, at low-dose CT), 92 (85%) resolvedwithin 3 months (11). Also, a large vari-ance was noted in the judgment for CTfeatures by three radiologists, especiallyfor margins of the nodules; this is proba-bly because most nodules used in currentstudy were smaller than 10 mm.
The margins and size of nodules werenot useful for differentiating benign frommalignant GGO lesions in this series, andbenign lesions with GGO were more dif-ficult to distinguish from malignant nod-ules than were those with solid opacity.However, certain features, such as around shape or a combination of GGO inthe periphery with a high-attenuationzone in the center, were observed muchmore frequently in malignant GGO nod-ules. Therefore, we believe that familiar-ity with the different features of benignnodules and malignant nodules can beuseful to radiologists in the managementof indeterminate nodules. Also, short-term follow-up imaging can be helpfulfor differentiating benign from malig-nant nodules with GGO patterns, be-cause all 12 of the benign pure GGO le-sions in this series, as well as the majorityof benign mixed GGO lesions, had par-tially or completely resolved within 3months.
Acknowledgments: The authors are gratefulto Chaotong Zhang, MD, for participating asan image reviewer, Qiang Li, PhD, for helpfulsuggestions, Masha Kocherginsky, PhD, for as-sistance with statistical analysis, Roger En-gelmann, MS, for his useful work on the dis-play software, and Elisabeth Lanzl for theEnglish editing of the manuscript.
References1. Henschke CI, Yankelevitz DF, Mirtcheva
R, et al. CT screening for lung cancer:frequency and significance of part-solidand nonsolid nodules. AJR Am J Roentge-nol 2002; 178:1053–1057.
2. Yang ZG, Sone S, Takashima T, et al.High-resolution CT analysis of small pe-ripheral lung adenocarcinomas revealedon screening helical CT. AJR Am J Roent-genol 2001; 176:1399–1407.
3. Takashima S, Sone S, Li F, et al. Smallsolitary pulmonary nodules (� or � 1 cm)redetected at population-based CT screen-ing for lung cancer: reliable high-resolutionCT features of benign lesions. AJR Am JRoentgenol 2003; 180:955–964.
4. Zwirewich CV, Vedal S, Miller RR, MullerNL. Solitary pulmonary nodule: high-res-olution CT and radiologic-pathologic cor-relation. Radiology 1991; 179:469–476.
5. Kuriyama K, Tateishi R, Doi O, et al. Prev-alence of air bronchograms in small pe-ripheral carcinomas of the lung on thin-section CT. AJR Am J Roentgenol 1991;156:921–924.
6. Li F, Sone S, Takashima S, et al. Correla-tions between high-resolution computedtomographic, magnetic resonance andpathological findings in cases with non-cancers but suspicious lung nodules. EurRadiol 2000; 10:1782–1789.
7. Kohno N, Ikezoe J, Johkoh T, et al. Focalorganizing pneumonia: CT appearance.Radiology 1993; 189:119–123.
8. Proto AV, Thomas SR. Pulmonary nod-ules studied by computed tomography.Radiology 1985; 156:149–153.
9. Zerhouni EA, Stitik FP, Siegelman SS, et al.CT of the pulmonary nodule: a coopera-tive study. Radiology 1986; 160:319–327.
10. Siegelman SS, Khouri NF, Leo FP, Fish-man EK, Braverman RM, Zerhouni EA.Solitary pulmonary nodules: CT assess-ment. Radiology 1986; 160:307–312.
11. Li F, Sone S, Takashima S, Maruyama Y,Hasegawa M, Yang ZG. Roentgenologicanalysis of 108 non-cancerous focal lunglesions detected in screening CT for lungcancer. Jpn J Lung Cancer 1999; 39:369–380.
798 � Radiology � December 2004 Li et al
Ra
dio
logy