Embed Size (px)
Citation preview
Malware Trend Report, Q4 2014 October | November | December
January 2015 Copyright RedSocks B.V. © 2014-2015. All Rights Reserved.
Malware Trend Report Quarter 4, 2014
Page 1 of 28
This page is left blank on purpose.
Malware Trend Report Quarter 4, 2014
Page 2 of 28
Table of Contents
1. Introduction .............................................................................................................................................. 4
2. Summary .................................................................................................................................................. 5
2.1. Collecting Malware ............................................................................................................................. 6
2.2. Processing Malware ........................................................................................................................... 6
2.3. Detecting Malware ............................................................................................................................. 7
2.4. Classifying Malware ........................................................................................................................... 9
3. Trends ..................................................................................................................................................... 10
3.1. Adware ............................................................................................................................................. 10
3.2. Backdoors and Bots ........................................................................................................................... 11
3.3. Exploits ............................................................................................................................................. 12
3.4. Rootkits .............................................................................................................................................13
3.5. Trojans ............................................................................................................................................. 15
3.6. Worms .............................................................................................................................................. 16
3.7. 64-bit Malware .................................................................................................................................. 17
3.8. Malicious Others............................................................................................................................... 18
4. Geolocation ............................................................................................................................................ 20
5. Final Word ............................................................................................................................................... 23
5.1. Miscreants say "Je suis Charlie" too .................................................................................................. 23
Appendix A: Detecting Malware ................................................................................................................. 25
Appendix B: Classifying Malware ................................................................................................................ 26
Malware Trend Report Quarter 4, 2014
Page 3 of 28
Table of Figures
Figure 1: Unique Malicious Files Q3-Q4 2014 ................................................................................................ 6
Figure 2: Space Need To Store New Malicious Files Q3-Q4 2014 .................................................................. 6
Figure 3: Detected vs. Not Detected October 2014 ....................................................................................... 7
Figure 4: Detected vs. Not Detected December 2014 ................................................................................... 8
Figure 5: Detected vs. Not Detected November 2014 ................................................................................... 8
Figure 6: Amount of Identified Adware Q4 ................................................................................................. 10
Figure 7: Distribution of Adware.Symmi.49537 Q4 ...................................................................................... 11
Figure 8: Amount of Identified Backdoors and Bots Q4 ............................................................................... 11
Figure 9: Distribution of Backdoor.Bot.158614 Q4 ...................................................................................... 12
Figure 10: Amount of Identified Exploits Q4 ................................................................................................13
Figure 11: Amount of Identified Rootkits Q4 ............................................................................................... 14
Figure 12: Amount of Identified Trojans Q4 ................................................................................................ 15
Figure 13: Amount of Identified Worms Q3 ................................................................................................. 16
Figure 14: Amount of Identified 64-Bit Malware Q4 ..................................................................................... 17
Figure 15: 64-bit Malware Families Q4 ........................................................................................................ 18
Figure 16: Other Malware Q4 ...................................................................................................................... 18
Figure 17: Je Suis Charlie ............................................................................................................................. 24
Figure 18: Fake Movie Maker Message ........................................................................................................ 24
Table of Tables
Table 1: File Metrics Q3-Q4 ........................................................................................................................... 7
Table 2: Malware Categories Q4 ................................................................................................................... 9
Table 3: Top 3 Worm Families Q4 2014 ....................................................................................................... 16
Table 4: Other Malware Q4 vs. Q3 .............................................................................................................. 19
Table 5: Top 10 Countries Hosting C&C Servers Q3 ..................................................................................... 21
Table 6: Top 10 Countries Hosting C&C Servers Q4 .................................................................................... 21
Table 7: Malware Categories Q3 vs. Q4 ....................................................................................................... 23
Malware Trend Report Quarter 4, 2014
Page 4 of 28
1. Introduction
This is the last quarterly trend report for 2014 from the RedSocks Malware Research Lab for 2014.
RedSocks is a Dutch company specializing in malware detection. Our solution, RedSocks Malware Threat
Defender, is a network appliance that analyses digital traffic flows in real-time, based on algorithms and
lists of malicious indicators. This critical information is compiled by the RedSocks Malware Intelligence
Team (RSMIT). The team consists of specialists whose job is to identify new threats and trends on the
Internet and to translate them into state-of-the-art malware detection capabilities.
With this report, we hope to provide the reader with a deeper insight into the trends we see in the malware
we process as we look at data collected during the fourth quarter of 2014. At RedSocks we analyses large
numbers of malicious files on a daily basis, therefore we can cover only a few topics briefly in this trend
report.
Protecting your data from Internet-based threats is not an easy task, and relying solely on protection from
Anti-Virus companies - no matter how established their brand - is not enough. Comprehensive protection
requires an entirely new approach.
Malware Trend Report Quarter 4, 2014
Page 5 of 28
2. Summary
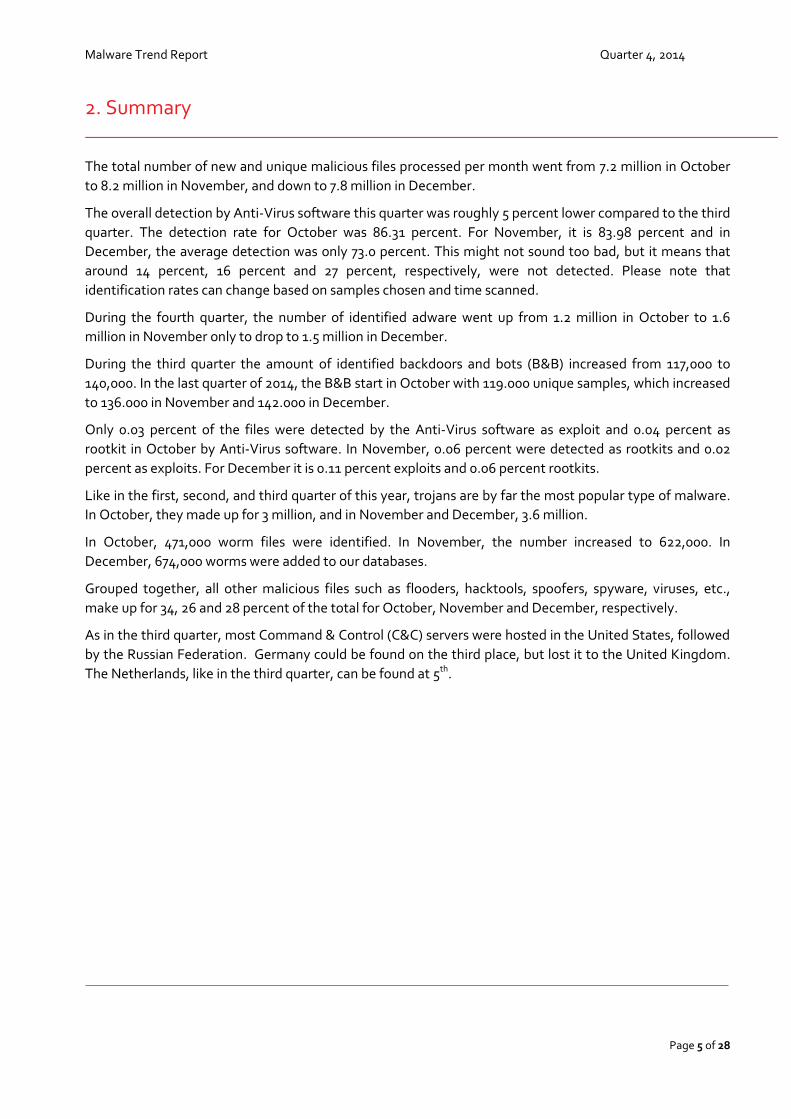
The total number of new and unique malicious files processed per month went from 7.2 million in October
to 8.2 million in November, and down to 7.8 million in December.
The overall detection by Anti-Virus software this quarter was roughly 5 percent lower compared to the third
quarter. The detection rate for October was 86.31 percent. For November, it is 83.98 percent and in
December, the average detection was only 73.0 percent. This might not sound too bad, but it means that
around 14 percent, 16 percent and 27 percent, respectively, were not detected. Please note that
identification rates can change based on samples chosen and time scanned.
During the fourth quarter, the number of identified adware went up from 1.2 million in October to 1.6
million in November only to drop to 1.5 million in December.
During the third quarter the amount of identified backdoors and bots (B&B) increased from 117,000 to
140,000. In the last quarter of 2014, the B&B start in October with 119.000 unique samples, which increased
to 136.000 in November and 142.000 in December.
Only 0.03 percent of the files were detected by the Anti-Virus software as exploit and 0.04 percent as
rootkit in October by Anti-Virus software. In November, 0.06 percent were detected as rootkits and 0.02
percent as exploits. For December it is 0.11 percent exploits and 0.06 percent rootkits.
Like in the first, second, and third quarter of this year, trojans are by far the most popular type of malware.
In October, they made up for 3 million, and in November and December, 3.6 million.
In October, 471,000 worm files were identified. In November, the number increased to 622,000. In
December, 674,000 worms were added to our databases.
Grouped together, all other malicious files such as flooders, hacktools, spoofers, spyware, viruses, etc.,
make up for 34, 26 and 28 percent of the total for October, November and December, respectively.
As in the third quarter, most Command & Control (C&C) servers were hosted in the United States, followed
by the Russian Federation. Germany could be found on the third place, but lost it to the United Kingdom.
The Netherlands, like in the third quarter, can be found at 5th.
Malware Trend Report Quarter 4, 2014
Page 6 of 28
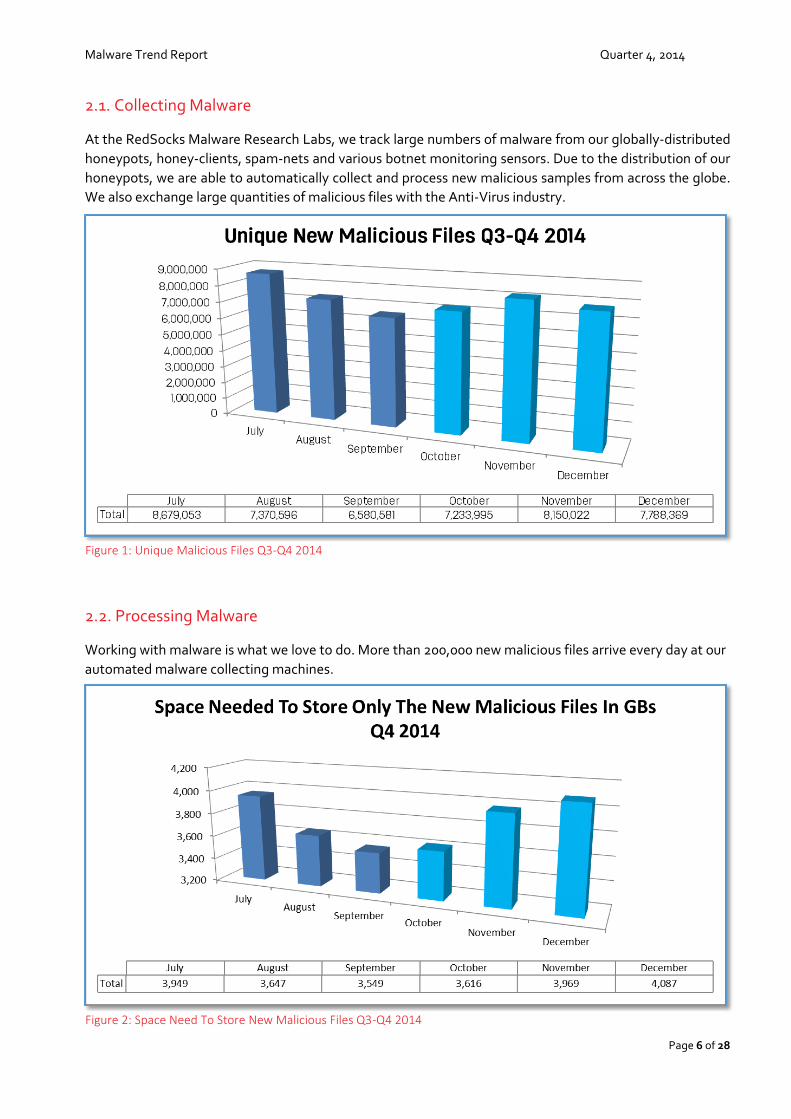
2.1. Collecting Malware
At the RedSocks Malware Research Labs, we track large numbers of malware from our globally-distributed
honeypots, honey-clients, spam-nets and various botnet monitoring sensors. Due to the distribution of our
honeypots, we are able to automatically collect and process new malicious samples from across the globe.
We also exchange large quantities of malicious files with the Anti-Virus industry.
2.2. Processing Malware
Working with malware is what we love to do. More than 200,000 new malicious files arrive every day at our
automated malware collecting machines.
Figure 1: Unique Malicious Files Q3-Q4 2014
Figure 2: Space Need To Store New Malicious Files Q3-Q4 2014
Malware Trend Report Quarter 4, 2014
Page 7 of 28
All samples were renamed according to their hash calculation. We then check to see if that particular piece
of malware has already been processed.
In figure 2, the total amount of disk space needed to store all the new malicious files in gigabytes. While
the numbers of new malicious files stayed more or less the same, the average file size decreased a little bit.
During the second quarter, we saw that malicious files, on average, shrunk 12.73 percent. During the third
quarter, the average file size increased with 118.52 percent.
New file metrics by month July August September October November December
Average number of new files per day 279,969 237,761 219,353 233,355 271,667 251,238
Average file size in bytes 455,027 494,817 539,299 499,807 487,029 524,770
Average Anti-Virus Detection 75.78 % 77.50 % 80.06 % 86.04 % 83.98 % 73.00 %
Table 1: File Metrics Q3-Q4
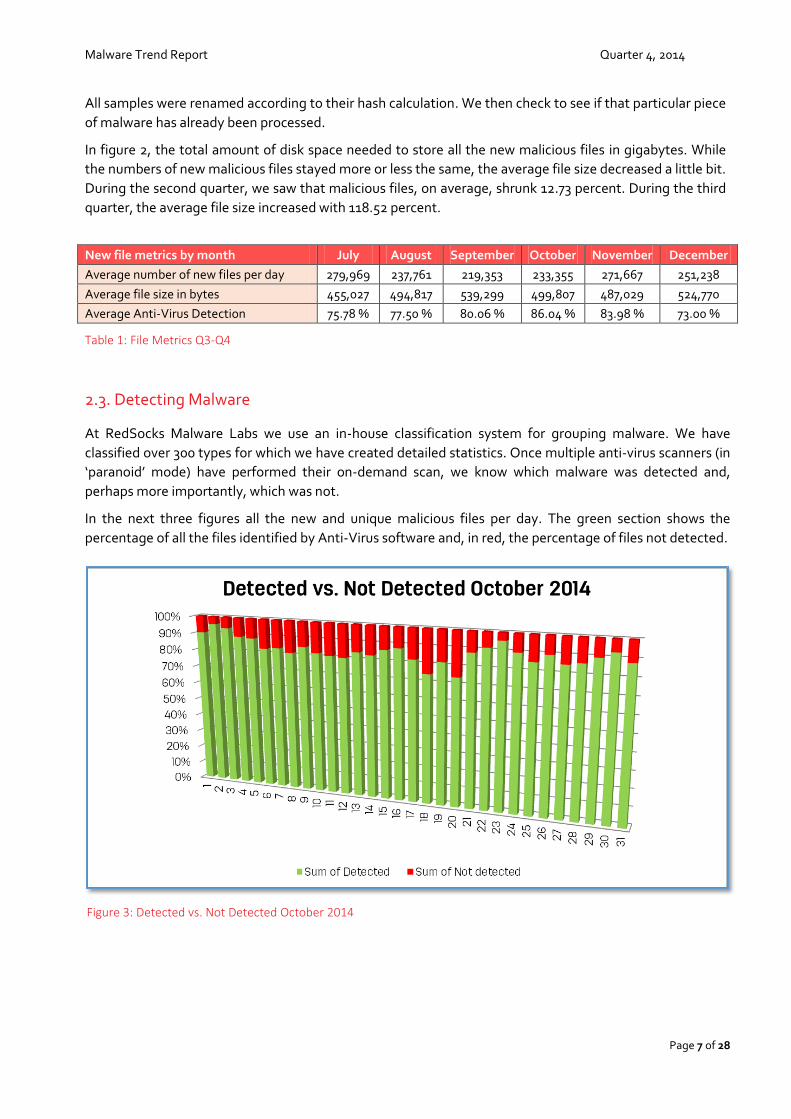
2.3. Detecting Malware
At RedSocks Malware Labs we use an in-house classification system for grouping malware. We have
classified over 300 types for which we have created detailed statistics. Once multiple anti-virus scanners (in
‘paranoid’ mode) have performed their on-demand scan, we know which malware was detected and,
perhaps more importantly, which was not.
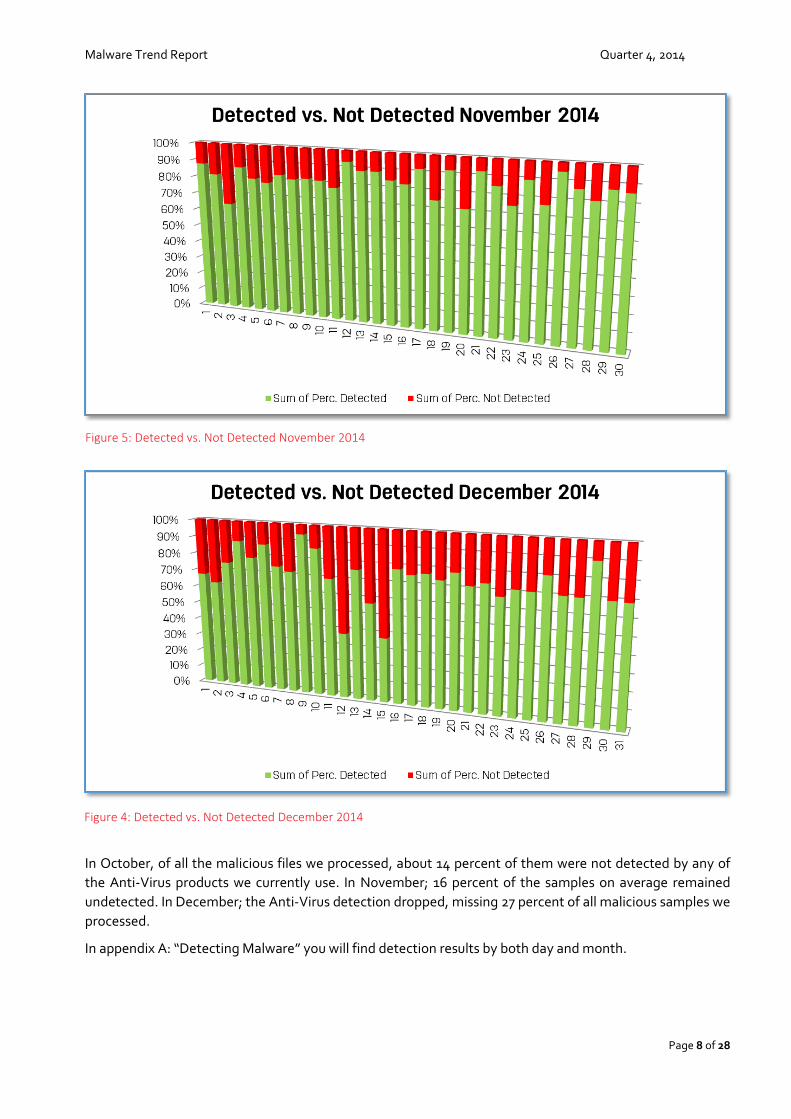
In the next three figures all the new and unique malicious files per day. The green section shows the
percentage of all the files identified by Anti-Virus software and, in red, the percentage of files not detected.
Figure 3: Detected vs. Not Detected October 2014
Malware Trend Report Quarter 4, 2014
Page 8 of 28
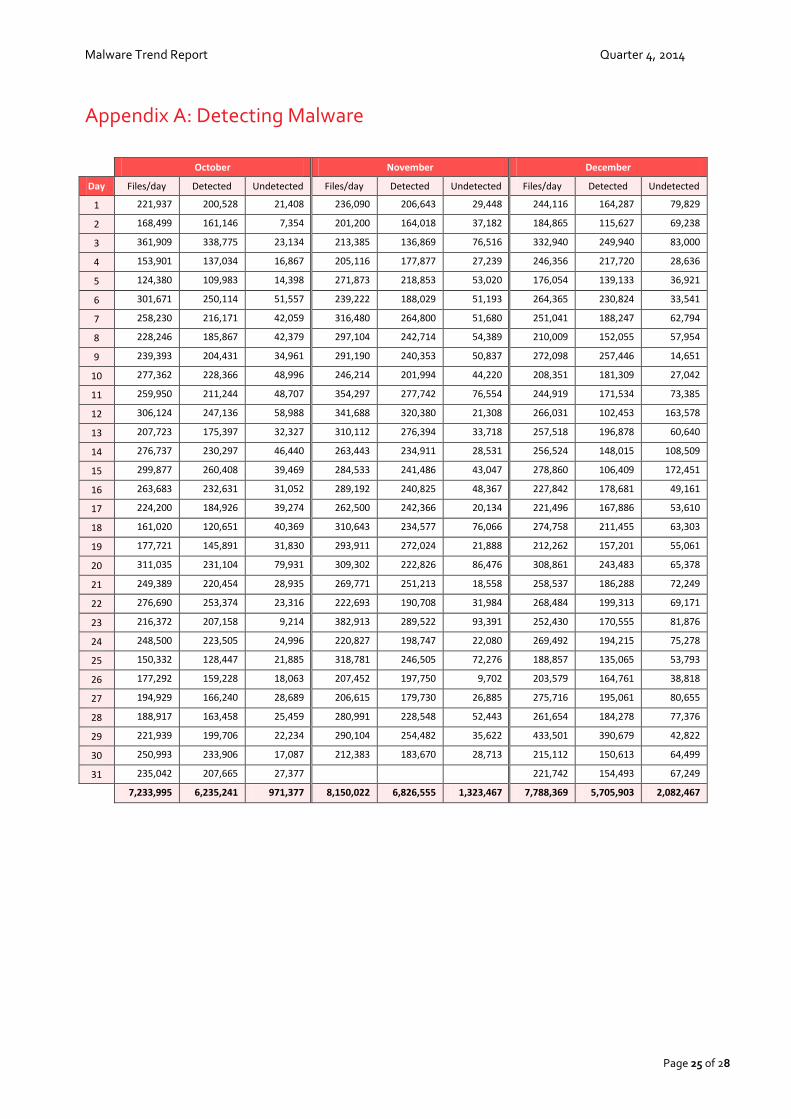
In October, of all the malicious files we processed, about 14 percent of them were not detected by any of
the Anti-Virus products we currently use. In November; 16 percent of the samples on average remained
undetected. In December; the Anti-Virus detection dropped, missing 27 percent of all malicious samples we
processed.
In appendix A: “Detecting Malware” you will find detection results by both day and month.
Figure 5: Detected vs. Not Detected November 2014
Figure 4: Detected vs. Not Detected December 2014
Malware Trend Report Quarter 4, 2014
Page 9 of 28
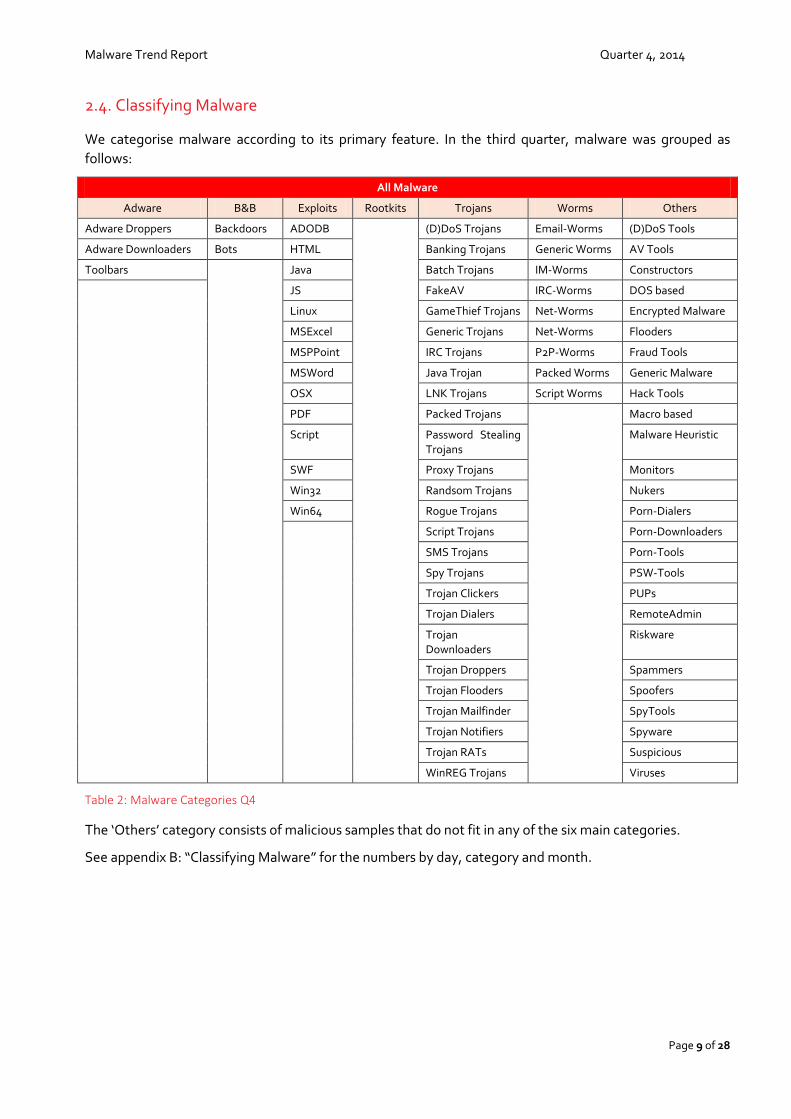
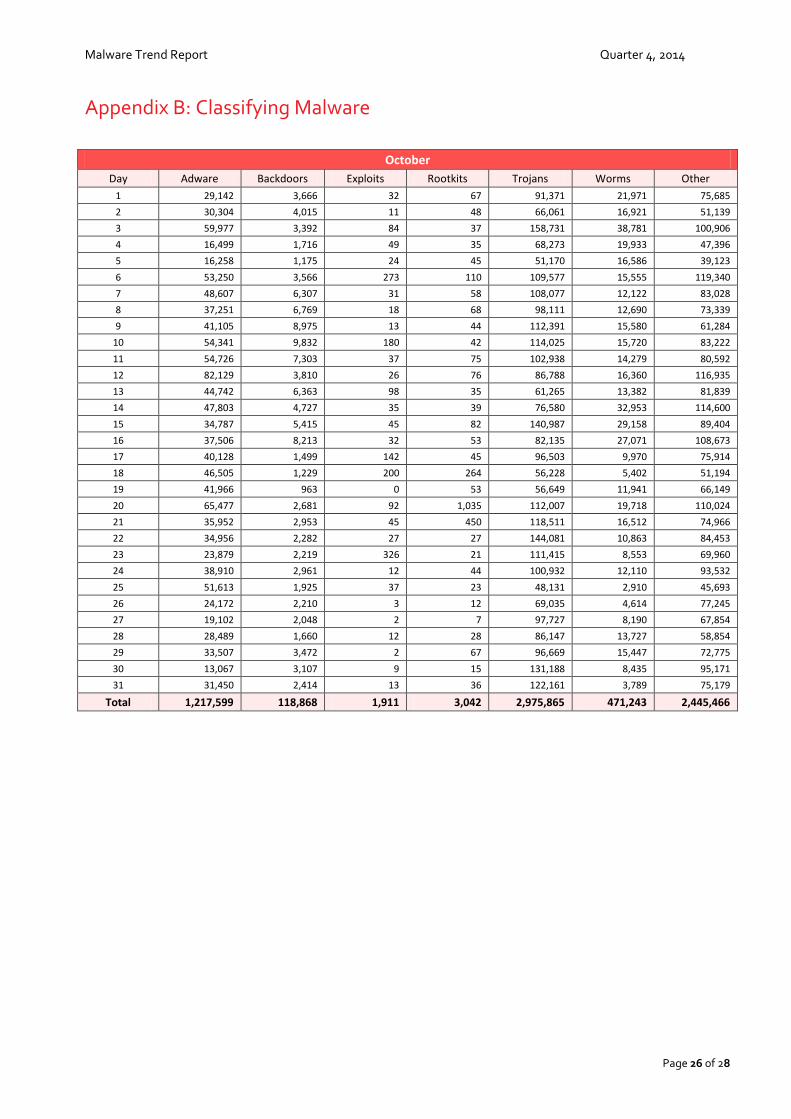
2.4. Classifying Malware
We categorise malware according to its primary feature. In the third quarter, malware was grouped as
follows:
All Malware
Adware B&B Exploits Rootkits Trojans Worms Others
Adware Droppers Backdoors ADODB (D)DoS Trojans Email-Worms (D)DoS Tools
Adware Downloaders Bots HTML Banking Trojans Generic Worms AV Tools
Toolbars Java Batch Trojans IM-Worms Constructors
JS FakeAV IRC-Worms DOS based
Linux GameThief Trojans Net-Worms Encrypted Malware
MSExcel Generic Trojans Net-Worms Flooders
MSPPoint IRC Trojans P2P-Worms Fraud Tools
MSWord Java Trojan Packed Worms Generic Malware
OSX LNK Trojans Script Worms Hack Tools
PDF Packed Trojans Macro based
Script Password Stealing Trojans
Malware Heuristic
SWF Proxy Trojans Monitors
Win32 Randsom Trojans Nukers
Win64 Rogue Trojans Porn-Dialers
Script Trojans Porn-Downloaders
SMS Trojans Porn-Tools
Spy Trojans PSW-Tools
Trojan Clickers PUPs
Trojan Dialers RemoteAdmin
Trojan Downloaders
Riskware
Trojan Droppers Spammers
Trojan Flooders Spoofers
Trojan Mailfinder SpyTools
Trojan Notifiers Spyware
Trojan RATs Suspicious
WinREG Trojans Viruses
Table 2: Malware Categories Q4
The ‘Others’ category consists of malicious samples that do not fit in any of the six main categories.
See appendix B: “Classifying Malware” for the numbers by day, category and month.
Malware Trend Report Quarter 4, 2014
Page 10 of 28
3. Trends
Discovering malware-propagation-trends starts with an analysis of the raw data behind the collection and
processing of malware. From October to December, RedSocks Malware Research Labs identified the
following trends by malware category.
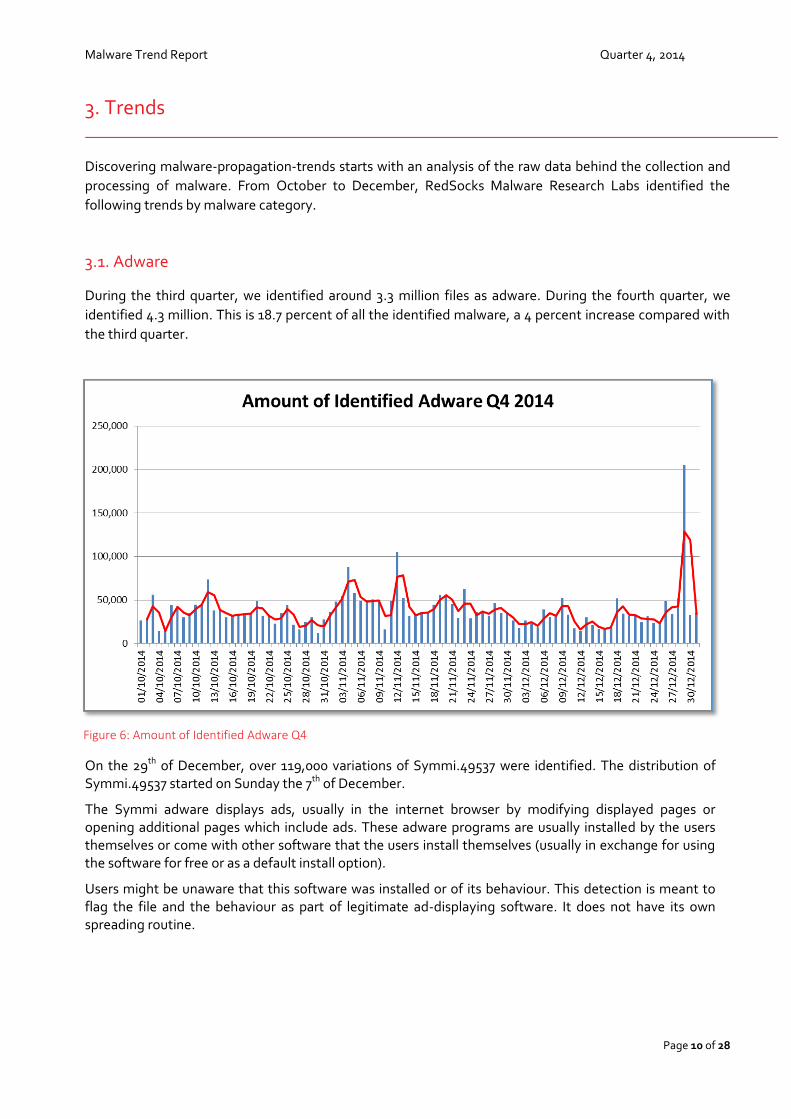
3.1. Adware
During the third quarter, we identified around 3.3 million files as adware. During the fourth quarter, we
identified 4.3 million. This is 18.7 percent of all the identified malware, a 4 percent increase compared with
the third quarter.
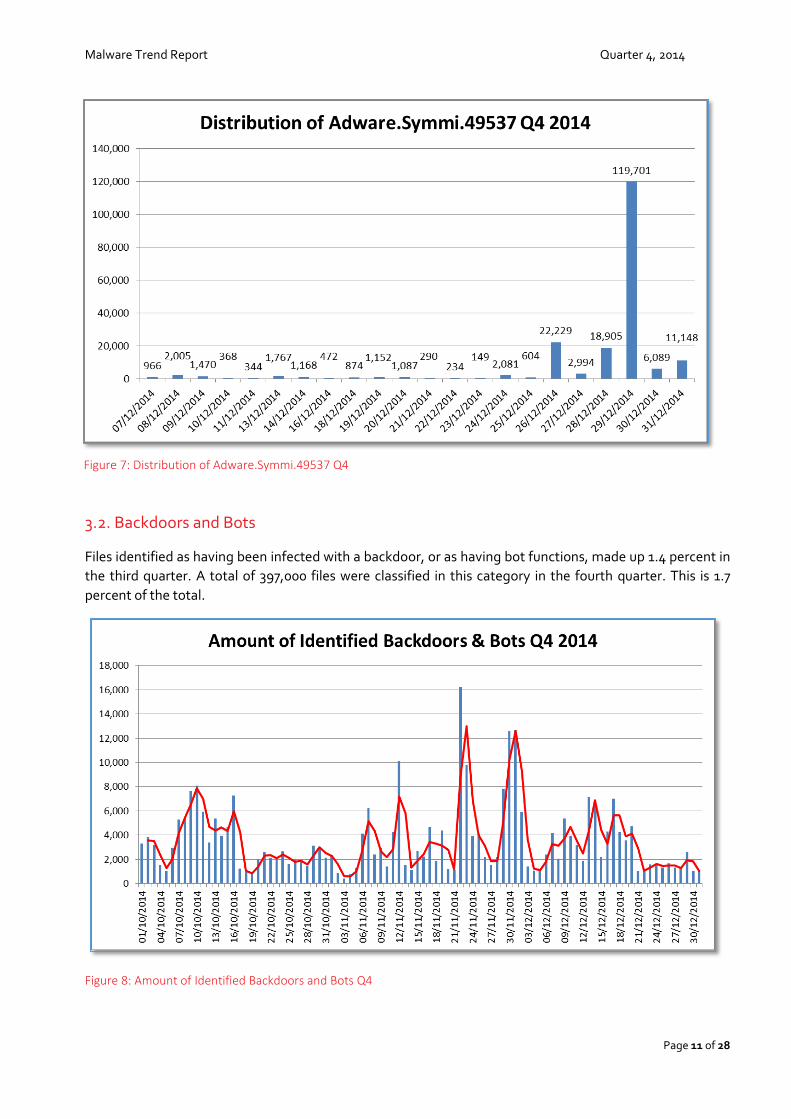
On the 29th of December, over 119,000 variations of Symmi.49537 were identified. The distribution of Symmi.49537 started on Sunday the 7th of December.
The Symmi adware displays ads, usually in the internet browser by modifying displayed pages or opening additional pages which include ads. These adware programs are usually installed by the users themselves or come with other software that the users install themselves (usually in exchange for using the software for free or as a default install option).
Users might be unaware that this software was installed or of its behaviour. This detection is meant to flag the file and the behaviour as part of legitimate ad-displaying software. It does not have its own spreading routine.
Figure 6: Amount of Identified Adware Q4
Malware Trend Report Quarter 4, 2014
Page 11 of 28
3.2. Backdoors and Bots
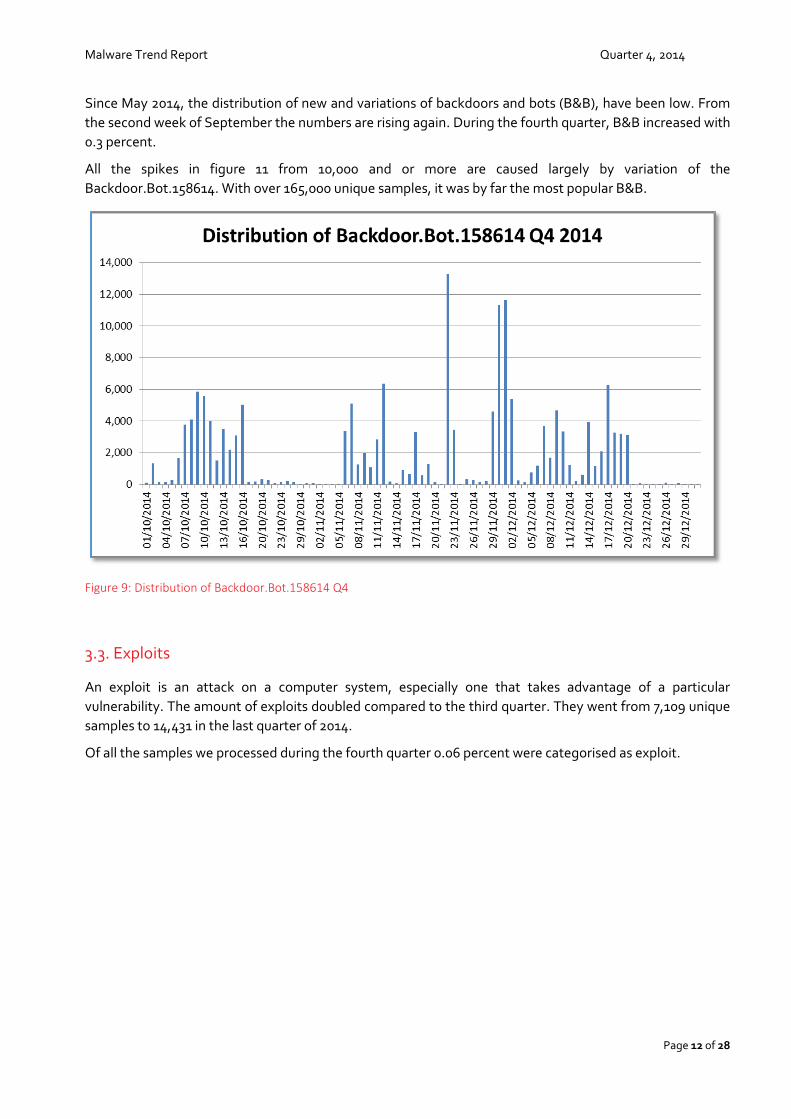
Files identified as having been infected with a backdoor, or as having bot functions, made up 1.4 percent in
the third quarter. A total of 397,000 files were classified in this category in the fourth quarter. This is 1.7
percent of the total.
Figure 8: Amount of Identified Backdoors and Bots Q4
Figure 7: Distribution of Adware.Symmi.49537 Q4
Malware Trend Report Quarter 4, 2014
Page 12 of 28
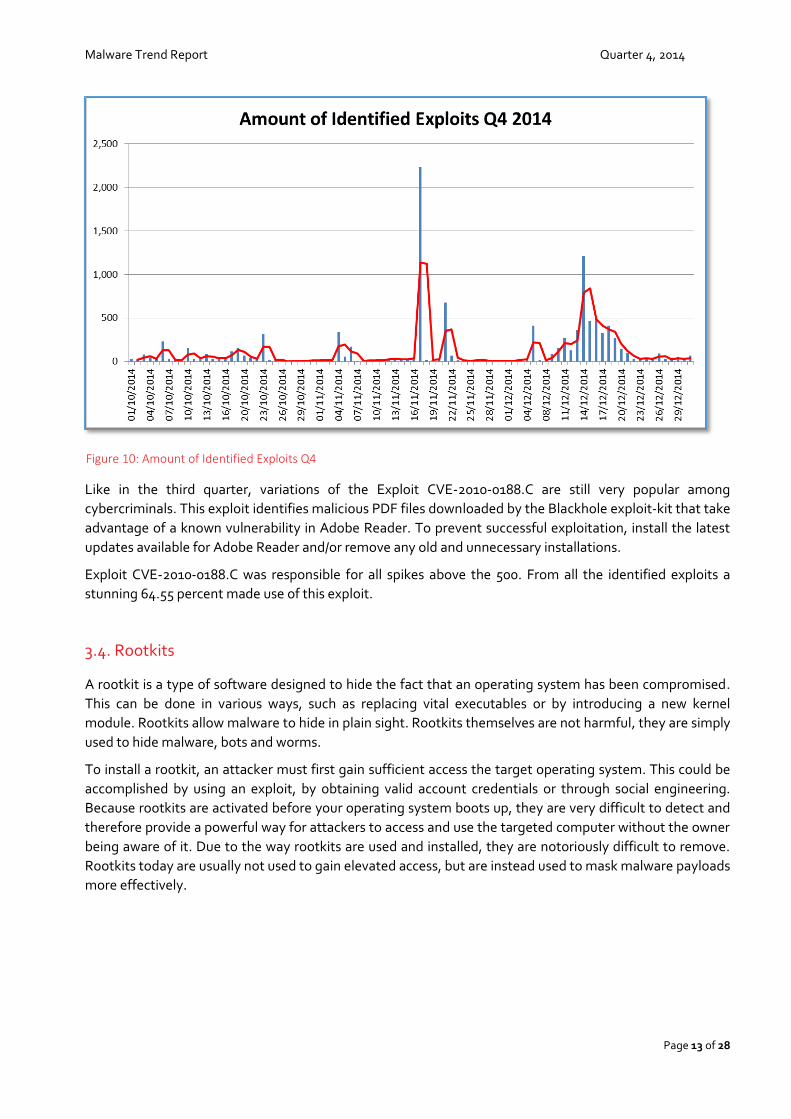
Since May 2014, the distribution of new and variations of backdoors and bots (B&B), have been low. From
the second week of September the numbers are rising again. During the fourth quarter, B&B increased with
0.3 percent.
All the spikes in figure 11 from 10,000 and or more are caused largely by variation of the
Backdoor.Bot.158614. With over 165,000 unique samples, it was by far the most popular B&B.
Figure 9: Distribution of Backdoor.Bot.158614 Q4
3.3. Exploits
An exploit is an attack on a computer system, especially one that takes advantage of a particular
vulnerability. The amount of exploits doubled compared to the third quarter. They went from 7,109 unique
samples to 14,431 in the last quarter of 2014.
Of all the samples we processed during the fourth quarter 0.06 percent were categorised as exploit.
Malware Trend Report Quarter 4, 2014
Page 13 of 28
Like in the third quarter, variations of the Exploit CVE-2010-0188.C are still very popular among
cybercriminals. This exploit identifies malicious PDF files downloaded by the Blackhole exploit-kit that take
advantage of a known vulnerability in Adobe Reader. To prevent successful exploitation, install the latest
updates available for Adobe Reader and/or remove any old and unnecessary installations.
Exploit CVE-2010-0188.C was responsible for all spikes above the 500. From all the identified exploits a
stunning 64.55 percent made use of this exploit.
3.4. Rootkits
A rootkit is a type of software designed to hide the fact that an operating system has been compromised.
This can be done in various ways, such as replacing vital executables or by introducing a new kernel
module. Rootkits allow malware to hide in plain sight. Rootkits themselves are not harmful, they are simply
used to hide malware, bots and worms.
To install a rootkit, an attacker must first gain sufficient access the target operating system. This could be
accomplished by using an exploit, by obtaining valid account credentials or through social engineering.
Because rootkits are activated before your operating system boots up, they are very difficult to detect and
therefore provide a powerful way for attackers to access and use the targeted computer without the owner
being aware of it. Due to the way rootkits are used and installed, they are notoriously difficult to remove.
Rootkits today are usually not used to gain elevated access, but are instead used to mask malware payloads
more effectively.
Figure 10: Amount of Identified Exploits Q4
Malware Trend Report Quarter 4, 2014
Page 14 of 28
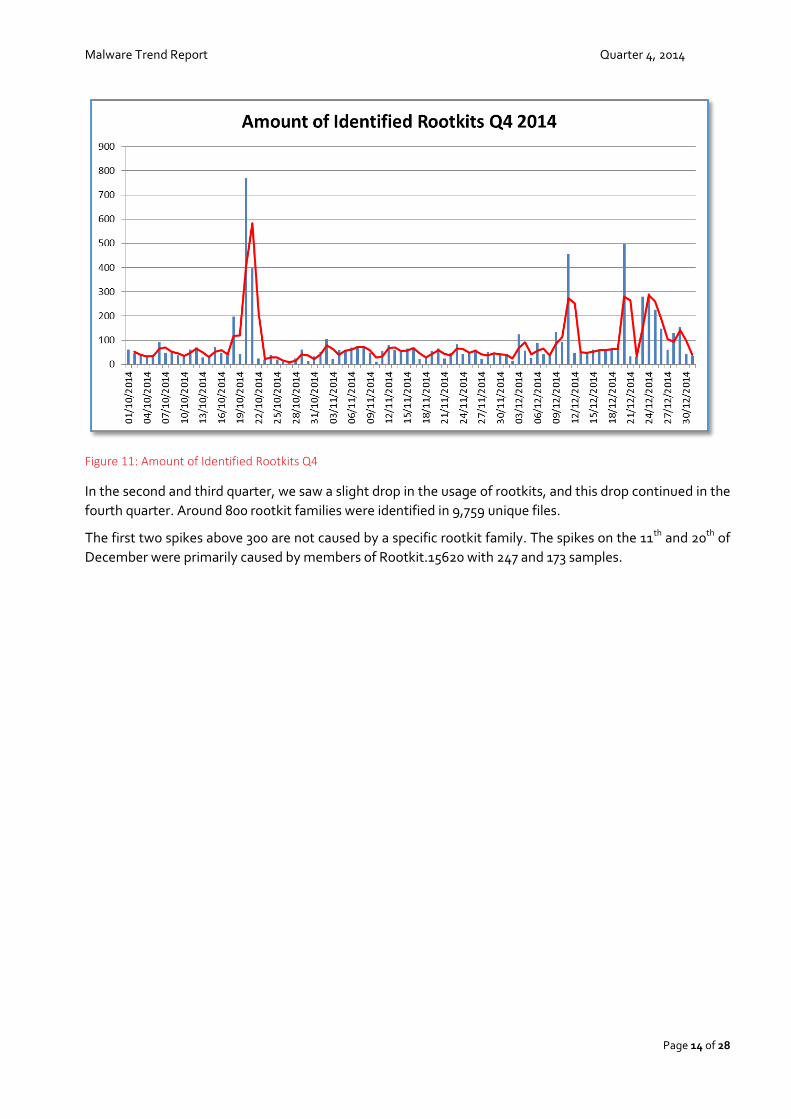
Figure 11: Amount of Identified Rootkits Q4
In the second and third quarter, we saw a slight drop in the usage of rootkits, and this drop continued in the
fourth quarter. Around 800 rootkit families were identified in 9,759 unique files.
The first two spikes above 300 are not caused by a specific rootkit family. The spikes on the 11th and 20th of
December were primarily caused by members of Rootkit.15620 with 247 and 173 samples.
Malware Trend Report Quarter 4, 2014
Page 15 of 28
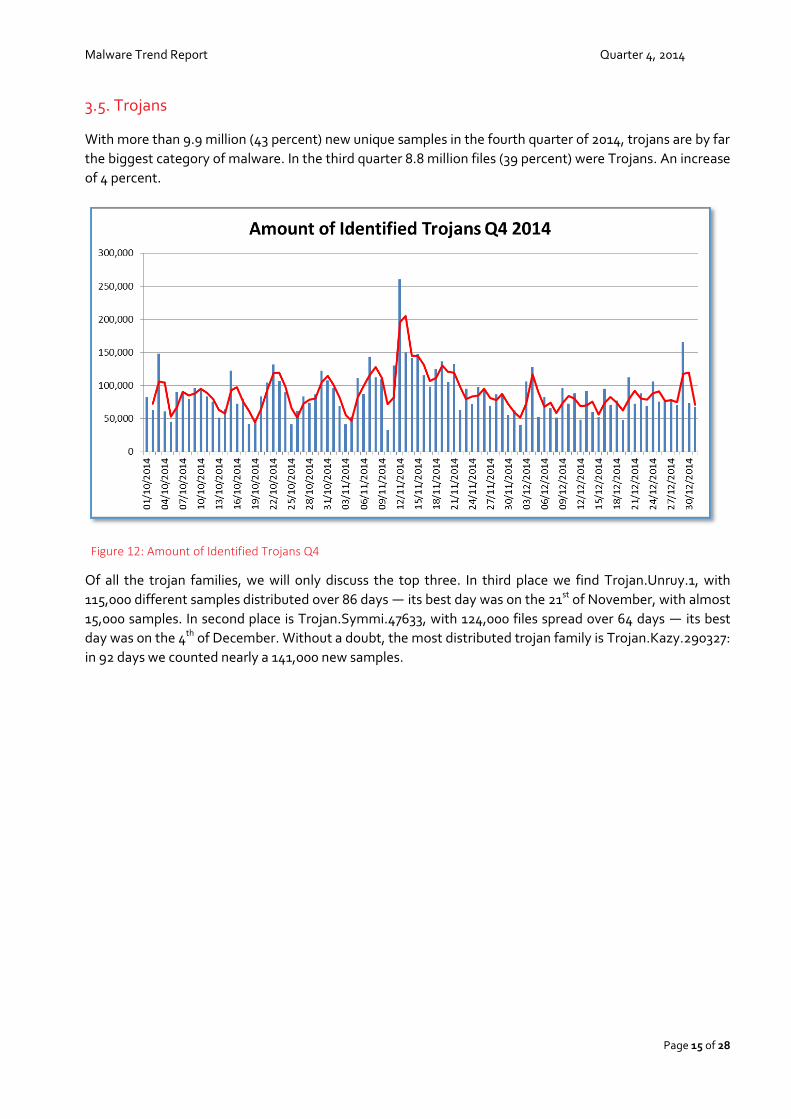
3.5. Trojans
With more than 9.9 million (43 percent) new unique samples in the fourth quarter of 2014, trojans are by far
the biggest category of malware. In the third quarter 8.8 million files (39 percent) were Trojans. An increase
of 4 percent.
Of all the trojan families, we will only discuss the top three. In third place we find Trojan.Unruy.1, with
115,000 different samples distributed over 86 days ― its best day was on the 21st of November, with almost
15,000 samples. In second place is Trojan.Symmi.47633, with 124,000 files spread over 64 days ― its best
day was on the 4th of December. Without a doubt, the most distributed trojan family is Trojan.Kazy.290327:
in 92 days we counted nearly a 141,000 new samples.
Figure 12: Amount of Identified Trojans Q4
Malware Trend Report Quarter 4, 2014
Page 16 of 28
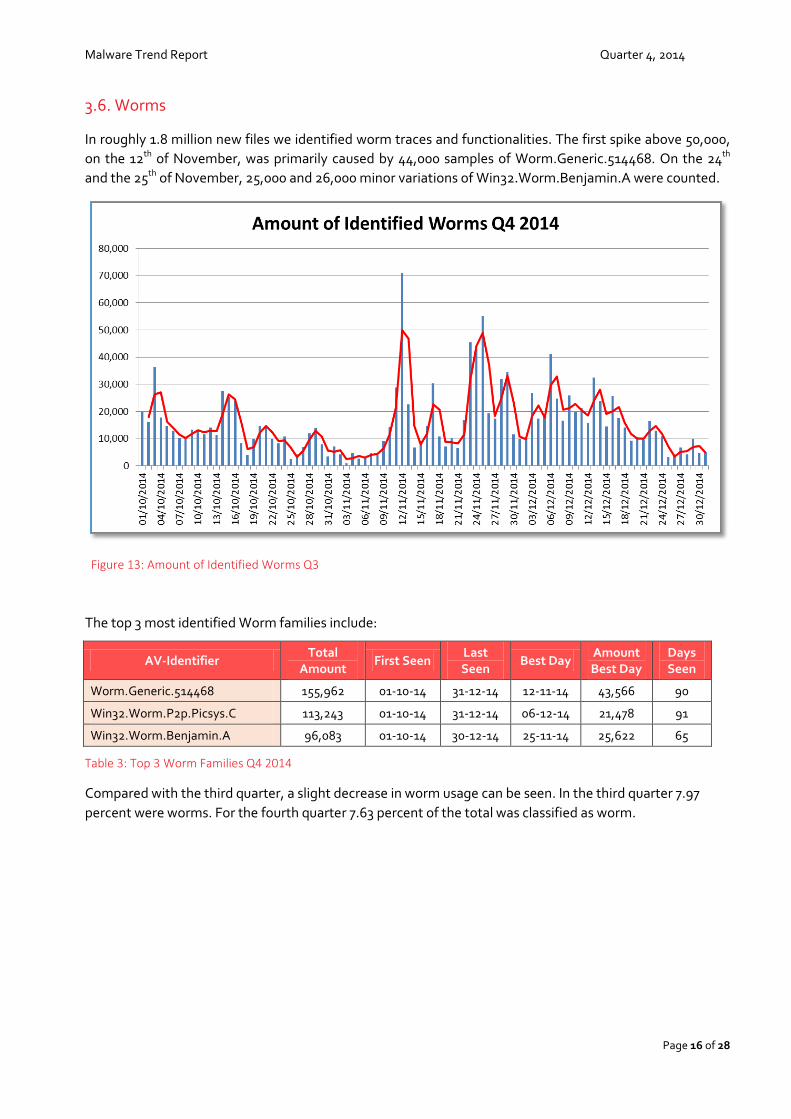
3.6. Worms
In roughly 1.8 million new files we identified worm traces and functionalities. The first spike above 50,000,
on the 12th of November, was primarily caused by 44,000 samples of Worm.Generic.514468. On the 24th
and the 25th of November, 25,000 and 26,000 minor variations of Win32.Worm.Benjamin.A were counted.
The top 3 most identified Worm families include:
AV-Identifier Total
Amount First Seen
Last Seen
Best Day Amount Best Day
Days Seen
Worm.Generic.514468 155,962 01-10-14 31-12-14 12-11-14 43,566 90
Win32.Worm.P2p.Picsys.C 113,243 01-10-14 31-12-14 06-12-14 21,478 91
Win32.Worm.Benjamin.A 96,083 01-10-14 30-12-14 25-11-14 25,622 65
Table 3: Top 3 Worm Families Q4 2014
Compared with the third quarter, a slight decrease in worm usage can be seen. In the third quarter 7.97
percent were worms. For the fourth quarter 7.63 percent of the total was classified as worm.
Figure 13: Amount of Identified Worms Q3
Malware Trend Report Quarter 4, 2014
Page 17 of 28
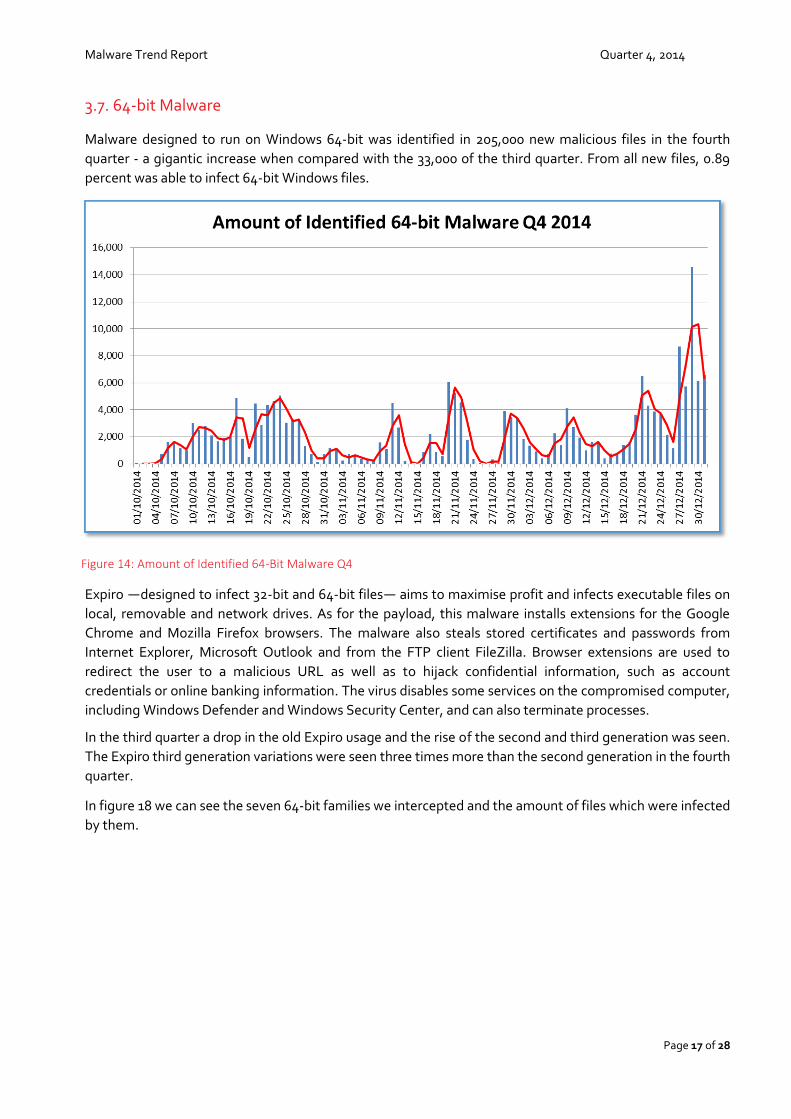
3.7. 64-bit Malware
Malware designed to run on Windows 64-bit was identified in 205,000 new malicious files in the fourth
quarter - a gigantic increase when compared with the 33,000 of the third quarter. From all new files, 0.89
percent was able to infect 64-bit Windows files.
Expiro ―designed to infect 32-bit and 64-bit files― aims to maximise profit and infects executable files on
local, removable and network drives. As for the payload, this malware installs extensions for the Google
Chrome and Mozilla Firefox browsers. The malware also steals stored certificates and passwords from
Internet Explorer, Microsoft Outlook and from the FTP client FileZilla. Browser extensions are used to
redirect the user to a malicious URL as well as to hijack confidential information, such as account
credentials or online banking information. The virus disables some services on the compromised computer,
including Windows Defender and Windows Security Center, and can also terminate processes.
In the third quarter a drop in the old Expiro usage and the rise of the second and third generation was seen.
The Expiro third generation variations were seen three times more than the second generation in the fourth
quarter.
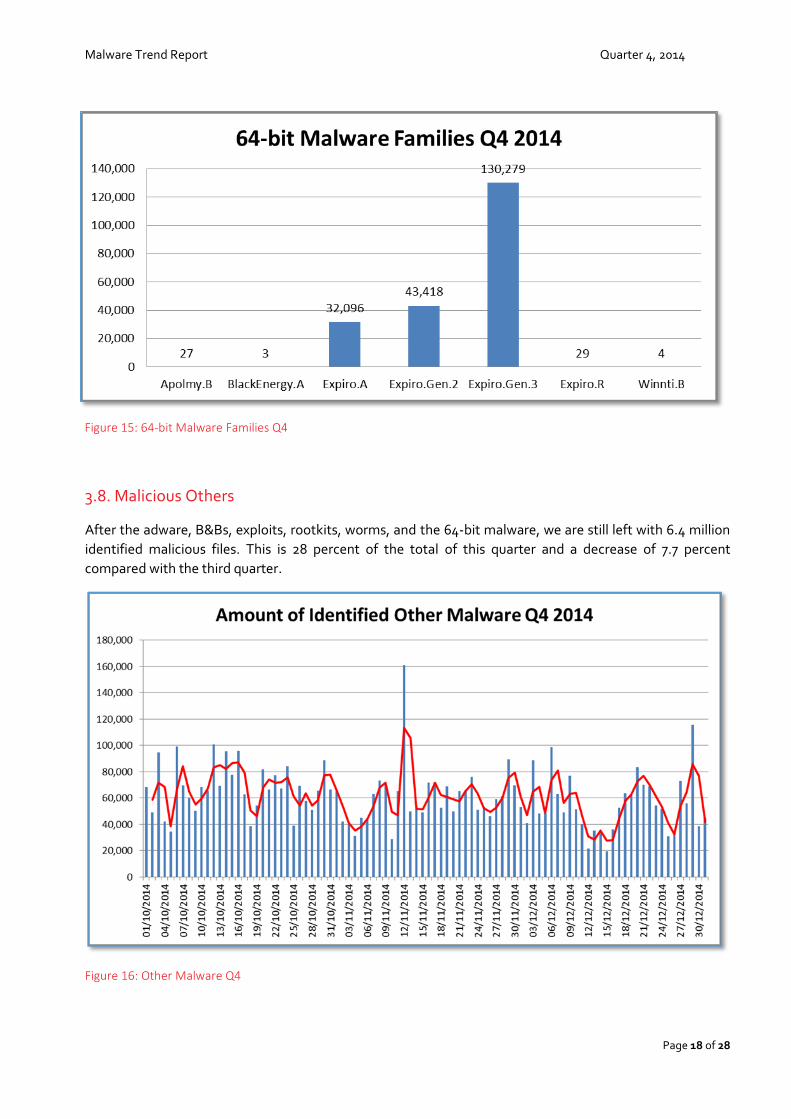
In figure 18 we can see the seven 64-bit families we intercepted and the amount of files which were infected
by them.
Figure 14: Amount of Identified 64-Bit Malware Q4
Malware Trend Report Quarter 4, 2014
Page 18 of 28
3.8. Malicious Others
After the adware, B&Bs, exploits, rootkits, worms, and the 64-bit malware, we are still left with 6.4 million
identified malicious files. This is 28 percent of the total of this quarter and a decrease of 7.7 percent
compared with the third quarter.
Figure 16: Other Malware Q4
Figure 15: 64-bit Malware Families Q4
Malware Trend Report Quarter 4, 2014
Page 19 of 28
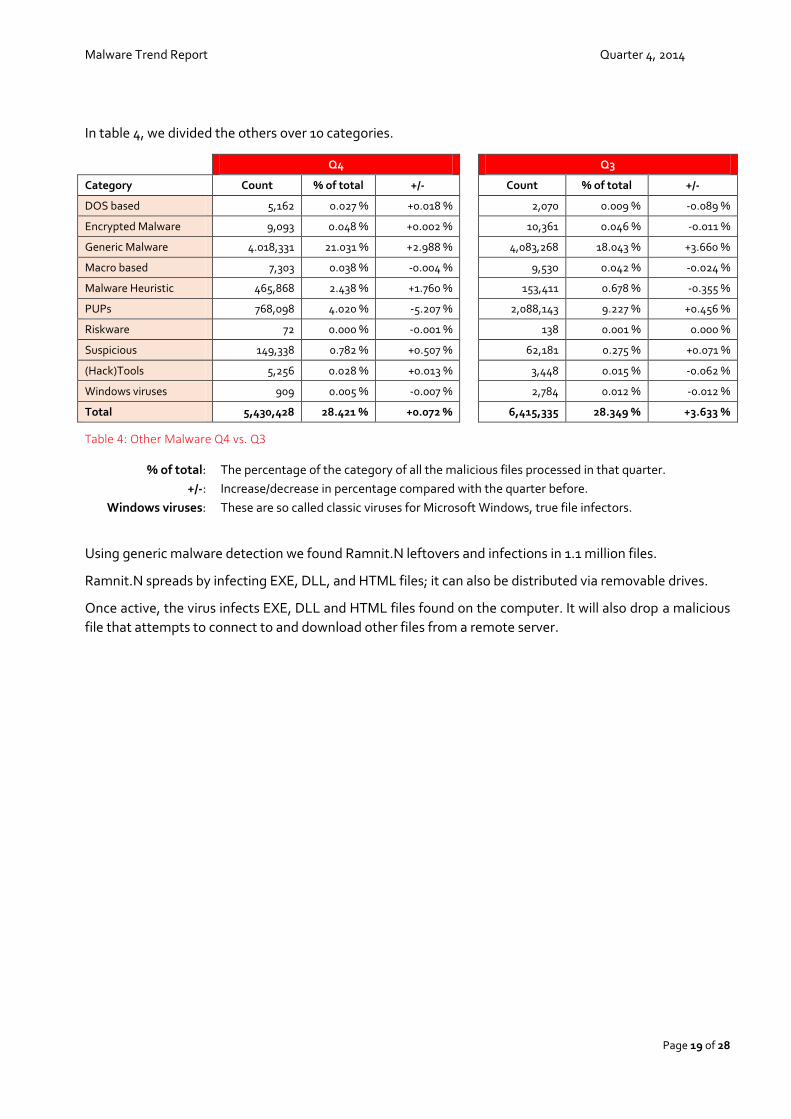
In table 4, we divided the others over 10 categories.
Q4
Q3
Category Count % of total +/-
Count % of total +/-
DOS based 5,162 0.027 % +0.018 %
2,070 0.009 % -0.089 %
Encrypted Malware 9,093 0.048 % +0.002 % 10,361 0.046 % -0.011 %
Generic Malware 4.018,331 21.031 % +2.988 % 4,083,268 18.043 % +3.660 %
Macro based 7,303 0.038 % -0.004 % 9,530 0.042 % -0.024 %
Malware Heuristic 465,868 2.438 % +1.760 % 153,411 0.678 % -0.355 %
PUPs 768,098 4.020 % -5.207 % 2,088,143 9.227 % +0.456 %
Riskware 72 0.000 % -0.001 %
138 0.001 % 0.000 %
Suspicious 149,338 0.782 % +0.507 % 62,181 0.275 % +0.071 %
(Hack)Tools 5,256 0.028 % +0.013 % 3,448 0.015 % -0.062 %
Windows viruses 909 0.005 % -0.007 %
2,784 0.012 % -0.012 %
Total 5,430,428 28.421 % +0.072 %
6,415,335 28.349 % +3.633 %
Table 4: Other Malware Q4 vs. Q3
% of total: The percentage of the category of all the malicious files processed in that quarter.
+/-: Increase/decrease in percentage compared with the quarter before.
Windows viruses: These are so called classic viruses for Microsoft Windows, true file infectors.
Using generic malware detection we found Ramnit.N leftovers and infections in 1.1 million files.
Ramnit.N spreads by infecting EXE, DLL, and HTML files; it can also be distributed via removable drives.
Once active, the virus infects EXE, DLL and HTML files found on the computer. It will also drop a malicious
file that attempts to connect to and download other files from a remote server.
Malware Trend Report Quarter 4, 2014
Page 20 of 28
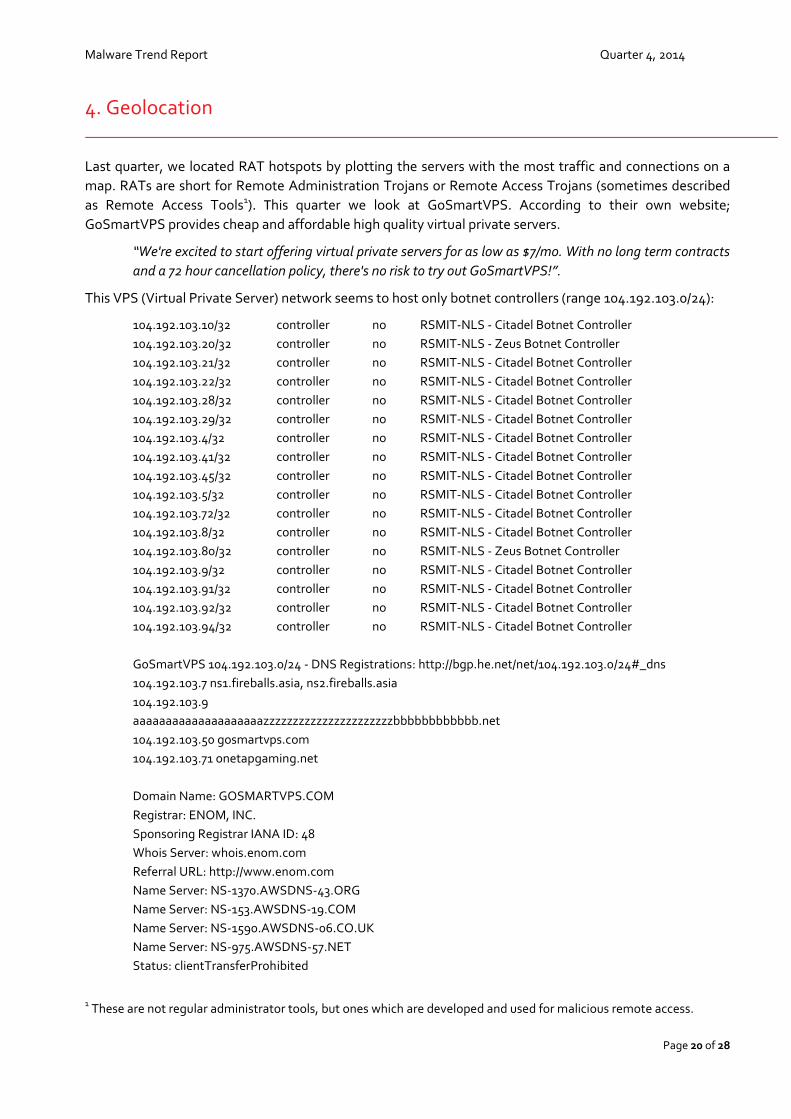
4. Geolocation
Last quarter, we located RAT hotspots by plotting the servers with the most traffic and connections on a
map. RATs are short for Remote Administration Trojans or Remote Access Trojans (sometimes described
as Remote Access Tools1). This quarter we look at GoSmartVPS. According to their own website;
GoSmartVPS provides cheap and affordable high quality virtual private servers.
“We're excited to start offering virtual private servers for as low as $7/mo. With no long term contracts
and a 72 hour cancellation policy, there's no risk to try out GoSmartVPS!”.
This VPS (Virtual Private Server) network seems to host only botnet controllers (range 104.192.103.0/24):
104.192.103.10/32 controller no RSMIT-NLS - Citadel Botnet Controller
104.192.103.20/32 controller no RSMIT-NLS - Zeus Botnet Controller
104.192.103.21/32 controller no RSMIT-NLS - Citadel Botnet Controller
104.192.103.22/32 controller no RSMIT-NLS - Citadel Botnet Controller
104.192.103.28/32 controller no RSMIT-NLS - Citadel Botnet Controller
104.192.103.29/32 controller no RSMIT-NLS - Citadel Botnet Controller
104.192.103.4/32 controller no RSMIT-NLS - Citadel Botnet Controller
104.192.103.41/32 controller no RSMIT-NLS - Citadel Botnet Controller
104.192.103.45/32 controller no RSMIT-NLS - Citadel Botnet Controller
104.192.103.5/32 controller no RSMIT-NLS - Citadel Botnet Controller
104.192.103.72/32 controller no RSMIT-NLS - Citadel Botnet Controller
104.192.103.8/32 controller no RSMIT-NLS - Citadel Botnet Controller
104.192.103.80/32 controller no RSMIT-NLS - Zeus Botnet Controller
104.192.103.9/32 controller no RSMIT-NLS - Citadel Botnet Controller
104.192.103.91/32 controller no RSMIT-NLS - Citadel Botnet Controller
104.192.103.92/32 controller no RSMIT-NLS - Citadel Botnet Controller
104.192.103.94/32 controller no RSMIT-NLS - Citadel Botnet Controller
GoSmartVPS 104.192.103.0/24 - DNS Registrations: http://bgp.he.net/net/104.192.103.0/24#_dns
104.192.103.7 ns1.fireballs.asia, ns2.fireballs.asia
104.192.103.9
aaaaaaaaaaaaaaaaaaaazzzzzzzzzzzzzzzzzzzzzzbbbbbbbbbbbb.net
104.192.103.50 gosmartvps.com
104.192.103.71 onetapgaming.net
Domain Name: GOSMARTVPS.COM
Registrar: ENOM, INC.
Sponsoring Registrar IANA ID: 48
Whois Server: whois.enom.com
Referral URL: http://www.enom.com
Name Server: NS-1370.AWSDNS-43.ORG
Name Server: NS-153.AWSDNS-19.COM
Name Server: NS-1590.AWSDNS-06.CO.UK
Name Server: NS-975.AWSDNS-57.NET
Status: clientTransferProhibited
1 These are not regular administrator tools, but ones which are developed and used for malicious remote access.
Malware Trend Report Quarter 4, 2014
Page 21 of 28
Updated Date: 17-sep-2014
Creation Date: 20-jul-2014
Expiration Date: 20-jul-2015
Website: https://www.gosmartvps.com/
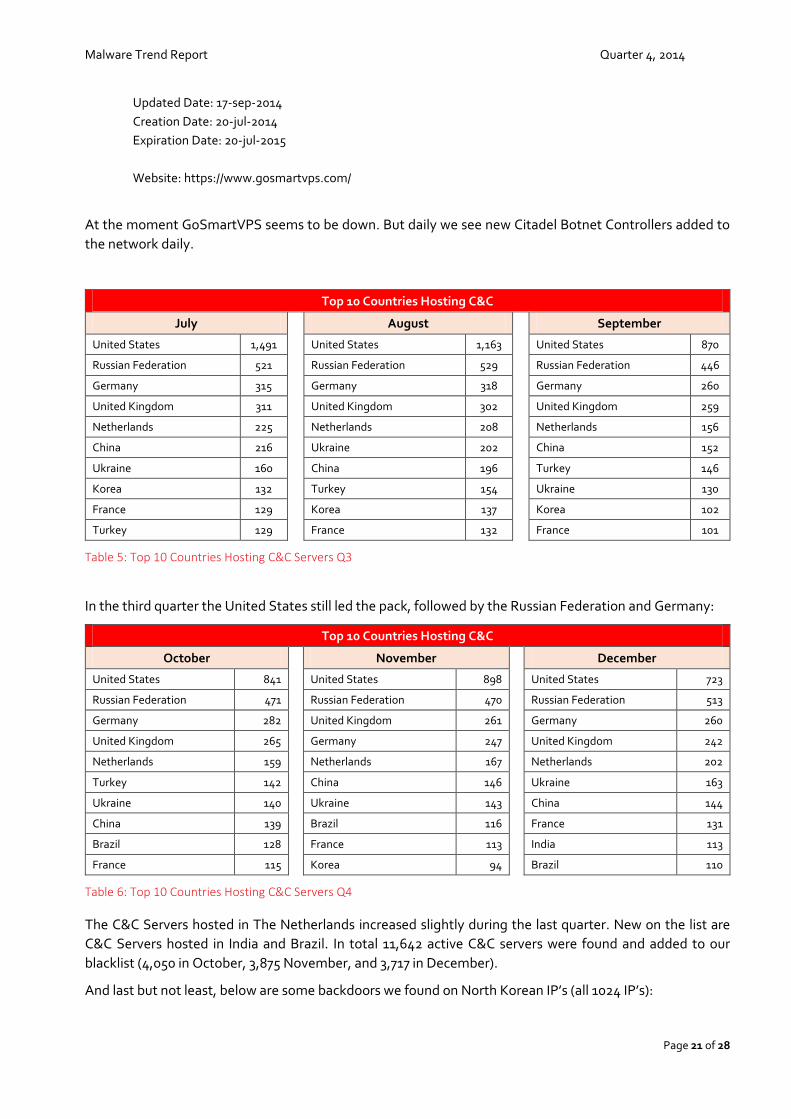
At the moment GoSmartVPS seems to be down. But daily we see new Citadel Botnet Controllers added to
the network daily.
Top 10 Countries Hosting C&C
July
August
September
United States 1,491
United States 1,163
United States 870
Russian Federation 521
Russian Federation 529
Russian Federation 446
Germany 315
Germany 318
Germany 260
United Kingdom 311
United Kingdom 302
United Kingdom 259
Netherlands 225
Netherlands 208
Netherlands 156
China 216
Ukraine 202
China 152
Ukraine 160
China 196
Turkey 146
Korea 132
Turkey 154
Ukraine 130
France 129
Korea 137
Korea 102
Turkey 129
France 132
France 101
Table 5: Top 10 Countries Hosting C&C Servers Q3
In the third quarter the United States still led the pack, followed by the Russian Federation and Germany:
Top 10 Countries Hosting C&C
October
November
December
United States 841
United States 898 United States 723
Russian Federation 471
Russian Federation 470 Russian Federation 513
Germany 282
United Kingdom 261 Germany 260
United Kingdom 265
Germany 247 United Kingdom 242
Netherlands 159
Netherlands 167 Netherlands 202
Turkey 142
China 146 Ukraine 163
Ukraine 140
Ukraine 143 China 144
China 139
Brazil 116 France 131
Brazil 128
France 113 India 113
France 115
Korea 94 Brazil 110
Table 6: Top 10 Countries Hosting C&C Servers Q4
The C&C Servers hosted in The Netherlands increased slightly during the last quarter. New on the list are
C&C Servers hosted in India and Brazil. In total 11,642 active C&C servers were found and added to our
blacklist (4,050 in October, 3,875 November, and 3,717 in December).
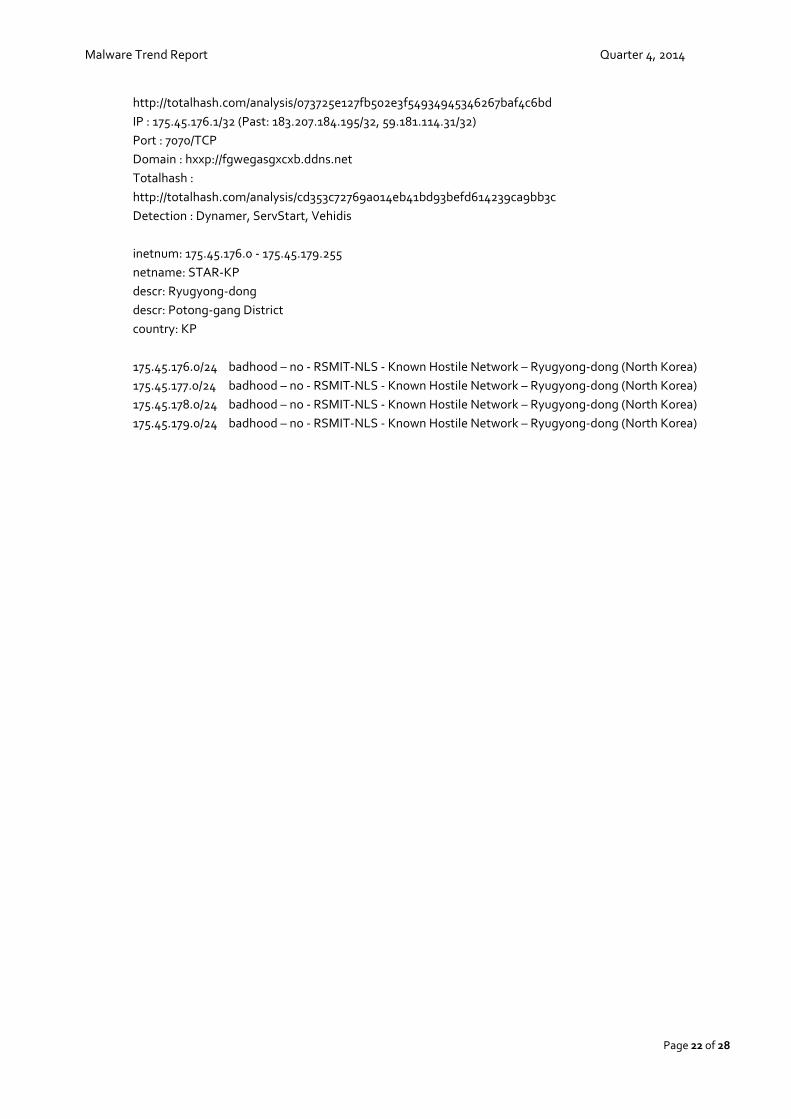
And last but not least, below are some backdoors we found on North Korean IP’s (all 1024 IP’s):
Malware Trend Report Quarter 4, 2014
Page 22 of 28
http://totalhash.com/analysis/073725e127fb502e3f54934945346267baf4c6bd
IP : 175.45.176.1/32 (Past: 183.207.184.195/32, 59.181.114.31/32)
Port : 7070/TCP
Domain : hxxp://fgwegasgxcxb.ddns.net
Totalhash :
http://totalhash.com/analysis/cd353c72769a014eb41bd93befd614239ca9bb3c
Detection : Dynamer, ServStart, Vehidis
inetnum: 175.45.176.0 - 175.45.179.255
netname: STAR-KP
descr: Ryugyong-dong
descr: Potong-gang District
country: KP
175.45.176.0/24 badhood – no - RSMIT-NLS - Known Hostile Network – Ryugyong-dong (North Korea)
175.45.177.0/24 badhood – no - RSMIT-NLS - Known Hostile Network – Ryugyong-dong (North Korea)
175.45.178.0/24 badhood – no - RSMIT-NLS - Known Hostile Network – Ryugyong-dong (North Korea)
175.45.179.0/24 badhood – no - RSMIT-NLS - Known Hostile Network – Ryugyong-dong (North Korea)
Malware Trend Report Quarter 4, 2014
Page 23 of 28
5. Final Word
In the third quarter of 2014, the total number of new malicious files processed was 21.6 million. For the
fourth quarter it was 23.2 million ― an increase of 2.4 percent.
The overall detection by Anti-Virus software improved by 3.32 percent compared with the third quarter.
Altogether, around 4.4 million malicious files went undetected during the fourth quarter.
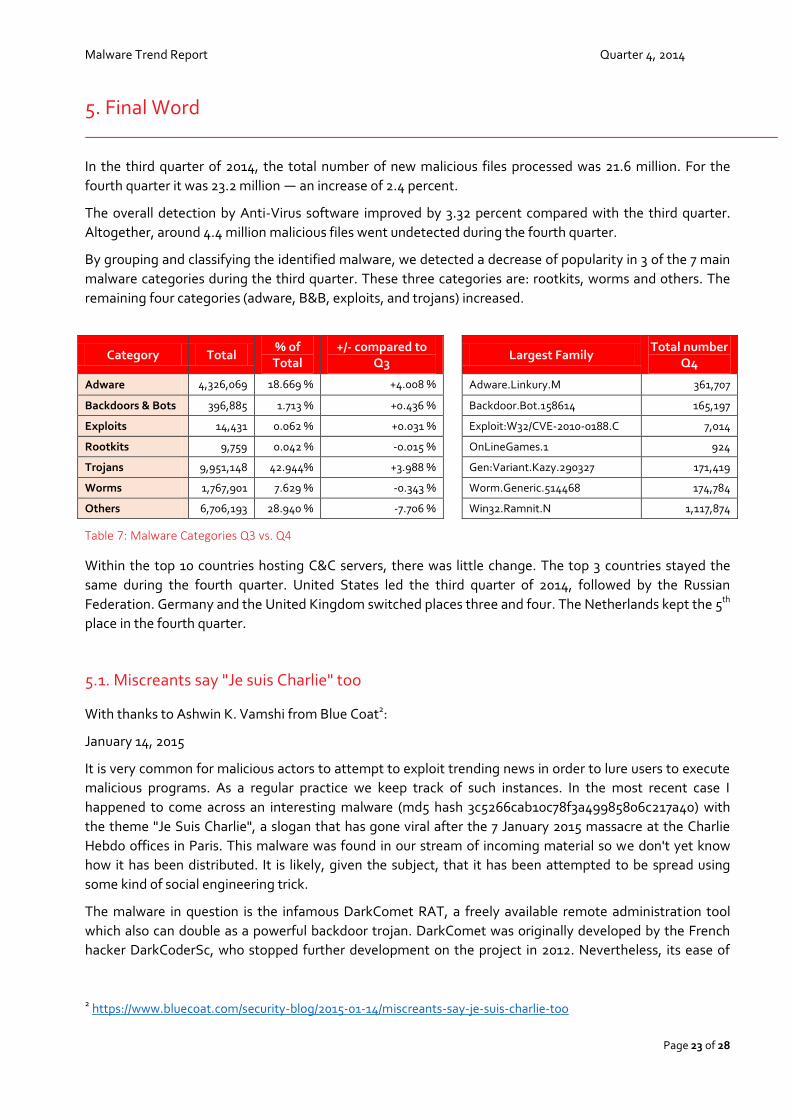
By grouping and classifying the identified malware, we detected a decrease of popularity in 3 of the 7 main
malware categories during the third quarter. These three categories are: rootkits, worms and others. The
remaining four categories (adware, B&B, exploits, and trojans) increased.
Category Total % of Total
+/- compared to Q3
Largest Family
Total number Q4
Adware 4,326,069 18.669 % +4.008 % Adware.Linkury.M 361,707
Backdoors & Bots 396,885 1.713 % +0.436 % Backdoor.Bot.158614 165,197
Exploits 14,431 0.062 % +0.031 % Exploit:W32/CVE-2010-0188.C 7,014
Rootkits 9,759 0.042 % -0.015 % OnLineGames.1 924
Trojans 9,951,148 42.944% +3.988 % Gen:Variant.Kazy.290327 171,419
Worms 1,767,901 7.629 % -0.343 % Worm.Generic.514468 174,784
Others 6,706,193 28.940 % -7.706 % Win32.Ramnit.N 1,117,874
Table 7: Malware Categories Q3 vs. Q4
Within the top 10 countries hosting C&C servers, there was little change. The top 3 countries stayed the
same during the fourth quarter. United States led the third quarter of 2014, followed by the Russian
Federation. Germany and the United Kingdom switched places three and four. The Netherlands kept the 5th
place in the fourth quarter.
5.1. Miscreants say "Je suis Charlie" too
With thanks to Ashwin K. Vamshi from Blue Coat2:
January 14, 2015
It is very common for malicious actors to attempt to exploit trending news in order to lure users to execute
malicious programs. As a regular practice we keep track of such instances. In the most recent case I
happened to come across an interesting malware (md5 hash 3c5266cab10c78f3a49985806c217a40) with
the theme "Je Suis Charlie", a slogan that has gone viral after the 7 January 2015 massacre at the Charlie
Hebdo offices in Paris. This malware was found in our stream of incoming material so we don't yet know
how it has been distributed. It is likely, given the subject, that it has been attempted to be spread using
some kind of social engineering trick.
The malware in question is the infamous DarkComet RAT, a freely available remote administration tool
which also can double as a powerful backdoor trojan. DarkComet was originally developed by the French
hacker DarkCoderSc, who stopped further development on the project in 2012. Nevertheless, its ease of
2 https://www.bluecoat.com/security-blog/2015-01-14/miscreants-say-je-suis-charlie-too
Malware Trend Report Quarter 4, 2014
Page 24 of 28
use and rich set of features have kept it popular by all sorts of attackers – from script kiddies and activists to
more sinister players.
The variant used in the present attack is obfuscated to
make it less noticed by AV scanners. The DarkComet Delphi
code is enveloped in a .NET wrapper, making the telltale
signs of DarkComet hard to spot. Indeed, the AV detection
rate of this executable is at the time of writing poor – only
2/53 scanners had detection on the VirusTotal online
scanner service.
The sample drops a copy of itself with the name
svchost.exe and launches an image of a new-born baby
with a band carrying the name “Je suis Charlie”. This image
appears to have been harvested from public sources.
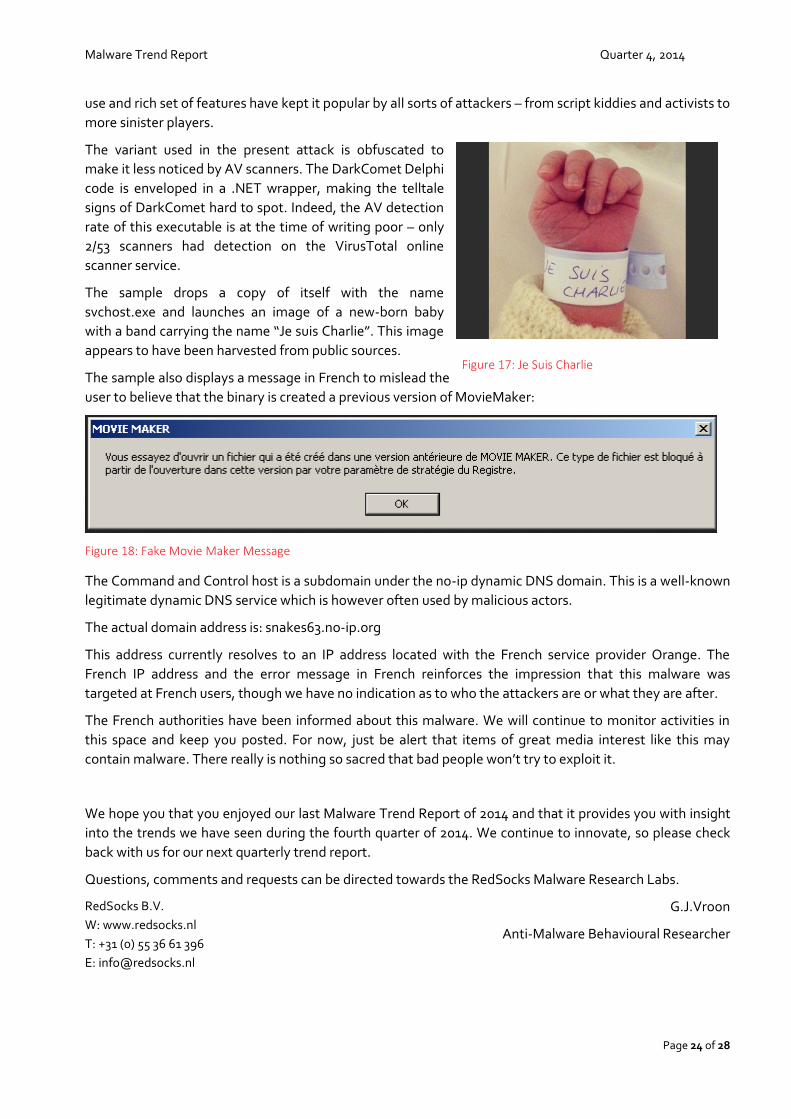
The sample also displays a message in French to mislead the
user to believe that the binary is created a previous version of MovieMaker:
Figure 18: Fake Movie Maker Message
The Command and Control host is a subdomain under the no-ip dynamic DNS domain. This is a well-known
legitimate dynamic DNS service which is however often used by malicious actors.
The actual domain address is: snakes63.no-ip.org
This address currently resolves to an IP address located with the French service provider Orange. The
French IP address and the error message in French reinforces the impression that this malware was
targeted at French users, though we have no indication as to who the attackers are or what they are after.
The French authorities have been informed about this malware. We will continue to monitor activities in
this space and keep you posted. For now, just be alert that items of great media interest like this may
contain malware. There really is nothing so sacred that bad people won’t try to exploit it.
We hope you that you enjoyed our last Malware Trend Report of 2014 and that it provides you with insight
into the trends we have seen during the fourth quarter of 2014. We continue to innovate, so please check
back with us for our next quarterly trend report.
Questions, comments and requests can be directed towards the RedSocks Malware Research Labs.
RedSocks B.V.
W: www.redsocks.nl
T: +31 (0) 55 36 61 396
G.J.Vroon
Anti-Malware Behavioural Researcher
Figure 17: Je Suis Charlie
Malware Trend Report Quarter 4, 2014
Page 25 of 28
Appendix A: Detecting Malware
October November December
Day Files/day Detected Undetected Files/day Detected Undetected Files/day Detected Undetected
1 221,937 200,528 21,408 236,090 206,643 29,448 244,116 164,287 79,829
2 168,499 161,146 7,354 201,200 164,018 37,182 184,865 115,627 69,238
3 361,909 338,775 23,134 213,385 136,869 76,516 332,940 249,940 83,000
4 153,901 137,034 16,867 205,116 177,877 27,239 246,356 217,720 28,636
5 124,380 109,983 14,398 271,873 218,853 53,020 176,054 139,133 36,921
6 301,671 250,114 51,557 239,222 188,029 51,193 264,365 230,824 33,541
7 258,230 216,171 42,059 316,480 264,800 51,680 251,041 188,247 62,794
8 228,246 185,867 42,379 297,104 242,714 54,389 210,009 152,055 57,954
9 239,393 204,431 34,961 291,190 240,353 50,837 272,098 257,446 14,651
10 277,362 228,366 48,996 246,214 201,994 44,220 208,351 181,309 27,042
11 259,950 211,244 48,707 354,297 277,742 76,554 244,919 171,534 73,385
12 306,124 247,136 58,988 341,688 320,380 21,308 266,031 102,453 163,578
13 207,723 175,397 32,327 310,112 276,394 33,718 257,518 196,878 60,640
14 276,737 230,297 46,440 263,443 234,911 28,531 256,524 148,015 108,509
15 299,877 260,408 39,469 284,533 241,486 43,047 278,860 106,409 172,451
16 263,683 232,631 31,052 289,192 240,825 48,367 227,842 178,681 49,161
17 224,200 184,926 39,274 262,500 242,366 20,134 221,496 167,886 53,610
18 161,020 120,651 40,369 310,643 234,577 76,066 274,758 211,455 63,303
19 177,721 145,891 31,830 293,911 272,024 21,888 212,262 157,201 55,061
20 311,035 231,104 79,931 309,302 222,826 86,476 308,861 243,483 65,378
21 249,389 220,454 28,935 269,771 251,213 18,558 258,537 186,288 72,249
22 276,690 253,374 23,316 222,693 190,708 31,984 268,484 199,313 69,171
23 216,372 207,158 9,214 382,913 289,522 93,391 252,430 170,555 81,876
24 248,500 223,505 24,996 220,827 198,747 22,080 269,492 194,215 75,278
25 150,332 128,447 21,885 318,781 246,505 72,276 188,857 135,065 53,793
26 177,292 159,228 18,063 207,452 197,750 9,702 203,579 164,761 38,818
27 194,929 166,240 28,689 206,615 179,730 26,885 275,716 195,061 80,655
28 188,917 163,458 25,459 280,991 228,548 52,443 261,654 184,278 77,376
29 221,939 199,706 22,234 290,104 254,482 35,622 433,501 390,679 42,822
30 250,993 233,906 17,087 212,383 183,670 28,713 215,112 150,613 64,499
31 235,042 207,665 27,377 221,742 154,493 67,249
7,233,995 6,235,241 971,377 8,150,022 6,826,555 1,323,467 7,788,369 5,705,903 2,082,467
Malware Trend Report Quarter 4, 2014
Page 26 of 28
Appendix B: Classifying Malware
October
Day Adware Backdoors Exploits Rootkits Trojans Worms Other
1 29,142 3,666 32 67 91,371 21,971 75,685
2 30,304 4,015 11 48 66,061 16,921 51,139
3 59,977 3,392 84 37 158,731 38,781 100,906
4 16,499 1,716 49 35 68,273 19,933 47,396
5 16,258 1,175 24 45 51,170 16,586 39,123
6 53,250 3,566 273 110 109,577 15,555 119,340
7 48,607 6,307 31 58 108,077 12,122 83,028
8 37,251 6,769 18 68 98,111 12,690 73,339
9 41,105 8,975 13 44 112,391 15,580 61,284
10 54,341 9,832 180 42 114,025 15,720 83,222
11 54,726 7,303 37 75 102,938 14,279 80,592
12 82,129 3,810 26 76 86,788 16,360 116,935
13 44,742 6,363 98 35 61,265 13,382 81,839
14 47,803 4,727 35 39 76,580 32,953 114,600
15 34,787 5,415 45 82 140,987 29,158 89,404
16 37,506 8,213 32 53 82,135 27,071 108,673
17 40,128 1,499 142 45 96,503 9,970 75,914
18 46,505 1,229 200 264 56,228 5,402 51,194
19 41,966 963 0 53 56,649 11,941 66,149
20 65,477 2,681 92 1,035 112,007 19,718 110,024
21 35,952 2,953 45 450 118,511 16,512 74,966
22 34,956 2,282 27 27 144,081 10,863 84,453
23 23,879 2,219 326 21 111,415 8,553 69,960
24 38,910 2,961 12 44 100,932 12,110 93,532
25 51,613 1,925 37 23 48,131 2,910 45,693
26 24,172 2,210 3 12 69,035 4,614 77,245
27 19,102 2,048 2 7 97,727 8,190 67,854
28 28,489 1,660 12 28 86,147 13,727 58,854
29 33,507 3,472 2 67 96,669 15,447 72,775
30 13,067 3,107 9 15 131,188 8,435 95,171
31 31,450 2,414 13 36 122,161 3,789 75,179
Total 1,217,599 118,868 1,911 3,042 2,975,865 471,243 2,445,466
Malware Trend Report Quarter 4, 2014
Page 27 of 28
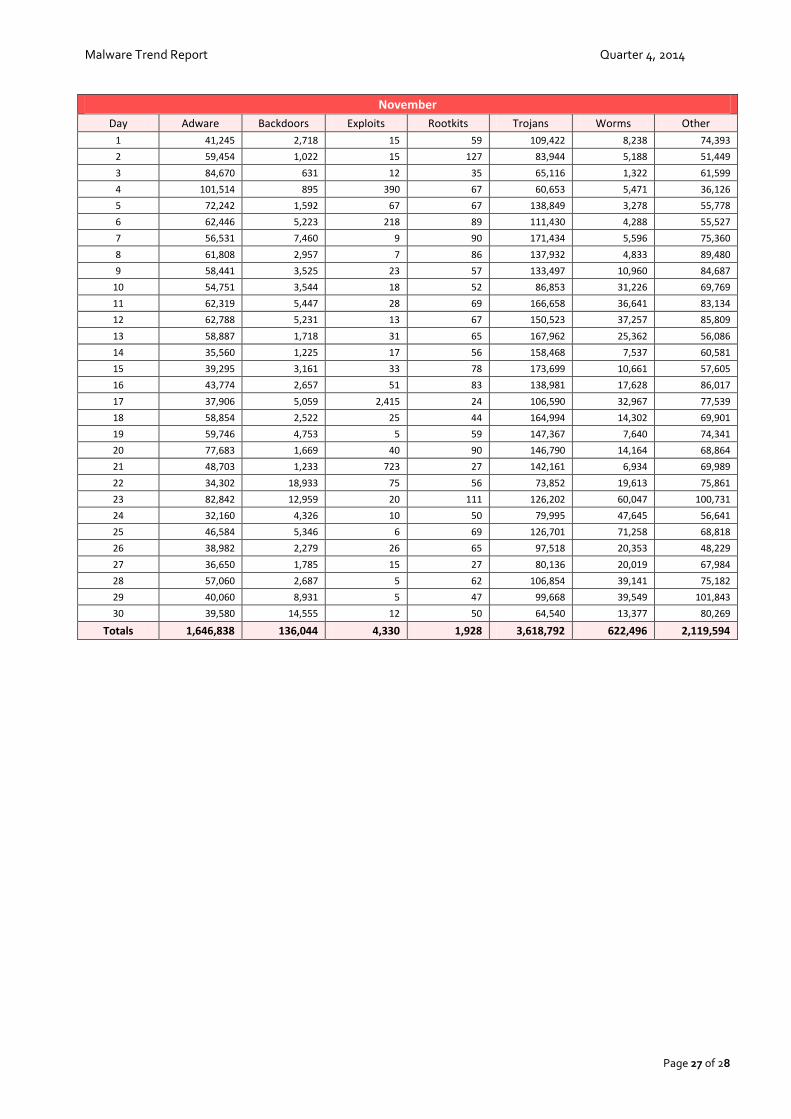
November
Day Adware Backdoors Exploits Rootkits Trojans Worms Other
1 41,245 2,718 15 59 109,422 8,238 74,393
2 59,454 1,022 15 127 83,944 5,188 51,449
3 84,670 631 12 35 65,116 1,322 61,599
4 101,514 895 390 67 60,653 5,471 36,126
5 72,242 1,592 67 67 138,849 3,278 55,778
6 62,446 5,223 218 89 111,430 4,288 55,527
7 56,531 7,460 9 90 171,434 5,596 75,360
8 61,808 2,957 7 86 137,932 4,833 89,480
9 58,441 3,525 23 57 133,497 10,960 84,687
10 54,751 3,544 18 52 86,853 31,226 69,769
11 62,319 5,447 28 69 166,658 36,641 83,134
12 62,788 5,231 13 67 150,523 37,257 85,809
13 58,887 1,718 31 65 167,962 25,362 56,086
14 35,560 1,225 17 56 158,468 7,537 60,581
15 39,295 3,161 33 78 173,699 10,661 57,605
16 43,774 2,657 51 83 138,981 17,628 86,017
17 37,906 5,059 2,415 24 106,590 32,967 77,539
18 58,854 2,522 25 44 164,994 14,302 69,901
19 59,746 4,753 5 59 147,367 7,640 74,341
20 77,683 1,669 40 90 146,790 14,164 68,864
21 48,703 1,233 723 27 142,161 6,934 69,989
22 34,302 18,933 75 56 73,852 19,613 75,861
23 82,842 12,959 20 111 126,202 60,047 100,731
24 32,160 4,326 10 50 79,995 47,645 56,641
25 46,584 5,346 6 69 126,701 71,258 68,818
26 38,982 2,279 26 65 97,518 20,353 48,229
27 36,650 1,785 15 27 80,136 20,019 67,984
28 57,060 2,687 5 62 106,854 39,141 75,182
29 40,060 8,931 5 47 99,668 39,549 101,843
30 39,580 14,555 12 50 64,540 13,377 80,269
Totals 1,646,838 136,044 4,330 1,928 3,618,792 622,496 2,119,594
Malware Trend Report Quarter 4, 2014
Page 28 of 28
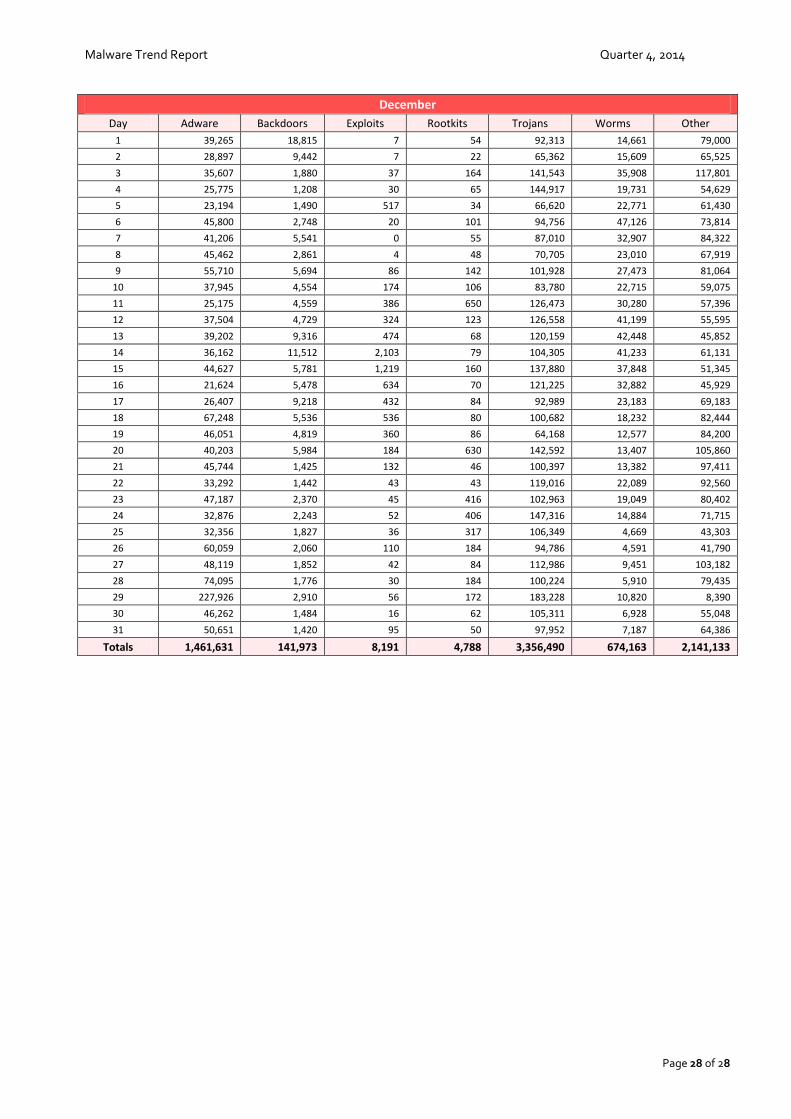
December
Day Adware Backdoors Exploits Rootkits Trojans Worms Other
1 39,265 18,815 7 54 92,313 14,661 79,000
2 28,897 9,442 7 22 65,362 15,609 65,525
3 35,607 1,880 37 164 141,543 35,908 117,801
4 25,775 1,208 30 65 144,917 19,731 54,629
5 23,194 1,490 517 34 66,620 22,771 61,430
6 45,800 2,748 20 101 94,756 47,126 73,814
7 41,206 5,541 0 55 87,010 32,907 84,322
8 45,462 2,861 4 48 70,705 23,010 67,919
9 55,710 5,694 86 142 101,928 27,473 81,064
10 37,945 4,554 174 106 83,780 22,715 59,075
11 25,175 4,559 386 650 126,473 30,280 57,396
12 37,504 4,729 324 123 126,558 41,199 55,595
13 39,202 9,316 474 68 120,159 42,448 45,852
14 36,162 11,512 2,103 79 104,305 41,233 61,131
15 44,627 5,781 1,219 160 137,880 37,848 51,345
16 21,624 5,478 634 70 121,225 32,882 45,929
17 26,407 9,218 432 84 92,989 23,183 69,183
18 67,248 5,536 536 80 100,682 18,232 82,444
19 46,051 4,819 360 86 64,168 12,577 84,200
20 40,203 5,984 184 630 142,592 13,407 105,860
21 45,744 1,425 132 46 100,397 13,382 97,411
22 33,292 1,442 43 43 119,016 22,089 92,560
23 47,187 2,370 45 416 102,963 19,049 80,402
24 32,876 2,243 52 406 147,316 14,884 71,715
25 32,356 1,827 36 317 106,349 4,669 43,303
26 60,059 2,060 110 184 94,786 4,591 41,790
27 48,119 1,852 42 84 112,986 9,451 103,182
28 74,095 1,776 30 184 100,224 5,910 79,435
29 227,926 2,910 56 172 183,228 10,820 8,390
30 46,262 1,484 16 62 105,311 6,928 55,048
31 50,651 1,420 95 50 97,952 7,187 64,386
Totals 1,461,631 141,973 8,191 4,788 3,356,490 674,163 2,141,133
REDSOCKS RedSocks is a Dutch company specialised in malware detection. RedSocks supplies RedSocks malware
threat defender as a network appliance. This innovative appliance analyses digital traffic flows in real
time based on the algorithms and lists of malicious indicators compiled by the RedSocks Malware
Intelligence Team. This team consists of specialists in identifying new threats on the internet and
translating them into state-of-the-art malware detection.
Laan van Nieuw-Oost Indië 133f, 2593 BM Den Haag Tel +31 (0)88 13 33 333 E-mail [email protected] Website www.redsocks.neu
www.redsocks.eu


![PoS RAM Scraper Malware...Trend Micro PoS RAM Scraper Malware 2 In 2009, Verizon also introduced PoS RAM scrapers, along with victim profiles. [3] Back then, the malware only accounted](https://img.pdfslide.net/doc/110x75/5ececcdc510079189a2ed70b/pos-ram-scraper-malware-trend-micro-pos-ram-scraper-malware-2-in-2009-verizon.jpg)


![Cyber- [.......] Hype or Trend? The drivers behind malware development](https://img.pdfslide.net/doc/110x75/56816931550346895de081dd/cyber-hype-or-trend-the-drivers-behind-malware-development.jpg)