Embed Size (px)
Citation preview
Q4 2014 results presentation
Summary Q4 2014
• Continued trend of improved performance*
• Seasonal operating loss* declined to SEK -230m (-308) – EBIT increase driven by higher gross margin
– Americas main driver of improvement by business area
– Negative currency impact of SEK -81m
• Full-year operating income* up 47% to SEK 2,358m (1,608) – EBIT margin improved by 1.9 p.p. to 7.2%
– EPS, excl. impairment increased with 74% to SEK 2.78 (1,60)
• Non-recurring impairment charge of SEK -767m
• Board proposes dividend of SEK 1.65 (1.50) per share
• New organization and reported divisions as of January 1
* Excluding non-recurring impairment 2
Financial highlights, Group
SEKm
Q4
2014
Q4
2013
As
reported Adjusted1
Jan-Dec
2014
Jan-Dec
2013
As
reported Adjusted1
Net sales 5,323 4,707 13 6 32,838 30,307 8 6
Gross margin 27.0 25.1 - - 28.5 26.5 - -
EBIT -997 -308 n/a n/a 1,591 1,608 -1 -1
EBIT, excl. impairment -230 -308 25 29 2,358 1,608 47 46
EBIT margin, % -18.7 -6.5 - - 4.8 5.3 - -
EBIT margin excl. impairment, % -4.3 -6.5 - - 7.2 5.3 - -
1 Adjusted for currency translation effects and items affecting comparability.
% change, Q4 % change, 12M
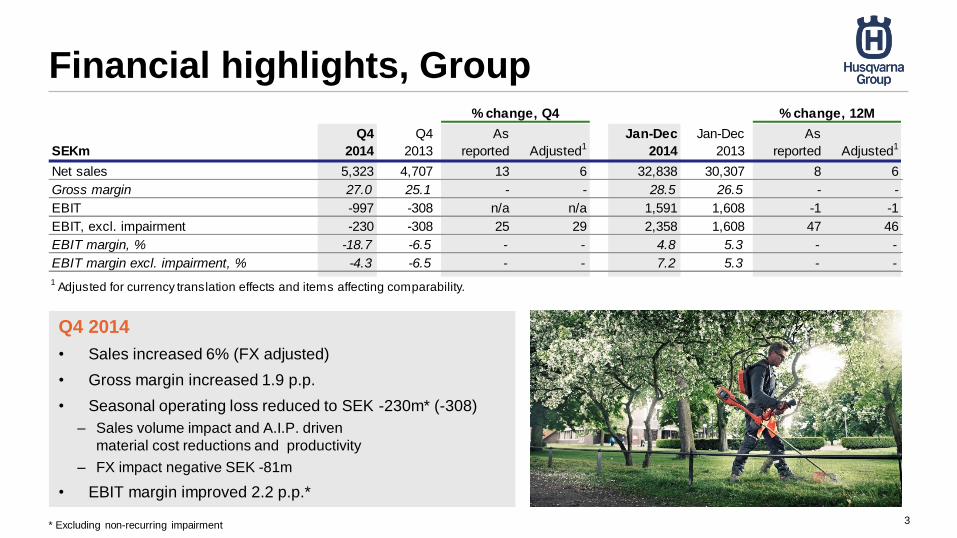
Q4 2014
• Sales increased 6% (FX adjusted)
• Gross margin increased 1.9 p.p.
• Seasonal operating loss reduced to SEK -230m* (-308)
– Sales volume impact and A.I.P. driven
material cost reductions and productivity
– FX impact negative SEK -81m
• EBIT margin improved 2.2 p.p.*
* Excluding non-recurring impairment 3
Europe & Asia/Pacific
SEKm
Q4
2014
Q4
2013
As
reported Adjusted1
Jan-Dec
2014
Jan-Dec
2013
As
reported Adjusted1
Net sales 2,418 2,294 5 3 15,824 14,736 7 5
EBIT -175 -147 -19 -13 1,904 1,488 28 26
EBIT margin, % -7.2 -6.4 - - 12.0 10.1 - -
1 Adjusted for currency translation effects and items affecting comparability.
% change, Q4 % change, 12M
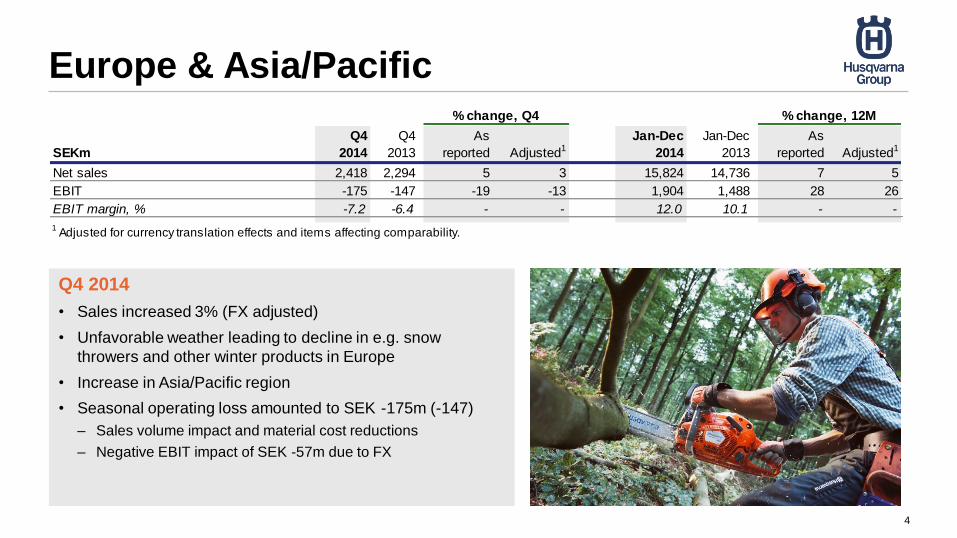
Q4 2014
• Sales increased 3% (FX adjusted)
• Unfavorable weather leading to decline in e.g. snow
throwers and other winter products in Europe
• Increase in Asia/Pacific region
• Seasonal operating loss amounted to SEK -175m (-147)
– Sales volume impact and material cost reductions
– Negative EBIT impact of SEK -57m due to FX
4
Americas
SEKm
Q4
2014
Q4
2013
As
reported Adjusted1
Jan-Dec
2014
Jan-Dec
2013
As
reported Adjusted1
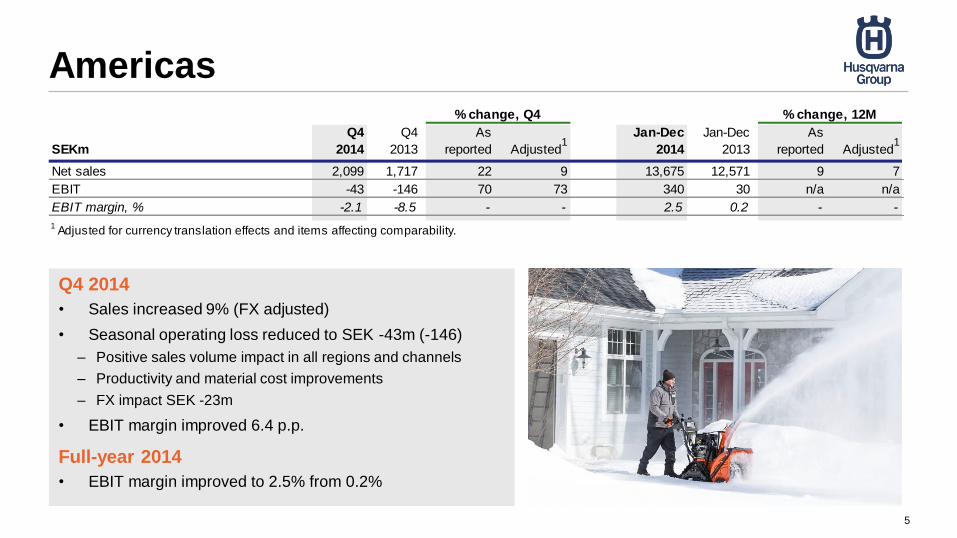
Net sales 2,099 1,717 22 9 13,675 12,571 9 7
EBIT -43 -146 70 73 340 30 n/a n/a
EBIT margin, % -2.1 -8.5 - - 2.5 0.2 - -
1 Adjusted for currency translation effects and items affecting comparability.
% change, Q4 % change, 12M
Q4 2014
• Sales increased 9% (FX adjusted)
• Seasonal operating loss reduced to SEK -43m (-146)
– Positive sales volume impact in all regions and channels
– Productivity and material cost improvements
– FX impact SEK -23m
• EBIT margin improved 6.4 p.p.
Full-year 2014
• EBIT margin improved to 2.5% from 0.2%
5
Construction
SEKm
Q4
2014
Q4
2013
As
reported Adjusted1
Jan-Dec
2014
Jan-Dec
2013
As
reported Adjusted1
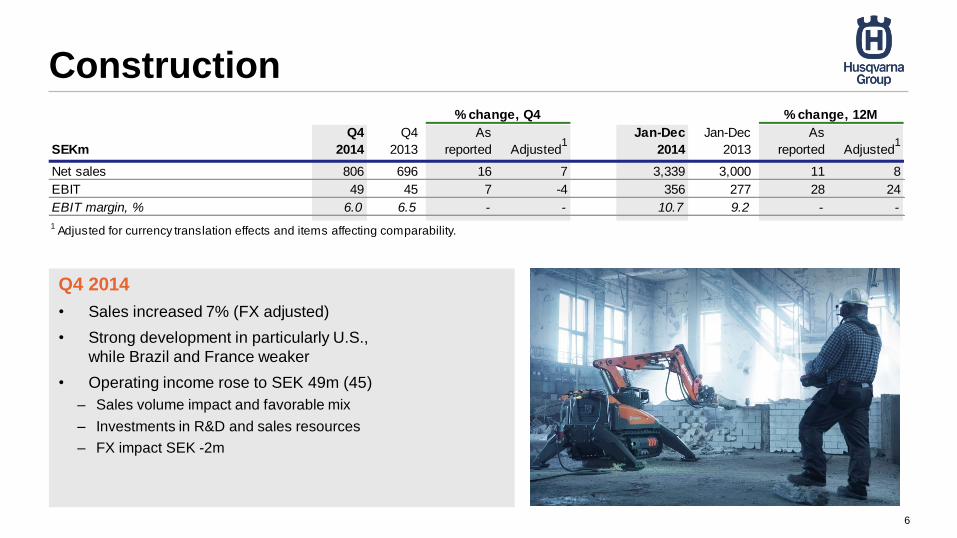
Net sales 806 696 16 7 3,339 3,000 11 8
EBIT 49 45 7 -4 356 277 28 24
EBIT margin, % 6.0 6.5 - - 10.7 9.2 - -
1 Adjusted for currency translation effects and items affecting comparability.
% change, Q4 % change, 12M
Q4 2014
• Sales increased 7% (FX adjusted)
• Strong development in particularly U.S.,
while Brazil and France weaker
• Operating income rose to SEK 49m (45)
– Sales volume impact and favorable mix
– Investments in R&D and sales resources
– FX impact SEK -2m
6
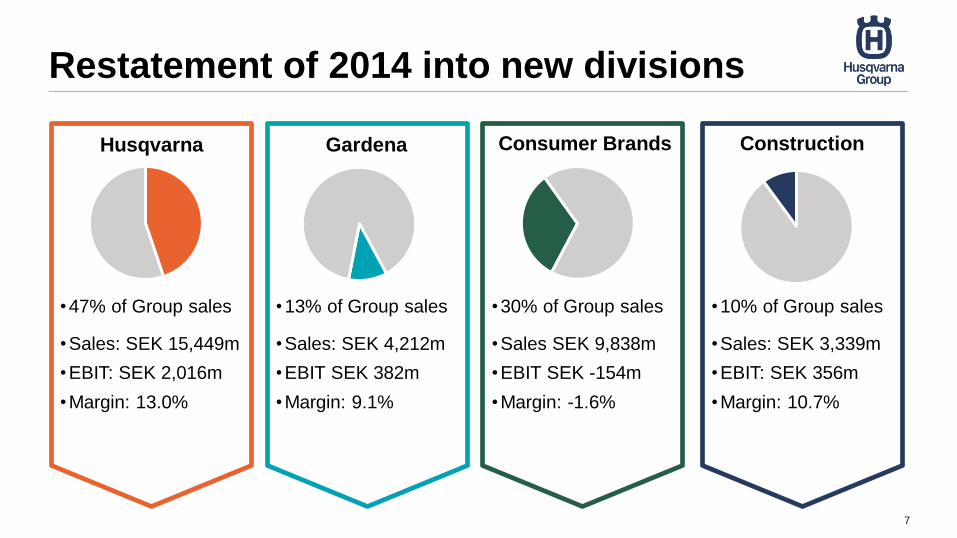
Restatement of 2014 into new divisions
Husqvarna Gardena Consumer Brands Construction
•47% of Group sales
•Sales: SEK 15,449m
•EBIT: SEK 2,016m
•Margin: 13.0%
•13% of Group sales
•Sales: SEK 4,212m
•EBIT SEK 382m
•Margin: 9.1%
•30% of Group sales
•Sales SEK 9,838m
•EBIT SEK -154m
•Margin: -1.6%
•10% of Group sales
•Sales: SEK 3,339m
•EBIT: SEK 356m
•Margin: 10.7%
7
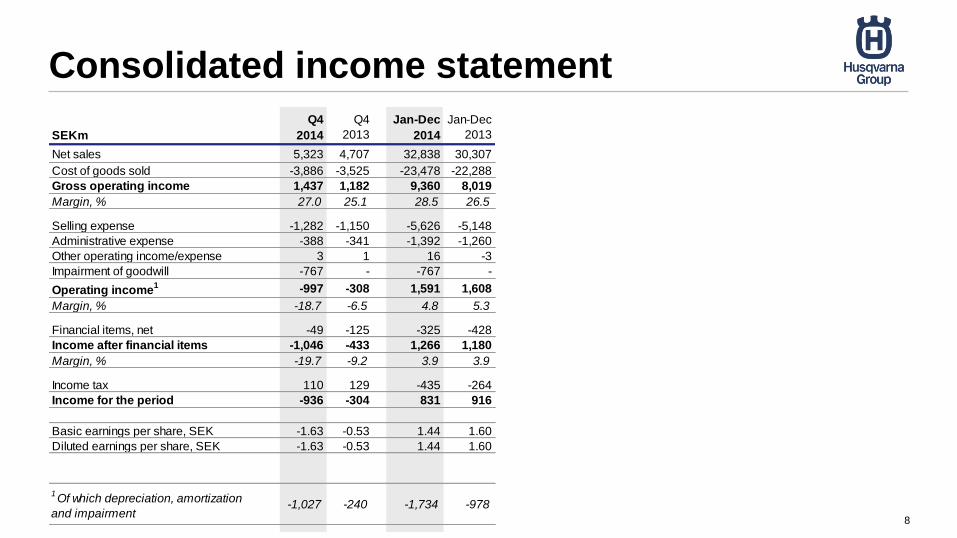
Consolidated income statement
8
SEKm
Q4
2014
Q4
2013
Jan-Dec
2014
Jan-Dec
2013
Net sales 5,323 4,707 32,838 30,307
Cost of goods sold -3,886 -3,525 -23,478 -22,288
Gross operating income 1,437 1,182 9,360 8,019
Margin, % 27.0 25.1 28.5 26.5
Selling expense -1,282 -1,150 -5,626 -5,148
Administrative expense -388 -341 -1,392 -1,260
Other operating income/expense 3 1 16 -3
Impairment of goodwill -767 - -767 -
Operating income1 -997 -308 1,591 1,608
Margin, % -18.7 -6.5 4.8 5.3
Financial items, net -49 -125 -325 -428
Income after financial items -1,046 -433 1,266 1,180
Margin, % -19.7 -9.2 3.9 3.9
Income tax 110 129 -435 -264
Income for the period -936 -304 831 916
Basic earnings per share, SEK -1.63 -0.53 1.44 1.60
Diluted earnings per share, SEK -1.63 -0.53 1.44 1.60
1Of which depreciation, amortization
and impairment-1,027 -240 -1,734 -978
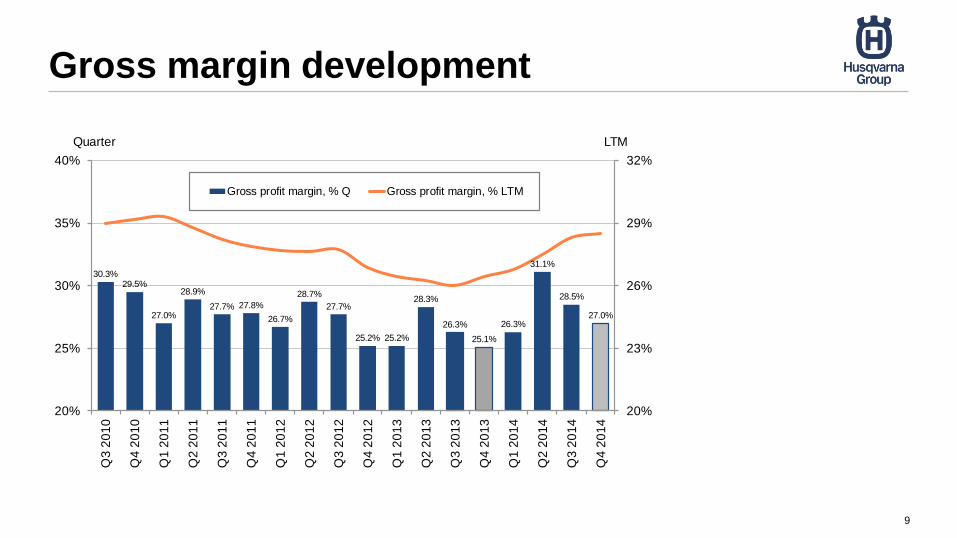
Gross margin development
9
30.3%29.5%
27.0%
28.9%
27.7% 27.8%
26.7%
28.7%
27.7%
25.2% 25.2%
28.3%
26.3%
25.1%
26.3%
31.1%
28.5%
27.0%
20%
23%
26%
29%
32%
20%
25%
30%
35%
40%
Q3 2
01
0
Q4 2
01
0
Q1 2
01
1
Q2 2
01
1
Q3 2
01
1
Q4 2
01
1
Q1 2
01
2
Q2 2
01
2
Q3 2
01
2
Q4 2
01
2
Q1 2
01
3
Q2 2
01
3
Q3 2
01
3
Q4 2
01
3
Q1 2
01
4
Q2 2
01
4
Q3 2
01
4
Q4 2
01
4
LTMQuarter
Gross profit margin, % Q Gross profit margin, % LTM
Impairment of goodwill
• Husqvarna Group established a new organization for its forest and garden operations,
which was fully effective as of January 1, 2015.
• The impairment test has in previous years been performed on geographical segments
(Europe & Asia/Pacific and Americas), with the conclusion that the recoverable amount
exceeded the carrying amount of the net assets.
• The cash generating units as of January 1 are the new divisions Husqvarna, Gardena,
Consumer Brands and Construction. Hence impairment test has been performed on all of
these.
• Impairment test shows that the Gardena division cannot defend the carrying amount of its
net assets, resulting in an impairment of goodwill of SEK -767m which has been charged to
the Group’s result for the fourth quarter 2014.
– A sensitivity of 10 percent higher discount rate, 10 percent decreased cash flow, and 1 percent lower
sales growth together with a 0.5% reduction of operating margin, has been applied
• The impairment is a Group charge, included in Group common cost, and does not impact
the business area reporting.
10
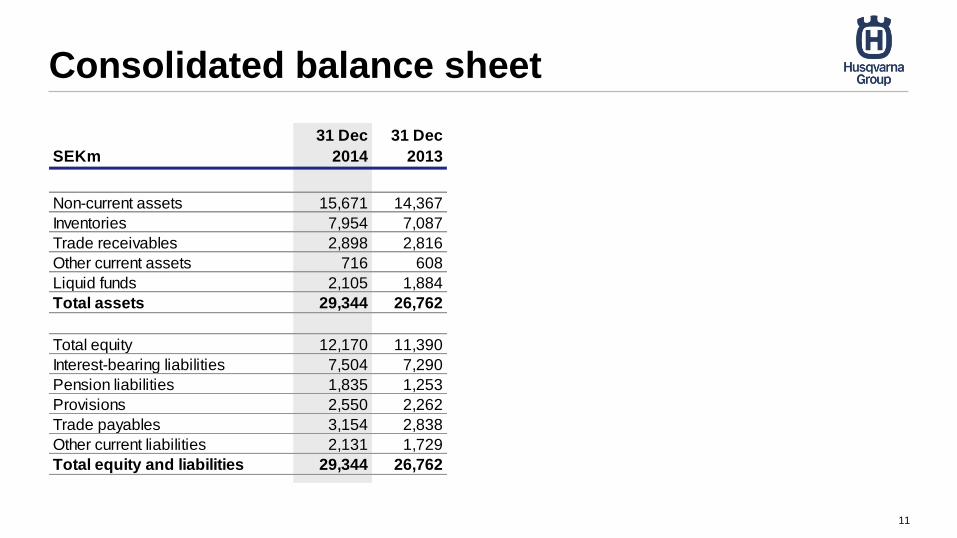
Consolidated balance sheet
SEKm
31 Dec
2014
31 Dec
2013
Non-current assets 15,671 14,367
Inventories 7,954 7,087
Trade receivables 2,898 2,816
Other current assets 716 608
Liquid funds 2,105 1,884
Total assets 29,344 26,762
Total equity 12,170 11,390
Interest-bearing liabilities 7,504 7,290
Pension liabilities 1,835 1,253
Provisions 2,550 2,262
Trade payables 3,154 2,838
Other current liabilities 2,131 1,729
Total equity and liabilities 29,344 26,762
11
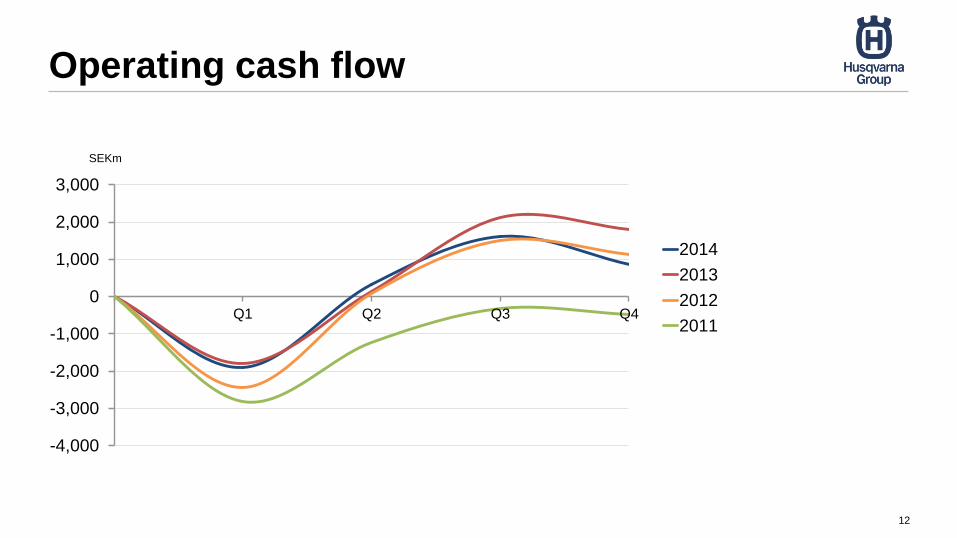
Operating cash flow
12
-4,000
-3,000
-2,000
-1,000
0
1,000
2,000
3,000
Q1 Q2 Q3 Q4
SEKm
2014
2013
2012
2011
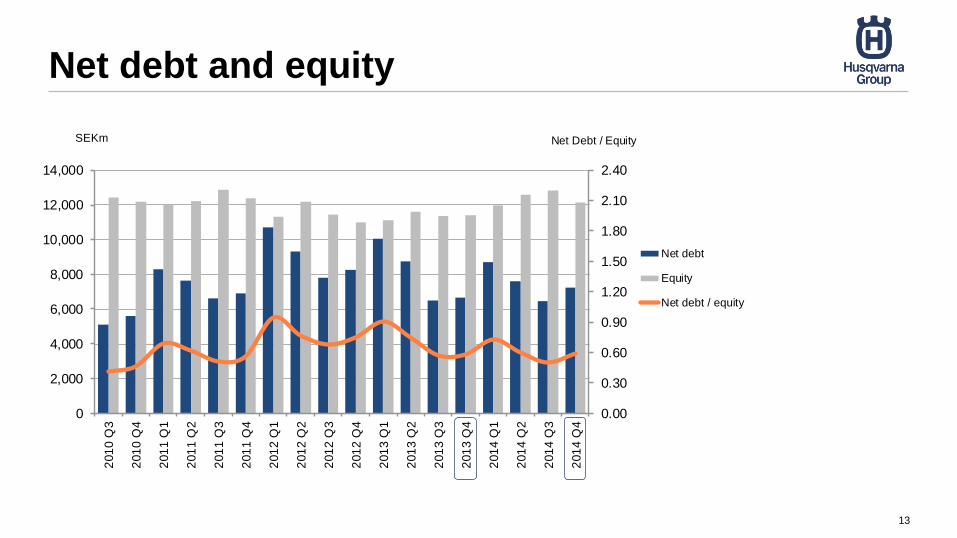
Net debt and equity
13
0.00
0.30
0.60
0.90
1.20
1.50
1.80
2.10
2.40
0
2,000
4,000
6,000
8,000
10,000
12,000
14,000
201
0 Q
3
201
0 Q
4
201
1 Q
1
201
1 Q
2
201
1 Q
3
201
1 Q
4
201
2 Q
1
201
2 Q
2
201
2 Q
3
201
2 Q
4
201
3 Q
1
201
3 Q
2
201
3 Q
3
201
3 Q
4
201
4 Q
1
201
4 Q
2
201
4 Q
3
201
4 Q
4
Net Debt / EquitySEKm
Net debt
Equity
Net debt / equity
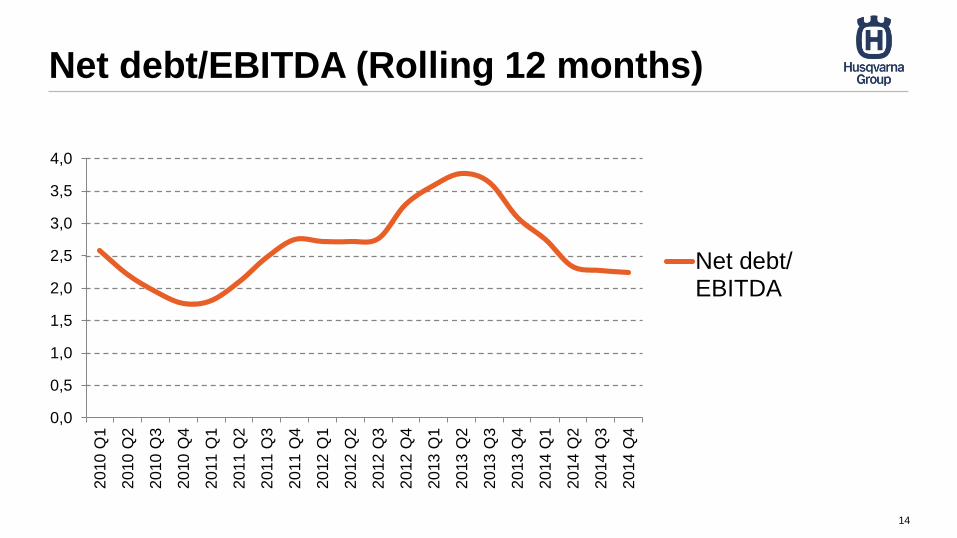
Net debt/EBITDA (Rolling 12 months)
0,0
0,5
1,0
1,5
2,0
2,5
3,0
3,5
4,0
20
10
Q1
20
10
Q2
20
10
Q3
20
10
Q4
20
11
Q1
20
11
Q2
20
11
Q3
20
11
Q4
20
12
Q1
20
12
Q2
20
12
Q3
20
12
Q4
20
13
Q1
20
13
Q2
20
13
Q3
20
13
Q4
20
14
Q1
20
14
Q2
20
14
Q3
20
14
Q4
Net debt/EBITDA
14
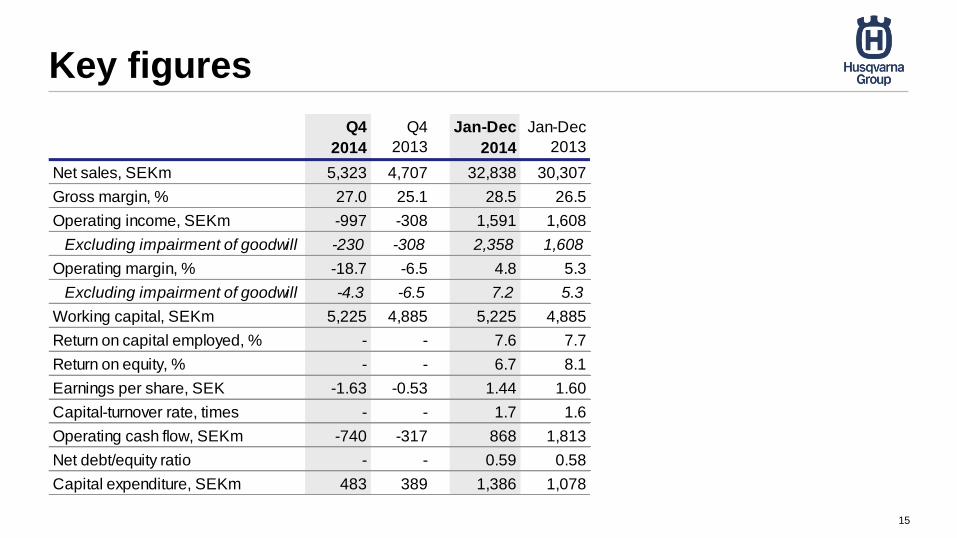
Key figures
Q4
2014
Q4
2013
Jan-Dec
2014
Jan-Dec
2013
Net sales, SEKm 5,323 4,707 32,838 30,307
Gross margin, % 27.0 25.1 28.5 26.5
Operating income, SEKm -997 -308 1,591 1,608
Excluding impairment of goodwill -230 -308 2,358 1,608
Operating margin, % -18.7 -6.5 4.8 5.3
Excluding impairment of goodwill -4.3 -6.5 7.2 5.3
Working capital, SEKm 5,225 4,885 5,225 4,885
Return on capital employed, % - - 7.6 7.7
Return on equity, % - - 6.7 8.1
Earnings per share, SEK -1.63 -0.53 1.44 1.60
Capital-turnover rate, times - - 1.7 1.6
Operating cash flow, SEKm -740 -317 868 1,813
Net debt/equity ratio - - 0.59 0.58
Capital expenditure, SEKm 483 389 1,386 1,078
15
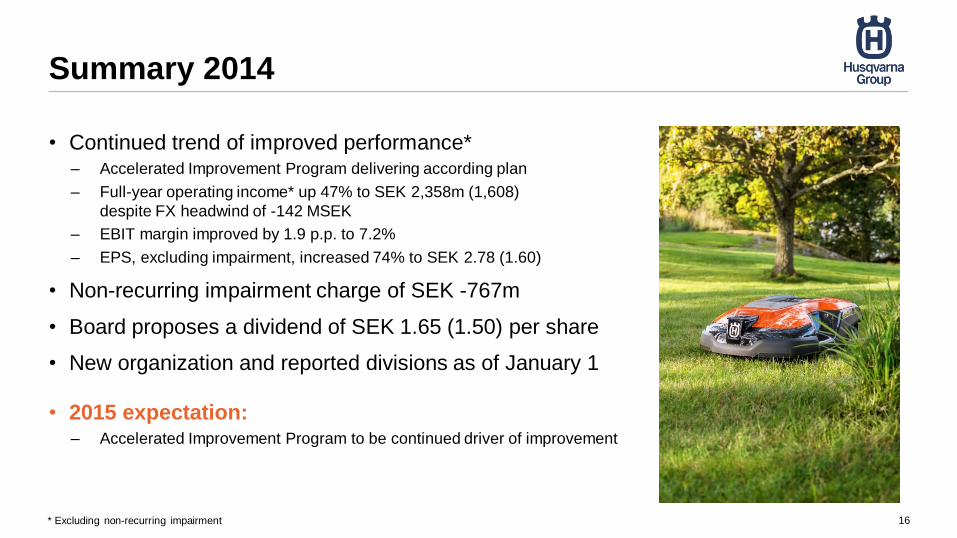
Summary 2014
• Continued trend of improved performance* – Accelerated Improvement Program delivering according plan
– Full-year operating income* up 47% to SEK 2,358m (1,608)
despite FX headwind of -142 MSEK
– EBIT margin improved by 1.9 p.p. to 7.2%
– EPS, excluding impairment, increased 74% to SEK 2.78 (1.60)
• Non-recurring impairment charge of SEK -767m
• Board proposes a dividend of SEK 1.65 (1.50) per share
• New organization and reported divisions as of January 1
• 2015 expectation: – Accelerated Improvement Program to be continued driver of improvement
* Excluding non-recurring impairment 16
www.husqvarnagroup.com
17