Embed Size (px)
Citation preview
E-Mail [email protected]
Review
Brain Behav Evol 2015;86:145–163 DOI: 10.1159/000437413
Mammalian Brains Are Made of These: A Dataset of the Numbers and Densities of Neuronal and Nonneuronal Cells in the Brain of Glires, Primates, Scandentia, Eulipotyphlans, Afrotherians and Artiodactyls, and Their Relationship with Body Mass
Suzana Herculano-Houzel a, b Kenneth Catania c Paul R. Manger e Jon H. Kaas d
a Instituto de Ciências Biomédicas, Universidade Federal do Rio de Janeiro, and b Instituto Nacional de Neurociência Translacional, Rio de Janeiro , Brazil; Departments of c Biology and d Psychology, Vanderbilt University, Nashville, Tenn. , USA; e Department of Anatomical Sciences, University of the Witwatersrand, Johannesburg , South Africa
cerebral cortex or cerebellum, there is a single scaling rule that applies to average neuronal cell size, which increases with the linear dimension of the body, even though there is no single scaling rule that relates the number of neurons in the rest of brain to body mass. Thus, larger bodies do not uniformly come with more neurons – but they do fairly uni-formly come with larger neurons in the rest of brain, which contains a number of structures directly connected to sourc-es or targets in the body. © 2015 S. Karger AG, Basel
Introduction
The availability of datasets on mammalian brains that make comparative studies possible has been instrumental for the advancement of evolutionary neuroscience. Most notable have been the datasets on the volumes of brain structures in 51 species of bats, 48 primates and 28 ‘insec-tivores’ (currently recognized as a combination of afro-therians and eulipotyphlans) published by Heinz Ste-phan’s group [Stephan et al., 1981a, b], on cortical sur-
Key Words
Brain size · Evolution · Number of neurons · Number of glia ·Mammals
Abstract
Comparative studies amongst extant species are one of the pillars of evolutionary neurobiology. In the 20th century, most comparative studies remained restricted to analyses of brain structure volume and surface areas, besides estimates of neuronal density largely limited to the cerebral cortex. Over the last 10 years, we have amassed data on the num-bers of neurons and other cells that compose the entirety of the brain (subdivided into cerebral cortex, cerebellum, and rest of brain) of 39 mammalian species spread over 6 clades, as well as their densities. Here we provide that entire dataset in a format that is readily useful to researchers of any area of interest in the hope that it will foster the advancement of evolutionary and comparative studies well beyond the scope of neuroscience itself. We also reexamine the relation-ship between numbers of neurons, neuronal densities and body mass, and find that in the rest of brain, but not in the
Received: April 27, 2015 Returned for revision: June 1, 2015 Accepted after revision: July 3, 2015 Published online: September 30, 2015
Suzana Herculano-Houzel Instituto de Ciências Biomédicas, UFRJ Av. Carlos Chagas Filho 373 Ilha do Fundão, Rio de Janeiro, RJ 21941-902 (Brazil) E-Mail suzanahh @ gmail.com
© 2015 S. Karger AG, Basel0006–8977/15/0864–0145$39.50/0
www.karger.com/bbe
Dow
nloa
ded
by:
Uni
vers
ity o
f Pitt
sbur
gh
198.
143.
37.9
7 -
3/7/
2016
7:3
4:58
PM

Herculano-Houzel/Catania/Manger/Kaas
Brain Behav Evol 2015;86:145–163DOI: 10.1159/000437413
146
faces and volumes for 44 mammalian species compiled by Hofman [1985, 1988], and on neuronal and glial cell den-sities for 11 species studied initially by Tower and Elliott [1952] and Tower [1954], and later extended to another 42 species by Haug [1987].
Although restricted in their scope to mostly structure volumes and to cell densities in the cerebral cortex, those datasets were, for a few decades, the major references for studies on brain evolution that established the basic no-tions that there is both concerted [Finlay and Darlington, 1995] and mosaic [Barton and Harvey, 2000] scaling across brain structure volumes in evolution, that larger brains were composed of more and larger neurons, re-sulting in smaller neuronal densities and increasing glia/neuron ratios in a uniform manner across species [Tower and Elliot, 1952; Haug, 1987; Stolzenburg et al., 1989; Ma-rino, 2006], and that larger brains have relatively larger cerebral cortices but a cerebellum of constant relative size [Stephan et al., 1981a, b; Clark et al., 2001], with presum-ably larger relative numbers of neurons in the cerebral cortex over the rest of the brain.
Since 2005, with the development of the isotropic frac-tionator, a new, nonstereological method to determine the numbers of neuronal and nonneuronal cells that com-pose brain structures [Herculano-Houzel and Lent, 2005] that gives results comparable to those obtained with care-ful stereological analysis [Herculano-Houzel et al., 2015], we have been able to expand our understanding of brain evolution by examining the scaling relationships between the mass of brain structures and the number of cells that compose them. Through the analysis of 42 species of pri-mates (including the human) [Herculano-Houzel et al., 2007; Azevedo et al., 2009; Gabi et al., 2010; Ribeiro et al., 2014], glires [Herculano-Houzel et al., 2006, 2011; Ri-beiro et al., 2014], eulipotyphlans [Sarko et al., 2009], scandentians [Herculano-Houzel et al., 2007], afrotheri-ans [Herculano-Houzel et al., 2014a; Neves et al., 2014] and artiodactyls [Kazu et al., 2014], we have been able to challenge a number of the initial notions regarding mam-malian brain evolution. Specifically, we could show that while there is indeed a shared, single relationship between numbers of nonneuronal cells and the mass of brain structures across species, with relatively unchanging non-neuronal densities, neuronal densities do not vary uni-formly across all species and brain structures [reviewed in Herculano-Houzel, 2011a, 2014; Herculano-Houzel et al., 2014b], that glia/neuron ratios vary with average neu-ronal cell size, not brain structure mass, across different brain structures and mammalian species [Mota and Her-culano-Houzel, 2014], that the relationship between the
number of brain neurons and body mass differs across mammalian orders [Herculano-Houzel, 2011b; Hercula-no-Houzel et al., 2014b], and that relatively larger cere-bral cortices do not hold relatively more of all brain neu-rons [Herculano-Houzel, 2010; Herculano-Houzel et al., 2014b]. We could also show that the apparent uniform scaling of the energetic requirement of the brain with brain mass across species [Karbowski, 2007] is actually a spurious mathematical consequence of the apparent scal-ing of neuronal density across the brains included in that analysis, which conflated primates and nonprimates, then already known to have different relationships be-tween brain mass and neuronal density [Herculano-Hou-zel et al., 2006, 2007]. Rather, the energetic requirement of the brain scales linearly with the number of neurons in the brain, and uniformly across rodents and primates, de-spite the different neuronal scaling rules that apply to these orders [Herculano-Houzel, 2011c].
The analysis of our new dataset on numbers of neu-rons and nonneuronal cells that compose mammalian brains allowed us to propose a new synthesis of the mech-anisms of brain evolution [Herculano-Houzel et al., 2014b]. Briefly, we propose that the evolution of mam-malian brains of a wide range of masses has been the re-sult of both concerted and mosaic changes in the distri-bution of neurons across brain structures and in therelationship between number of neurons and average neuronal cell size (including the cell body and all arbors). In most mammalian groups, the addition of neurons to individual brain structures has been accompanied by pre-dictable increases in the average size of neurons in each structure (as inferred from changes in neuronal cell den-sities), which allowed us to infer the ancestral neuronal scaling rules for each structure. From those ancestral scal-ing rules, we inferred that the primate cerebral cortex and cerebellum, the eulipotyphlan cerebellum, and the artio-dactyl rest of brain (RoB) diverged with changes in the predicted mechanism that ties the number of neurons to the average size of the neurons generated. The distribu-tion of neurons to the cerebral cortex and cerebellum, two structures generated by different progenitor cell popula-tions, has varied little from what we infer to have been the ancestral mammalian rule of about 4 neurons in the cer-ebellum to every neuron in the cerebral cortex. At the same time, the allocation of neurons to the ensemble of these two structures has departed greatly from the in-ferred ancestral ratio of 2 neurons in the cerebral cortex (and 8 in the cerebellum) for every neuron in the RoB to much larger and variable ratios in primates and artiodac-tyls (while still maintaining the ratio between numbers of
Dow
nloa
ded
by:
Uni
vers
ity o
f Pitt
sbur
gh
198.
143.
37.9
7 -
3/7/
2016
7:3
4:58
PM

Cell Numbers in Mammalian Brains Brain Behav Evol 2015;86:145–163DOI: 10.1159/000437413
147
neurons in the cerebellum and cerebral cortex) [Hercula-no-Houzel et al., 2014b].
In the spirit of making this new body of data available for researchers with complementary interests and exper-tise to ours who will be able to advance the understanding of brain evolution in a much wider sense, here we provide the full dataset that we have generated on the mass and numbers of neuronal and nonneuronal cells that com-pose the brain as a whole and subdivided in its four major structures (cerebral cortex, cerebellum, olfactory bulb and RoB). All data have been thoroughly checked for con-sistency regarding the brain structures included, because of inconsistencies in a few of the original studies [Hercu-lano-Houzel et al., 2006; Sarko et al., 2009], guaranteeing that comparisons across species are valid (for example, that numbers for ‘cerebral cortex’ always include the hip-pocampus, and that numbers for ‘RoB’ and ‘whole brain’ always exclude the olfactory bulb). We also report new observations on the scaling of neuronal density with body mass that shed light on the different factors that may con-trol cell size across brain structures.
The Dataset
Our full dataset consists of 42 mammalian species across 5 orders (Glires, Primata, Scandentia, Eulipotyph-la and Artiodactyla) and the superorder Afrotheria. For two of these species (the orangutan and gorilla), data were available only for the cerebellum, and although these al-low the inference of numbers of neurons in the whole brain, and in the cerebral cortex in particular [Herculano-Houzel and Kaas, 2011], we have limited the data pre-sented here to the cerebellum alone. The phylogenetic re-lationships amongst the species, compiled according to Price et al. [2005], Purvis [1995], Blanga-Kanfi et al. [2009], Douady et al. [2002], Shinohara et al. [2003] and Murphy et al. [2001], are illustrated in figure 1 . A total of 86 brains (or hemispheres) were analyzed, and all data are provided in tables 1–6 . All data provided are averages ± standard deviation across individuals where more than one individual of each species was available, or data ob-tained for single individuals. All data are reported for the two sides of the brain together, even when the original data were collected from a single hemisphere, in which case results were multiplied by 2.
Values are reported here for the cerebral cortex (de-fined as all structures lateral to the olfactory tract), which includes the hippocampus and subcortical white matter, the cerebellum, which includes the cerebellar cortex, sub-
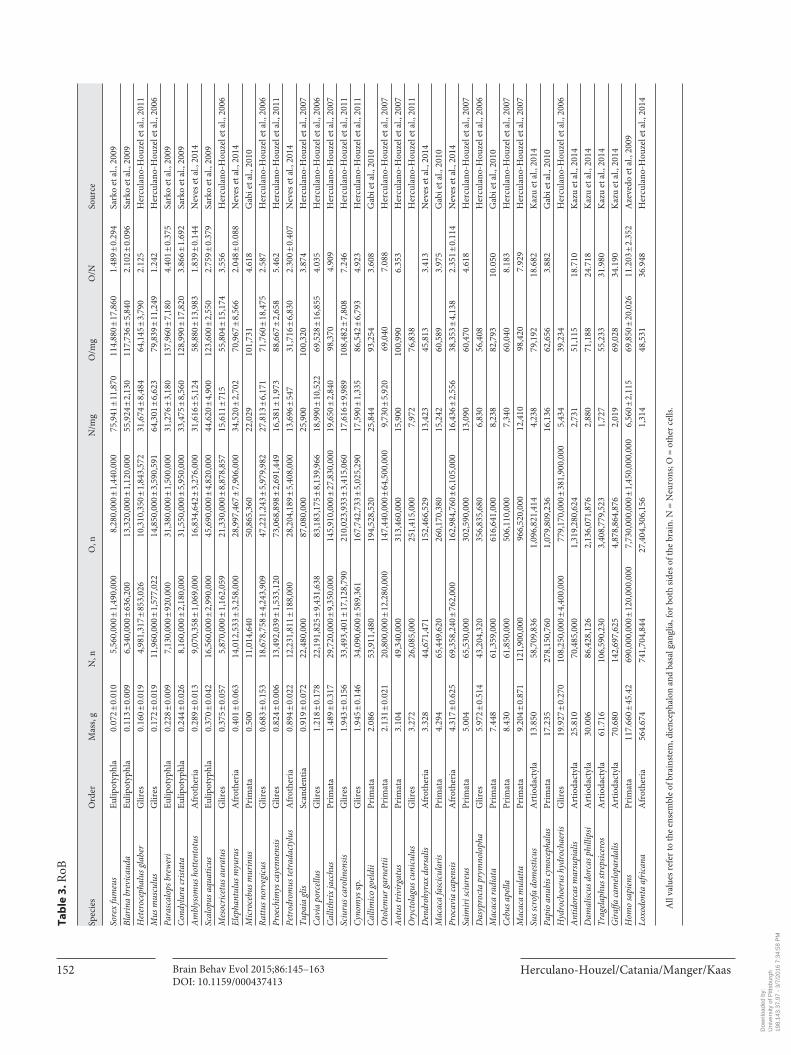
cortical white matter and deep cerebellar nuclei, olfactory bulbs, where available, and RoB. The RoB amounts to the ensemble of brainstem, diencephalon and striatum. Be-cause the olfactory bulbs are not always available for anal-ysis, we chose to report values for ‘whole brain’ as the sum of cerebral cortex, cerebellum and RoB, excluding the ol-factory bulbs.
All analyses were made across average values so as not to confound intraspecific and interspecific allometric re-lationships [Armstrong, 1990]. All analyses were per-formed with JMP 9.0 (SAS). Although we report the best currently known phylogenetic relationships across the species in the dataset ( fig. 1 ), we do not correct the re-ported allometric relationships for phylogenetic related-ness across the species included. As shown before, ac-counting for phylogenetic relatedness hardly changes the exponent of these strong allometric relationships [Gabi et al., 2010]. Most importantly, however, we wish to address directly the mathematical relationships across some of the most basic variables related to how mammalian brains are built, and we do not wish these to be affected by as-sumptions of phylogenetic relationships that have been known to change upon reexamination, such as those for ‘insectivores’ (now assigned to the distant clades Afro-theria and Eulipotyphla).
Brain Structures
The mass of all brain structures reported refers to paraformaldehyde (PFA)-fixed brains postfixed for at least 2 weeks. The brains of glires, primates, scandentians and eulipotyphlans were stored in 4% PFA until pro-cessed; the brains of all afrotherians and artiodactyls were stored in an antifreeze solution after fixation and cryo-protection in 30% sucrose [Herculano-Houzel, 2012]. While the mass may vary slightly from the fresh mass de-pending on the time of postfixation, shrinkage and other alterations in tissue mass due to the substitution of water with the glycerol-based antifreeze are minor concerns in studies of allometric relationships, where data typically span 3 or more orders of magnitude, although future us-ers of this dataset must keep in mind that they are likely sources of extraneous, nonbiological variation in tissue mass. Most importantly, however, any alterations in tis-sue mass or volume due to fixation or storage in antifreeze have no effect on the estimates of numbers of cells re-ported here, since they were obtained with the isotropic fractionator [Herculano-Houzel and Lent, 2005], a non-stereological method.
Dow
nloa
ded
by:
Uni
vers
ity o
f Pitt
sbur
gh
198.
143.
37.9
7 -
3/7/
2016
7:3
4:58
PM

Herculano-Houzel/Catania/Manger/Kaas
Brain Behav Evol 2015;86:145–163DOI: 10.1159/000437413
148
Fig. 1. Phylogenetic relationships between the 40 non-great ape species examined. Compiled according to Price et al. [2005], Purvis [1995], Blanga-Kanfi et al. [2009], Douady et al. [2002], Shinohara et al. [2003] and Murphy et al. [2001]. * = Divergence points to which the dates refer.
Colo
r ver
sion
ava
ilabl
e on
line
Dow
nloa
ded
by:
Uni
vers
ity o
f Pitt
sbur
gh
198.
143.
37.9
7 -
3/7/
2016
7:3
4:58
PM

Cell Numbers in Mammalian Brains Brain Behav Evol 2015;86:145–163DOI: 10.1159/000437413
149
Ta
ble
1. C
ereb
ral c
orte
x
Spec
ies
Ord
erM
ass,
gN
, nO
, nN
/mg
O/m
gO
/NSo
urce
Sore
x fu
meu
sEu
lipot
yphl
a0.
084 ±
0.00
99,
730,
000 ±
352,
000
9,29
0,00
0 ± 1,
112,
000
116,
727 ±
9,38
711
1,75
4 ± 18
,566
0.95
8 ± 0.
135
Sark
o et
al.,
200
9M
us m
uscu
lus
Glir
es0.
173 ±
0.01
513
,688
,162
± 2,
242,
257
12,0
61,8
38 ±
3,66
8,59
478
,672
± 7,
683
68,6
43 ±
15,8
070.
870 ±
0.17
7H
ercu
lano
-Hou
zel e
t al.,
200
6Bl
arin
a br
evic
auda
Eulip
otyp
hla
0.19
7 ± 0.
012
11,8
76,0
00 ±
1,56
9,00
015
,820
,000
± 1,
158,
000
60,2
14 ±
4,93
580
,729
± 8,
731
1.35
7 ± 0.
250
Sark
o et
al.,
200
9H
eter
ocep
halu
s gla
ber
Glir
es0.
184 ±
0.02
66,
151,
875 ±
1,06
5,58
78,
398,
125 ±
1,19
7,05
633
,374
± 2,
063
45,8
94 ±
11,4
971.
365 ±
0.12
5H
ercu
lano
-Hou
zel e
t al.,
201
1Co
ndyl
ura
crist
ata
Eulip
otyp
hla
0.42
0± 0
.024
17,2
50,0
00±
3,10
5,00
032
,010
,000
± 8,
822,
000
40,7
77 ±
5,14
576
,995
± 25
,019
1.96
6 ± 0.
924
Sark
o et
al.,
200
9Pa
rasc
alop
s bre
wer
iEu
lipot
yphl
a0.
429±
0.0
1915
,690
,000
± 2,
611,
000
39,8
70,0
00±
4,88
4,00
036
,727
± 7,
359
93,1
85 ±
14,5
832.
581 ±
0.10
9Sa
rko
et a
l., 2
009
Am
blys
omus
hot
tent
otus
Afr
othe
ria
0.43
9 ± 0.
035
21,5
16,0
00 ±
2,15
4,00
021
,370
,000
± 4,
614,
000
48,9
32 ±
1,00
448
,146
± 6,
674
0.98
2 ± 0.
116
Nev
es e
t al.,
201
4Sc
alop
us a
quat
icus
Eulip
otyp
hla
0.47
6± 0
.032
26,6
80,0
00±
5,11
3,00
038
,540
,000
± 5,
567,
000
60,4
61±
12,2
4980
,745
± 6,
407
1.38
3± 0
.368
Sark
o et
al.,
200
9El
epha
ntul
us m
yuru
sA
frot
heri
a0.
471 ±
0.02
125
,865
,000
± 4,
020,
000
26,2
29,0
00 ±
1,10
4,00
054
,644
± 6,
098
55,6
93 ±
138
1.03
2 ± 0.
119
Nev
es e
t al.,
201
4M
esoc
ricet
us a
urat
usG
lires
0.44
6 ± 0.
048
17,1
40,0
00 ±
3,61
9,93
441
,870
,000
± 1,
350,
121
39,0
99 ±
12,3
3294
,271
± 7,
136
2.50
7 ± 0.
608
Her
cula
no-H
ouze
l et a
l., 2
006
Rattu
s nor
vegi
cus
Glir
es0.
769 ±
0.11
331
,017
,192
+ 3
,034
,654
45,6
87,8
08 ±
5,67
8,95
841
,092
± 7,
999
60,4
26 ±
12,4
771.
497 ±
0.32
8H
ercu
lano
-Hou
zel e
t al.,
200
6M
icro
cebu
s mur
inus
Prim
ata
0.90
822
,310
,400
70,6
49,6
0024
,571
77,8
083.
167
Gab
i et a
l., 2
010
Proe
chim
ys ca
yenn
ensis
Glir
es0.
924 ±
0.05
026
,086
,024
± 2,
155,
723
71,8
33,0
39 ±
6,71
2,72
228
,321
± 3,
870
78,0
11 ±
11,4
972.
752 ±
0.03
0H
ercu
lano
-Hou
zel e
t al.,
201
1Pe
trod
rom
us te
trad
acty
lus
Afr
othe
ria
1.23
9 ± 0.
059
33,9
47,0
00 ±
5,84
0,00
040
,486
,000
± 1,
104,
000
27,2
36 ±
3,41
632
,550
± 2,
661
1.20
2 ± 0.
053
Nev
es e
t al.,
201
4Tu
paia
glis
Scan
dent
ia1.
455 ±
0.17
460
,390
,000
± 26
,510
,000
85,5
80,0
00 ±
8,40
0,00
042
,900
± 23
,350
58,9
00 ±
1,27
01.
417
Her
cula
no-H
ouze
l et a
l., 2
007
Cavi
a po
rcel
lus
Glir
es1.
938 ±
0.23
143
,510
,525
± 3,
169,
924
108,
614,
475 ±
12,7
75,3
3422
,508
± 1,
050
56,0
36 ±
932.
492 ±
0.11
2H
ercu
lano
-Hou
zel e
t al.,
200
6Cy
nom
ys sp
.G
lires
2.58
6 ± 0.
109
53,7
68,3
53 ±
6,04
4,32
218
3,45
1,64
7 ± 17
,959
,104
20,8
66 ±
3,11
371
,202
± 9,
677
3.43
2 ± 0.
433
Her
cula
no-H
ouze
l et a
l., 2
011
Sciu
rus c
arol
inen
sisG
lires
2.73
0 ± 0.
178
77,3
34,6
17 ±
2,63
4,44
420
9,65
4,71
7 ± 13
,003
,170
28,3
84 ±
1,48
776
,877
± 3,
859
2.70
9 ± 0.
076
Her
cula
no-H
ouze
l et a
l., 2
011
Ory
ctol
agus
cuni
culu
sG
lires
4.44
871
,448
,750
25
4,80
1,25
016
,063
57,2
843.
566
Her
cula
no-H
ouze
l et a
l., 2
011
Calli
thrix
jacc
hus
Prim
ata
5.56
1 ± 0.
443
244,
720,
000 ±
81,1
80,0
0039
5,34
0,00
0 ± 58
,790
,000
44,2
80 ±
15,9
0071
,800
± 14
,880
1.61
5H
ercu
lano
-Hou
zel e
t al.,
200
7O
tole
mur
gar
netti
iPr
imat
a6.
290 ±
0.86
322
6,09
0,00
0 ± 87
,570
,000
402,
070,
000 ±
74,7
90,0
0037
,820
± 20
,500
63,6
10 ±
3,40
01.
778
Her
cula
no-H
ouze
l et a
l., 2
007
Den
droh
yrax
dor
salis
Afr
othe
ria
7.56
98,9
60,0
0018
3,54
0,00
013
,098
24,2
911.
855
Nev
es e
t al.,
201
4D
asyp
roct
a pr
ymno
loph
aG
lires
8.91
3 ± 1.
214
110,
641,
950 ±
2,57
6,76
841
6,20
8,05
0 ± 95
0,42
213
,250
± 1,
633
49,9
39 ±
7,42
23.
763 ±
0.09
6H
ercu
lano
-Hou
zel e
t al.,
200
6Pr
ocav
ia ca
pens
isA
frot
heri
a10
.478
± 0.
646
197,
933,
000 ±
29,0
82,0
0036
6,62
0,00
0 ± 13
,520
,000
19,1
34 ±
3,95
535
,203
± 3,
461
1.88
3 ± 0.
208
Nev
es e
t al.,
201
4A
otus
triv
irgat
usPr
imat
a10
.617
± 0.
610
441,
900,
000 ±
111,
310,
000
695,
420,
000 ±
130,
000,
000
41,9
90 ±
12,9
0065
,330
± 5,
950
1.57
4H
ercu
lano
-Hou
zel e
t al.,
200
7Ca
llim
ico
goel
dii
Prim
ata
12.9
8435
7,12
9,18
071
5,33
0,82
027
,505
55,0
932.
003
Gab
i et a
l., 2
010
Saim
iri sc
iure
usPr
imat
a20
.652
± 0.
368
1,34
0,00
0,00
0 ± 20
,000
,000
1,61
0,00
0,00
0 ± 40
,000
,000
64,9
30 ±
7,42
077
,840
± 79
01.
201
Her
cula
no-H
ouze
l et a
l., 2
007
Mac
aca
fasc
icul
aris
Prim
ata
36.2
2680
0,95
5,00
02,
758,
845,
000
22,1
1076
,156
3.44
4G
abi e
t al.,
201
0Ce
bus a
pella
Prim
ata
39.1
781,
140,
000,
000
2,55
0,00
0,00
029
,180
64,9
802.
237
Her
cula
no-H
ouze
l et a
l., 2
007
Mac
aca
radi
ata
Prim
ata
48.2
741,
655,
707,
140
3,80
8,67
2,86
034
,298
78,8
972.
300
Gab
i et a
l., 2
010
Sus s
crof
a do
mes
ticus
Art
ioda
ctyl
a42
.404
307,
082,
404
3,25
0,25
1,35
47,
276
77,0
1610
.585
Kaz
u et
al.,
201
4H
ydro
choe
rus h
ydro
chae
risG
lires
48.1
75 ±
2.71
430
6,50
1,56
5 ± 62
,726
,120
1,84
7,81
8,43
5 ± 51
2,39
2,10
96,
336 ±
945
38,1
17 ±
8,48
95.
983 ±
0.44
7H
ercu
lano
-Hou
zel e
t al.,
200
6A
ntid
orca
s mar
supi
alis
Art
ioda
ctyl
a68
.806
396,
896,
159
4,12
6,25
9,27
55,
768
59,9
6910
.396
Kaz
u et
al.,
201
4M
acac
a m
ulat
taPr
imat
a69
.832
1,71
0,00
0,00
05,
270,
000,
000
24,4
7075
,400
3.08
2H
ercu
lano
-Hou
zel e
t al.,
200
7D
amal
iscus
dor
cas p
hilli
psi
Art
ioda
ctyl
a11
1.31
057
0,67
3,43
16,
762,
256,
227
5,12
760
,760
11.8
51K
azu
et a
l., 2
014
Papi
o an
ubis
cyno
ceph
alus
Prim
ata
120.
214
2,87
5,02
8,37
27,
569,
751,
628
23,9
1662
,969
2.63
3G
abi e
t al.,
201
0Tr
agel
aphu
s str
epsic
eros
Art
ioda
ctyl
a21
3.37
076
2,56
7,17
812
,302
,304
,448
3,57
457
,657
16.1
33K
azu
et a
l., 2
014
Gira
ffa ca
mel
opar
dalis
Art
ioda
ctyl
a39
8.80
81,
730,
513,
460
27,5
13,7
06,5
404,
339
68,9
9015
.900
Kaz
u et
al.,
201
4H
omo
sapi
ens
Prim
ata
1,23
2.93
± 23
3.68
16,3
40,0
00,0
00 ±
2,17
0,00
0,00
060
,840
,000
,000
± 7,
020,
000,
000
13,5
20 ±
3,63
649
,230
± 3,
755
3.72
3± 0
.675
Aze
vedo
et a
l., 2
009
Loxo
dont
a af
rican
aA
frot
heri
a2,
847.
594
5,59
3,24
1,03
355
,698
,998
,687
1,96
452
,721
26.8
44H
ercu
lano
-Hou
zel e
t al.,
201
4
All
valu
es re
fer t
o th
e su
m o
f gra
y m
atte
r, su
bcor
tical
whi
te m
atte
r, an
d hi
ppoc
ampu
s in
the
two
hem
isphe
res.
N =
Neu
rons
; O =
oth
er c
ells.
Dow
nloa
ded
by:
Uni
vers
ity o
f Pitt
sbur
gh
198.
143.
37.9
7 -
3/7/
2016
7:3
4:58
PM

Herculano-Houzel/Catania/Manger/Kaas
Brain Behav Evol 2015;86:145–163DOI: 10.1159/000437413
150
As mentioned above, most of the data were obtained from single hemispheres and multiplied by 2 to refer to the entire structures or brain. This allowed one brain hemisphere to be kept for histological analysis, while the other was used for the quantitative analysis discussed here. In all cases, dissections started with a mid-sagittal section through the whole brain. From the available hemisphere, the olfactory bulb was dissected by a trans-verse cut at the olfactory tract immediately proximal to the bulb, which left the olfactory tract included in the RoB. The cerebellum was dissected next by cutting the cerebellar peduncles at the surface of the brainstem. The cerebral cortex in all animals was defined as all cortical regions lateral to the olfactory tract, including the hippo-campus, amygdala and piriform cortex, and dissected from each hemisphere in small brains by peeling it away from the subcortical structures, as described earlier [Her-culano-Houzel et al., 2006], or from a complete series of coronal sections after removing the brainstem by a trans-verse cut along the plane anterior to the superior collicu-lus and posterior to the hypothalamus. In this manner, the cerebral cortex includes the underlying white matter. All other brain structures (the ensemble of brainstem,diencephalon and striatum) were pooled and processed together as RoB.
The Method
Some authors have expressed concerns about the iso-tropic fractionator, the method whereby the numbers of cells reported here were obtained [e.g. Carlo and Stevens, 2013; Charvet et al., 2015]. Concerns about the validity of estimates obtained with the isotropic fractionator in com-parison to stereology were dispelled when two groups es-tablished independently that the isotropic fractionator yields estimates of cell numbers that are comparable in value and variation to those obtained with stereology for matching [Miller et al., 2014] or neighboring [Bahney and von Bartheld, 2014] tissue. The data presented here can therefore be considered to be at least as reliable as data obtained with stereological methods. Most importantly, given the time and histological effort required for stereol-ogy, the determination of total numbers of neurons for structures that include widely different subregions such as those in the entire cerebral cortex, entire cerebellum or entire brainstem, would not have been possible without the isotropic fractionator [Herculano-Houzel et al., 2015].
It should be kept in mind that the numbers of neurons in the dataset correspond to the numbers of nuclei that
express the universal neuronal nuclear marker NeuN [Mullen et al., 1992]. NeuN is known not to be expressed in some particular neuronal cell types such as Purkinje cells, mitral cells of the olfactory bulb, inferior olivary and dentate nucleus neurons [Mullen et al., 1992], neurons in the substantia nigra pars reticulata of the gerbil [Kumar and Buckmaster, 2007], and possibly others as yet un-identified. While this of course impacts the total number of cells identified as neurons, and unduly inflates the pop-ulation identified as other cells (nonneurons), we expect this impact to be negligible, given that these specific neu-ronal subpopulations are very small compared to the structures that they integrate and which were analyzed here – the entire cerebral cortex, cerebellum or RoB.
It should also be kept in mind that, for most species, only one individual was available for study, and typically only one of the two brain halves was used for quantifica-tion with the isotropic fractionator. This means that this dataset does not address individual differences or scaling rules across individuals, which are known not to be an extension of allometric rules across species either in terms of brain × body mass [Armstrong, 1990] or in the rela-tionship between brain structure mass and number of neurons [Herculano-Houzel et al., 2015]. Importantly, since only averages or single individual values for a spe-cies are reported in the dataset, their use in comparative studies will not confound intraspecific and interspecific variation. Moreover, although intraspecific variation can be as large as 50% in brain structure mass or number of neurons in the mouse [Herculano-Houzel et al., 2015], in the scope of comparative studies, which typically span several orders of magnitude, such variation is usually in-significant.
Numbers of Cells
Although our dataset still excludes the very extremes of brain size in mammals, it ranges from very small shrews (Sorex fumeus , Blarina brevicauda) to the African elephant (Loxodonta africana) , spanning body masses from 8 to 5,000,000 g and brain masses from 0.2 to over 4,000 g. Total numbers of neurons span from 36 million to 257 billion (that is, 36 × 10 6 to 257 × 10 9 ), and total numbers of other (nonneuronal) cells range from 23 mil-lion to 216 billion ( table 5 ). Importantly, in all species, the majority of neurons (53–98%) are located in the cer-ebellum, leaving the cerebral cortex with typically 15–25% of all brain neurons, and the RoB with not more than 21% and often less than 10% of all brain neurons ( ta-
Dow
nloa
ded
by:
Uni
vers
ity o
f Pitt
sbur
gh
198.
143.
37.9
7 -
3/7/
2016
7:3
4:58
PM

Cell Numbers in Mammalian Brains Brain Behav Evol 2015;86:145–163DOI: 10.1159/000437413
151
Ta
ble
2. C
ereb
ellu
m
Spec
ies
Ord
erM
ass,
gN
, nO
, nN
/mg
O/m
gO
/NSo
urce
Sore
x fu
meu
sEu
lipot
yphl
a0.
020 ±
0.00
220
,870
,000
± 4,
660,
000
5,29
0,00
0 ± 2,
120,
000
1,03
8,66
6 ± 21
4,44
025
8,07
3 ± 85
,510
0.25
3Sa
rko
et a
l., 2
009
Blar
ina
brev
icau
daEu
lipot
yphl
a0.
037 ±
0.00
533
,430
,000
± 5,
821,
000
4,41
0,00
0 ± 1,
280,
000
919,
942 ±
19,7
2111
8,73
6 ± 25
,620
0.13
2Sa
rko
et a
l., 2
009
Het
eroc
epha
lus g
labe
rG
lires
0.04
8 ± 0.
004
15,7
42,2
70 ±
2,84
9,25
45,
482,
730 ±
1,27
4,35
232
7,28
0 ± 48
,331
115,
748 ±
32,9
520.
356 ±
0.10
6H
ercu
lano
-Hou
zel e
t al.,
201
1M
us m
uscu
lus
Glir
es0.
056 ±
0.00
542
,219
,708
± 9,
277,
647
6,94
7,79
1 ± 1,
502,
773
746,
691 ±
128,
541
123,
493 ±
25,7
150.
165 ±
0.01
7H
ercu
lano
-Hou
zel e
t al.,
200
6A
mbl
ysom
us h
otte
ntot
usA
frot
heri
a0.
084
34,4
88,3
79 ±
3,20
7,00
08,
155,
621 ±
813,
000
409,
687 ±
18,6
6796
,849
± 5,
069
0.23
6 ± 0.
002
Nev
es e
t al.,
201
4Pa
rasc
alop
s bre
wer
iEu
lipot
yphl
a0.
102 ±
0.00
510
0,78
0,00
0 ± 13
,850
,000
7,01
0,00
0 ± 1,
100,
000
997,
370 ±
173,
030
68,7
95 ±
7,91
00.
070
Sark
o et
al.,
200
9Co
ndyl
ura
crist
ata
Eulip
otyp
hla
0.13
8 ± 0.
012
105,
920,
000 ±
22,1
00,0
0019
,480
,000
± 6,
420,
000
776,
460 ±
181,
530
139,
912 ±
39,7
200.
184
Sark
o et
al.,
200
9M
esoc
ricet
us a
urat
usG
lires
0.14
5 ± 0.
030
61,2
10,0
00 ±
12,3
51,2
467,
430,
000 ±
1,71
3,10
842
4,00
2 ± 3,
743
51,3
32 ±
1,05
40.
121 ±
0.00
4H
ercu
lano
-Hou
zel e
t al.,
200
6Sc
alop
us a
quat
icus
Eulip
otyp
hla
0.15
3 ± 0.
008
158,
550,
000 ±
13,6
30,0
0017
,510
,000
± 3,
160,
000
1,03
7,39
0 ± 63
,570
114,
660 ±
20,7
900.
110
Sark
o et
al.,
200
9El
epha
ntul
us m
yuru
sA
frot
heri
a0.
168
89,3
12,3
72 ±
2,85
2,00
023
,368
,628
± 1,
279,
000
531,
494 ±
10,6
5113
9,02
8 ± 5,
956
0.26
1 ± 0.
005
Nev
es e
t al.,
201
4Ra
ttus n
orve
gicu
sG
lires
0.27
2 ± 0.
038
139,
171,
882 ±
11,1
85,6
7529
,005
,617
± 6,
282,
204
522,
688 ±
108,
847
108,
555 ±
29,3
550.
209 ±
0.04
7H
ercu
lano
-Hou
zel e
t al.,
200
6Pe
trod
rom
us te
trad
acty
lus
Afr
othe
ria
0.30
411
0,65
3,15
0 ±1
4,94
8,00
034
,657
,851
± 15
,801
,000
362,
537 ±
15,7
8011
0,15
3 ± 41
,831
0.29
9 ± 0.
102
Nev
es e
t al.,
201
4Tu
paia
glis
Scan
dent
ia0.
326 ±
0.01
818
5,28
0,00
0 ± 16
,980
,000
19,9
80,0
00 ±
1,51
0,00
057
1,46
0 ± 83
,200
61,6
00 ±
7,99
00.
108
Her
cula
no-H
ouze
l et a
l., 2
007
Proe
chim
ys ca
yenn
ensis
Glir
es0.
330 ±
0.02
616
2,51
2,05
0 ± 3,
553,
848
36,3
72,9
50 ±
5,09
4,06
849
4,33
8 ± 28
,466
110,
122 ±
6,71
60.
224 ±
0.02
6H
ercu
lano
-Hou
zel e
t al.,
201
1M
icro
cebu
s mur
inus
Prim
ata
0.39
122
1,38
6,14
017
,433
,860
566,
205
44,5
880.
079
Gab
i et a
l., 2
010
Cavi
a po
rcell
usG
lires
0.50
0 ± 0.
077
167,
854,
925 ±
2,17
5,97
336
,290
,075
± 4,
506,
186
339,
755 ±
48,0
6972
,824
± 2,
216
0.21
6 ± 0.
024
Her
cula
no-H
ouze
l et a
l., 2
006
Calli
thrix
jacc
hus
Prim
ata
0.73
0 ± 0.
039
361,
370,
000 ±
28,5
30,0
0049
,490
,000
± 6,
770,
000
494,
970 ±
25,7
4068
,170
± 12
,210
0.13
7H
ercu
lano
-Hou
zel e
t al.,
200
7Cy
nom
ys sp
.G
lires
0.78
9 ± 0.
093
350,
084,
813 ±
72,1
77,8
5166
,155
,187
± 39
,268
,821
440,
658 ±
39,5
5484
,802
± 54
,286
0.19
2 ± 0.
123
Her
cula
no-H
ouze
l et a
l., 2
011
Sciu
rus c
arol
inen
sisG
lires
0.87
4 ± 0.
069
342,
832,
180 ±
71,1
81,7
9811
0,79
7,82
0 ± 9,
070,
639
392,
363 ±
74,2
9412
7,68
2 ± 19
,212
0.33
6 ± 0.
090
Her
cula
no-H
ouze
l et a
l., 2
011
Oto
lemur
gar
netti
iPr
imat
a1.
196 ±
0.10
574
3,50
0,00
0 ± 52
,450
,000
65,9
60,0
00 ±
20,2
90,0
0062
3,08
0 ± 45
,720
54,4
60 ±
11,8
900.
089
Her
cula
no-H
ouze
l et a
l., 2
007
Ory
ctol
agus
cuni
culu
sG
lires
1.41
239
6,67
1,25
012
4,57
8,75
028
0,92
988
,229
1.22
2H
ercu
lano
-Hou
zel e
t al.,
201
1A
otus
triv
irgat
usPr
imat
a1.
732 ±
0.21
81,
040,
000,
000 ±
20,0
00,0
0014
5,27
0,00
0 ± 45
,030
,000
605,
080 ±
90,5
7082
,890
± 15
,580
0.14
0H
ercu
lano
-Hou
zel e
t al.,
200
7D
endr
ohyr
ax d
orsa
lisA
frot
heri
a1.
918
360,
929,
350
77,5
70,6
5018
8,18
040
,444
0.21
5N
eves
et a
l., 2
014
Proc
avia
cape
nsis
Afr
othe
ria
2.05
848
8,37
3,00
0 ± 42
,322
,000
91,0
05,0
00 ±
30,1
80,0
0024
2,41
5 ± 46
,950
46,3
65 ±
19,7
110.
182 ±
0.04
6N
eves
et a
l., 2
014
Das
ypro
cta
prym
nolo
pha
Glir
es2.
742
673,
488,
085 ±
48,1
45,9
6015
5,98
6,91
5 ± 32
,978
,520
253,
208 ±
39,4
4757
,945
± 7,
405
0.23
4 ± 0.
066
Her
cula
no-H
ouze
l et a
l., 2
006
Saim
iri sc
iure
usPr
imat
a4.
300
1,82
0,00
0,00
013
3,02
0,00
042
4,00
030
,940
0.07
3H
ercu
lano
-Hou
zel e
t al.,
200
7Ce
bus a
pella
Prim
ata
4.6
2,49
0,00
0,00
024
5,81
0,00
054
0,31
053
,440
0.09
9H
ercu
lano
-Hou
zel e
t al.,
200
7M
acac
a fa
scic
ular
isPr
imat
a5.
642
2,57
2,60
0,00
013
5,40
0,00
045
5,97
323
,999
0.05
3G
abi e
t al.,
201
0M
acac
a ra
diat
aPr
imat
a5.
748
2,03
8,55
4,16
045
3,56
5,84
035
4,65
578
,908
0.22
2G
abi e
t al.,
201
0H
ydro
choe
rus h
ydro
chae
risG
lires
6.63
2 ± 1.
312
1,15
7,81
0,00
0 ± 5,
515,
433
570,
940,
000 ±
81,1
05,1
4817
7,98
2 ± 34
,889
86,5
74 ±
4,90
20.
493 ±
0.06
8H
ercu
lano
-Hou
zel e
t al.,
200
6M
acac
a m
ulat
taPr
imat
a7.
694
4,55
0,00
0,00
093
1,03
0,00
059
0,80
012
1,01
00.
205
Her
cula
no-H
ouze
l et a
l., 2
007
Sus s
crof
a do
mes
ticus
Art
ioda
ctyl
a8.
128
1,85
8,32
0,31
334
8,71
0,93
822
8,63
242
,902
0.18
8K
azu
et a
l., 2
014
Ant
idor
cas m
arsu
pial
isA
rtio
dact
yla
11.4
582,
257,
214,
074
467,
244,
676
196,
999
40,7
790.
207
Kaz
u et
al.,
201
4D
amal
iscus
dor
cas p
hilli
psi
Art
ioda
ctyl
a13
.402
2,40
1,71
2,67
044
3,91
8,45
617
9,20
633
,123
0.18
4K
azu
et a
l., 2
014
Papi
o an
ubis
cyno
ceph
alus
Prim
ata
13.7
457,
794,
907,
300
525,
977,
700
567,
109
38,2
670.
067
Gab
i et a
l., 2
010
Trag
elaph
us st
reps
icer
osA
rtio
dact
yla
31.7
764,
042,
494,
141
1,26
6,09
9,60
912
7,21
839
,845
0.31
3K
azu
et a
l., 2
014
Pong
o py
gmae
usPr
imat
a35
.06 ±
4.34
26,3
00,0
00,0
00 ±
2,47
0,00
0,00
02,
200,
000,
000
750,
143
62,7
500.
084
Her
cula
no-H
ouze
l and
Kaa
s, 20
11G
orill
a go
rilla
Prim
ata
37.5
626
,400
,000
,000
2,90
0,00
0,00
070
2,87
577
,210
0.11
0H
ercu
lano
-Hou
zel a
nd K
aas,
2011
Gira
ffa ca
melo
pard
alis
Art
ioda
ctyl
a67
.73
8,87
8,07
6,56
35,
520,
360,
938
131,
080
81,5
050.
622
Kaz
u et
al.,
201
4H
omo
sapi
ens
Prim
ata
154.
02 ±
19.2
969
,030
,000
,000
± 6,
650,
000,
000
16,0
40,0
00,0
00 ±
2,17
0,00
047
1,66
0 ± 90
,393
101,
020 ±
19,8
000.
232 ±
0.01
9A
zeve
do e
t al.,
200
9Lo
xodo
nta
afric
ana
Afr
othe
ria
1,17
1.62
825
0,70
8,52
7,53
638
,507
,229
,964
213,
983
32,8
660.
154
Her
cula
no-H
ouze
l et a
l., 2
014
All
num
bers
refe
r to
the
who
le c
ereb
ellu
m (b
oth
brai
n ha
lves
), in
clud
ing
the
deep
nuc
lei.
The
cere
bellu
m o
f Cal
limic
o go
eldii
was
not
ava
ilabl
e fo
r ana
lysis
. N =
Neu
rons
; O =
oth
er c
ells.
Dow
nloa
ded
by:
Uni
vers
ity o
f Pitt
sbur
gh
198.
143.
37.9
7 -
3/7/
2016
7:3
4:58
PM
Herculano-Houzel/Catania/Manger/Kaas
Brain Behav Evol 2015;86:145–163DOI: 10.1159/000437413
152
Ta
ble
3. R
oB
Spec
ies
Ord
erM
ass,
gN
, nO
, nN
/mg
O/m
gO
/NSo
urce
Sore
x fu
meu
sEu
lipot
yphl
a0.
072 ±
0.01
05,
560,
000 ±
1,49
0,00
08,
280,
000 ±
1,44
0,00
075
,941
± 11
,870
114,
880 ±
17,8
601.
489 ±
0.29
4Sa
rko
et a
l., 2
009
Blar
ina
brev
icau
daEu
lipot
yphl
a0.
113 ±
0.00
96,
340,
000 ±
636,
200
13,3
20,0
00 ±
1,12
0,00
055
,924
± 2,
130
117,
736 ±
5,84
02.
102 ±
0.09
6Sa
rko
et a
l., 2
009
Het
eroc
epha
lus g
labe
rG
lires
0.16
0 ± 0.
019
4,98
1,31
7 ± 85
3,02
610
,310
,350
± 1,
843,
572
31,6
74 ±
8,48
464
,145
± 3,
790
2.12
5H
ercu
lano
-Hou
zel e
t al.,
201
1M
us m
uscu
lus
Glir
es0.
172 ±
0.01
911
,960
,000
± 1,
577,
022
14,8
50,0
00 ±
3,59
0,59
164
,301
± 6,
623
79,8
39 ±
11,2
491.
242
Her
cula
no-H
ouze
l et a
l., 2
006
Para
scal
ops b
rew
eri
Eulip
otyp
hla
0.22
8 ± 0.
009
7,13
0,00
0 ± 92
0,00
031
,380
,000
± 1,
500,
000
31,2
76 ±
3,18
013
7,96
0 ± 7,
180
4.40
1 ± 0.
375
Sark
o et
al.,
200
9Co
ndyl
ura
crist
ata
Eulip
otyp
hla
0.24
4 ± 0.
026
8,16
0,00
0 ± 2,
180,
000
31,5
50,0
00 ±
5,95
0,00
033
,475
± 8,
560
128,
990 ±
17,8
203.
866 ±
1.69
2Sa
rko
et a
l., 2
009
Am
blys
omus
hot
tent
otus
Afr
othe
ria
0.28
9 ± 0.
013
9,07
0,35
8 ± 1,
069,
000
16,8
34,6
42 ±
3,27
6,00
031
,616
± 5,
124
58,8
80 ±
13,9
831.
839 ±
0.14
4N
eves
et a
l., 2
014
Scal
opus
aqu
atic
usEu
lipot
yphl
a0.
370 ±
0.04
216
,560
,000
± 2,
990,
000
45,6
90,0
00 ±
4,82
0,00
044
,620
± 4,
900
123,
600 ±
2,55
02.
759 ±
0.37
9Sa
rko
et a
l., 2
009
Mes
ocric
etus
aur
atus
Glir
es0.
375 ±
0.05
75,
870,
000 ±
1,16
2,05
921
,330
,000
± 8,
878,
857
15,6
11 ±
715
55,8
04 ±
15,1
743.
556
Her
cula
no-H
ouze
l et a
l., 2
006
Elep
hant
ulus
myu
rus
Afr
othe
ria
0.40
1 ± 0.
063
14,0
12,5
33 ±
3,25
8,00
028
,997
,467
± 7,
906,
000
34,5
20 ±
2,70
270
,967
± 8,
566
2.04
8 ± 0.
088
Nev
es e
t al.,
201
4M
icro
cebu
s mur
inus
Prim
ata
0.50
011
,014
,640
50,8
65,3
6022
,029
101,
731
4.61
8G
abi e
t al.,
201
0Ra
ttus n
orve
gicu
sG
lires
0.68
3 ± 0.
153
18,6
78,7
58 ±
4,24
3,90
947
,221
,243
± 5,
979,
982
27,8
13 ±
6,17
171
,760
± 18
,475
2.58
7H
ercu
lano
-Hou
zel e
t al.,
200
6Pr
oech
imys
caye
nnen
sisG
lires
0.82
4 ± 0.
006
13,4
92,0
39 ±
1,53
3,12
073
,068
,898
± 2,
691,
449
16,3
81 ±
1,97
388
,667
± 2,
658
5.46
2H
ercu
lano
-Hou
zel e
t al.,
201
1Pe
trod
rom
us te
trad
acty
lus
Afr
othe
ria
0.89
4 ± 0.
022
12,2
31,8
11 ±
188,
000
28,2
04,1
89 ±
5,40
8,00
013
,696
± 54
731
,716
± 6,
830
2.30
0 ± 0.
407
Nev
es e
t al.,
201
4Tu
paia
glis
Scan
dent
ia0.
919 ±
0.07
222
,480
,000
87,0
80,0
0025
,900
100,
320
3.87
4H
ercu
lano
-Hou
zel e
t al.,
200
7Ca
via
porc
ellus
Glir
es1.
218 ±
0.17
822
,191
,825
± 9,
431,
638
83,1
83,1
75 ±
8,13
9,96
618
,990
± 10
,522
69,5
28 ±
16,8
554.
035
Her
cula
no-H
ouze
l et a
l., 2
006
Calli
thrix
jacc
hus
Prim
ata
1.48
9 ± 0.
317
29,7
20,0
00 ±
9,35
0,00
014
5,91
0,00
0 ± 27
,830
,000
19,6
50 ±
2,84
098
,370
4.90
9H
ercu
lano
-Hou
zel e
t al.,
200
7Sc
iuru
s car
olin
ensis
Glir
es1.
943 ±
0.15
633
,493
,401
± 17
,128
,790
210,
023,
933 ±
3,41
5,06
017
,616
± 9,
989
108,
482 ±
7,80
87.
246
Her
cula
no-H
ouze
l et a
l., 2
011
Cyno
mys
sp.
Glir
es1.
945 ±
0.14
634
,090
,600
± 58
9,36
116
7,74
2,73
3 ± 5,
025,
290
17,5
90 ±
1,33
586
,542
± 6,
793
4.92
3H
ercu
lano
-Hou
zel e
t al.,
201
1Ca
llim
ico
goeld
iiPr
imat
a2.
086
53,9
11,4
8019
4,52
8,52
025
,844
93,2
543.
608
Gab
i et a
l., 2
010
Oto
lemur
gar
netti
iPr
imat
a2.
131 ±
0.02
120
,800
,000
± 12
,280
,000
147,
440,
000 ±
64,5
00,0
009,
730 ±
5,92
069
,040
7.08
8H
ercu
lano
-Hou
zel e
t al.,
200
7A
otus
triv
irgat
usPr
imat
a3.
104
49,3
40,0
0031
3,46
0,00
015
,900
100,
990
6.35
3H
ercu
lano
-Hou
zel e
t al.,
200
7O
ryct
olag
us cu
nicu
lus
Glir
es3.
272
26,0
85,0
0025
1,41
5,00
07,
972
76,8
38H
ercu
lano
-Hou
zel e
t al.,
201
1D
endr
ohyr
ax d
orsa
lisA
frot
heri
a3.
328
44,6
71,4
7115
2,46
6,52
913
,423
45,8
133.
413
Nev
es e
t al.,
201
4M
acac
a fa
scic
ular
isPr
imat
a4.
294
65,4
49,6
2026
0,17
0,38
015
,242
60,5
893.
975
Gab
i et a
l., 2
010
Proc
avia
cape
nsis
Afr
othe
ria
4.31
7 ± 0.
625
69,3
58,2
40 ±
762,
000
162,
984,
760 ±
6,10
5,00
016
,436
± 2,
556
38,3
53 ±
4,13
82.
351 ±
0.11
4N
eves
et a
l., 2
014
Saim
iri sc
iure
usPr
imat
a5.
004
65,5
30,0
0030
2,59
0,00
013
,090
60,4
704.
618
Her
cula
no-H
ouze
l et a
l., 2
007
Das
ypro
cta
prym
nolo
pha
Glir
es5.
972 ±
0.51
443
,204
,320
356,
835,
680
6,83
056
,408
Her
cula
no-H
ouze
l et a
l., 2
006
Mac
aca
radi
ata
Prim
ata
7.44
861
,359
,000
616,
641,
000
8,23
882
,793
10.0
50G
abi e
t al.,
201
0Ce
bus a
pella
Prim
ata
8.43
061
,850
,000
506,
110,
000
7,34
060
,040
8.18
3H
ercu
lano
-Hou
zel e
t al.,
200
7M
acac
a m
ulat
taPr
imat
a9.
204 ±
0.87
112
1,90
0,00
096
6,52
0,00
012
,410
98,4
207.
929
Her
cula
no-H
ouze
l et a
l., 2
007
Sus s
crof
a do
mes
ticus
Art
ioda
ctyl
a13
.850
58,7
09,8
361,
096,
821,
414
4,23
879
,192
18.6
82K
azu
et a
l., 2
014
Papi
o an
ubis
cyno
ceph
alus
Prim
ata
17.2
3527
8,15
0,76
01,
079,
809,
236
16,1
3662
,656
3.88
2G
abi e
t al.,
201
0H
ydro
choe
rus h
ydro
chae
risG
lires
19.9
27 ±
0.27
010
8,25
0,00
0 ± 4,
400,
000
779,
170,
000 ±
381,
900,
000
5,43
439
,234
Her
cula
no-H
ouze
l et a
l., 2
006
Ant
idor
cas m
arsu
pial
isA
rtio
dact
yla
25.8
1070
,485
,000
1,31
9,28
0,62
42,
731
51,1
1518
.710
Kaz
u et
al.,
201
4D
amal
iscus
dor
cas p
hilli
psi
Art
ioda
ctyl
a30
.006
86,4
28,1
262,
136,
071,
876
2,88
071
,188
24.7
18K
azu
et a
l., 2
014
Trag
elaph
us st
reps
icer
osA
rtio
dact
yla
61.7
1610
6,59
0,23
03,
408,
779,
523
1,72
755
,233
31.9
80K
azu
et a
l., 2
014
Gira
ffa ca
melo
pard
alis
Art
ioda
ctyl
a70
.680
142,
697,
625
4,87
8,86
4,87
62,
019
69,0
2834
.190
Kaz
u et
al.,
201
4H
omo
sapi
ens
Prim
ata
117.
660 ±
45.4
269
0,00
0,00
0 ± 12
0,00
0,00
07,
730,
000,
000 ±
1,45
0,00
0,00
06,
560 ±
2,11
569
,850
± 20
,026
11.2
03 ±
2.35
2A
zeve
do e
t al.,
200
9Lo
xodo
nta
afric
ana
Afr
othe
ria
564.
674
741,
704,
844
27,4
04,3
06,1
561,
314
48,5
3136
.948
Her
cula
no-H
ouze
l et a
l., 2
014
All
valu
es re
fer t
o th
e en
sem
ble
of b
rain
stem
, die
ncep
halo
n an
d ba
sal g
angl
ia, f
or b
oth
sides
of t
he b
rain
. N =
Neu
rons
; O =
oth
er c
ells.
Dow
nloa
ded
by:
Uni
vers
ity o
f Pitt
sbur
gh
198.
143.
37.9
7 -
3/7/
2016
7:3
4:58
PM

Cell Numbers in Mammalian Brains Brain Behav Evol 2015;86:145–163DOI: 10.1159/000437413
153
Ta
ble
4. O
lfact
ory
bulb
Spec
ies
Ord
ern
Mas
s, g
N, n
O, n
N/m
gO
/mg
O/N
Sour
ce
Calli
thrix
jacc
hus
Prim
ata
50.
008 ±
0.01
42,
108,
078 ±
983,
420
2,54
7,92
2 ± 96
0,10
423
2,30
9 ± 13
7,60
526
9,38
3 ± 10
5,56
31.
209
Ribe
iro
et a
l., 2
014
Sore
x fu
meu
sEu
lipot
yphl
a3
0.01
2 ± 0.
002
3,33
0,00
0 ± 1,
050,
000
2,76
0,00
0 ± 13
0,00
028
9,80
6 ± 12
4,35
023
5,24
9 ± 44
,620
0.82
9 ± 21
4Sa
rko
et a
l., 2
009
Mus
mus
culu
sG
lires
40.
014 ±
0.00
43,
893,
300 ±
1,24
6,39
65,
456,
700 ±
1,15
4,50
225
7,47
5 ± 34
,036
371,
204 ±
75,5
731.
454 ±
0.26
0H
ercu
lano
-Hou
zel e
t al.,
200
6H
eter
ocep
halu
s gla
ber
Glir
es3
0.02
1 ± 0.
001
2,30
3,03
0 ± 63
6,09
93,
571,
970 ±
1,54
8,86
110
8,89
5 ± 22
,957
167,
991 ±
62,4
421.
516 ±
0.25
4H
ercu
lano
-Hou
zel e
t al.,
201
1Bl
arin
a br
evic
auda
Eulip
otyp
hla
50.
026 ±
0.00
38,
090,
000 ±
935,
900
4,91
0,00
0 ± 73
0,00
031
8,16
4 ± 34
,950
193,
631 ±
31,4
500.
607 ±
0.12
5Sa
rko
et a
l., 2
009
Mic
roce
bus m
urin
usPr
imat
a2
0.03
0 ± 0.
008
7,63
6,91
2 ± 11
9,08
89,
723,
088 ±
842,
576
270,
894 ±
61,9
4634
1,90
0 ± 54
,311
1.27
3Ri
beir
o et
al.,
201
4Co
ndyl
ura
crist
ata
Eulip
otyp
hla
40.
040 ±
0.00
510
,550
,000
± 4,
290,
000
7,47
0,00
0 ± 97
0,00
025
4,72
0 ± 74
,620
185,
124 ±
19,3
700.
708 ±
0.32
8Sa
rko
et a
l., 2
009
Para
scal
ops b
rew
eri
Eulip
otyp
hla
30.
049 ±
0.00
816
,750
,000
± 6,
370,
000
10,9
10,0
00 ±
3,40
0,00
033
3,59
0 ± 81
,590
217,
440 ±
41,3
700.
651 ±
0.16
8Sa
rko
et a
l., 2
009
Elep
hant
ulus
myu
rus
Afr
othe
ria
20.
050 ±
0.01
09,
693,
534 ±
1,74
5,00
04,
919,
466
194,
678 ±
5,70
897
,872
0.50
7N
eves
et a
l., 2
014
Aot
us tr
ivirg
atus
Prim
ata
60.
050 ±
0.01
27,
925,
468 ±
3,11
4,92
48,
360,
532 ±
3,21
3,10
615
5,87
9 ± 62
,241
162,
922 ±
44,2
091.
055
Ribe
iro
et a
l., 2
014
Mes
ocric
etus
aur
atus
Glir
es2
0.05
5 ± 0.
011
5,74
7,93
0 ± 34
7,20
35,
507,
170 ±
2,27
7,60
510
5,41
8 ± 27
,498
96,1
97 ±
21,2
370.
972 ±
0.45
5H
ercu
lano
-Hou
zel e
t al.,
200
6Ra
ttus n
orve
gicu
sG
lires
50.
074 ±
0.02
211
,103
,272
± 3,
202,
766
9,23
8,72
8 ± 2,
250,
728
152,
373 ±
26,9
1312
6,21
0 ± 8,
033
0.84
8 ± 0.
145
Her
cula
no-H
ouze
l et a
l., 2
006
Scal
opus
aqu
atic
usEu
lipot
yphl
a3
0.08
2 ± 0.
005
34,6
10,0
00 ±
5,96
0,00
017
,780
,000
± 2,
060,
000
423,
520 ±
94,9
5021
5,23
0 ± 14
,600
0.51
4 ± 0.
154
Sark
o et
al.,
200
9M
acac
a m
ulat
taPr
imat
a1
0.08
88,
473,
800
11,0
06,2
0096
,293
125,
070
1.29
9Ri
beir
o et
al.,
201
4Tu
paia
glis
Scan
dent
ia16
0.10
0 ± 0.
032
12,7
00,0
00 ±
3,58
4,95
220
,068
,000
± 6,
541,
838
130,
173 ±
17,4
5120
5,87
6 ± 51
,596
1.58
0H
ercu
lano
-Hou
zel e
t al.,
200
7Ca
via
porc
ellus
Glir
es2
0.10
3 ± 0.
013
6,06
5,70
0 ± 1,
295,
335
10,1
54,3
00 ±
4,22
0,09
858
,560
± 5,
340
96,7
93 ±
29,0
111.
637 ±
0.34
6H
ercu
lano
-Hou
zel e
t al.,
200
6Pr
oech
imys
caye
nnen
sisG
lires
10.
132
9,14
1,54
021
,128
,460
69,2
5416
0,06
42.
311
Her
cula
no-H
ouze
l et a
l., 2
011
Ory
ctol
agus
cuni
culu
sG
lires
10.
156
18,7
65,0
0022
,935
,000
120,
288
147,
019
1.22
2H
ercu
lano
-Hou
zel e
t al.,
201
1Pe
trod
rom
us te
trad
acty
lus
Afr
othe
ria
20.
159 ±
0.00
912
,828
,365
± 38
0,00
014
,775
,635
80,8
05 ±
3,08
491
,369
1.14
1N
eves
et a
l., 2
014
Oto
lemur
gar
netti
iPr
imat
a11
0.20
0 ± 0.
016
30,2
37,0
60 ±
9,64
5,48
034
,244
,000
± 7,
155,
556
149,
219 ±
47,5
9017
0,50
5 ± 39
,463
1.13
3Ri
beir
o et
al.,
201
4Sc
iuru
s car
olin
ensis
Glir
es9
0.21
2 ± 0.
022
28,8
45,7
24 ±
7,90
3,41
239
,015
,942
± 12
,812
,316
137,
532 ±
38,2
3618
5,35
9 ± 58
,050
1.47
8 ± 0.
776
Her
cula
no-H
ouze
l et a
l., 2
011
Proc
avia
cape
nsis
Afr
othe
ria
10.
286
20,9
09,4
9014
,790
,510
73,1
1051
,715
0.70
7N
eves
et a
l., 2
014
Das
ypro
cta
prym
nolo
pha
Glir
es3
0.73
7 ± 0.
162
58,1
24,0
85 ±
4,95
2,79
572
,595
,915
± 19
,682
,805
88,0
08 ±
14,9
7310
7,30
1 ± 1,
958
1.23
9 ± 0.
233
Her
cula
no-H
ouze
l et a
l., 2
006
Sus s
crof
a do
mes
ticus
Art
ioda
ctyl
a1
0.82
29,
195,
500
77,5
54,5
0011
,187
94,3
488.
434
Kaz
u et
al.,
201
4A
ntid
orca
s mar
supi
alis
Art
ioda
ctyl
a1
1.20
015
,998
,400
105,
201,
600
13,3
3287
,668
6.57
6K
azu
et a
l., 2
014
Hyd
roch
oeru
s hyd
roch
aeris
Glir
es2
1.30
2 ± 0.
031
28,5
60,3
10 ±
8,51
5,58
867
,389
,690
± 21
,015
,416
21,8
64 ±
6,01
851
,544
± 17
,981
2.33
3 ± 0.
180
Her
cula
no-H
ouze
l et a
l., 2
006
Gira
ffa ca
melo
pard
alis
Art
ioda
ctyl
a1
2.05
224
,678
,000
232,
384,
500
12,0
2611
3,24
89.
417
Kaz
u et
al.,
201
4Tr
agela
phus
stre
psic
eros
A
rtio
dact
yla
15.
546
38,3
31,5
6236
2,73
1,43
86,
912
58,9
138.
523
Kaz
u et
al.,
201
4Lo
xodo
nta
afric
ana
Afr
othe
ria
141
.886
908,
371,
986
2,85
7,87
8,01
421
,687
68,2
303.
146
Her
cula
no-H
ouze
l et a
l., 2
014
All
valu
es re
fer t
o bo
th o
lfact
ory
bulb
s. N
= N
euro
ns; O
= o
ther
cel
ls.
Dow
nloa
ded
by:
Uni
vers
ity o
f Pitt
sbur
gh
198.
143.
37.9
7 -
3/7/
2016
7:3
4:58
PM
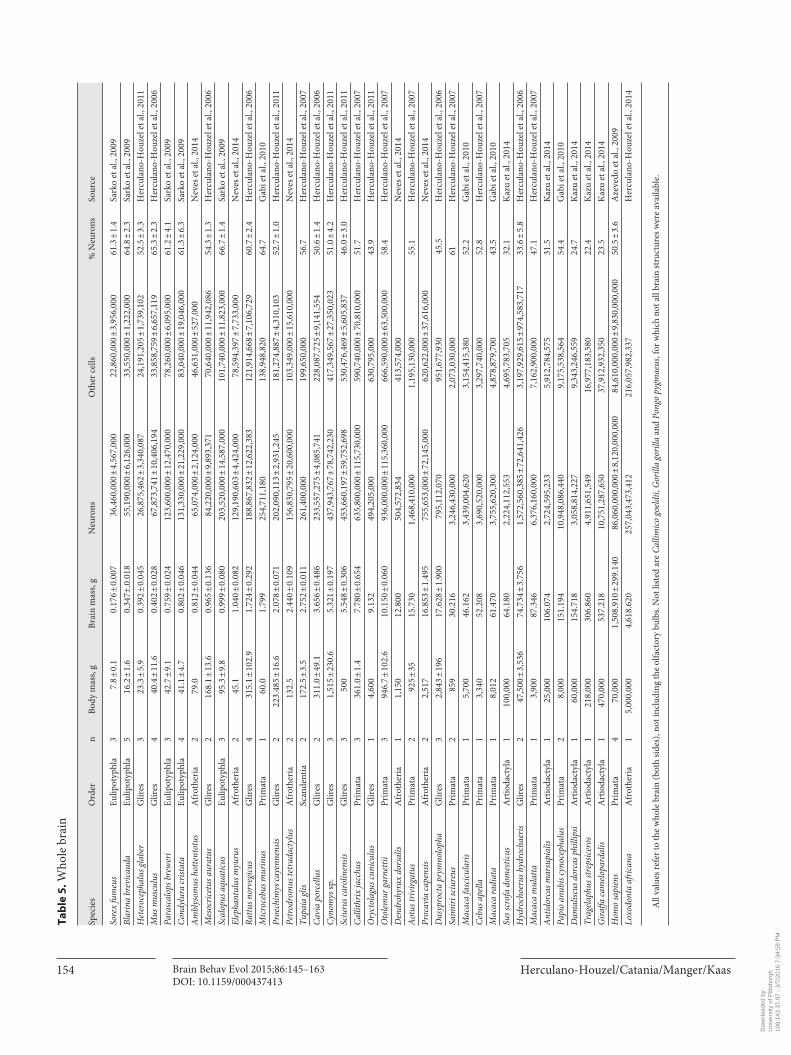
Herculano-Houzel/Catania/Manger/Kaas
Brain Behav Evol 2015;86:145–163DOI: 10.1159/000437413
154
Ta
ble
5. W
hole
bra
in
Spec
ies
Ord
ern
Body
mas
s, g
Brai
n m
ass,
gN
euro
nsO
ther
cel
ls%
Neu
rons
Sour
ce
Sore
x fu
meu
sEu
lipot
yphl
a3
7.8 ±
0.1
0.17
6 ± 0.
007
36,4
60,0
00 ±
4,56
7,00
022
,860
,000
± 3,
956,
000
61.3
± 1.
4Sa
rko
et a
l., 2
009
Blar
ina
brev
icau
daEu
lipot
yphl
a5
16.2
± 1.
60.
347±
.0.0
1855
,190
,000
± 6,
126,
000
33,5
50,0
00 ±
1,22
2,00
064
.8 ±
2.3
Sark
o et
al.,
200
9H
eter
ocep
halu
s gla
ber
Glir
es3
23.3
± 5.
90.
392 ±
0.04
526
,875
,462
± 3,
340,
087
24,1
91,2
05 ±
1,73
9,10
252
.5 ±
3.3
Her
cula
no-H
ouze
l et a
l., 2
011
Mus
mus
culu
sG
lires
440
.4 ±
11.6
0.40
2 ± 0.
028
67,8
73,7
41 ±
10,4
06,1
9433
,858
,759
± 6,
657,
119
65.3
± 2.
3H
ercu
lano
-Hou
zel e
t al.,
200
6Pa
rasc
alop
s bre
wer
iEu
lipot
yphl
a3
42.7
± 9.
10.
759 ±
0.02
412
3,60
0,00
0 ± 12
,470
,000
78,2
60,0
00 ±
6,09
5,00
061
.2 ±
4.1
Sark
o et
al.,
200
9Co
ndyl
ura
crist
ata
Eulip
otyp
hla
441
.1 ±
4.7
0.80
2 ± 0.
046
131,
330,
000 ±
21,2
29,0
0083
,040
,000
± 19
,046
,000
61.3
± 6.
3Sa
rko
et a
l., 2
009
Am
blys
omus
hot
tent
otus
Afr
othe
ria
279
.00.
812 ±
0.04
465
,074
,000
± 2,
124,
000
46,6
31,0
00 ±
527,
000
Nev
es e
t al.,
201
4M
esoc
ricet
us a
urat
usG
lires
216
8.1 ±
13.6
0.96
5 ± 0.
136
84,2
20,0
00 ±
9,89
3,37
170
,640
,000
± 11
,942
,086
54.3
± 1.
3H
ercu
lano
-Hou
zel e
t al.,
200
6Sc
alop
us a
quat
icus
Eulip
otyp
hla
395
.3 ±
9.8
0.99
9 ± 0.
080
203,
520,
000 ±
14,5
87,0
0010
1,74
0,00
0 ± 11
,823
,000
66.7
± 1.
4Sa
rko
et a
l., 2
009
Elep
hant
ulus
myu
rus
Afr
othe
ria
245
.11.
040 ±
0.08
212
9,19
0,60
3 ± 4,
424,
000
78,5
94,3
97 ±
7,73
3,00
0N
eves
et a
l., 2
014
Rattu
s nor
vegi
cus
Glir
es4
315.
1 ± 10
2.9
1.72
4 ± 0.
292
188,
867,
832 ±
12,6
22,3
8312
1,91
4,66
8 ± 7,
106,
729
60.7
± 2.
4H
ercu
lano
-Hou
zel e
t al.,
200
6M
icro
cebu
s mur
inus
Prim
ata
160
.01.
799
254,
711,
180
138,
948,
820
64.7
Gab
i et a
l., 2
010
Proe
chim
ys ca
yenn
ensis
Glir
es2
223.
485 ±
16.6
2.07
8 ± 0.
071
202,
090,
113 ±
2,93
1,24
518
1,27
4,88
7 ± 4,
310,
103
52.7
± 1.
0H
ercu
lano
-Hou
zel e
t al.,
201
1Pe
trod
rom
us te
trad
acty
lus
Afr
othe
ria
213
2.5
2.44
0 ± 0.
109
156,
830,
795 ±
20,6
00,0
0010
3,34
9,00
0 ± 15
,610
,000
Nev
es e
t al.,
201
4Tu
paia
glis
Scan
dent
ia2
172.
5 ± 3.
52.
752 ±
0.01
126
1,40
0,00
019
9,65
0,00
056
.7H
ercu
lano
-Hou
zel e
t al.,
200
7Ca
via
porc
ellus
Glir
es2
311.
0 ± 49
.13.
656 ±
0.48
623
3,55
7,27
5 ± 4,
085,
741
228,
087,
725 ±
9,14
1,55
450
.6 ±
1.4
Her
cula
no-H
ouze
l et a
l., 2
006
Cyno
mys
sp.
Glir
es3
1,51
5 ± 23
0.6
5.32
1 ± 0.
197
437,
943,
767 ±
78,7
42,2
3041
7,34
9,56
7 ± 27
,350
,023
51.0
± 4.
2H
ercu
lano
-Hou
zel e
t al.,
201
1Sc
iuru
s car
olin
ensis
Glir
es3
500
5.54
8 ± 0.
306
453,
660,
197 ±
59,7
52,6
9853
0,47
6,46
9 ± 5,
605,
837
46.0
± 3.
0H
ercu
lano
-Hou
zel e
t al.,
201
1Ca
llith
rix ja
cchu
sPr
imat
a3
361.
0 ± 1.
47.
780 ±
0.65
463
5,80
0,00
0 ± 11
5,73
0,00
059
0,74
0,00
0 ± 70
,810
,000
51.7
Her
cula
no-H
ouze
l et a
l., 2
007
Ory
ctol
agus
cuni
culu
sG
lires
14,
600
9.13
249
4,20
5,00
063
0,79
5,00
043
.9H
ercu
lano
-Hou
zel e
t al.,
201
1O
tolem
ur g
arne
ttii
Prim
ata
394
6.7 ±
102.
610
.150
± 0.
060
936,
000,
000 ±
115,
360,
000
666,
590,
000 ±
63,5
00,0
0058
.4H
ercu
lano
-Hou
zel e
t al.,
200
7D
endr
ohyr
ax d
orsa
lisA
frot
heri
a1
1,15
012
.800
504,
572,
834
413,
574,
000
Nev
es e
t al.,
201
4A
otus
triv
irgat
usPr
imat
a2
925 ±
3515
.730
1,46
8,41
0,00
01,
195,
130,
000
55.1
Her
cula
no-H
ouze
l et a
l., 2
007
Proc
avia
cape
nsis
Afr
othe
ria
22,
517
16.8
53 ±
1.49
575
5,65
3,00
0 ± 72
,145
,000
620,
622,
000 ±
37,6
16,0
00N
eves
et a
l., 2
014
Das
ypro
cta
prym
nolo
pha
Glir
es3
2,84
3 ± 19
617
.628
± 1.
900
795,
112,
070
951,
677,
930
45.5
Her
cula
no-H
ouze
l et a
l., 2
006
Saim
iri sc
iure
usPr
imat
a2
859
30.2
163,
246,
430,
000
2,07
3,03
0,00
061
Her
cula
no-H
ouze
l et a
l., 2
007
Mac
aca
fasc
icul
aris
Prim
ata
15,
700
46.1
623,
439,
004,
620
3,15
4,41
5,38
052
.2G
abi e
t al.,
201
0Ce
bus a
pella
Prim
ata
13,
340
52.2
083,
690,
520,
000
3,29
7,74
0,00
052
.8H
ercu
lano
-Hou
zel e
t al.,
200
7M
acac
a ra
diat
aPr
imat
a1
8,01
261
.470
3,75
5,62
0,30
04,
878,
879,
700
43.5
Gab
i et a
l., 2
010
Sus s
crof
a do
mes
ticus
Art
ioda
ctyl
a1
100,
000
64.1
802,
224,
112,
553
4,69
5,78
3,70
532
.1K
azu
et a
l., 2
014
Hyd
roch
oeru
s hyd
roch
aeris
Glir
es2
47,5
00 ±
3,53
674
.734
± 3.
756
1,57
2,56
0,38
5 ± 72
,641
,426
3,19
7,92
9,61
5 ± 97
4,58
3,71
733
.6 ±
5.8
Her
cula
no-H
ouze
l et a
l., 2
006
Mac
aca
mul
atta
Prim
ata
13,
900
87.3
466,
376,
160,
000
7,16
2,90
0,00
047
.1H
ercu
lano
-Hou
zel e
t al.,
200
7A
ntid
orca
s mar
supi
alis
Art
ioda
ctyl
a1
25,0
0010
6.07
42,
724,
595,
233
5,91
2,78
4,57
531
.5K
azu
et a
l., 2
014
Papi
o an
ubis
cyno
ceph
alus
Prim
ata
28,
000
151.
194
10,9
48,0
86,4
409,
175,
538,
564
54.4
Gab
i et a
l., 2
010
Dam
alisc
us d
orca
s phi
llips
iA
rtio
dact
yla
160
,000
154.
718
3,05
8,81
4,22
79,
343,
246,
559
24.7
Kaz
u et
al.,
201
4Tr
agela
phus
stre
psic
eros
Art
ioda
ctyl
a1
218,
000
306.
860
4,91
1,65
1,54
916
,977
,183
,580
22.4
Kaz
u et
al.,
201
4G
iraffa
cam
elopa
rdal
isA
rtio
dact
yla
147
0,00
053
7.21
810
,751
,287
,650
37,9
12,9
32,3
5023
.5K
azu
et a
l., 2
014
Hom
o sa
pien
sPr
imat
a4
70,0
001,
508.
910 ±
299.
140
86,0
60,0
00,0
00 ±
8,12
0,00
0,00
084
,610
,000
,000
± 9,
830,
000,
000
50.5
± 3.
6A
zeve
do e
t al.,
200
9Lo
xodo
nta
afric
ana
Afr
othe
ria
15,
000,
000
4,61
8.62
025
7,04
3,47
3,41
221
6,05
7,98
2,33
7H
ercu
lano
-Hou
zel e
t al.,
201
4
All
valu
es re
fer t
o th
e w
hole
bra
in (b
oth
sides
), no
t inc
ludi
ng th
e ol
fact
ory
bulb
s. N
ot li
sted
are
Cal
limic
o go
eldii,
Gor
illa
goril
la a
nd P
ongo
pyg
mae
us, f
or w
hich
not
all
brai
n st
ruct
ures
wer
e av
aila
ble.
Dow
nloa
ded
by:
Uni
vers
ity o
f Pitt
sbur
gh
198.
143.
37.9
7 -
3/7/
2016
7:3
4:58
PM
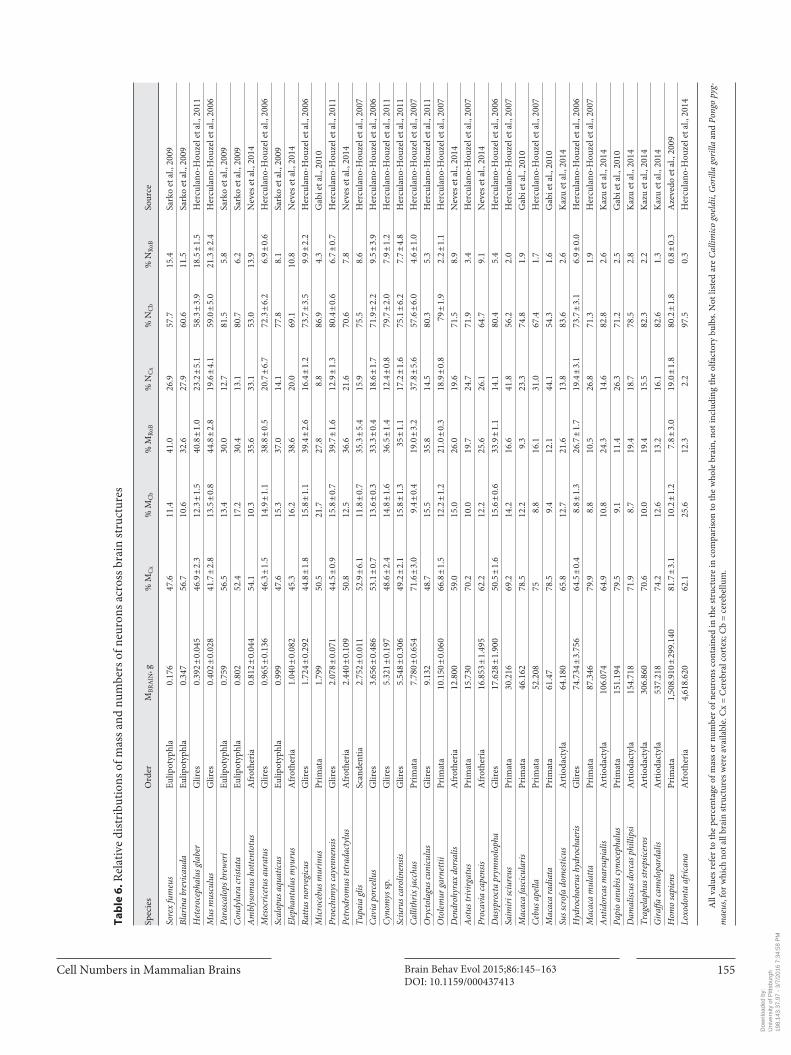
Cell Numbers in Mammalian Brains Brain Behav Evol 2015;86:145–163DOI: 10.1159/000437413
155
Ta
ble
6. R
elat
ive
dist
ribu
tions
of m
ass a
nd n
umbe
rs o
f neu
rons
acr
oss b
rain
stru
ctur
es
Spec
ies
Ord
erM
BRA
IN, g
% M
Cx
% M
Cb
% M
RoB
% N
Cx
% N
Cb
% N
RoB
Sour
ce
Sore
x fu
meu
sEu
lipot
yphl
a0.
176
47.6
11.4
41.0
26.9
57.7
15.4
Sark
o et
al.,
200
9Bl
arin
a br
evic
auda
Eulip
otyp
hla
0.34
756
.710
.632
.627
.960
.611
.5Sa
rko
et a
l., 2
009
Het
eroc
epha
lus g
labe
rG
lires
0.39
2 ± 0.
045
46.9
± 2.
312
.3 ±
1.5
40.8
± 1.
023
.2 ±
5.1
58.3
± 3.
918
.5 ±
1.5
Her
cula
no-H
ouze
l et a
l., 2
011
Mus
mus
culu
sG
lires
0.40
2 ± 0.
028
41.7
± 2.
813
.5 ±
0.8
44.8
± 2.
819
.6 ±
4.1
59.0
± 5.
021
.3 ±
2.4
Her
cula
no-H
ouze
l et a
l., 2
006
Para
scal
ops b
rew
eri
Eulip
otyp
hla
0.75
956
.513
.430
.012
.781
.55.
8Sa
rko
et a
l., 2
009
Cond
ylur
a cr
istat
aEu
lipot
yphl
a0.
802
52.4
17.2
30.4
13.1
80.7
6.2
Sark
o et
al.,
200
9A
mbl
ysom
us h
otte
ntot
usA
frot
heri
a0.
812 ±
0.04
454
.110
.335
.633
.153
.013
.9N
eves
et a
l., 2
014
Mes
ocric
etus
aur
atus
Glir
es0.
965 ±
0.13
646
.3 ±
1.5
14.9
± 1.
138
.8 ±
0.5
20.7
± 6.
772
.3 ±
6.2
6.9 ±
0.6
Her
cula
no-H
ouze
l et a
l., 2
006
Scal
opus
aqu
atic
usEu
lipot
yphl
a0.
999
47.6
15.3
37.0
14.1
77.8
8.1
Sark
o et
al.,
200
9El
epha
ntul
us m
yuru
sA
frot
heri
a1.
040 ±
0.08
245
.316
.238
.620
.069
.110
.8N
eves
et a
l., 2
014
Rattu
s nor
vegi
cus
Glir
es1.
724 ±
0.29
244
.8 ±
1.8
15.8
± 1.
139
.4 ±
2.6
16.4
± 1.
273
.7 ±
3.5
9.9 ±
2.2
Her
cula
no-H
ouze
l et a
l., 2
006
Mic
roce
bus m
urin
usPr
imat
a1.
799
50.5
21.7
27.8
8.8
86.9
4.3
Gab
i et a
l., 2
010
Proe
chim
ys ca
yenn
ensis
Glir
es2.
078 ±
0.07
144
.5 ±
0.9
15.8
± 0.
739
.7 ±
1.6
12.9
± 1.
380
.4 ±
0.6
6.7 ±
0.7
Her
cula
no-H
ouze
l et a
l., 2
011
Petr
odro
mus
tetr
adac
tylu
sA
frot
heri
a2.
440 ±
0.10
950
.812
.536
.621
.670
.67.
8N
eves
et a
l., 2
014
Tupa
ia g
lisSc
ande
ntia
2.75
2 ± 0.
011
52.9
± 6.
111
.8 ±
0.7
35.3
± 5.
415
.975
.58.
6H
ercu
lano
-Hou
zel e
t al.,
200
7Ca
via
porc
ellus
Glir
es3.
656 ±
0.48
653
.1 ±
0.7
13.6
± 0.
333
.3 ±
0.4
18.6
± 1.
771
.9 ±
2.2
9.5 ±
3.9
Her
cula
no-H
ouze
l et a
l., 2
006
Cyno
mys
sp.
Glir
es5.
321 ±
0.19
748
.6 ±
2.4
14.8
± 1.
636
.5 ±
1.4
12.4
± 0.
879
.7 ±
2.0
7.9 ±
1.2
Her
cula
no-H
ouze
l et a
l., 2
011
Sciu
rus c
arol
inen
sisG
lires
5.54
8 ± 0.
306
49.2
± 2.
115
.8 ±
1.3
35 ±
1.1
17.2
± 1.
675
.1 ±
6.2
7.7 ±
4.8
Her
cula
no-H
ouze
l et a
l., 2
011
Calli
thrix
jacc
hus
Prim
ata
7.78
0 ± 0.
654
71.6
± 3.
09.
4 ± 0.
419
.0 ±
3.2
37.8
± 5.
657
.6 ±
6.0
4.6 ±
1.0
Her
cula
no-H
ouze
l et a
l., 2
007
Ory
ctol
agus
cuni
culu
sG
lires
9.13
248
.715
.535
.814
.580
.35.
3H
ercu
lano
-Hou
zel e
t al.,
201
1O
tolem
ur g
arne
ttii
Prim
ata
10.1
50 ±
0.06
066
.8 ±
1.5
12.2
± 1.
221
.0 ±
0.3
18.9
± 0.
879
± 1.
92.
2 ± 1.
1H
ercu
lano
-Hou
zel e
t al.,
200
7D
endr
ohyr
ax d
orsa
lisA
frot
heri
a12
.800
59.0
15.0
26.0
19.6
71.5
8.9
Nev
es e
t al.,
201
4A
otus
triv
irgat
usPr
imat
a15
.730
70.2
10.0
19.7
24.7
71.9
3.4
Her
cula
no-H
ouze
l et a
l., 2
007
Proc
avia
cape
nsis
Afr
othe
ria
16.8
53 ±
1.49
562
.212
.225
.626
.164
.79.
1N
eves
et a
l., 2
014
Das
ypro
cta
prym
nolo
pha
Glir
es17
.628
± 1.
900
50.5
± 1.
615
.6 ±
0.6
33.9
± 1.
114
.180
.45.
4H
ercu
lano
-Hou
zel e
t al.,
200
6Sa
imiri
sciu
reus
Prim
ata
30.2
1669
.214
.216
.641
.856
.22.
0H
ercu
lano
-Hou
zel e
t al.,
200
7M
acac
a fa
scic
ular
isPr
imat
a46
.162
78.5
12.2
9.3
23.3
74.8
1.9
Gab
i et a
l., 2
010
Cebu
s ape
llaPr
imat
a52
.208
758.
816
.131
.067
.41.
7H
ercu
lano
-Hou
zel e
t al.,
200
7M
acac
a ra
diat
aPr
imat
a61
.47
78.5
9.4
12.1
44.1
54.3
1.6
Gab
i et a
l., 2
010
Sus s
crof
a do
mes
ticus
Art
ioda
ctyl
a64
.180
65.8
12.7
21.6
13.8
83.6
2.6
Kaz
u et
al.,
201
4H
ydro
choe
rus h
ydro
chae
risG
lires
74.7
34 ±
3.75
664
.5 ±
0.4
8.8 ±
1.3
26.7
± 1.
719
.4 ±
3.1
73.7
± 3.
16.
9 ± 0.
0H
ercu
lano
-Hou
zel e
t al.,
200
6M
acac
a m
ulat
taPr
imat
a87
.346
79.9
8.8
10.5
26.8
71.3
1.9
Her
cula
no-H
ouze
l et a
l., 2
007
Ant
idor
cas m
arsu
pial
isA
rtio
dact
yla
106.
074
64.9
10.8
24.3
14.6
82.8
2.6
Kaz
u et
al.,
201
4Pa
pio
anub
is cy
noce
phal
usPr
imat
a15
1.19
479
.59.
111
.426
.371
.22.
5G
abi e
t al.,
201
0D
amal
iscus
dor
cas p
hilli
psi
Art
ioda
ctyl
a15
4.71
871
.98.
719
.418
.778
.52.
8K
azu
et a
l., 2
014
Trag
elaph
us st
reps
icer
osA
rtio
dact
yla
306.
860
70.6
10.0
19.4
15.5
82.3
2.2
Kaz
u et
al.,
201
4G
iraffa
cam
elopa
rdal
isA
rtio
dact
yla
537.
218
74.2
12.6
13.2
16.1
82.6
1.3
Kaz
u et
al.,
201
4H
omo
sapi
ens
Prim
ata
1,50
8.91
0 ± 29
9.14
081
.7 ±
3.1
10.2
± 1.
27.
8 ± 3.
019
.0 ±
1.8
80.2
± 1.
80.
8 ± 0.
3A
zeve
do e
t al.,
200
9Lo
xodo
nta
afric
ana
Afr
othe
ria
4,61
8.62
062
.125
.612
.32.
297
.50.
3H
ercu
lano
-Hou
zel e
t al.,
201
4
All
valu
es re
fer t
o th
e pe
rcen
tage
of m
ass o
r num
ber o
f neu
rons
con
tain
ed in
the
stru
ctur
e in
com
pari
son
to th
e w
hole
bra
in, n
ot in
clud
ing
the
olfa
ctor
y bu
lbs.
Not
list
ed a
re C
allim
ico
goeld
ii, G
orill
a go
rilla
and
Pon
go p
yg-
mae
us, f
or w
hich
not
all
brai
n st
ruct
ures
wer
e av
aila
ble.
Cx
= C
ereb
ral c
orte
x; C
b =
cere
bellu
m.
Dow
nloa
ded
by:
Uni
vers
ity o
f Pitt
sbur
gh
198.
143.
37.9
7 -
3/7/
2016
7:3
4:58
PM

Herculano-Houzel/Catania/Manger/Kaas
Brain Behav Evol 2015;86:145–163DOI: 10.1159/000437413
156
ble 6 ). This translates into a smaller range of 6–742 mil-lion neurons in the RoB ( table 3 ), in contrast to 6 million to 16 billion neurons in the cerebral cortex ( table 1 ), and 16 million to as many as 251 billion neurons in the cer-ebellum ( table 2 ). In comparison to the cerebral cortex and cerebellum, the number of neurons in the RoB is thus remarkably small: no species has over 1 billion neu-rons in the RoB, even in the primate and artiodactyl brains with several billion neurons in the cerebral cortex and cerebellum.
Outliers
As described previously [Azevedo et al., 2009; Hercu-lano-Houzel, 2009, 2012], the availability of data on the cellular composition of the cerebral cortex of humans and various other primates allowed us to establish that the hu-man cerebral cortex is not an outlier in its cellular com-position, when compared to other primate brains. The human cerebral cortex, in particular, is not an outlier in the number of neurons for its mass. As shown in figure 2 ,
a b
c d
Fig. 2. The human cerebral cortex is not an outlier in its neuronal scaling rule. All graphs show how the mass of the cerebral cortex varies with the number of neurons in the structure for the same data points for the non-great-ape primate species in the dataset. Power functions plotted differ across graphs, as indicated: includ-ing the mouse lemur (ml) and human (h) data points (the best fit, with exponent 1.087 ± 0.073, r 2 = 0.956, p < 0.0001; a ), excluding
the mouse lemur and human data points (the worst fit, with expo-nent 1.105 ± 0.127, r 2 = 0.904, p < 0.0001; b ), including the mouse lemur but excluding human (exponent 0.989 ± 0.080, r 2 = 0.944,p < 0.0001; c ), and including human but excluding mouse lemur (exponent 1.210 ± 0.088, r 2 = 0.944, p < 0.0001; d ). sqm = Squirrel monkey.
Colo
r ver
sion
ava
ilabl
e on
line
Dow
nloa
ded
by:
Uni
vers
ity o
f Pitt
sbur
gh
198.
143.
37.9
7 -
3/7/
2016
7:3
4:58
PM

Cell Numbers in Mammalian Brains Brain Behav Evol 2015;86:145–163DOI: 10.1159/000437413
157
when either all species (including the human and mouse lemur; fig. 2 a) or only the center species in the distribu-tion (excluding the two extremes, human and mouse le-mur; fig. 2 b) are used to calculate the relationship be-tween cortical mass (including white matter) and number of cortical neurons, the human data point is well within the 95% confidence interval. The human cerebral cortex is only outside the confidence interval when the mouse lemur is included in the comparison ( fig. 2 c), but in turn the mouse lemur is the outlier in the relationship that ex-cludes it but includes the human cerebral cortex ( fig. 2 d). The discordance reflects the influence of extreme data points in the calculation of fitted functions, but impor-tantly neither mouse lemur nor human are outliers in comparison to the relationships that either include or ex-clude both. Instead, it is another species – of the genus Saimiri – that systematically sits outside the confidence intervals because of its atypically high neuronal density and absolute number of neurons in the cerebral cortex. Still, because of its relatively central position in the distri-bution of primate species, the inclusion or exclusion of Saimiri does not markedly affect the scaling rules that ap-ply to primates. It is those species that have either very small or very large brains that possibly have a much larg-er impact on scaling relationships.
One such clear outlier in the allometric scaling rules that we have described previously is the naked mole-rat, which has only about half the number of neurons expect-ed in a rodent cerebral cortex and cerebellum of its size, possibly due to regressive events such as reduced eyes, lateral geniculate nucleus and visual cortex [Catania and Remple, 2002, Xiao et al., 2006] caused by its strictly fos-sorial lifestyle [Jarvis and Sherman, 2002]. As shown in figure 3 , calculating the neuronal scaling rules that apply to the rodent cortex with the exclusion of the two smallest species, mouse and naked mole-rat, places the latter, but not the former, outside the 95% confidence interval
( fig. 3 a), and adding the mouse to the scaling relationship changes it little, while still excluding the naked mole-rat ( fig. 3 b). The naked mole-rat should therefore be includ-ed with caution in comparative studies of rodents.
b
a
c
Fig. 3. Naked mole-rat (nmr) and elephant are outlier species. a The power law that relates the mass of the cerebral cortex to its number of neurons calculated across glires species without the na-ked mole-rat and the mouse (exponent, 1.519 ± 0.112, r 2 = 0.953, p < 0.0001) still includes the mouse (m) data point in its 95% con-fidence interval, but excludes the naked mole-rat. b A better fit to the same data points is found when the mouse is included in the analysis (exponent, 1.699 ± 0.096, r 2 = 0.975, p < 0.0001), and still excludes the naked mole-rat. c The elephant is a clear outlier to the relationship that describes the variation of the number of cerebel-lar neurons as a power law of the number of neurons in the cerebral cortex across all species, with exponent 1.007 ± 0.054 (r 2 = 0.905, p < 0.0001), which is a linear relationship.
Colo
r ver
sion
ava
ilabl
e on
line
Dow
nloa
ded
by:
Uni
vers
ity o
f Pitt
sbur
gh
198.
143.
37.9
7 -
3/7/
2016
7:3
4:58
PM

Herculano-Houzel/Catania/Manger/Kaas
Brain Behav Evol 2015;86:145–163DOI: 10.1159/000437413
158
Another outlier in our dataset is the giraffe, probably because the individual in our dataset was still a juvenile, and therefore while its numbers of neurons had probably already reached adult levels, its brain mass was still below the average reported for the species, thus presumably skewing scaling relationships for numbers of cells and
densities calculated with the inclusion of the giraffe [Kazu et al., 2014]. In agreement with the possibility that adult numbers of neurons had already been reached while brain structure mass was still growing, the giraffe matches the scaling rules across numbers of neurons in the cerebral cortex and cerebellum ( fig. 3 c).
Finally, we have reported that while the elephant cere-bral cortex fits the neuronal scaling rules that apply to afrotherians and other nonprimates, its cerebellum is an obvious outlier, with over twice the number of neurons expected for an afrotherian cerebellum of its mass and 10 times the number of neurons that would be expected for the number of neurons in the elephant cerebral cortex, holding an extraordinary 98% of all brain neurons [Her-culano-Houzel et al., 2014] ( fig. 3 c). Thus, we recom-mend not including the naked mole-rat, the giraffe and the elephant in comparative analyses, except for the pur-pose of examining these species directly.
Allometric Rules
Our dataset on the cellular composition of mammali-an brain structures has made possible a number of discov-eries on the scaling rules that apply to the construction and evolution of mammalian brains, many of which have been the subject of previous reviews [Herculano-Houzel, 2011, 2012; Herculano-Houzel et al., 2014b]. Amongst the most notable is the finding that distinct neuronal scal-ing rules apply to the primate cerebral cortex in compar-ison to all other mammalian species in the dataset. Nonprimate cortices scale with decreasing neuronal den-sities as the number of neurons increases, which suggests that the increases in neurogenesis across species that nec-essarily underlie increased numbers of neurons in evolu-tion are coupled to an increasing average size of neurons
a
b
c
Fig. 4. Neuronal density does not scale uniformly with number of neurons across structures and clades. a Average neuronal density in the cerebral cortex (neurons per mg, N/mg) scales across nonprimate species as a power function of the number of cortical neurons with exponent –0.632 ± 0.042 (r 2 = 0.904, p < 0.0001, cal-culated without the naked mole-rat and the giraffe). b Average neuronal density in the cerebellum scales across nonprimate, non-eulipotyphlan species (also excluding the elephant) as a power function of the number of cerebellar neurons with exponent –0.290 ± 0.037 (r 2 = 0.766, p < 0.0001). c Average neuronal density in the RoB scales across nonartiodactyl species (also excluding the ele-phant) as a power function of the number of neurons in the struc-ture with exponent –0.393 ± 0.080 (r 2 = 0.439, p < 0.0001).
Colo
r ver
sion
ava
ilabl
e on
line
Dow
nloa
ded
by:
Uni
vers
ity o
f Pitt
sbur
gh
198.
143.
37.9
7 -
3/7/
2016
7:3
4:58
PM

Cell Numbers in Mammalian Brains Brain Behav Evol 2015;86:145–163DOI: 10.1159/000437413
159
(which we define as including all of their arbors, besides the cell body). Primates have diverged away from the common ancestor with other lineages with an uncoupling between increased numbers of neurons and changed av-erage neuronal cell size ( fig. 4 a) [Herculano-Houzel et al., 2014b]. As a result, primate cortices contain many more neurons than nonprimate cortices of a similar mass. The magnitude of the discrepancy can be observed in table 1 , where the different species of all six orders and superor-ders have been listed in ascending order of cortical mass. Perusing table 1 makes clear the numerical advantage that primates have in comparison to other groups in terms of numbers of neurons in the cerebral cortex, even when the human cerebral cortex is compared to the much larger African elephant cortex.
We found that different neuronal scaling rules apply to the cerebellum of primates and eulipotyphlans in com-parison to the ensemble of afrotherians, glires and artio-dactyls, with neuronal densities that decrease with in-creasing numbers of neurons in the latter but not in the former ( fig. 4 b) [Herculano-Houzel et al., 2014b]. Again, perusing table 2 shows the larger number of neurons found in eulipotyphlan cerebella compared to even larger cerebella of glires and afrotherians. The much larger number of neurons in primate cerebella than in even larg-er artiodactyl cerebella is also documented in table 2 .
In contrast, we reported recently that the neuronal scaling rules for the RoB are shared by primates, glires, afrotherians and eulipotyphlans, but not by artiodactyls [Herculano-Houzel et al., 2014b]. These latter animals have far fewer neurons in their RoB than nonartiodactyls in the dataset with an even smaller RoB ( table 3 ). The dif-ference translates into far smaller neuronal densities in the artiodactyl RoB than expected for its number of neu-rons or RoB mass, compared to the scaling rules that ap-ply to the RoB of other species ( fig. 4 c). However, it will
be argued here that artiodactyls are not outliers in their neuronal scaling rules for the RoB; rather, once other re-lationships are taken into consideration, as shown below, once again it is primates who have deviated away from the scaling rule that applies to other mammalian clades.
a
b
c
Colo
r ver
sion
ava
ilabl
e on
line
Fig. 5. Neuronal density in the RoB, but not in the cerebral cortex or cerebellum, scales uniformly with body mass. a The power law that fits the variation in average neuronal density in the cerebral cortex (neurons per mg, N/mg) as a function of body mass across the entire dataset excludes most primate species (exponent, –0.267 ± 0.021, r 2 = 0.822, p < 0.0001). b The power law that describes the variation in average neuronal density in the cerebellum as a func-tion of body mass, calculated across nonprimate, noneulipotyph-lan species, excludes both these orders as well as the elephant (ex-ponent, –0.156 ± 0.017, r 2 = 0.715, p < 0.0001). c In contrast, the power law that describes the variation in average neuronal density in the RoB with increasing body mass, calculated across all species, includes many representatives of all clades, including artiodactyls and the elephant (exponent, –0.300 ± 0.019, r 2 = 0.872, p < 0.0001).
Dow
nloa
ded
by:
Uni
vers
ity o
f Pitt
sbur
gh
198.
143.
37.9
7 -
3/7/
2016
7:3
4:58
PM

Herculano-Houzel/Catania/Manger/Kaas
Brain Behav Evol 2015;86:145–163DOI: 10.1159/000437413
160
Larger Neurons in Larger Bodies
Although artiodactyls share a similar range of brain masses with primates, the former are typically much larg-er animals than primates of similar brain mass or number of neurons. Since the RoB includes a number of structures that are directly connected to targets or sensory sources in the body, we examined the possibility that the very low neuronal densities found in the artiodactyl RoB, which indicate very large average neuronal sizes [Mota and Her-culano-Houzel, 2014], are related to the large body mass of these animals, in comparison to all other mammals in the dataset.
We found that neuronal densities in the artiodactyl RoB are indeed much better aligned across all species in the dataset as a function of body mass ( fig. 5 c), to the point that they can be well described by a single power function, with lower neuronal densities (and thus larger average neuronal mass) in animals with larger body mass. In contrast, although there is also an overall trend for low-er neuronal densities in the cerebral cortex and cerebel-lum of larger animals, fitting a single power law to the entire dataset here excludes the primate cerebral cortex ( fig. 5 a). Similarly, the power law that fits the cerebellum of glires, afrotherians and artiodactyls excludes not only the cerebellum of primates and eulipotyphlans, but also the elephant ( fig. 5 b). Thus, while neurons in the RoB seem to increase uniformly in average mass with increas-ing body mass across all mammalian orders analyzed, neurons in the cerebral cortex and cerebellum vary sig-nificantly across mammalian orders in how average neu-ronal cell mass scales with increasing body mass. This is consistent with the existence of different neuronal scaling rules that govern how average neuronal cell size in the cerebral cortex in primates and in the cerebellum of pri-
a
b
c
Fig. 6. The number of neurons in each brain structure does not scale uniformly with body mass across all clades. a The number of neurons in the cerebral cortex scales across nonprimate species as a power function of body mass with exponent 0.474 ± 0.021 (r 2 = 0.940, p < 0.0001), which clearly excludes all primates in the data-set larger than the mouse lemur. b The number of neurons in the cerebellum scales across nonprimate, noneulipotyphlan species (also excluding the elephant) as a power function of body mass with exponent 0.535 ± 0.027 (r 2 = 0.933, p < 0.0001). In contrast, the number of cerebellar neurons scales across eulipotyphlans and primates jointly as a power function of exponent 0.782 ± 0.039(r 2 = 0.962, p < 0.0001). c The number of neurons in the RoB scales across nonprimate species (including the elephant) as a power function of body mass with exponent 0.317 ± 0.021 (r 2 = 0.875,p < 0.0001) that excludes most primates.
Colo
r ver
sion
ava
ilabl
e on
line
Dow
nloa
ded
by:
Uni
vers
ity o
f Pitt
sbur
gh
198.
143.
37.9
7 -
3/7/
2016
7:3
4:58
PM

Cell Numbers in Mammalian Brains Brain Behav Evol 2015;86:145–163DOI: 10.1159/000437413
161
body volume. It thus appears that all mammalian species in the dataset have neurons that become larger (longer) within the brain as body mass increases, with no distinc-tion across orders. We suggest that it is this physical con-straint that makes neurons in the RoB become larger (longer) with increasing body mass across all clades.
Importantly, and in contrast to the hypothesis that larger bodies require more neurons to operate them [Jer-ison, 1973], it is only the neuronal density in the RoB (and thus average neuronal cell mass) that varies uniformly with increasing body mass: as shown in figure 6 c, pri-mates are clear outliers, such that there is no single scaling rule that relates numbers of neurons in the RoB to body mass across all mammalian species in the dataset. Inter-estingly, although clear relationships exist between brain mass and the number of neurons in the cerebral cortex ( fig. 6 a), cerebellum ( fig. 6 b) or RoB ( fig. 6 c), primates are in all three cases subject to a different scaling rule, with more neurons for a given body mass compared to other mammalian clades. The clade specificity indicates that, while larger bodies have neurons in the RoB that are on average larger in proportion to the linear dimension of the body, the number of brain neurons is not dictated simply by body mass, either in the RoB or elsewhere.
mates and eulipotyphlans scale with numbers of neurons compared to other species, as we have suggested [Hercu-lano-Houzel et al., 2014b].
If it remains the case that the scaling rules that link av-erage neuronal cell size to numbers of neurons in the RoB have diverged in artiodactyls, as shown in figure 4 c, then one possibility is that the driving force behind this diver-gence was a shift in the body × brain relationship in the species of this clade. However, as seen in figure 6 , artio-dactyls are a much closer fit to the scaling relationship between body mass and number of RoB neurons (as also found for the cerebral cortex and cerebellum) that applies to nonprimate species, while primates clearly have their own body × brain relationship. If artiodactyls shared with all mammals the relationship between neuronal density in the RoB and body mass ( fig. 5 c) but showed a faster de-crease in neuronal density for the number of RoB neurons compared to other species ( fig. 4 c), as we had initially pre-sumed [Herculano-Houzel et al., 2014b], then the number of neurons in the artiodactyl RoB should scale faster with body mass than in other species – but it does not ( fig. 6 c). In contrast, if artiodactyls shared with other nonprimate mammals both the scaling of neuronal density in the RoB and body mass ( fig. 5 c) and the scaling of neuronal den-sity with the number of RoB neurons, and primates were instead the outliers as shown in figure 7 , then artiodactyls would be expected to share with nonprimates the scaling of number of RoB neurons with body mass, as is indeed the case ( fig. 6 c). It thus appears more likely that the scal-ing rules that apply to the RoB have diverged not in artio-dactyls, but rather in primates, as they did in the cerebral cortex and cerebellum, as indicated in figure 7 .
While the neuronal scaling rules that apply to the RoB might thus have diverged not in artiodactyls, but in pri-mates, it remains that for all species in the dataset, includ-ing primates, neuronal densities in the RoB decrease with increasing body mass, indicating that average neuronal mass in the RoB increases together with increasing body mass. Of all brain neurons, it is those situated in the RoB that are most directly related to the body, as many neu-rons in these structures, from the medulla to the dien-cephalon, are directly connected to structures in the body through sensory or motor nerves. Those neurons that are directly connected to bodily structures must have their fibers increase, at least in length, within the RoB (as in the body) as the body grows and those targets become more distant. Indeed, the exponent of the single power law that relates neuronal density in the RoB to body mass, –0.301 ± 0.019 (r 2 = 0.873, p < 0.0001), is not significantly differ-ent from 1/3 – the exponent that relates body length to
Fig. 7. Neuronal density in the RoB is better described to scale uni-formly with number of neurons across nonprimates than across nonartiodactyls. Average neuronal density in the RoB (neurons per mg, N/mg) scales across nonprimate, nonelephant species as a power function of the number of neurons in the RoB with expo-nent –0.914 ± 0.118 (r 2 = 0.712, p < 0.0001). Notice that while the 95% confidence interval still excludes most artiodactyls, it explains much better the variation in neuronal density in the structure than the fit shown in figure 4c, which included primates but excluded artiodactyls.
Dow
nloa
ded
by:
Uni
vers
ity o
f Pitt
sbur
gh
198.
143.
37.9
7 -
3/7/
2016
7:3
4:58
PM

Herculano-Houzel/Catania/Manger/Kaas
Brain Behav Evol 2015;86:145–163DOI: 10.1159/000437413
162
Conclusion
As mentioned above, the main focus of our work has been the investigation of the scaling relationships that ap-ply to mammalian brains and what they teach about the evolutionary origins of brain diversity in mammals. We expect the dataset that we have generated to be useful to researchers interested in many other aspects of diversity: how it is related to lifestyle, habitat, diet; how it evolved within particular clades; how it is constrained by physical aspects of brain morphology and function. As our re-search on brain diversity continues to grow, we will con-tinue to expand our dataset on the cellular composition of different brain structures across mammalian species and clades and make it available to the scientific commu-
nity. In the near future, we will be able to add chiropter-ans, carnivores, marsupials and cetaceans to the dataset, as well as a subdivision of nonneuronal ‘other’ cells into the underlying cell types (endothelium, astrocytes, oligo-dendrocytes and microglial cells).
Acknowledgements
We thank all the colleagues that were involved in collecting the data reported in this review. This work was supported by grants from CNPq, FAPERJ, MCT/INCT and The James S. McDonnell Foundation (S.H.H.), The National Research Foundation of South Africa (P.R.M.), and The National Science Foundation grant 0844743 (K.C.).
References
Armstrong E (1990): Brains, bodies and metabo-lism. Brain Behav Evol 36: 166–176.
Azevedo FAC, Carvalho LRB, Grinberg LT, Farfel JM, Ferretti REL, Leite REP, Jacob Filho W, Lent R, Herculano-Houzel S (2009): Equal numbers of neuronal and non-neuronal cells make the human brain an isometrically scaled-up primate brain. J Comp Neurol 513: 532–541.
Bahney J, von Bartheld CS (2014): Validation of the isotropic fractionator: comparison with unbiased stereology and DNA extraction for quantification of glial cells. J Neurosci Meth 222: 165–174.
Barton RA, Harvey PH (2000): Mosaic evolution of brain structure in mammals. Nature 405: 1055–1058.
Blanga-Kanfi S, Miranda H, Penn O, Pupko T, DeBry RW, Huchon D (2009): Rodent phy-logeny revised: analysis of six nuclear genes from all major rodent clades. BMC Evol Biol 9: 71.
Carlo CN, Stevens CF (2013): Structural unifor-mity of neocortex, revisited. Proc Natl Acad Sci USA 110: 1488–1493.
Catania KC, Remple MS (2002): Somatosensory cortex dominated by the representation of teeth in the naked mole-rat brain. Proc Natl Acad Sci USA 99: 5692–5697.
Charvet CJ, Cahalane DJ, Finlay BF (2015): Sys-tematic, cross-cortex variation in neuron numbers in rodents and primates. Cereb Cor-tex 25: 147–160.
Douady CJ, Chatelier PI, Madsen O, de Jong WW, Catzeflis F, Springer MS, Stanhope MJ (2002): Molecular phylogenetic evidence confirming the Eulipotyphla concept and in support of hedgehogs as the sister group to shrews. Mol Phylogenet Evol 25: 200–209.
Finlay BF, Darlington RB (1995): Linked re-gularities in the development and evolution of mammalian brains. Science 268: 1578–1584.
Gabi M, Collins CE, Wong P, Kaas JH, Hercula-no-Houzel S (2010): Cellular scaling rules for the brain of an extended number of primate species. Brain Behav Evol 76: 32–44.
Haug E (1987): Brain sizes, surfaces, and neuronal sizes of the cortex cerebri: a stereological in-vestigation of man and his variability and a comparison with some mammals (primates, whales, marsupials, insectivores, and one el-ephant). Am J Anat 180: 126–142.
Herculano-Houzel S (2010): Coordinated scaling of cortical and cerebellar numbers of neurons. Front Neuroanat 4: 12.
Herculano-Houzel S (2011a): Not all brains are made the same: new views on brain scaling in evolution. Brain Behav Evol 78: 22–36.
Herculano-Houzel S (2011b): Brains matter, bod-ies maybe not: the case for examining neuron numbers irrespective of body size. Ann Rev NY Acad Sci 1225: 191–199.
Herculano-Houzel S (2011c): Scaling of brain me-tabolism with a fixed energy budget per neu-ron: implications for neuronal activity, plas-ticity and evolution. PLoS One 6:e17514.
Herculano-Houzel S (2012): The isotropic frac-tionator: a fast, reliable method to determine numbers of cells in the brain or other tissues; in Fellin T, Halassa MM (eds): Springer Neu-romethods: Neuronal Network Analysis: Concepts and Experimental Approaches. New York, Humana Press, vol 67, pp 391–403.
Herculano-Houzel S (2014): The glia/neuron ra-tio: how it varies uniformly across brain struc-tures and species and what that means for brain physiology and evolution. Glia 62: 1377–1391.
Herculano-Houzel S, Avelino-de-Souza K, Neves K, Porfírio J, Messeder D, Calazans I, Mattos L, Maldonado J, Manger PM (2014a): The el-ephant brain in numbers. Front Neuroanat 8: 46.
Herculano-Houzel S, Collins C, Wong P, Kaas JH (2007): Cellular scaling rules for primate brains. Proc Natl Acad Sci USA 104: 3562–3567.
Herculano-Houzel S, Kaas JH (2011): Gorilla and orangutan brains conform to the primate cel-lular scaling rules: implications for human evolution. Brain Behav Evol 77: 33–44.
Herculano-Houzel S, Kaas JH, Miller D, vonBartheld CS (2015): How to count cells: the advantages and disadvantages of the isotropic fractionator compared with stereology. Cell Tissue Res 360: 29–42.
Herculano-Houzel S, Lent R (2005): Isotropic fractionator: a simple, rapid method for the quantification of total cell and neuron num-bers in the brain. J Neurosci 25: 2518–2521.
Herculano-Houzel S, Manger PR, Kaas JH (2014b): Brain scaling in mammalian brain evolution as a consequence of concerted and mosaic changes in numbers of neurons and average neuronal cell size. Front Neuroanat 8: 77.
Herculano-Houzel S, Mota B, Lent R (2006): Cel-lular scaling rules for rodent brains. Proc Natl Acad Sci USA 103: 12138–12143.
Herculano-Houzel S, Ribeiro PFM, Campos L, da Silva AV, Torres LB, Catania KC, Kaas JH (2011): Updated neuronal scaling rules for the brains of Glires (rodents/lagomorphs). Brain Behav Evol 78: 302–314.
Hofman MA (1985): Size and shape of the cere-bral cortex in mammals. I. The cortical sur-face. Brain Behav Evol 27: 28–40.
Dow
nloa
ded
by:
Uni
vers
ity o
f Pitt
sbur
gh
198.
143.
37.9
7 -
3/7/
2016
7:3
4:58
PM

Cell Numbers in Mammalian Brains Brain Behav Evol 2015;86:145–163DOI: 10.1159/000437413
163
Hofman MA (1988): Size and shape of the cere-bral cortex in mammals. II. The cortical vol-ume. Brain Behav Evol 32: 17–26.
Jarvis JUM, Sherman PW (2002): Heterocephalus glaber . Mammalian Species 706: 1–9.
Jerison H (1973): Evolution of the Brain and Intel-ligence. New York, Academic Press.
Karbowski J (2007): Global and regional brain metabolic scaling and its functional conse-quences. BMC Biol 5:18.
Kazu RS, Maldonado J, Mota B, Manger PR, Her-culano-Houzel S (2014): Cellular scaling rules for the brain of Artiodactyla include a highly folded cortex with few neurons. Front Neuro-anat 8: 128.
Kumar SS, Buckmaster PS (2007): Neuron-specif-ic nuclear antigen NeuN is not detectable in gerbil substantia nigra pars reticulata. Brain Res 1142: 54–60.
Miller DJ, Balaram P, Young NA, Kaas JH (2014): Three counting methods agree on cell and neuron number in chimpanzee primary visu-al cortex. Front Neuroanat 8: 36.
Mota B, Herculano-Houzel S (2014): All brains are made of this: a fundamental building block of brain matter with matching neuronal and glial masses. Front Neuroanat 8: 127.
Mullen RJ, Buck CR, Smith AM (1992): NeuN, a neuronal specific nuclear protein in verte-brates. Development 116: 201–211.
Murphy WJ, Eizirik E, Johnson WE, Zhang YP, Ryder OA, O’Brien SJ (2001): Molecular phy-logenetics and the origins of placental mam-mals. Nature 409: 614–618.
Neves K Jr, Ferreira FM, Tovar-Moll F, Gravett N, Bennett NC, Kaswera C, Gilissen E, Manger PR, Herculano-Houzel S (2014): Cellular scal-ing rules for the brains of Afrotheria. Front Neuroanat 8: 5.
Price SA, Bininda-Emonds ORP, Gittleman JL (2005): A complete phylogeny of the whales, dolphins and even-toed hoofed mammals (Cetartiodactyla). Biol Rev 80: 445–473.
Purvis A (1995): A composite estimate of primate phylogeny. Philos Trans R Soc Lond B Biol Sci 348: 405–421.
Ribeiro PFM, Manger PR, Catania K, Kaas JH, Herculano-Houzel S (2014): Greater addition of neurons to the olfactory bulb than to the cerebral cortex of insectivores but not rodents or primates. Front Neuroanat 8: 23.
Sarko DK, Catania KC, Leitch DB, Kaas JH, Her-culano-Houzel S (2009): Cellular scaling rules of insectivore brains. Front Neuroanat 3: 8.
Shinohara A, Campbell KL, Suzuki H (2003): Mo-lecular phylogenetic relationships of moles, shrew moles, and desmans from the new and old worlds. Mol Phylogenet Evol 27: 247–258.
Stephan H, Frahm H, Baron G (1981a): New and revised data on volumes of brain structures in insectivores and primates. Folia Primatol 35: 1–29.
Stephan H, Nelson JE, Frahm HD (1981b): Brain size comparison in Chiroptera. J Zool Syst Evol Res 19: 195–222.
Stolzenburg JU, Reichenbach A, Neumann M (1989): Size and density of glial and neuronal cells within the cerebral neocortex of various insectivorian species. Glia 2:78–84.
Tower DB (1954): Structural and functional orga-nization of mammalia cerebral cortex: the cor-relation of neurone density with brain size – cortical neurone density in the fin whale ( Balaenoptera physalus L.) with a note on the cortical neurone density in the Indian ele-phant. J Comp Neurol 101: 19–52.
Tower DB, Elliott KAC (1952): Activity of acetyl-choline system in cerebral cortex of various unanesthetized mammals. Am J Physiol 168: 747–759.
Xiao J, Levitt JB, Buffenstein R (2006): The use of a novel and simple method of revealing neural fibers to show the regression of the lateral ge-niculate nucleus in the naked mole-rat (Hete-rocephalus glaber) . Brain Res 1077: 81–89.
Dow
nloa
ded
by:
Uni
vers
ity o
f Pitt
sbur
gh
198.
143.
37.9
7 -
3/7/
2016
7:3
4:58
PM