Embed Size (px)
Citation preview
MANAGEMENT’S DISCUSSION & ANALYSIS
Year ended December 31, 2017
2
NIOBAY METALS INC.
MANAGEMENT’S DISCUSSION AND ANALYSIS OF FINANCIAL CONDITION AND RESULTS OF OPERATIONS FOR THE
YEAR ENDED DECEMBER 31, 2017
The following management’s discussion and analysis (“MD&A”) of the operations, results, and financial position of Niobay Metals Inc.
(“NioBay” or the “Company”), dated April 26, 2018, covers the years ended December 31, 2017 and 2016 and should be read in
conjunction with the audited consolidated financial statements and related notes at December 31, 2017 and 2016 (the “December 31,
2017 and 2016 consolidated financial statements”). The December 31, 2017 and 2016 consolidated financial statements have been
prepared in accordance with International Financial Reporting Standards (“IFRS”). All financial results presented in this MD&A are
expressed in Canadian dollars unless otherwise indicated.
DESCRIPTION OF BUSINESS
NioBay is a mineral resource company. The business of the Company consists of acquiring, exploring and evaluating mining
properties. NioBay has not yet determined whether its properties contain economically viable mineral deposits.
Niobay’s principal asset is a 100% interest in the James Bay niobium property located in northeastern Ontario (the “James Bay
Niobium Project”). In addition to the James Bay Niobium Project, NioBay holds (1) an option to acquire an interest of up to 65% in the
La Peltrie gold project in northern Quebec, (2) a 48.7% direct participation in certain mineral titles located close to Chibougamau,
Quebec, under a joint venture agreement with SOQUEM, a subsidiary of Investissement Québec, and (3) a 72.5% interest in the
Crevier niobium and tantalum project, located in Quebec.
The Company’s common shares are listed on the TSX Venture Exchange (“TSXV”) under the symbol NBY. As at April 26, 2018, the
Company has 45,690,111 issued and outstanding common shares.
FINANCINGS
Niobay has sufficient funds to pursue its activities until at least the end of 2018, after having completed private placement financings
in December 2017 and March 2018 raising a total of $3,195,800.
On March 28, 2018, Osisko Gold Royalties Ltd (“Osisko”) purchased, by way of a private placement, 9,000,000 common shares of
the Company at a price of $0.26 per share for proceeds of $2,340,000. Osisko now owns approximately 19.7% of Niobay’s issued
and outstanding shares on a non-diluted basis. Pursuant to the subscription agreement entered into between Niobay and Osisko, so
long as Osisko holds not less than 10% of the then issued and outstanding shares of Niobay, Osisko will have the right to (i) nominate
one director to Niobay’s board of directors and (ii) participate in all future equity financings by Niobay to maintain its relative equity
ownership. In addition, Osisko was granted an option to purchase a 1.0% royalty on all products to be produced from the James Bay
Niobium Project. The option will be exercisable by paying $2,000,000 to Niobay at any time within 90 days following the delivery by
Niobay to Osisko of a bankable feasibility study on the project.
On December 22, 2017, the Company completed a non-brokered private placement by issuing 814,075 flow-through shares (“FT
Shares”) at a price of $0.27 per FT Share and 2,890,909 common shares at a price of $0.22 per share for total proceeds of $855,800.
The proceeds of the sale of the FT Shares will be used to incur eligible Canadian exploration expenses and flow-through mining
expenditures, as defined under the Income Tax Act (Canada). Such expenditures have been renounced in favour of the purchasers.
Management’s Discussion and Analysis
Year ended December 31, 2017
3
JAMES BAY NIOBIUM PROJECT (ONTARIO)
In June 2016, the Company acquired the James Bay Niobium Project from Barrick Gold Inc., James Bay Columbium Ltd. and Goldcorp
Inc. The property is located in the district of Cochrane, in the James Bay Lowlands in northeastern Ontario and covers an area of
6,388 acres. The property rights are held through a Crown mining lease recorded in the name of the Company. The mining lease was
last renewed for a term of 10 years which expired on February 28, 2018. In November 2017, the Company filed a renewal application
with the Ontario Ministry of Northern Development and Mines (“MNDM”) and paid the required rental fees to renew the mining lease
for an additional 10-year term. The application is being processed by the MNDM and is expected to be accepted in the next few
months. The James Bay Niobium Project was discovered in 1966 by Consolidated Morrison Explorations Limited. At that time,
exploratory and detailed drilling totaled over 14,000 meters, outlining the deposit to a maximum depth of 275 meters. The deposit was
drilled along a strike of 730 meters. An exploration shaft was sunk to investigate soil conditions and to provide a 225 tons bulk sample.
Subsequent pilot plant operations demonstrated a good quality pyrochlore concentrate with low impurities.
Social acceptability
In October 2016, the Company filed with the MNDM an application for an exploration permit on the James Bay Niobium Project. As of
this date, this application remains on temporary hold. The Company continues to reach out to all concerned stakeholders in the area
of the James Bay Niobium Project while the MNDM is pursuing efforts to engage with the Moose Cree First Nation (“MCFN”) to address
any concerns they may have about the proposed drilling campaign. The Company has not yet held formal discussions with the
leadership of MCFN on the exploration program and the project in general.
Initial work program
Following the acquisition of the James Bay Niobium Project, the Company gathered and compiled all of the historical data. A team of
geologists cleaned and re-logged the historical drill core and over 600 samples from 12 representative historical diamond drill holes
were re-assayed. The Company provided partial results of the re-assaying program in press releases issued on March 6, 2017 and
April 10, 2017. The Company subsequently posted on its website all the results of the re-assaying program.
Metallurgical testing
In May 2017, the Company announced preliminary metallurgical test results using core from the historical drilling program completed
at the James Bay Niobium Project. These tests were conducted by SGS Lakefield in Ontario. The initial results of heavy liquid
separation performed on a representative material compound from the James Bay Niobium Project showed excellent potential for the
concentration by gravimetry. A concentration of 90% to 93% of the niobium minerals was obtained in residual masses of only 5% to
22% of the original weight. The historical treatment mode predicted a rejection of almost 40% of the initial mass with a loss of only 4%
to 5% of the niobium units. The results of detailed mineralogy performed by QEMSCAN show a very good liberation of minerals in
general. If feasible, this may prove to have a clear advantage in terms of the size of the required infrastructures. Additional metallurgical
tests will be required once the Company has completed a drilling program.
Management’s Discussion and Analysis
Year ended December 31, 2017
4
Mineral Resource Estimate
In November 2017, the Company announced an initial Mineral Resource estimate for the James Bay Niobium Project prepared in
accordance with Canadian National Instrument 43-101 Standards of Disclosure for Mineral Projects (“NI 43-101”). The Mineral
Resource estimate was prepared by Roscoe Postle Associates Inc. (“RPA”) and the supporting NI 43-101 independent technical report
was filed on SEDAR in December 2017.
Highlights of the NI 43-101 Mineral Resource estimate are as follows:
Classification Tonnes Grade Contained Nb2O5
(Mt) (%Nb2O5) (Mkg)
Indicated 23.1 0.53 123
Inferred 23.0 0.51 118
Notes:
1. CIM (2014) Definitions Standards were followed for Mineral Resources.
2. Mineral Resources are reported at a cut-off grade of 0.3% Nb2O5 based on an underground mining operating cost of $70/tonne and a metallurgical recovery of 70%.
3. Mineral Resources were estimated using a long-term niobium price of US$40 per kg and a US$/C$ exchange rate of 1:1.2.
4. A tonnage factor of 12.2 ft³/ton (2.93 g/cm³) was used.
5. A minimum mining width of approximately 25 ft (7.6m) was used to build the resource wireframes.
6. Resources situated in a 150 ft (45.7m) thick crown pillar have been excluded.
7. The RPA Qualified Persons for the estimate are Dorota El Rassi, P.Eng. and Paul Chamois, P.Geo.
The Mineral Resource estimate is supported by the results of the re-logging and re-sampling of 12 representative historical diamond
drill holes described above, by preliminary metallurgical testing performed by SGS Lakefield on a composite sample and by all of the
historical data Niobay recovered from the previous operator: drill logs, assay certificates, surveyed collar coordinates, interpreted
geological surface and level plans, interpreted vertical sections, location of the exploration shaft and 1st level, and metallurgical tests.
The data used to estimate the Mineral Resource include 79 diamond drill holes totaling 13,230 m located within the resource model
area. The data include 2,517 assays, of which 56 have a value of zero for Nb2O5. The estimate was prepared using a block model
constrained with 3-D wireframes of the mineralized zone. The niobium oxide grades were interpolated using ordinary kriging and three
passes.
LA PELTRIE PROJECT
On September 5, 2017, the Company entered into an option agreement with Midland Exploration Inc. (“Midland”) to acquire up to a
65% interest in the La Peltrie gold property (“La Peltrie Project”). The La Peltrie Project consists of 520 claims totaling approximately
288 square kilometers and covers, over 25 kilometers, a series of NW-SE-trending subsidiary faults to the south of the regional Lower
Detour Fault. This project with strong gold potential is wholly owned by Midland and is located approximately 25 kilometers southeast
of Zone 58N, a high-grade gold zone in the Lower Detour area held by Detour Gold Corp. and about 25 kilometers northwest of the
former Selbaie mine.
The option is valid for a period of six years. At closing, on September 18, 2017, the Company issued to Midland a total of 200,000
common shares valued at $30,000. To earn a 50% interest in the La Peltrie Project, the Company will have to pay, in cash or in
Management’s Discussion and Analysis
Year ended December 31, 2017
5
common shares, $30,000, $50,000, $70,000 and $70,000 on or before respectively August 31, 2018, 2019, 2020 and 2021. The
Company will also have to spend $3,000,000 in exploration expenditures by August 31, 2021 including a firm commitment of $500,000
which was spent by December 31, 2017. Following the initial earn-in of a 50% interest, Niobay will be entitled to earn an additional
15% interest in the project by completing a preliminary economic assessment by August 1, 2023.
Drilling campaign
In the fall of 2017, Midland, as operator of the exploration activities, completed a total of 7 drill holes totalling 1,881 metres on the La
Peltrie Project. The drilling program was mainly designed to test new structural, geological, and geophysical targets identified following
compilation work and OreVision® and IP geophysical surveys conducted in 2016 and 2017 by Midland. The best results of this
campaign come from 2 drill holes spaced about 300 metres apart, which tested the gold-bearing iron formation. Drill holes LAP-17-04
and LAP-17-05 yielded several anomalous gold values above 0.1 g/t Au, associated with semi-massive to massive sulphide horizons
between 10 to 60 metres thick. The remaining drill holes in this campaign, drilled to test areas other than the iron formation, explained
the geophysical anomalies with the presence of sulphides but no significant values were obtained.
The pyrrhotite-bearing massive sulphides intersected in the drill holes occur near the contact between calc-alkaline felsic tuff (F1-type)
sequences to the south and andesites to the north. The geochemical signature of these felsic tuffs is very similar to that of the felsic
tuff and rhyolite sequences that host the Bousquet-LaRonde volcanogenic gold deposits in the southern Abitibi. The pyrrhotite-bearing
massive sulphides also show additional enrichment in gold and several metallic elements (Ag, Pb, As) near the contact with andesites,
indicating the presence of a particularly favourable exhalative horizon in this location. In addition, drill hole LAP-17-06, which tested
the NW-SE-trending structure, intersected the underlying andesites, which exhibit strong proximal volcanogenic alteration and contain
abundant felsic dykes compositionally similar to the tuffs. This confirms the presence of a synvolcanic fault in this area. Integration of
these results has led to the identification of a high-priority exploration target, at the intersection between the synvolcanic fault and the
favourable felsic tuff-andesite contact.
SOQUEM JOINT VENTURE
In January 2008, the Company had entered into a joint venture agreement with SOQUEM, for certain mineral titles located in Québec,
including the Clairy and Lac Shortt/Lesperance properties. The Clairy property is located 120 km north from the Chibougamau mining
camp and 40 km south of the former Troilus mine. The property includes 56 mining claims covering a surface area of 2,818 hectares.
The minerals of interest are copper and zinc. The Lake Shortt/Lesperance properties are located about 135 km south-west from the
Chibougamau mining camp and 15 km north-east from the Bachelor Lake concentrator. The Lac Shortt property includes 97 mining
claims covering a surface area of 4,798 hectares. The Lesperance property holds 36 mining claims covering a surface area of 1,978
hectares. The mineral of interest is gold.
During the year ended December 31, 2017, SOQUEM, as operator of the projects, began compiling and interpreting historical
geophysics and lithiogeochemical data collected in previous exploration campaigns on the Clairy and Lac Shortt/Lesperance
properties. Further, an Aerovision mag survey (UAV-MAG) was completed on the Lesperance property. Two magnetic anomalies
were identified, and drilling was recommended. The Company’s share of expenses on these projects amounted to $137,978 during
the year.
Management’s Discussion and Analysis
Year ended December 31, 2017
6
CREVIER PROPERTY
No work was done on the Crevier property in 2017. Given the consistent increase in both niobium and tantalum prices since the
beginning of 2017, the Company is considering conducting evaluation work on the Crevier property later in 2018 if market conditions
continue to improve. The Company has a non-expiring right to acquire an additional interest of 15% in Crevier Minerals Inc. by paying
in cash or in shares, at the option of the Company, $750,000 to the non-controlling shareholder.
QUALIFIED PERSON
Claude Dufresne, P. Eng, acted as the qualified person as defined in NI 43-101. He reviewed and approved the technical and scientific
content of this MD&A. Mr. Dufresne is the President and CEO of the Company.
FINANCIAL CONDITION
As at December 31, 2017, the Company had a working capital of $1,035,834, which includes the proceeds of $855,800 from the
private placement of 814,075 FT Shares at a price of $0.27 per share and 2,890,909 common shares at a price of $0.22 per share
completed on December 22, 2017. As described in the Financing section of this MD&A, the Company raised an additional amount of
$2,340,000 in March 2018 through the issue to Osisko of 9,000,000 common shares at a price of $0.26 per share.
The Company’s planned exploration and evaluation work program for 2018 is estimated at $1.0 million, mostly related to the James
Bay Niobium Project, and its general administrative expenses are budgeted at $0.6 million.
Since the Company does not generate cash flows, it will need to raise additional funds in the future through the issuance of debt or
equity instruments or a combination of strategic partnerships or joint venture arrangements to meet future work requirements. While
management has been successful in securing financing in the past, there can be no assurance it will be able to do so in the future or
that these sources of funding or initiatives will be available to the Company or that they will be available on terms which are acceptable
to the Company. If the Company is not successful in raising additional funds, it may be required to reduce the scope of, or eliminate
its current or future exploration and evaluation activities.
The Company incurred a net loss of $406,118 ($0.01 per share) in 2017 compared to a net loss of $5,708,147 ($0.18 per share) in
2016. The loss in 2017 consisted mostly of management and administration expenses ($553,556) partially offset by an income related
to flow-through shares ($137,763), representing the decrease in the liability portion of the flow-through financing completed in
December 2016. The 2016 loss included the write-off of the Company’s remaining deferred exploration and evaluation expenses
related to the Crevier property ($3,491,343) and the Ikungu and Ikungu East properties in Tanzania ($3,896,058), which amount was
partially offset by a non-cash gain on foreign exchange of $2,492,620 resulting from the abandonment in 2016 of the projects in
Tanzania.
Management’s Discussion and Analysis
Year ended December 31, 2017
7
OUTLOOK
The Company’s focus remains the development of the James Bay Niobium Project. The Company continues to hold discussions with
the local community and the MNDM and will maintain its efforts to engage with the leadership of the MCFN.
The Company is currently evaluating various options to finance subsequent work programs on the La Peltrie Project and on those
mineral properties held jointly with SOQUEM. The Company plans to conduct evaluation work during the year on the Crevier property
if niobium and tantalum prices continue to improve.
NIOBIUM MARKET
Niobium is used in various forms such as oxide, pure metal, nickel master-alloys and alloys with other noble metals and in its most
used form, ferro-niobium, representing approximately 90% of the production of niobium. Ferro-niobium ("FeNb") is used as an additive
in the production of high quality steels which are used mostly in the manufacturing of automobiles, bridges, skyscrapers and other
large steel structures, pipelines and stainless steels. The addition of niobium in steel reinforces and lightens the steel, makes it more
resistant to corrosion, facilitates its welding and helps it withstand forces under high pressure and high temperature. The addition of
niobium therefore has a positive impact on the reduction of CO2 emission in the atmosphere which gives it a "green" metal recognition.
The demand for niobium is thus directly related to the manufacture of these steels and the development of new specialty steels.
Niobium is classified as a critical and strategic metal for the United States, Europe and certain Asian countries. There are only three
major producers, CBMM and Catalao in Brazil and Niobec in Canada.
In 2017, world FeNb demand increased significantly compared to the previous year mostly due to strong growth in high value steel
production in China. The long-term forecast indicates a steady growth in demand of niobium in the range of 3% to 6.5% per annum,
driven by an increase in global steel production of high value products. China remains the market with the most growth potential.
Over the last 10 years, the global average price of niobium has varied between US$30 and US$45 / kg Nb. In 2017, the average price
of FeNb grew by approximately 5%. It is expected that prices should trend towards US$45 / kg over the next few years.
Management’s Discussion and Analysis
Year ended December 31, 2017
8
SELECTED CONSOLIDATED FINANCIAL INFORMATION (1)
The following selected financial information should be read in conjunction with the Company’s December 31, 2017 and 2016
consolidated financial statements.
December 31, December 31,
2017 2016
$ $
Financial Position
Cash 1,233,957 2,281,637
Exploration and evaluation assets 1,917,726 614,777
Total assets 3,412,141 3,128,819
Shareholders' equity 2,973,834 2,508,218
Year ended Year ended Year ended
December 31, December 31, December 31,
Comprehensive Loss 2017 2016 2015
$ $ $
Net loss for the year (406,118) (5,708,147) (17,945,091)
Basic and diluted loss per share (0.01) (0.18) (0.75)
Cash Flows
Operating activities (663,690) (652,029) (44,651)
Investing activities (1,242,486) 63,428 (127,454)
Financing activities 862,165 2,801,812 -
1) The Selected Consolidated Financial Information was derived from the Company’s December 31, 2017 and 2016 consolidated financial
statements, prepared in accordance with IFRS.
Since its incorporation, the Company has not paid any cash dividend on its outstanding common shares. Any future dividend payments
will depend on the Company’s financial needs to fund its exploration and evaluation programs and any other factor that the board of
directors may deem necessary to consider. It is highly unlikely that any dividends will be paid in the near future.
FINANCIAL REVIEW
The Company is in the exploration and evaluation phase and does not yet have revenue-generating activities. Accordingly, the
Company’s financial performance is largely a function of the level of exploration and evaluation activities undertaken on its projects
and the management and administrative expenses required to operate and carry out its activities.
Exploration and evaluation expenses
In accordance with its accounting policy, an amount of $1,302,949 in exploration and evaluation expenses was capitalized during the
year ended December 31, 2017 ($650,434 in 2016). The amounts spent by project are presented below.
Management’s Discussion and Analysis
Year ended December 31, 2017
9
Year ended December 31, 2017 James La Soquem
Bay Peltrie JV Total
$ $ $ $
Property payments 15,585 31,846 9,360 56,791
Wages - 33,339 61,953 95,292
Consultants 202,148 170,570 5,513 378,231
Drilling and assaying - 216,632 8,360 224,992
Transportation 25,212 150,576 - 175,788
Studies 250,140 - 16,087 266,227
Depreciation 917 - - 917
Stock-based compensation 9,325 - - 9,325
Administrative and others 21,643 37,038 36,705 95,386
524,970 640,001 137,978 1,302,949
Year ended December 31, 2016 James
Bay Crevier Tanzania Total
$ $ $ $
Property payments 399,945 5,210 - 399,945
Wages 12,877 - - 12,877
Consultants 145,792 - 14,004 159,796
Studies - - 16,443 16,443
Depreciation 218 - - 218
Stock-based compensation 10,292 - - 10,292
Administrative and others 45,653 - - 45,653
614,777 5,210 30,447 650,434
In 2016, the Company also recorded a write-off of $7,387,401 related to the Crevier property ($3,491,343) and the abandoned
properties in Tanzania ($3,896,058).
Results for the year ended December 31, 2017 compared to the year ended December 31, 2016
The Company incurred a net loss of $406,118 during the year ended December 31, 2017 ($0.01 per share) compared to a net loss of
$5,708,147 in 2016 ($0.18 per share). The net loss attributable to shareholders of the Company totaled $405,200 in 2017 compared
to $4,685,382 in 2016. The variance in net loss between the two years is mostly due to net non-cash charges of $4,822,808 in 2016
related to the impairment of the Company’s Crevier property in Quebec and the Ikungu and Ikungu East properties in Tanzania.
Following the non-renewal of 2 of the permits held in Tanzania, the Company decided at the end of 2016 to cease all activities in
Tanzania.
Management and administration expenses totaled $553,556 in 2017 ($796,262 in 2016). Lower expenses in most categories
compared to 2016 resulted from reduced corporate activities during 2017: legal, audit and tax of $68,440 ($113,419 in 2016), office
expenses of $65,501 ($97,966 in 2016), investor relations and travel of $26,841 ($158,103 in 2016) and reporting issuer costs of
$32,700 ($60,023 in 2016), partially offset by higher consulting fees reflecting an increase of the annual fees for the services of the
Management’s Discussion and Analysis
Year ended December 31, 2017
10
Company’s president and CEO. Also, expenses in 2016 included an amount of $76,370 as retirement allowance and debt forgiveness
to the Company’s former CFO and a recovery of expenses of $96,878 related to the termination of a Heads of Agreement entered in
September 2015 regarding the Tanzanian properties.
Results for the 4th quarter ended December 31, 2017 compared to the 4th quarter ended December 31, 2016
During the 4th quarter ended December 31, 2017, the Company incurred a net loss of $8,195 (nil per share), compared to net earnings
of $1,262,912 ($0.04 per share) during the 4th quarter ended December 31, 2016. The variation is mainly due to the impairment and
write-off of exploration and evaluation assets during the 2016 period of $769,945 and a non-cash gain on foreign exchange from
abandonment of Tanzanian projects in the amount of $2,492,620. Management and administration expenses totaled $88,943 during
the period ended December 31, 2017, including the reversal of a $40,000 provision related to administration expenses, compared to
$271,339 in 2016 due to higher wages and consulting fees and higher investor relations and travel fees during the 2016 period from
increased activities driven by the acquisition of the James Bay Niobium Project in 2016.
Selected Quarterly Financial Information
The following is a summary of the Company’s financial results for the past eight quarters:
Net earnings (loss)
attributable to Basic and
shareholders of diluted earnings
Revenues Net earnings (loss) the Company (loss) per share
Period ended $ $ $ $
December 31, 2017 (1) 586 (8,195) (7,769) 0.00
September 30, 2017 (2) 976 (99,315) (99,012) 0.00
June 30, 2017 636 (141,597) (141,581) 0.00
March 31, 2017 770 (157,011) (156,838) (0.01)
December 31, 2016 (3) 550 1,262,912 1,374,294 0.04
September 30, 2016 379 (230,226) (229,622) (0.01)
June 30, 2016 (4) 128 (6,610,540) (5,703,395) (0.25)
March 31, 2016 383 (130,293) (126,659) (0.01)
(1) includes income related to flow-through shares of $84,852 and the reversal of a $40,000 provision related to administration expenses.
(2) includes income related to flow-through shares of $23,925.
(3) includes a write-off of exploration and evaluation assets of $769,945, a bad debt of $95,358, a write-off of property and equipment of $27,846, offset by a gain on foreign
exchange from abandonment of the Tanzanian project of $2,492,620.
(4) includes a write-off of exploration and evaluation assets of $6,617,456 related to the Crevier property in Quebec and the Ikungu and Ikungu East properties in Tanzania,
partially offset by a deferred income tax recovery of $195,188 due to the write-off of the Crevier property.
Liquidity and Capital Resources
The Company’s working capital at December 31, 2017 totaled $1,035,834 compared to a working capital of $1,868,586 at December
31, 2016. The decrease in the working capital during the year ended December 31, 2017 is mainly attributable to the additions to
exploration and evaluation assets of $1,240,381 ($179,667 in 2016) and management and administration expenses of $536,840
($723,843 in 2016), partially offset by the proceeds from financing activities of $862,165 ($2,801,812 in 2016).
Management’s Discussion and Analysis
Year ended December 31, 2017
11
In December 2017, the Company completed a private placement for total proceeds of $855,800, through the issuance of 815,075 FT
Shares at a price of $0.27 per share and 2,890,909 common shares at a price of $0.22 per share.
The Company estimates that the working capital available at December 31, 2017 will not be sufficient to cover its general administrative
expenses and its planned exploration and evaluation budget for 2018. The Company’s properties are in the exploration and evaluation
stage and, as a result, the Company currently has no source of operating cash flow. The potential sources of future funds presently
available to the Company are through equity financing, joint venture or other arrangements. To this effect, on March 28, 2018, Osisko
agreed to purchase, by way of a private placement, 9,000,000 common shares of the Company at a price of $0.26 per share for
proceeds of $2,340,000.
The ability of the Company to arrange future financings will depend in part upon global economic and capital market conditions, the
potential of its projects as well as the business performance of the Company. There can be no assurance that the Company will be
successful in its efforts to arrange additional financing on terms satisfactory to the Company.
Capital Management
In managing its capital, the objective of the Company is to preserve its ability to continue its mining exploration while maintaining the
current exploration programs and evaluation of mining assets, to provide sufficient working capital to meet its current commitments
and to pursue potential investments. The capital of the Company consists of equity attributable to shareholders of the Company of
$2,864,695 ($2,398,161 at December 31, 2016). The Company manages its capital structure and makes adjustments to it in
accordance with the aforementioned objectives, as well as in light of changes in economic conditions and the risk characteristics of
the underlying assets.
Off-Balance Sheet Arrangements
As at December 31, 2017, the Company has no off-balance sheet arrangements.
Transactions with Related Parties
Remuneration to directors and key management of the Company, including the President and CEO and the CFO totaled $266,796
during the year ended December 31, 2017 ($309,915 in 2016, including wages, a retirement allowance of $50,000 and debt
forgiveness of $26,370 to the Company’s former CFO).
A company controlled by the CEO of the Company invoiced $26,400 for the services of a market analyst ($43,925 in 2016) and nil for
the rental of office space ($32,500 in 2016).
Contingencies
MDN Tanzania received notices of assessment in April and June 2016 in respect of withholding taxes and other deductions for the
period from 2007 to 2011, claiming an amount of approximately $300,000 plus accrued interest of approximately $600,000. In 2013,
the Company had received notices of assessment totalling approximately $470,000 in respect of withholding taxes on alleged interest
payments by MDN Tanzania to Company for the period from 2004 to 2011. The Company has not recorded any provisions on these
Management’s Discussion and Analysis
Year ended December 31, 2017
12
matters as management believes that it has always paid its withholding taxes and other statutory deductions in accordance with local
requirements and that the amounts claimed are unfounded. MDN Tanzania continues to vigorously defend its position with the
Tanzanian tax authorities.
Following an audit of the tax credits relating to resources claimed by and paid to Crevier Minerals Inc. for the years 2010, 2011 and
2012, Revenu Québec issued in April 2015 a notice of assessment for an amount of $370,517, stipulating that certain expenses were
not eligible for such tax credits relating to resources. Despite its disagreement with the notice of assessment, the Company recorded
a specific provision of $144,000 presented as accounts payable and accrued liabilities on the Company’s consolidated statements of
financial position at December 31, 2017 and 2016.
Outstanding Share Data
On April 26, 2018, the Company granted a total of 1,650,000 stock options to its directors, officers and consultants. The stock options
granted will vest over 2 years. The options have a five-year term and are exercisable at a price of $0.25 per share.
As at April 26, 2018, the Company has 45,690,111 common shares issued and outstanding, 295,294 share purchase warrants with
an average exercisable price of $0.45 per share, expiring at various dates until July 2019, and 2,572,800 stock options outstanding
with an average exercise price of $0.30 per share, expiring at various dates until April 2023.
BASIS OF PRESENTATION OF FINANCIAL STATEMENTS
The Company’s consolidated financial statements have been prepared in accordance with IFRS as issued by the International
Accounting Standards Board. The accounting policies, methods of computation and presentation applied in the Company’s
consolidated financial statements are consistent with those of the previous year. The significant accounting policies of NioBay,
including significant accounting judgements and estimates, are presented in Note 3 to the December 31, 2017 and 2016 consolidated
financial statements filed on SEDAR.
ACCOUNTING STANDARDS ISSUED BUT NOT YET APPLIED
Standards, amendments and interpretations issued but not yet effective up to the date of the issuance of the Company’s consolidated
financial statements that are expected to be relevant to the Company are presented in Note 3 to the December 31, 2017 and 2016
consolidated financial statements filed on SEDAR.
FINANCIAL RISK FACTORS
The Company thoroughly examines the various financial risks to which it is exposed and assesses the impact and likelihood of those
risks. These risks include foreign exchange risk, credit risk, liquidity risk and interest rate risk. Where material, these risks are reviewed
by the board of directors. These risks are described and presented in Note 11 to the December 31, 2017 and 2016 consolidated
financial statements filed on SEDAR.
Management’s Discussion and Analysis
Year ended December 31, 2017
13
OTHER RISKS AND UNCERTAINTIES
The Company is subject to a number of significant risks and uncertainties which include but are not limited to the nature of its business
and the present stage of exploration, evaluation and development of its mineral projects and the requirement for additional funds to
pursue its planned exploration, evaluation and development activities on its project. Failure to successfully address such risks and
uncertainties could have a significant negative impact on the Company’s overall operations and financial condition and could materially
affect the value of the Company’s assets and future operating results. Therefore, an investment in the securities of the Company
involves significant risks and should be considered speculative. The risks and uncertainties described herein are not necessarily the
only ones that the Company could be facing. The Company cannot give assurance that it will successfully address these risks or other
unknown risks that may affect its business. Readers should carefully consider the risks and uncertainties described below.
Company Specific Risks
• The Company has not yet been granted the exploration permit required to conduct its planned drilling program at the James
Bay Niobium Project; the granting of the exploration permit may be delayed or altogether denied by the MDNM for numerous
reasons, including the non acceptability of the exploration activities by affected stakeholders, including First Nations;
• The Company may not incur sufficient eligible flow-through eligible expenditures to spend all of the flow-through funds raised
in December 2017 by December 31, 2018, in which case the Company will be required to compensate the affected investors
for the tax impact of the renounced expenditures;
• The Company may be unable to continue funding the exploration, evaluation and development of its projects and achieve
its business objectives and milestones;
• The Company’s plans and objectives as well as its ability to raise funds may be affected by low metal prices;
• In Ontario, mineral rights are property rights that can be sold, transferred or leased. The Company is taking steps to verify
title with respect to its most material mineral properties. Although the Company believes that title to its mineral properties
are in good standing there is no guarantee that title to such properties will not be challenged or impugned;
• The Company’s mineral resources estimates are not mineral reserves. There is no assurance that minerals will be
discovered in sufficient quantities to justify commercial operations and that the Company will be able to demonstrate the
economic viability of its deposit;
• The Company may not obtain all necessary permits to conduct its activities and operate a mine;
• Future issuance of common shares into the public market may result in dilution to the existing shareholders;
• The Company faces substantial competition within the mining industry from other mineral companies with much greater
financial and technical resources;
• The Company does not expect to receive revenues from operations in the foreseeable future;
• Certain directors and senior officers of the Company also serve as officers and/or directors of other mineral resource
companies, which may give rise to conflicts.
Industry Risks
• Mineral exploration, evaluation and development is a high risk, speculative business. Few properties that are explored are
ultimately developed into producing mines.
• Mineral exploration is subject to geological uncertainties and interpretation.
Management’s Discussion and Analysis
Year ended December 31, 2017
14
• Mineral exploration is subject to numerous industry operating and environmental hazards and risks, many of which are
beyond the Company’s control.
• Substantial expenditures are required to explore mineral projects, define mineral resources, and complete all metallurgical,
engineering, environmental, financial and other studies required to complete a feasibility study.
• Changes in mining and environmental laws.
• Necessary permits to operate may not be granted or may be granted later than anticipated.
• Current economic uncertainties globally have created market volatility and risk aversion among investors, limiting capital
raising options.
• Commodity prices including the price of niobium have fluctuated in the past and may continue to do so in the future.
• Mining operations including exploration, evaluation and development activities are subject to numerous laws and regulations.
• Title to mineral rights and surface rights may be disputed.
• Social and environmental groups may be opposed to the development of mining projects.
CAUTIONARY STATEMENT REGARDING FORWARD-LOOKING STATEMENTS
This MD&A contains certain forward-looking statements as defined in applicable Canadian securities laws (referred to herein as
"forward-looking statements"). Specifically, this MD&A includes forward-looking statements regarding the Company’s strategic plans
and objectives to create long term growth and to become a major player in the production of niobium; the timing, completion and
results of planned exploration and drilling programs, planned resource estimate and planned preliminary economic assessment; future
financial results and future financings. Forward-looking statements involve a number of risks and uncertainties, and there can be no
assurance that such statements will prove to be accurate. Therefore, actual results and future events could differ materially from those
anticipated in such statements.
Risks and uncertainties that could cause results or future events to differ materially from current expectations expressed or implied by
the forward-looking statements include, but are not limited to, changes and volatility of metal prices and equity markets, the
uncertainties involved in interpreting geological data and estimating mineral resources, changes or delays in exploration plans, the
results of exploration programs, risks related to the receipt of regulatory and governmental permits and approvals, the timing and
results of consultations with the aboriginal partners, increases in costs, changes in environmental legislation and regulation, general
economic conditions and mining industry risks, as well as other risk factors discussed in this MD&A. All forward-looking statements in
this MD&A are qualified by this cautionary statement. Accordingly, readers should not place undue reliance on forward-looking
statements. The Company undertakes no obligation to update publicly or otherwise revise any forward-looking statements whether as
a result of new information or future events or otherwise, except as may be required by law.
Additional Information and Continuous Disclosure
This MD&A has been prepared as at April 26, 2018. Additional information on the Company is available through regular filings of press
releases, financial statements and MD&A on SEDAR (www.sedar.com) and on the Company’s website (www.niobaymetals.com).
CONSOLIDATED FINANCIAL STATEMENTS
Years ended December 31, 2017 and 2016
In Canadian Dollars
PricewaterhouseCoopers LLP/s.r.l./s.e.n.c.r.l. 1250 René-Lévesque Boulevard West, Suite 2500, Montréal, Quebec, Canada H3B 4Y1 T: 514 205 5000, F: 514 876 1502, www.pwc.com/ca
“PwC” refers to PricewaterhouseCoopers LLP, an Ontario limited liability partnership.
April 26, 2018
Independent Auditor’s Report
To the Shareholders of Niobay Metals Inc.
We have audited the accompanying consolidated financial statements of Niobay Metals Inc., which comprise the consolidated statements of financial position as at December 31, 2017 and 2016 and the consolidated statements of comprehensive loss, equity and cash flows for the years then ended, and the related notes, which comprise a summary of significant accounting policies and other explanatory information.
Management’s responsibility for the financial statements Management is responsible for the preparation and fair presentation of these financial statements in accordance with International Financial Reporting Standards, and for such internal control as management determines is necessary to enable the preparation of financial statements that are free from material misstatement, whether due to fraud or error.
Auditor’s responsibility Our responsibility is to express an opinion on these financial statements based on our audits. We conducted our audits in accordance with Canadian generally accepted auditing standards. Those standards require that we comply with ethical requirements and plan and perform the audit to obtain reasonable assurance about whether the financial statements are free from material misstatement.
An audit involves performing procedures to obtain audit evidence about the amounts and disclosures in the financial statements. The procedures selected depend on the auditor’s judgment, including the assessment of the risks of material misstatement of the financial statements, whether due to fraud or error. In making those risk assessments, the auditor considers internal control relevant to the entity’s preparation and fair presentation of the financial statements in order to design audit procedures that are appropriate in the circumstances, but not for the purpose of expressing an opinion on the effectiveness of the entity’s internal control. An audit also includes evaluating the appropriateness of accounting policies used and the reasonableness of accounting estimates made by management, as well as evaluating the overall presentation of the financial statements.
We believe that the audit evidence we have obtained in our audits is sufficient and appropriate to provide a basis for our audit opinion.
2
Opinion In our opinion, the financial statements present fairly, in all material respects, the financial position of Niobay Metals Inc. as at December 31, 2017 and 2016 and its financial performance and its cash flows for the years then ended in accordance with International Financial Reporting Standards.
Emphasis of matter Without qualifying our opinion, we draw attention to note 2 in the consolidated financial statements which describes matters and conditions that indicate the existence of a material uncertainty that may cast significant doubt about Niobay Metals Inc.’s ability to continue as a going concern.
1 CPA auditor, CA, public accountancy permit No. A122718
3
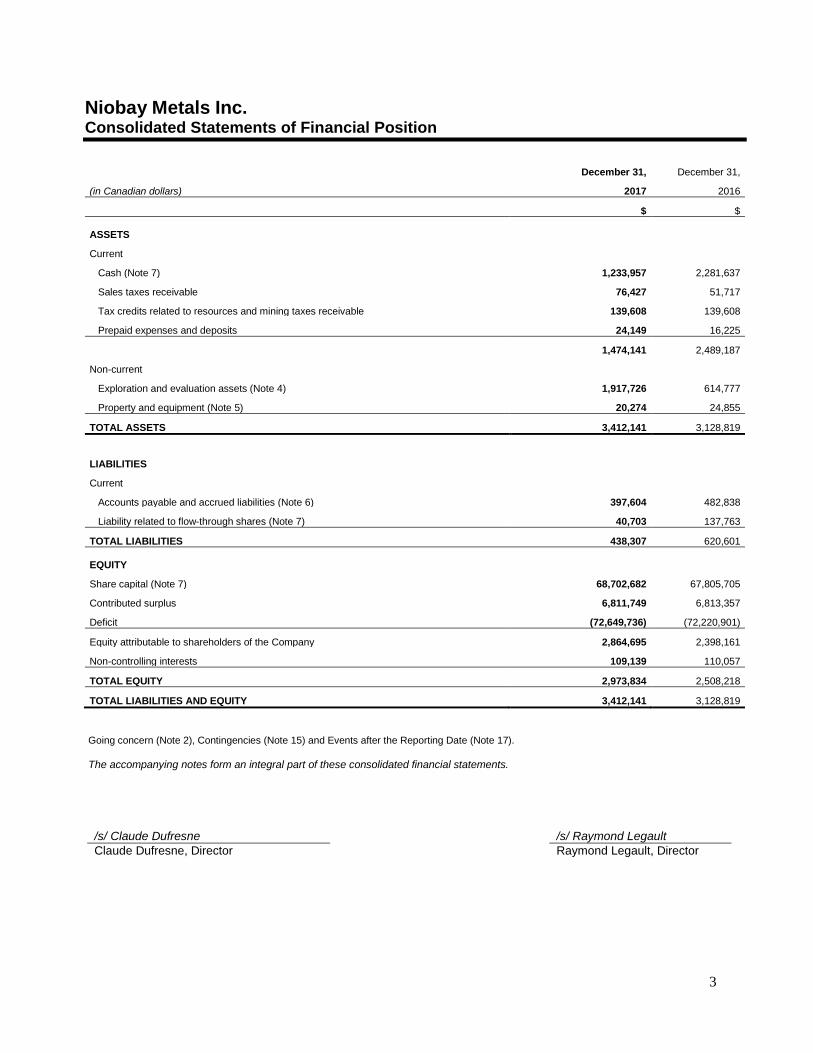
Niobay Metals Inc. Consolidated Statements of Financial Position
December 31, December 31,
(in Canadian dollars) 2017 2016
$ $
ASSETS
Current
Cash (Note 7) 1,233,957 2,281,637
Sales taxes receivable 76,427 51,717
Tax credits related to resources and mining taxes receivable 139,608 139,608
Prepaid expenses and deposits 24,149 16,225
1,474,141 2,489,187
Non-current
Exploration and evaluation assets (Note 4) 1,917,726 614,777
Property and equipment (Note 5) 20,274 24,855
TOTAL ASSETS 3,412,141 3,128,819
LIABILITIES
Current
Accounts payable and accrued liabilities (Note 6) 397,604 482,838
Liability related to flow-through shares (Note 7) 40,703 137,763
TOTAL LIABILITIES 438,307 620,601
EQUITY
Share capital (Note 7) 68,702,682 67,805,705
Contributed surplus 6,811,749 6,813,357
Deficit (72,649,736) (72,220,901)
Equity attributable to shareholders of the Company 2,864,695 2,398,161
Non-controlling interests 109,139 110,057
TOTAL EQUITY 2,973,834 2,508,218
TOTAL LIABILITIES AND EQUITY 3,412,141 3,128,819
Going concern (Note 2), Contingencies (Note 15) and Events after the Reporting Date (Note 17).
The accompanying notes form an integral part of these consolidated financial statements.
/s/ Claude Dufresne /s/ Raymond Legault
Claude Dufresne, Director Raymond Legault, Director
4
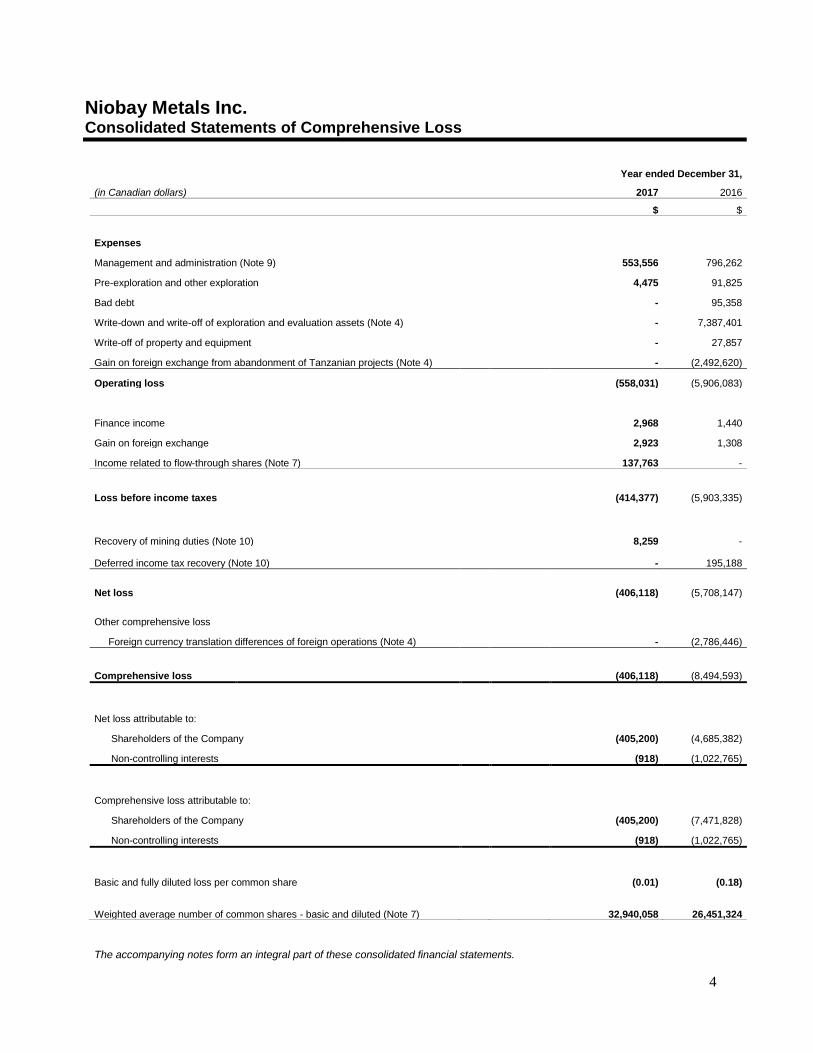
Niobay Metals Inc. Consolidated Statements of Comprehensive Loss
Year ended December 31,
(in Canadian dollars) 2017 2016
$ $
Expenses
Management and administration (Note 9)
553,556 796,262
Pre-exploration and other exploration
4,475 91,825
Bad debt
- 95,358
Write-down and write-off of exploration and evaluation assets (Note 4)
- 7,387,401
Write-off of property and equipment
- 27,857
Gain on foreign exchange from abandonment of Tanzanian projects (Note 4) - (2,492,620)
Operating loss
(558,031) (5,906,083)
Finance income
2,968 1,440
Gain on foreign exchange
2,923 1,308
Income related to flow-through shares (Note 7)
137,763 -
Loss before income taxes
(414,377) (5,903,335)
Recovery of mining duties (Note 10) 8,259 -
Deferred income tax recovery (Note 10) - 195,188
Net loss (406,118) (5,708,147)
Other comprehensive loss
Foreign currency translation differences of foreign operations (Note 4)
- (2,786,446)
Comprehensive loss
(406,118) (8,494,593)
Net loss attributable to:
Shareholders of the Company
(405,200) (4,685,382)
Non-controlling interests
(918) (1,022,765)
Comprehensive loss attributable to:
Shareholders of the Company
(405,200) (7,471,828)
Non-controlling interests
(918) (1,022,765)
Basic and fully diluted loss per common share
(0.01) (0.18)
Weighted average number of common shares - basic and diluted (Note 7)
32,940,058 26,451,324
The accompanying notes form an integral part of these consolidated financial statements.
5
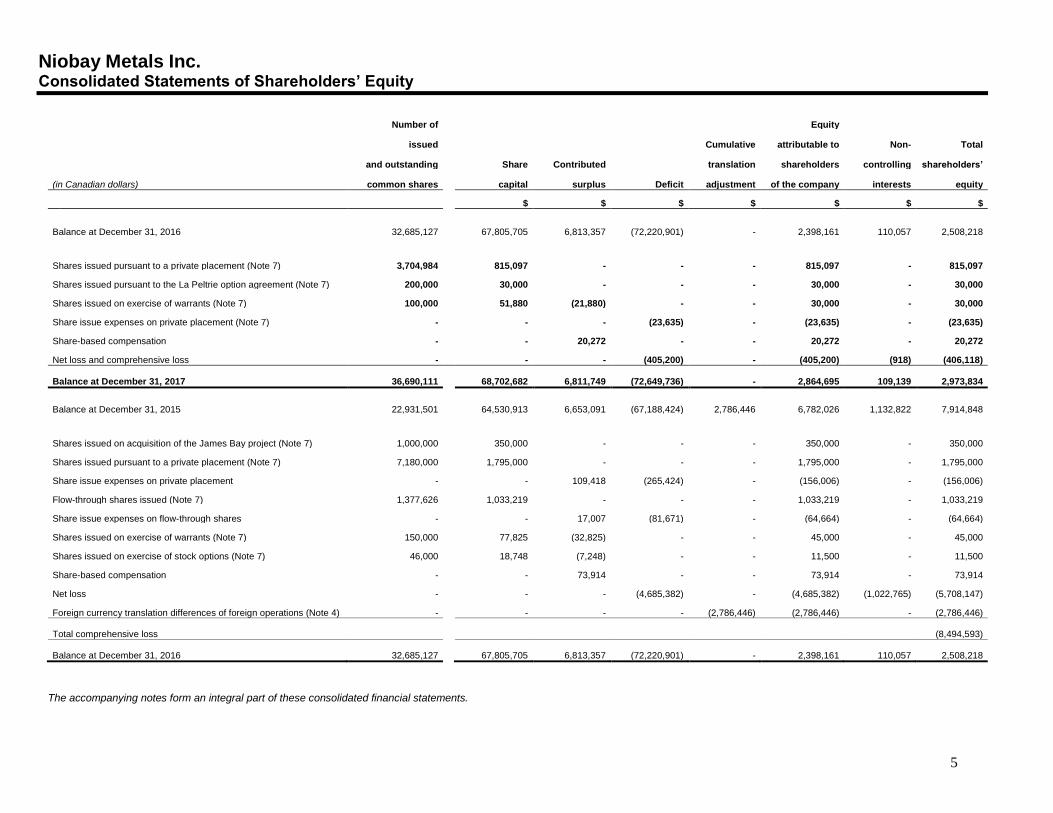
Niobay Metals Inc. Consolidated Statements of Shareholders’ Equity
Number of
Equity
issued
Cumulative attributable to Non- Total
and outstanding
Share Contributed
translation shareholders controlling shareholders’
(in Canadian dollars) common shares
capital surplus Deficit adjustment of the company interests equity
$ $ $ $ $ $ $
Balance at December 31, 2016 32,685,127
67,805,705 6,813,357 (72,220,901) - 2,398,161 110,057 2,508,218
Shares issued pursuant to a private placement (Note 7) 3,704,984 815,097 - - - 815,097 - 815,097
Shares issued pursuant to the La Peltrie option agreement (Note 7) 200,000 30,000 - - - 30,000 - 30,000
Shares issued on exercise of warrants (Note 7) 100,000 51,880 (21,880) - - 30,000 - 30,000
Share issue expenses on private placement (Note 7) - - - (23,635) - (23,635) - (23,635)
Share-based compensation - - 20,272 - - 20,272 - 20,272
Net loss and comprehensive loss - - - (405,200) - (405,200) (918) (406,118)
Balance at December 31, 2017 36,690,111
68,702,682 6,811,749 (72,649,736) - 2,864,695 109,139 2,973,834
Balance at December 31, 2015 22,931,501
64,530,913 6,653,091 (67,188,424) 2,786,446 6,782,026 1,132,822 7,914,848
Shares issued on acquisition of the James Bay project (Note 7) 1,000,000 350,000 - - - 350,000 - 350,000
Shares issued pursuant to a private placement (Note 7) 7,180,000 1,795,000 - - - 1,795,000 - 1,795,000
Share issue expenses on private placement - - 109,418 (265,424) - (156,006) - (156,006)
Flow-through shares issued (Note 7) 1,377,626 1,033,219 - - - 1,033,219 - 1,033,219
Share issue expenses on flow-through shares - - 17,007 (81,671) - (64,664) - (64,664)
Shares issued on exercise of warrants (Note 7) 150,000 77,825 (32,825) - - 45,000 - 45,000
Shares issued on exercise of stock options (Note 7) 46,000 18,748 (7,248) - - 11,500 - 11,500
Share-based compensation - - 73,914 - - 73,914 - 73,914
Net loss - - - (4,685,382) - (4,685,382) (1,022,765) (5,708,147)
Foreign currency translation differences of foreign operations (Note 4) - - - - (2,786,446) (2,786,446) - (2,786,446)
Total comprehensive loss
(8,494,593)
Balance at December 31, 2016 32,685,127
67,805,705 6,813,357 (72,220,901) - 2,398,161 110,057 2,508,218
The accompanying notes form an integral part of these consolidated financial statements.
6
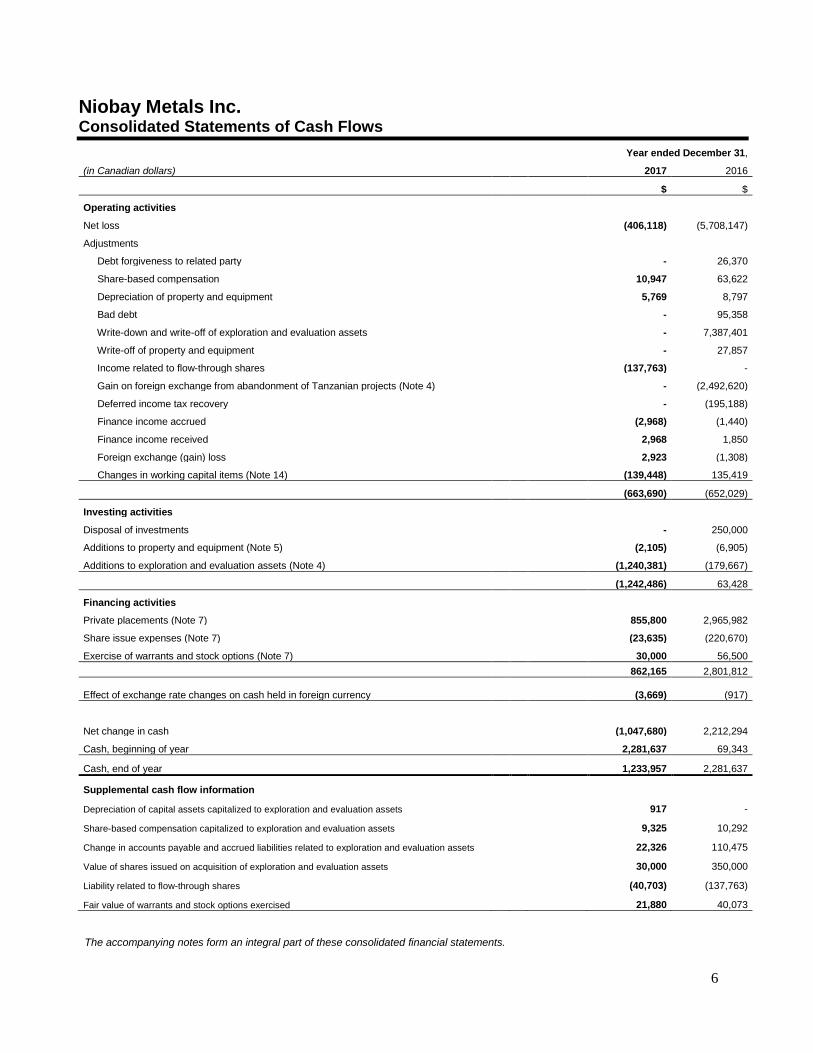
Niobay Metals Inc. Consolidated Statements of Cash Flows
Year ended December 31,
(in Canadian dollars)
2017 2016
$ $
Operating activities
Net loss (406,118) (5,708,147)
Adjustments
Debt forgiveness to related party - 26,370
Share-based compensation 10,947 63,622
Depreciation of property and equipment 5,769 8,797
Bad debt - 95,358
Write-down and write-off of exploration and evaluation assets - 7,387,401
Write-off of property and equipment - 27,857
Income related to flow-through shares (137,763) -
Gain on foreign exchange from abandonment of Tanzanian projects (Note 4) - (2,492,620)
Deferred income tax recovery - (195,188)
Finance income accrued (2,968) (1,440)
Finance income received 2,968 1,850
Foreign exchange (gain) loss 2,923 (1,308)
Changes in working capital items (Note 14) (139,448) 135,419
(663,690) (652,029)
Investing activities
Disposal of investments - 250,000
Additions to property and equipment (Note 5) (2,105) (6,905)
Additions to exploration and evaluation assets (Note 4) (1,240,381) (179,667)
(1,242,486) 63,428
Financing activities
Private placements (Note 7) 855,800 2,965,982
Share issue expenses (Note 7) (23,635) (220,670)
Exercise of warrants and stock options (Note 7) 30,000 56,500
862,165 2,801,812
Effect of exchange rate changes on cash held in foreign currency (3,669) (917)
Net change in cash (1,047,680) 2,212,294
Cash, beginning of year 2,281,637 69,343
Cash, end of year 1,233,957 2,281,637
Supplemental cash flow information
Depreciation of capital assets capitalized to exploration and evaluation assets 917 -
Share-based compensation capitalized to exploration and evaluation assets 9,325 10,292
Change in accounts payable and accrued liabilities related to exploration and evaluation assets 22,326 110,475
Value of shares issued on acquisition of exploration and evaluation assets 30,000 350,000
Liability related to flow-through shares (40,703) (137,763)
Fair value of warrants and stock options exercised 21,880 40,073
The accompanying notes form an integral part of these consolidated financial statements.
Niobay Metals Inc. Notes to Consolidated Financial Statements December 31, 2017 and 2016 (in Canadian dollars)
7
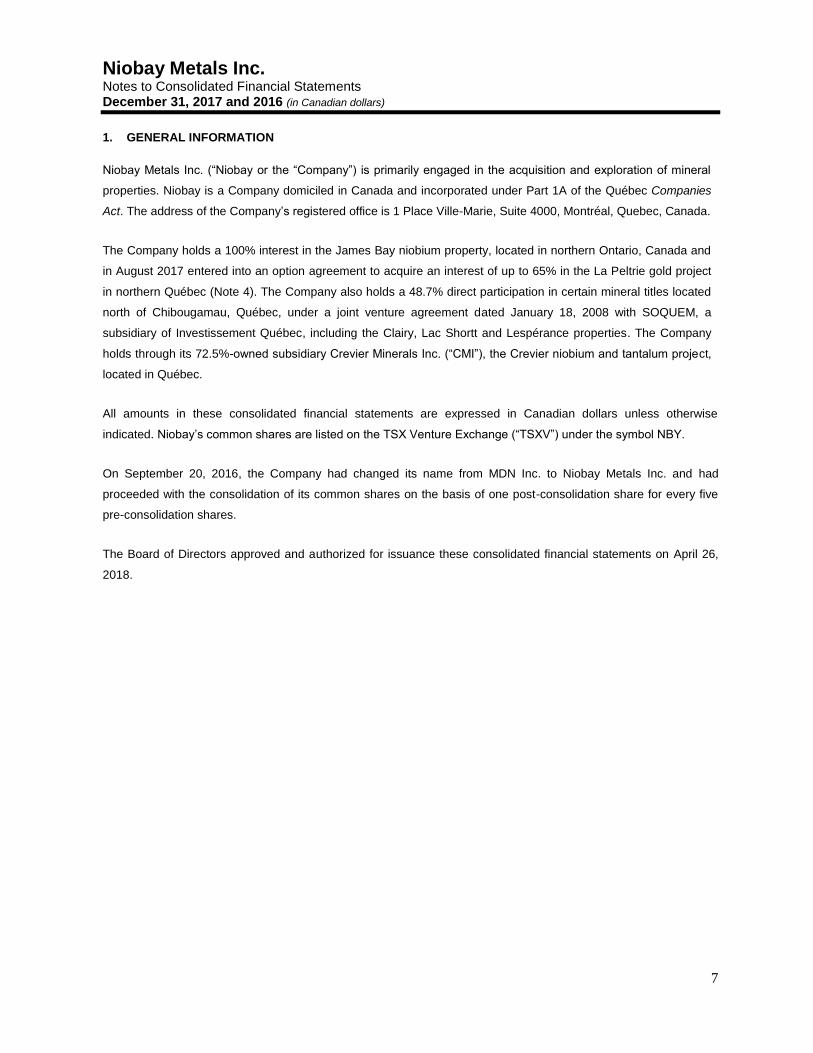
1. GENERAL INFORMATION
Niobay Metals Inc. (“Niobay or the “Company”) is primarily engaged in the acquisition and exploration of mineral
properties. Niobay is a Company domiciled in Canada and incorporated under Part 1A of the Québec Companies
Act. The address of the Company’s registered office is 1 Place Ville-Marie, Suite 4000, Montréal, Quebec, Canada.
The Company holds a 100% interest in the James Bay niobium property, located in northern Ontario, Canada and
in August 2017 entered into an option agreement to acquire an interest of up to 65% in the La Peltrie gold project
in northern Québec (Note 4). The Company also holds a 48.7% direct participation in certain mineral titles located
north of Chibougamau, Québec, under a joint venture agreement dated January 18, 2008 with SOQUEM, a
subsidiary of Investissement Québec, including the Clairy, Lac Shortt and Lespérance properties. The Company
holds through its 72.5%-owned subsidiary Crevier Minerals Inc. (“CMI”), the Crevier niobium and tantalum project,
located in Québec.
All amounts in these consolidated financial statements are expressed in Canadian dollars unless otherwise
indicated. Niobay’s common shares are listed on the TSX Venture Exchange (“TSXV”) under the symbol NBY.
On September 20, 2016, the Company had changed its name from MDN Inc. to Niobay Metals Inc. and had
proceeded with the consolidation of its common shares on the basis of one post-consolidation share for every five
pre-consolidation shares.
The Board of Directors approved and authorized for issuance these consolidated financial statements on April 26,
2018.
Niobay Metals Inc. Notes to Consolidated Financial Statements December 31, 2017 and 2016 (in Canadian dollars)
8
2. GOING CONCERN
These consolidated financial statements have been prepared using International Financial Reporting Standards
(“IFRS”) applicable to a going concern, which contemplates the realization of assets and settlement of liabilities in
the normal course of operations as they come due. In assessing whether the going concern assumption is
appropriate, management takes into account all available information about the future, which is at least, but not
limited to, twelve months from the end of the reporting period.
At December 31, 2017, the Company had a working capital of $1,035,834, had an accumulated deficit of
$72,649,736 and incurred a loss of $406,118 for the year ended December 31, 2017. Working capital included cash
of $1,233,957, of which $219,800 is restricted pursuant to a flow-through financing described in Note 7.
The Company estimates that the working capital available at December 31, 2017 will not be sufficient to cover its
general administrative expenses and its planned exploration and evaluation budget for 2018. Since the Company
does not generate cash flows, it will need to raise additional funds in the future through the issuance of debt or
equity instruments or a combination of strategic partnerships or joint venture arrangements to meet future work
requirements. While management has been successful in securing financing in the past, there can be no
assurance it will be able to do so in the future or that these sources of funding or initiatives will be available to the
Company or that they will be available on terms which are acceptable to the Company (Note 17).
If management is unable to obtain new funding, the Company may be unable to continue its operations, and
amounts realized for assets might be less than amounts reflected in these consolidated financial statements.
These circumstances indicate the existence of material uncertainties that cast significant doubt upon the
Company’s ability to continue as a going concern and accordingly, the appropriateness of the use of IFRS
applicable to a going concern. These consolidated financial statements do not reflect the adjustments to the
carrying values of assets and liabilities, expenses and financial position classifications that would be necessary if
the going concern assumption was not appropriate. These adjustments could be material.
Niobay Metals Inc. Notes to Consolidated Financial Statements December 31, 2017 and 2016 (in Canadian dollars)
9
3. SIGNIFICANT ACCOUNTING POLICIES
a) Statement of compliance
These consolidated financial statements have been prepared in accordance with IFRS as published by the
International Accounting Standards Board ("IASB"). The accounting policies followed in these consolidated
financial statements are consistent with those of the previous year.
b) Basis of measurement
These consolidated financial statements have been prepared using the historical cost basis, except for the
revaluation of certain financial instruments using fair value. In addition, these consolidated financial statements
have been prepared using the accrual basis of accounting except for cash flow information.
c) Basis of consolidation
These consolidated financial statements include the accounts of the Company and its subsidiaries, namely CMI
(72.5% interest) and MDN Tanzania Limited (“MDN Tanzania”) (100% interest).
The financial statements of the Company’s subsidiaries are included in the consolidated financial statements from
the date that control commences until the date that control ceases. The accounting policies of subsidiaries have
been changed when necessary to align them with the policies adopted by the Company.
A subsidiary which is fully consolidated but not fully owned by the Company results in a non-controlling interest that
is presented separately on the consolidated statements of comprehensive loss and the consolidated statements of
financial position.
The share of net assets of subsidiaries attributable to non-controlling interests is presented as a component of
equity. The share of net income (loss) and other comprehensive income (loss) attributable to non-controlling
interests is recognized directly in equity even if the results of the non-controlling interests have a deficit balance.
The Company treats transactions with non-controlling interests as transactions with equity shareholders. Changes
in the Company’s ownership interest in subsidiaries that do not result in loss of control are accounted for as equity
transactions.
Inter-company balances and transactions, and any unrealized income and expenses arising from inter-company
transactions, are eliminated in preparing the consolidated financial statements.
Niobay Metals Inc. Notes to Consolidated Financial Statements December 31, 2017 and 2016 (in Canadian dollars)
10
3. SIGNIFICANT ACCOUNTING POLICIES (continued)
d) Foreign currency
These consolidated financial statements are presented in Canadian dollars, which is the functional currency of
Niobay and its subsidiary CMI. Following the Company’s decision in 2016 to cease its activities in Tanzania, the
functional currency of MDN Tanzania was changed from the US dollar to the Canadian dollar.
Transactions in foreign currencies are translated to the respective functional currencies of each entity at exchange
rates at the date of transaction. Monetary assets and liabilities denominated in a foreign currency other than the
functional currency of each entity are translated at the exchange rate in effect at the reporting date. Non-monetary
assets and liabilities denominated in a foreign currency that are measured at fair value are translated at the
exchange rate at the date that the fair value was determined. Non-monetary items denominated in a foreign
currency that are measured at historical cost are translated at the exchange rate in effect at the transaction date.
Foreign currency differences arising on translation are recognized in profit or loss.
On consolidation, prior to the functional currency change, the assets and liabilities of MDN Tanzania were
translated to Canadian dollars at the exchange rate in effect at the reporting date and components of equity were
translated using the historical rate. Income and expenses were translated to Canadian dollars at the exchange rate
in effect at the transaction date. Exchange differences were presented as other comprehensive income (loss) and
recognized in the cumulative translation adjustment account in equity.
When a foreign operation is disposed of, the related amount in the cumulative translation adjustment account is
transferred to profit or loss as part of the profit or loss on disposal. On the partial disposal of a subsidiary that
includes a foreign operation, the relevant share of such cumulative amount is allocated to non-controlling interest.
In any other partial disposal of a foreign operation, the relevant proportion is reclassified to profit or loss.
Foreign exchange gains or losses arising from a monetary item which consist of a receivable from or payable to a
foreign operation, the settlement of which is neither planned nor likely to occur in the foreseeable future and which
in substance is considered to form part of the net investment in the foreign operation, are presented as other
comprehensive income (loss) and recognized in the cumulative translation adjustment account in equity.
Niobay Metals Inc. Notes to Consolidated Financial Statements December 31, 2017 and 2016 (in Canadian dollars)
11
3. SIGNIFICANT ACCOUNTING POLICIES (continued)
e) Financial instruments
Financial assets and liabilities are initially recognized at fair value plus any directly attributable transaction costs,
and their subsequent valuation is dependent on their classification.
Loans and receivables are financial assets with fixed or determinable payments that are not quoted in an active
market. Subsequent to initial recognition, loans and receivables are measured at amortized cost using the effective
interest method, less any impairment losses. The Company classified its cash as loans and receivables.
Cash includes cash and bank balances and highly liquid investments which original maturity was no more than
three months at the acquisition date.
The Company classified its trade accounts payable and accrued liabilities as financial liabilities at amortized cost.
Subsequent to initial recognition, these financial liabilities are measured at amortized cost using the effective
interest method.
Niobay Metals Inc. Notes to Consolidated Financial Statements December 31, 2017 and 2016 (in Canadian dollars)
12
3. SIGNIFICANT ACCOUNTING POLICIES (continued)
f) Exploration and evaluation assets
Mining properties correspond to acquired interests in mining exploration permits or claims which include the rights
to explore for, mine, extract and sell all minerals and metals from such claims.
All pre-exploration costs, being those costs incurred prior to obtaining the legal right to undertake exploration and
evaluation activities on an area of interest, are expensed as incurred.
Once the legal right to explore has been acquired, exploration and evaluation expenditures are capitalized in
respect of each identifiable area of interest until the technical feasibility and commercial viability of extracting a
mineral resource are demonstrable.
Exploration and evaluation expenditures for each separate area of interest are capitalized and include costs
associated with prospecting, sampling, trenching, drilling and other work involved in searching for ore like
topographical, geological, geochemical and geophysical studies. They also reflect costs related to establishing the
technical and commercial viability of extracting a mineral resource identified through exploration or acquired
through a business combination or asset acquisition. Exploration and evaluation expenditures include the cost of:
• establishing the volume and grade of deposits through drilling of core samples, trenching and sampling
activities in an ore body;
• determining the optimal methods of extraction and metallurgical and treatment processes;
• studies related to surveying, transportation and infrastructure requirements;
• permitting activities; and
• economic evaluations to determine whether development of the mineralized material is commercially
justified, including scoping, prefeasibility and final feasibility studies.
Costs incurred include appropriate technical and administrative overheads.
Exploration and evaluation assets and mining properties are carried at historical cost less any impairment losses
recognized.
When technical feasibility and commercial viability of extracting a mineral resource are demonstrable for an area of
interest, the Company stops capitalizing exploration and evaluation costs for that area, tests recognized
exploration and evaluation assets for impairment and reclassifies any unimpaired exploration and evaluation
assets either as tangible and intangible mine development assets according to the nature of the assets.
Niobay Metals Inc. Notes to Consolidated Financial Statements December 31, 2017 and 2016 (in Canadian dollars)
13
3. SIGNIFICANT ACCOUNTING POLICIES (continued)
g) Property and equipment
Property and equipment are measured at cost less accumulated depreciation and accumulated impairment losses.
Cost includes expenditures that are directly attributable to the acquisition of the asset. The costs of the day-to-day
servicing of equipment are recognized in profit or loss as incurred.
Depreciation is calculated based on the depreciable amount, which is the cost of an asset, or other amount
substituted for cost, less its residual value.
The depreciation is recorded using the declining balance method at the rate of 20% for exploration equipment,
20% for furniture and equipment and 30% for computer equipment, insofar as it best reflects the expected pattern
of realization of future economic benefits associated with the asset.
Depreciation methods, useful lives and residual values are reviewed at each financial year-end and adjusted
accordingly.
Niobay Metals Inc. Notes to Consolidated Financial Statements December 31, 2017 and 2016 (in Canadian dollars)
14
3. SIGNIFICANT ACCOUNTING POLICIES (continued)
h) Impairment of non-financial assets
The carrying amounts of mining properties and exploration and evaluation assets are assessed for impairment only
when indicators of impairment exist, typically when one of the following circumstances apply: exploration rights
have expired or will expire in the near future; no future substantive exploration expenditures are budgeted or
planned; no commercially viable quantities or minerals have been discovered and exploration and evaluation
activities will be discontinued; exploration and evaluation assets are unlikely to be fully recovered from successful
development or by sale; or a significant drop in metal prices. If any such indication exists, then the asset’s
recoverable amount is estimated.
Mining properties and exploration and evaluation assets are also assessed for impairment upon the transfer of
exploration and evaluation assets to development assets even if there are no facts and circumstances that indicate
that the carrying amount of the exploration and evaluation assets is in excess of their recoverable amount.
The recoverable amount of an asset or cash-generating unit is the greater of its value in use and its fair value less
cost to sell. In assessing value in use, the estimated future cash flows are discounted to their present value using a
pre-tax discount rate that reflects current market assessments of the time value of money and the risks specific to
the asset. For the purpose of impairment testing, assets that cannot be tested individually are grouped together
into the smallest group of assets that generates cash inflows from continuing use that are largely independent of
the cash inflows of other assets or groups of assets (the “cash-generating unit” or “CGU”). The level identified by
the Company for the purposes of testing exploration and evaluation assets and mining properties for impairment
corresponds to each property.
An impairment loss is recognized if the carrying amount of an asset or its CGU exceeds its estimated recoverable
amount. Impairment losses are recognized in profit or loss. Impairment losses recognized in respect of CGUs are
allocated to the assets in the unit (“group of units”) on a pro rata basis.
Impairment losses recognized in prior periods are assessed at each reporting date for any indications that the loss
has decreased or no longer exists. An impairment loss is reversed if there has been a change in the estimates
used to determine the recoverable amount. An impairment loss is reversed only to the extent that the asset’s
carrying amount does not exceed the carrying amount that would have been determined, net of depreciation or
amortization, if no impairment loss had been recognized.
The carrying amounts of exploration and evaluation assets and property and equipment are reviewed at each
reporting date to determine whether there is any indication of impairment.
Niobay Metals Inc. Notes to Consolidated Financial Statements December 31, 2017 and 2016 (in Canadian dollars)
15
3. SIGNIFICANT ACCOUNTING POLICIES (continued)
i) Provisions
A provision is recognized if, as a result of a past event, the Company has a present legal or constructive obligation
that can be estimated reliably, and it is probable that an outflow of economic benefits will be required to settle the
obligation.
j) Share capital
Common shares are classified as equity. Expenses directly attributable to the issue of common shares are
presented as a deduction of deficit, net of any tax effects.
k) Flow-through financing
The Canadian tax legislation permits an entity to issue securities to investors whereby the deductions for tax
purposes relating to resource expenditures may be claimed by the investors and not by the entity. These securities
are referred to as flow-through shares. The Company finances a portion of its exploration programs with flow-
through shares.
At the time that flow-through shares are issued, the Company allocates the proceeds between share capital and an
obligation to deliver the tax deductions, which is recorded as a liability related to flow-through shares. The
Company estimates the fair value of the liability using the residual method, by comparing the price of the flow-
through share to the quoted price of the Company’s share at the date of the announcement of the financing.
A Company may renounce the deductions for tax purposes under either what is referred to as the “general” method
or the “look-back” method. When tax deductions are renounced under the general method, and the Company has
the expectation of renouncing and has capitalized the expenditures during the current year, then the entity records
a deferred tax liability with a corresponding income tax expense. The liability is reduced to zero and a
corresponding income is recorded. When tax deductions are renounced under the look-back method, the Company
records a deferred tax liability with a corresponding income tax expense when expenditures are made and
capitalized. At that time, the liability is reduced to zero and a corresponding income is recorded.
Niobay Metals Inc. Notes to Consolidated Financial Statements December 31, 2017 and 2016 (in Canadian dollars)
16
3. SIGNIFICANT ACCOUNTING POLICIES (continued)
l) Share-based payments
The fair value of share-based payment awards granted to directors and employees is recognized as a
compensation expense, with a corresponding increase to contributed surplus, over the period that the employees
unconditionally become entitled to the awards. The amount recognized as an expense is adjusted to reflect the
number of options granted for which the related service and non-market performance conditions are expected to
be met, such that the amount ultimately recognized as an expense is based on the number of options granted that
do meet the related service and non-market performance conditions at the vesting date.
m) Finance income
Finance income is recorded using the effective interest method in profit or loss. Finance income received is
classified under operating activities in the consolidated statements of cash flows.
Niobay Metals Inc. Notes to Consolidated Financial Statements December 31, 2017 and 2016 (in Canadian dollars)
17
3. SIGNIFICANT ACCOUNTING POLICIES (continued)
n) Income taxes
The income tax expense includes current and deferred tax. Current tax and deferred tax are recognized in profit or
loss, except to the extent that they relate to a business combination, or items recognized directly in equity or in
other comprehensive income (loss).
Current tax is the expected tax payable or receivable on the taxable income or loss for the year, using tax rates
enacted or substantively enacted at the reporting date, and any adjustment to tax payable in respect of previous
years.
Deferred tax is recognized in respect of temporary differences between the carrying amounts of assets and
liabilities for financial reporting purposes and the amounts used for taxation purposes. Deferred tax is not
recognized for the following temporary differences: the initial recognition of assets or liabilities in a transaction that
is not a business combination and that affects neither accounting nor taxable profit or loss, and differences relating
to investments in subsidiaries and jointly controlled entities to the extent that it is probable that they will not reverse
in the foreseeable future. In addition, deferred tax is not recognized for taxable temporary differences arising on
the initial recognition of goodwill.
Deferred taxes are recognized as income or expense in profit or loss except to the extent that tax arises from
business combinations and transactions recognized in equity. When deferred taxes relate to equity items, a
retroactive analysis is necessary to determine the adjustment to taxes (for example a change in tax rates or a
change in the valuation allowance) that should be recorded in equity.
For this purpose, the accounting policy of the Company is to allocate changes in the recognition of deferred tax
assets based on their expected maturity date.
Deferred tax is measured at the tax rates that are expected to be applied to temporary differences when they
reverse, based on the laws that have been enacted or substantively enacted at the reporting date. Deferred tax
assets and liabilities are offset if there is a legally enforceable right to offset current tax liabilities and assets, and
they relate to income taxes levied by the same tax authority for the same taxable entity, or for different taxable
entities, but they intend to settle current tax liabilities and assets on a net basis or their tax assets and liabilities wil l
be realized simultaneously.
A deferred tax asset is recognized for unused tax losses and deductible temporary differences, to the extent that it
is probable that future taxable profits will be available against which they can be utilized. Deferred tax assets are
reviewed at each reporting date and are reduced to the extent that it is no longer probable that the related tax
benefit will be realized.
Niobay Metals Inc. Notes to Consolidated Financial Statements December 31, 2017 and 2016 (in Canadian dollars)
18
3. SIGNIFICANT ACCOUNTING POLICIES (continued)
o) Refundable credit on mining duties and refundable tax credit related to resources
The Company is eligible for a refundable credit on mining duties under the Québec Mining Duties Act. This
refundable credit on mining duties is equal to 8% of expenses incurred for mining activities in Québec. The
accounting treatment for refundable credit on mining duties depends on whether management’s intention is to go
into production in the future or it is to sell its mining properties to another mining producer once the technical
feasibility and the economic viability of the properties have been demonstrated. This assessment is made for each
mining property. In the first case, the credit on mining duties is recorded as an income tax recovery under IAS 12,
Income Taxes, which generates at the same time a deferred tax liability and deferred tax expense since the
exploration and evaluation assets have no more tax basis following the Company’s election to claim the refundable
credit. In the second case, it is expected that no mining duties will be paid in the future, accordingly the credit on
mining duties is recorded as a government grant under IAS 20, Accounting for Government Grants and Disclosure
of Government Assistance, which is recorded against exploration and evaluation assets.
Prior to the recording of an impairment in 2016, the Company had determined that its intention regarding the
Crevier property was to eventually go into production. Therefore, it treats the mining tax credit on this property
under IAS 12, Income Taxes. For other properties, the mining tax credits are accounted for under IAS 20,
Accounting for Government Grants and Disclosure of Government Assistance.
The Company is also eligible for a refundable tax credit related to resources on eligible expenses incurred. The
rate of the refundable tax credit related to resources can be up to 31% of the amount of eligible expenses incurred.
This tax credit is recorded against the deferred exploration costs.
Credits related to resources and credits on mining duties recognized against exploration and evaluation
expenditures are recorded at fair value when there is reasonable assurance that they will be received and the
Company will comply with the conditions associated with the grant.
p) Earnings per share
The Company presents basic and diluted earnings per share (“EPS”) data for its common shares issued. Basic
EPS is calculated by dividing the profit or loss attributable to common shareholders of the Company by the
weighted average number of common shares outstanding during the period. Diluted EPS is determined by
adjusting the profit or loss attributable to common shareholders and the weighted average number of common
shares outstanding, for the effects of all dilutive potential common shares, which comprise warrants and share
options granted to directors and employees.
Niobay Metals Inc. Notes to Consolidated Financial Statements December 31, 2017 and 2016 (in Canadian dollars)
19
3. SIGNIFICANT ACCOUNTING POLICIES (continued)
q) Segment reporting
The Company determined that it had only one operating segment, being mining exploration and evaluation.
r) Accounting standards issued but not yet effective
Standards, amendments and interpretations issued but not yet effective up to the date of the issuance of these
consolidated financial statements that are expected to be relevant to the Company are listed below. Certain other
standards and interpretations have been issued but are not expected to have a material impact on the Company’s
consolidated financial statements.
IFRS 2, Classification and Measurement of Share-based Payment Transactions
On June 20, 2016, the IASB issued amendments to IFRS 2, Share-based Payment, clarifying how to account for
certain types of share-based payment transactions. The amendments apply for annual periods beginning on or after
January 1, 2018. As a practical simplification, the amendments can be applied prospectively. The amendments
provide requirements on the accounting for: the effects of vesting and non-vesting conditions on the measurement
of cash-settled share-based payments; share-based payment transactions with a net settlement feature for
withholding tax obligations; and a modification to the terms and conditions of a share-based payment that changes
the classification of the transaction from cash-settled to equity-settled. The Company will adopt the amendments to
IFRS 2 in its financial statements for the annual period beginning on January 1, 2018. On adoption of the
amendments, the Company does not expect any impact on its consolidated financial statements as there are no
cash-settled share-based payments.
IFRS 9, Financial Instruments
The IASB released IFRS 9, Financial Instruments (2014) (“IFRS 9”), representing the completion of its project to
replace IAS 39, Financial Instruments: Recognition and Measurement (“IAS 39”). IFRS 9 replaces the current
multiple classification and measurement models for financial assets and liabilities with a single model that has three
classification categories: amortized cost, fair value through other comprehensive income and fair value through
profit and loss. The basis of classification depends on the entity’s business model and the contractual cash flow
characteristics of the financial asset or liability. It also introduces limited changes relating to financial liabilities and
aligns hedge accounting more closely with risk management. The new standard is effective for annual periods
beginning on or after January 1, 2018 with early adoption permitted. The accounting for the instruments held by the
Company and the line item in which they are included in the consolidated statements of financial position are
unaffected by the adoption of IFRS 9, and no measurement adjustments will be required to the Company’s financial
assets and liabilities.
Niobay Metals Inc. Notes to Consolidated Financial Statements December 31, 2017 and 2016 (in Canadian dollars)
20
3. SIGNIFICANT ACCOUNTING POLICIES (continued)
r) Accounting standards issued but not yet effective (continued)
IFRS 16, Leases
In January 2016, the IASB published IFRS 16, Leases (“IFRS 16”) which will replace IAS 17, Leases (“IAS 17”).
IFRS 16 is effective for annual reporting periods beginning on or after January 1, 2019 with early application
permitted. IFRS 16 eliminates the classification as an operating lease and requires lessees to recognize a right-of-
use asset and a lease liability in the statement of financial position for all leases with exemptions permitted for short-
term leases and leases of low value assets. Leases become an on-balance-sheet liability that attract interest,
together with a new asset. The Company has yet to assess the impact of this new standard on its consolidated
financial statements.
s) Judgments, estimates and assumptions
Many of the amounts included in the consolidated financial statements require management to make judgments
and/or estimates. These judgments and estimates are continuously evaluated and are based on management’s
experience and knowledge of the relevant facts and circumstances. Actual results may differ from the amounts
included in the consolidated financial statements. Areas of significant judgment and estimates affecting the
amounts recognized in the consolidated financial statements include:
Impairment of non-financial assets
The Company’s evaluation of the recoverable amount with respect to the non-financial assets is based on
numerous assumptions and may differ significantly from actual values. The recoverable amounts are based, in
part, on certain factors that may be partially or totally outside of the Company’s control. This evaluation involves a
comparison of the estimated recoverable amounts of non-financial assets to their carrying values. The Company’s
recoverable amount estimates are based on numerous assumptions. The recoverable amount estimates may differ
from actual values and these differences may be significant and could have a material impact on the Company’s
financial position and result of operations. Assets are reviewed for an indication of impairment at each consolidated
statement of financial position date and when there are indicators of impairment. This determination requires
significant judgment. Factors which could trigger an impairment review are detailed in Note 3 h).
Niobay Metals Inc. Notes to Consolidated Financial Statements December 31, 2017 and 2016 (in Canadian dollars)
21
3. SIGNIFICANT ACCOUNTING POLICIES (continued)
s) Judgments, estimates and assumptions (continued)
Uncertain tax positions
In 2013 and 2016, the Company received notices of assessment from the Tanzanian tax authorities, which have
not yet been resolved. The Tanzanian tax authorities are claiming that the Company has not withheld sufficient
taxes and other deductions on alleged interest payments and compensation matters. The Company has not
recorded any provision related to these matters at December 31, 2017, as management believes that it has always
paid taxes in accordance with local requirements. There is uncertainty as to the final outcome in resolving these
matters. Given the uncertainty inherent in resolving the issues with the Tanzanian tax authorities, the amount of tax
and other deductions that will actually be recorded as paid, as well as the timing of such payment, could differ
materially from the accounting estimates, which would affect the Company’s financial position and cash flows
(Note 15).
The refundable tax credit related to resources and the refundable credit on mining duties (the “tax credits”) for the
current period and prior periods are measured at the amount the Company expects to recover from the tax
authorities as at the closing date. However, uncertainties remain as to the interpretation of tax rules and the
amount and timing of the recovery of such tax credits. To determine whether the expenses it incurs are eligible, the
Company must exercise considerable judgment and interpretation, which makes the recovery of tax credits
uncertain. Accordingly, there may be a significant difference between the recorded amount of tax credits receivable
and the actual amount of tax credits received following the tax authorities’ review of issues whose interpretation is
uncertain. Should such a difference arise, an adjustment would have to be made to tax credits receivable and
provisions may potentially need to be recognized for previous tax credits received by the Company. It may take
considerable time for the tax administration to render its decisions on issues related to tax credits, and it can
therefore take a long time to recover tax credits. Tax credits that the Company expects to recover within more than
one year are classified as non-current assets. The amounts recognized in the financial statements are based on
the Company’s best estimates and according to its best judgment, as stated above. However, given the uncertainty
inherent in obtaining the approval of the relevant tax authorities, the amount of tax credits that will actually be
recovered or the amount to be repaid, as well as the timing of such recovery or repayment, could differ materially
from the accounting estimates, which would affect the Company’s financial position and cash flows (Notes 6 and
15).
Going concern
The assessment of the Company’s ability to execute its strategy by funding future working capital requirements
involves judgment. Estimates and assumptions are continually assessed and are based on historical experience
and other factors, including expectations of future events that are believed to be reasonable under the
circumstances.
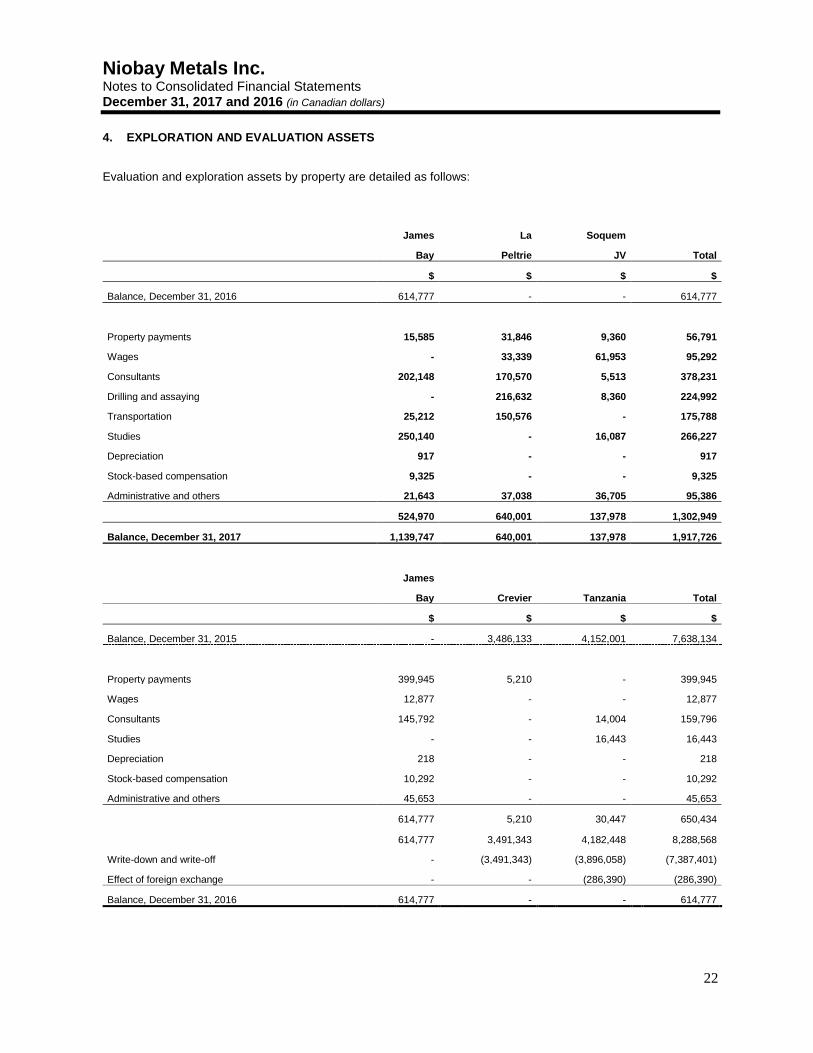
Niobay Metals Inc. Notes to Consolidated Financial Statements December 31, 2017 and 2016 (in Canadian dollars)
22
4. EXPLORATION AND EVALUATION ASSETS
Evaluation and exploration assets by property are detailed as follows:
James La Soquem
Bay Peltrie JV Total
$ $ $ $
Balance, December 31, 2016 614,777 - - 614,777
Property payments 15,585 31,846 9,360 56,791
Wages - 33,339 61,953 95,292
Consultants 202,148 170,570 5,513 378,231
Drilling and assaying - 216,632 8,360 224,992
Transportation 25,212 150,576 - 175,788
Studies 250,140 - 16,087 266,227
Depreciation 917 - - 917
Stock-based compensation 9,325 - - 9,325
Administrative and others 21,643 37,038 36,705 95,386
524,970 640,001 137,978 1,302,949
Balance, December 31, 2017 1,139,747 640,001 137,978 1,917,726
James
Bay Crevier Tanzania Total
$ $ $ $
Balance, December 31, 2015 - 3,486,133 4,152,001 7,638,134
Property payments 399,945 5,210 - 399,945
Wages 12,877 - - 12,877
Consultants 145,792 - 14,004 159,796
Studies - - 16,443 16,443
Depreciation 218 - - 218
Stock-based compensation 10,292 - - 10,292
Administrative and others 45,653 - - 45,653
614,777 5,210 30,447 650,434
614,777 3,491,343 4,182,448 8,288,568
Write-down and write-off - (3,491,343) (3,896,058) (7,387,401)
Effect of foreign exchange - - (286,390) (286,390)
Balance, December 31, 2016 614,777 - - 614,777
Niobay Metals Inc. Notes to Consolidated Financial Statements December 31, 2017 and 2016 (in Canadian dollars)
23
4. EXPLORATION AND EVALUATION ASSETS (continued)
La Peltrie Project, Québec
On September 5, 2017, the Company entered into an option agreement with Midland Exploration Inc. (“Midland”) to
acquire up to a 65% interest in the La Peltrie gold property (“La Peltrie Project”) located in Québec, Canada. The La
Peltrie Project consists of 520 claims totaling approximately 287 square kilometers. The option will be valid for a
period of six years. To earn a 50% interest in the La Peltrie Project, the Company has issued to Midland on
September 18, 2017, a total of 200,000 common shares valued at $30,000, and will have to pay, in cash or in
common shares, $30,000, $50,000, $70,000 and $70,000 on or before respectively August 31, 2018, 2019, 2020
and 2021. The Company will also have to spend $3,000,000 in exploration expenditures by August 31, 2021
including a firm commitment of $500,000 which was to be invested by December 31, 2017. Following the initial earn-
in of a 50% interest, Niobay will be entitled to earn an additional 15% interest in the project by completing a
preliminary economic assessment by August 1, 2023.
James Bay, Ontario
On June 22, 2016, the Company completed the acquisition of the James Bay niobium property, located in northern
Ontario, from Barrick Gold Inc., James Bay Columbium Ltd. and Goldcorp Inc. (the “Sellers”). In exchange for a
100% interest in the property, the Company issued to the Sellers a total of 1,000,000 common shares and paid a
cash consideration of $25,000. The Sellers retain a 2% net smelter returns royalty (“Royalty”) over all metals
produced from the property. The Company has the right to buy-back 1% of the Royalty for an amount of $2,000,000
(in constant 2016 dollars, subject to a cap of $3,000,000) at any time. Moreover, the Sellers have the right to re-
acquire a 51% interest in the property (the “Back-in Right”), in case of the establishment on the property of one or
more deposits containing no less than 2 million gold ounces and/or gold equivalent ounces of resources in
aggregate, upon payment by the Sellers to the Company of 2.5 times the Company’s expenditures incurred on the
property. The Back-In Right does not apply to the niobium content. The property rights are held through a Crown
mining lease recorded in the name of the Company. The lease was last renewed for a term of 10 years which
expired on February 28, 2018. In November 2017, the Company filed a renewal application and paid the required
rental fees to renew the mining lease for an additional 10-year term.
The acquisition cost of the James Bay property includes an amount of $350,000 representing the value of the
shares issued, using the closing price of the shares on June 21, 2016, the cash consideration of $25,000 and legal
and regulatory fees of $24,945.
Niobay Metals Inc. Notes to Consolidated Financial Statements December 31, 2017 and 2016 (in Canadian dollars)
24
4. EXPLORATION AND EVALUATION ASSETS (continued)
Joint venture agreement with SOQUEM, Quebec
In January 2008, the Company had entered into a joint venture agreement with SOQUEM, a subsidiary of
Investissement Québec, for the exploration and development of certain mineral titles located north of Chibougamau,
Québec including the Clairy, Lac Shortt and Lespérance properties. At December 31, 2017 the Company holds a
48.7% direct participation in these mineral titles.
Crevier, Quebec
Following the acquisition of the James Bay property in June 2016, the Company established that its focus would be
the development of the James Bay property in Northern Ontario. Given the above and the significant amount of
investments that would be required to potentially establish economic resources at Crevier, the Company proceeded
with writing-off to nil in 2016 its investment in the project, thus estimating no recoverable value of the Crevier
property (write-off of $3,491,343 in 2016). The write-down resulted in the reversal of the remaining deferred income
tax liability of $195,188 and a corresponding deferred income tax recovery was recorded in 2016.
The Company has a non-expiring right to acquire an additional interest of 15% in CMI by paying in cash or in
shares, at the option of the Company, $750,000 to the non-controlling shareholder.
Ikungu and Ikungu East, Tanzania
In 2016, the Company ceased all activities in Tanzania, following the non-renewal of 2 of its permits, and the
Company proceeded with writing-off in 2016 its investments in the Tanzanian properties, thus estimating no
recoverable value of the Ikungu and Ikungu East properties (write-off of $3,896,058 in 2016).
Following the decision to abandon the Tanzanian operations and the related winding down of the activities, the
cumulative translation adjustment amounting to $2,492,620 was transferred from other comprehensive loss to “Gain
on foreign exchange from abandonment of Tanzanian projects” in the 2016 consolidated statements of loss.
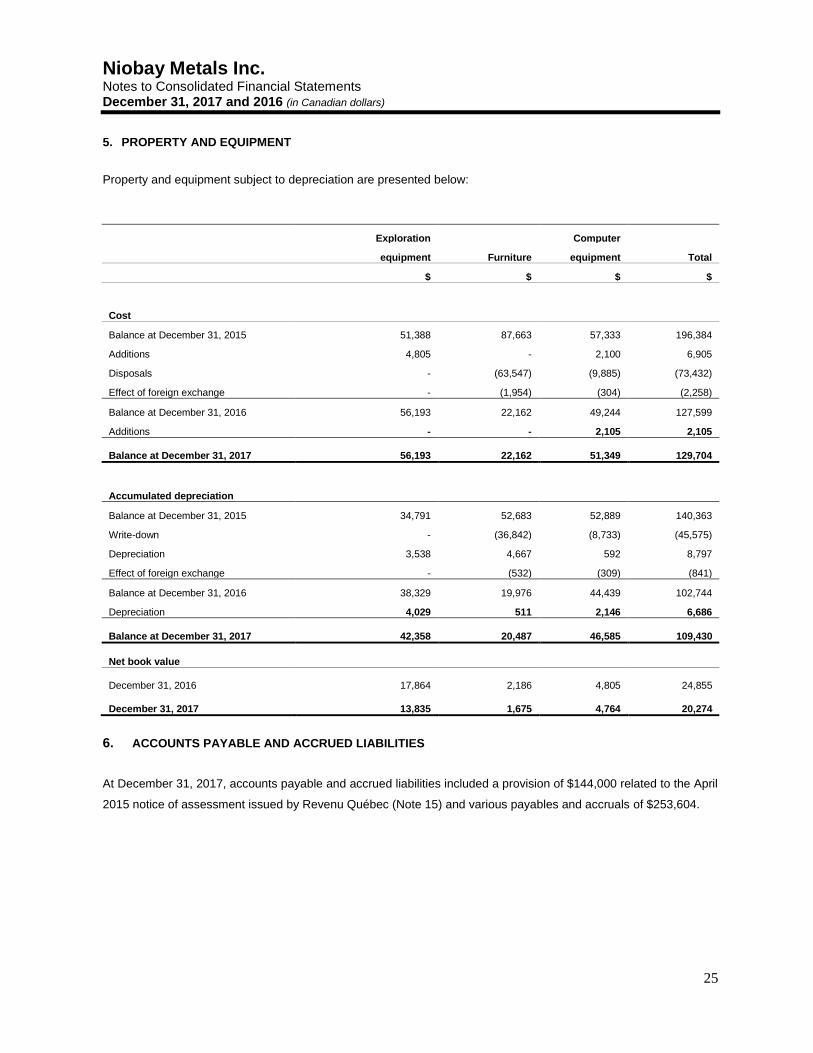
Niobay Metals Inc. Notes to Consolidated Financial Statements December 31, 2017 and 2016 (in Canadian dollars)
25
5. PROPERTY AND EQUIPMENT
Property and equipment subject to depreciation are presented below:
Exploration Computer
equipment Furniture equipment Total
$ $ $ $
Cost
Balance at December 31, 2015 51,388 87,663 57,333 196,384
Additions 4,805 - 2,100 6,905
Disposals - (63,547) (9,885) (73,432)
Effect of foreign exchange - (1,954) (304) (2,258)
Balance at December 31, 2016 56,193 22,162 49,244 127,599
Additions - - 2,105 2,105
Balance at December 31, 2017 56,193 22,162 51,349 129,704
Accumulated depreciation
Balance at December 31, 2015 34,791 52,683 52,889 140,363
Write-down - (36,842) (8,733) (45,575)
Depreciation 3,538 4,667 592 8,797
Effect of foreign exchange - (532) (309) (841)
Balance at December 31, 2016 38,329 19,976 44,439 102,744
Depreciation 4,029 511 2,146 6,686
Balance at December 31, 2017 42,358 20,487 46,585 109,430
Net book value
December 31, 2016 17,864 2,186 4,805 24,855
December 31, 2017 13,835 1,675 4,764 20,274
6. ACCOUNTS PAYABLE AND ACCRUED LIABILITIES
At December 31, 2017, accounts payable and accrued liabilities included a provision of $144,000 related to the April
2015 notice of assessment issued by Revenu Québec (Note 15) and various payables and accruals of $253,604.
Niobay Metals Inc. Notes to Consolidated Financial Statements December 31, 2017 and 2016 (in Canadian dollars)
26
7. SHARE CAPITAL AND WARRANTS
Issued and fully paid
On September 20, 2016, the Company consolidated its common shares on a 1 for 5 basis. The number of shares,
warrants, stock options and loss per share data presented in these consolidated financial statements have all been
adjusted to reflect the impact of this share consolidation.
Issuance of shares
On December 22, 2017, the Company completed a non-brokered private placement by issuing 814,075 flow-through
shares at a price of $0.27 per share, for total proceeds of $219,800 and 2,890,909 common shares at a price of
$0.22 for total proceeds of $636,000. The carrying value of the flow-through shares is presented net of the liability
related to the premium on flow-through shares of $40,703 which was recorded at the date of issuance of the flow-
through shares. Given that no exploration expenditures were incurred between the date of the private placement
and December 31, 2017, the liability related to flow-through shares at December 31, 2017 remained at $40,703.
On September 18, 2017, the Company issued 200,000 common shares to Midland pursuant to the option
agreement to acquire an interest in the La Peltrie Project (Note 4). These shares were valued at an amount of
$30,000, using the 5-day weighted average price of the Niobay shares immediately before the date of the option
agreement.
On January 13, 2017, a total of 100,000 warrants were exercised for proceeds of $30,000.
On December 19, 2016, the Company completed a private placement by issuing a total of 1,377,626 flow-through
shares at a price of $0.85 per share, for total proceeds of $1,170,982. The carrying value of the flow-through shares
was presented net of the liability related to the premium on flow-through shares of $137,763 which was recorded at
the date of issuance of the flow-through shares. As part of the private placement, the Company granted 45,294
compensation warrants exercisable into 45,294 common shares at an exercise price of $1.25 per share expiring on
December 19, 2018. The fair value of the compensation warrants, estimated at $17,007 and presented as share
issue expenses, was measured based on the Black-Scholes option pricing model, using a risk-free interest rate of
0.80%, an expected life of 2 years, an annualized volatility of 130% and a dividend rate of 0%. The underlying
expected volatility was determined by reference to historical data of the Company’s share price over the expected
life of the warrants. Other issue expenses of $64,664 consisted of legal, consulting and regulatory expenses.
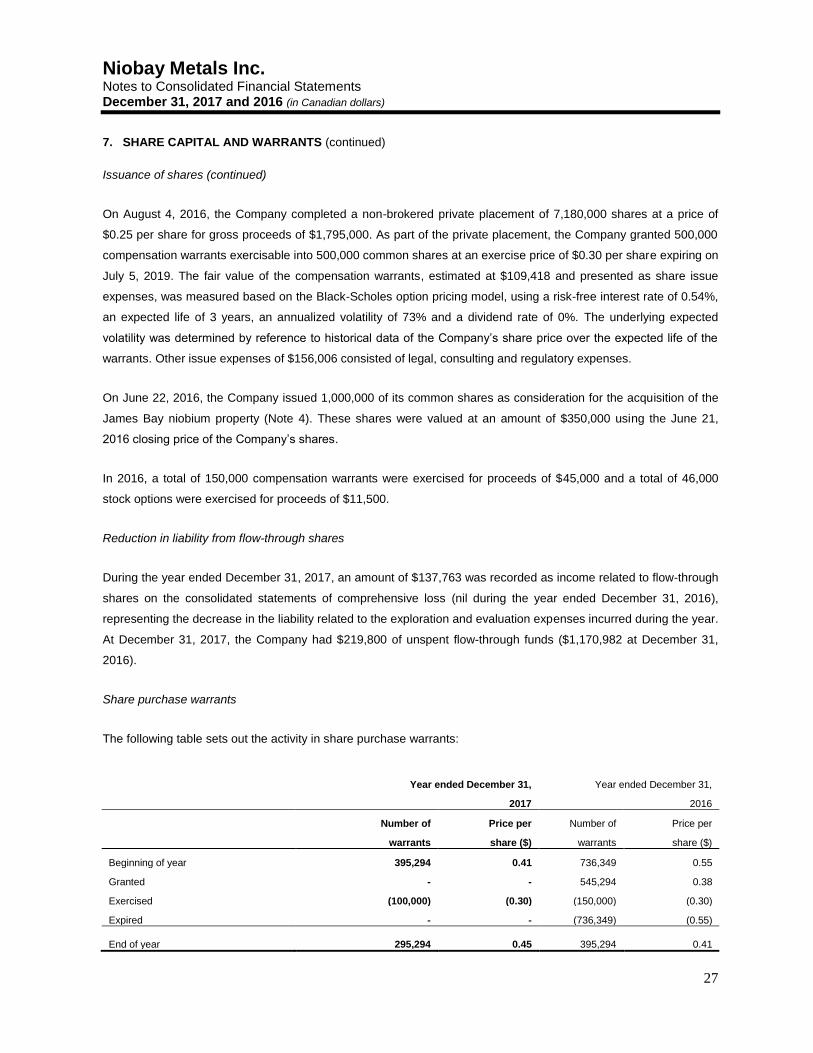
Niobay Metals Inc. Notes to Consolidated Financial Statements December 31, 2017 and 2016 (in Canadian dollars)
27
7. SHARE CAPITAL AND WARRANTS (continued)
Issuance of shares (continued)
On August 4, 2016, the Company completed a non-brokered private placement of 7,180,000 shares at a price of
$0.25 per share for gross proceeds of $1,795,000. As part of the private placement, the Company granted 500,000
compensation warrants exercisable into 500,000 common shares at an exercise price of $0.30 per share expiring on
July 5, 2019. The fair value of the compensation warrants, estimated at $109,418 and presented as share issue
expenses, was measured based on the Black-Scholes option pricing model, using a risk-free interest rate of 0.54%,
an expected life of 3 years, an annualized volatility of 73% and a dividend rate of 0%. The underlying expected
volatility was determined by reference to historical data of the Company’s share price over the expected life of the
warrants. Other issue expenses of $156,006 consisted of legal, consulting and regulatory expenses.
On June 22, 2016, the Company issued 1,000,000 of its common shares as consideration for the acquisition of the
James Bay niobium property (Note 4). These shares were valued at an amount of $350,000 using the June 21,
2016 closing price of the Company’s shares.
In 2016, a total of 150,000 compensation warrants were exercised for proceeds of $45,000 and a total of 46,000
stock options were exercised for proceeds of $11,500.
Reduction in liability from flow-through shares
During the year ended December 31, 2017, an amount of $137,763 was recorded as income related to flow-through
shares on the consolidated statements of comprehensive loss (nil during the year ended December 31, 2016),
representing the decrease in the liability related to the exploration and evaluation expenses incurred during the year.
At December 31, 2017, the Company had $219,800 of unspent flow-through funds ($1,170,982 at December 31,
2016).
Share purchase warrants
The following table sets out the activity in share purchase warrants:
Year ended December 31, Year ended December 31,
2017 2016
Number of Price per Number of Price per
warrants share ($) warrants share ($)
Beginning of year 395,294 0.41 736,349 0.55
Granted - - 545,294 0.38
Exercised (100,000) (0.30) (150,000) (0.30)
Expired - - (736,349) (0.55)
End of year 295,294 0.45 395,294 0.41
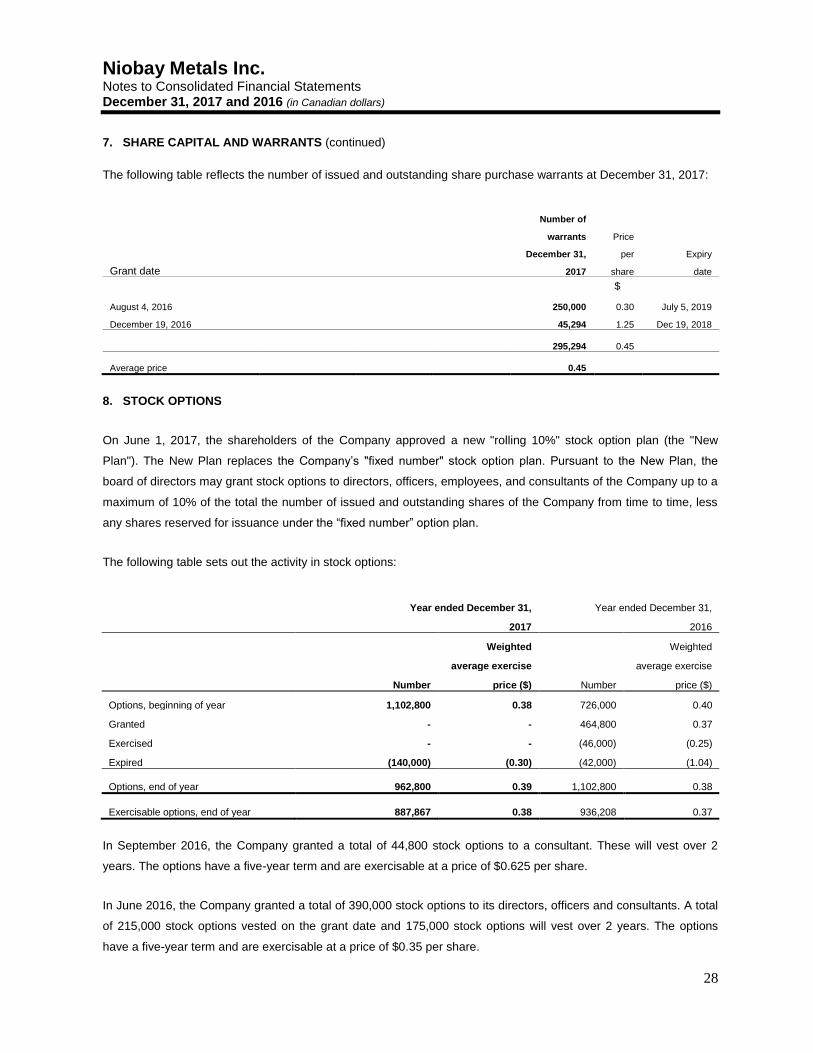
Niobay Metals Inc. Notes to Consolidated Financial Statements December 31, 2017 and 2016 (in Canadian dollars)
28
7. SHARE CAPITAL AND WARRANTS (continued)
The following table reflects the number of issued and outstanding share purchase warrants at December 31, 2017:
Number of
warrants Price
December 31, per Expiry
Grant date 2017 share date
$
August 4, 2016 250,000 0.30 July 5, 2019
December 19, 2016 45,294 1.25 Dec 19, 2018
295,294 0.45
Average price 0.45
8. STOCK OPTIONS
On June 1, 2017, the shareholders of the Company approved a new "rolling 10%" stock option plan (the "New
Plan"). The New Plan replaces the Company’s "fixed number" stock option plan. Pursuant to the New Plan, the
board of directors may grant stock options to directors, officers, employees, and consultants of the Company up to a
maximum of 10% of the total the number of issued and outstanding shares of the Company from time to time, less
any shares reserved for issuance under the “fixed number” option plan.
The following table sets out the activity in stock options:
Year ended December 31, Year ended December 31,
2017 2016
Weighted Weighted
average exercise average exercise
Number price ($) Number price ($)
Options, beginning of year 1,102,800 0.38 726,000 0.40
Granted - - 464,800 0.37
Exercised - - (46,000) (0.25)
Expired (140,000) (0.30) (42,000) (1.04)
Options, end of year 962,800 0.39 1,102,800 0.38
Exercisable options, end of year 887,867 0.38 936,208 0.37
In September 2016, the Company granted a total of 44,800 stock options to a consultant. These will vest over 2
years. The options have a five-year term and are exercisable at a price of $0.625 per share.
In June 2016, the Company granted a total of 390,000 stock options to its directors, officers and consultants. A total
of 215,000 stock options vested on the grant date and 175,000 stock options will vest over 2 years. The options
have a five-year term and are exercisable at a price of $0.35 per share.
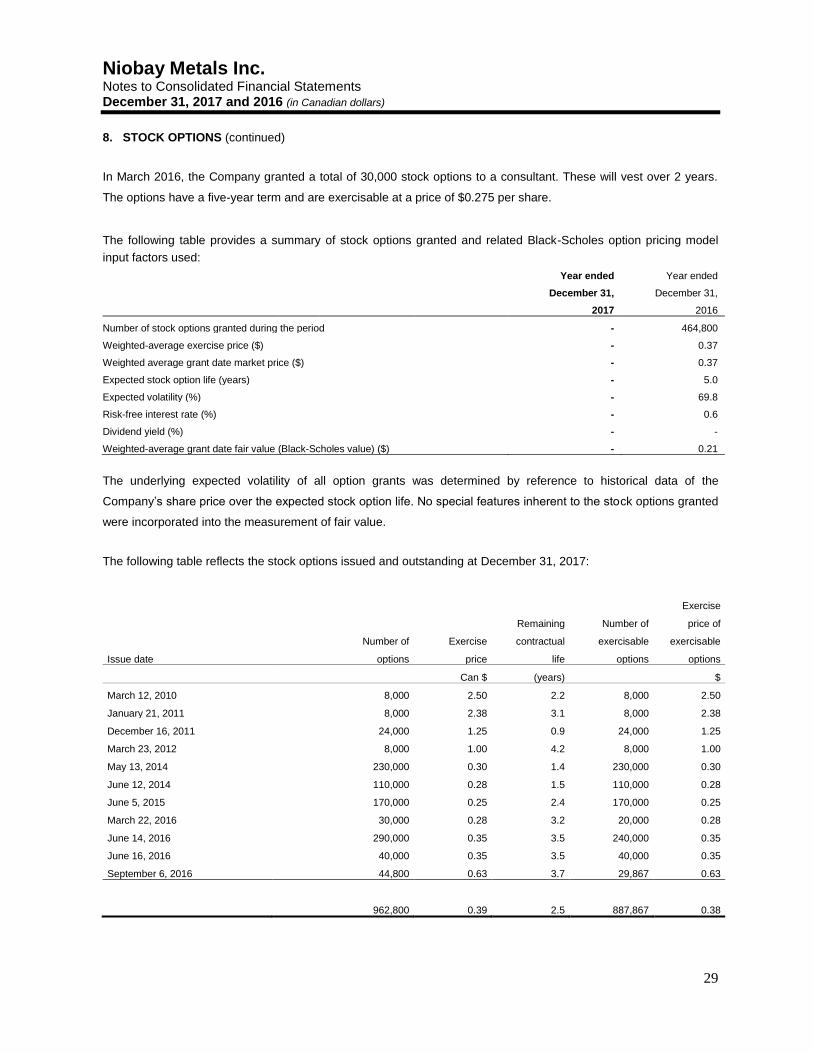
Niobay Metals Inc. Notes to Consolidated Financial Statements December 31, 2017 and 2016 (in Canadian dollars)
29
8. STOCK OPTIONS (continued)
In March 2016, the Company granted a total of 30,000 stock options to a consultant. These will vest over 2 years.
The options have a five-year term and are exercisable at a price of $0.275 per share.
The following table provides a summary of stock options granted and related Black-Scholes option pricing model
input factors used:
Year ended Year ended
December 31, December 31,
2017 2016
Number of stock options granted during the period - 464,800
Weighted-average exercise price ($) - 0.37
Weighted average grant date market price ($) - 0.37
Expected stock option life (years)
- 5.0
Expected volatility (%)
- 69.8
Risk-free interest rate (%) - 0.6
Dividend yield (%)
- -
Weighted-average grant date fair value (Black-Scholes value) ($) - 0.21
The underlying expected volatility of all option grants was determined by reference to historical data of the
Company’s share price over the expected stock option life. No special features inherent to the stock options granted
were incorporated into the measurement of fair value.
The following table reflects the stock options issued and outstanding at December 31, 2017:
Exercise
Remaining Number of price of
Number of Exercise contractual exercisable exercisable
Issue date options price life options options
Can $ (years) $
March 12, 2010 8,000 2.50 2.2 8,000 2.50
January 21, 2011 8,000 2.38 3.1 8,000 2.38
December 16, 2011 24,000 1.25 0.9 24,000 1.25
March 23, 2012 8,000 1.00 4.2 8,000 1.00
May 13, 2014 230,000 0.30 1.4 230,000 0.30
June 12, 2014 110,000 0.28 1.5 110,000 0.28
June 5, 2015 170,000 0.25 2.4 170,000 0.25
March 22, 2016 30,000 0.28 3.2 20,000 0.28
June 14, 2016 290,000 0.35 3.5 240,000 0.35
June 16, 2016 40,000 0.35 3.5 40,000 0.35
September 6, 2016 44,800 0.63 3.7 29,867 0.63
962,800 0.39 2.5 887,867 0.38
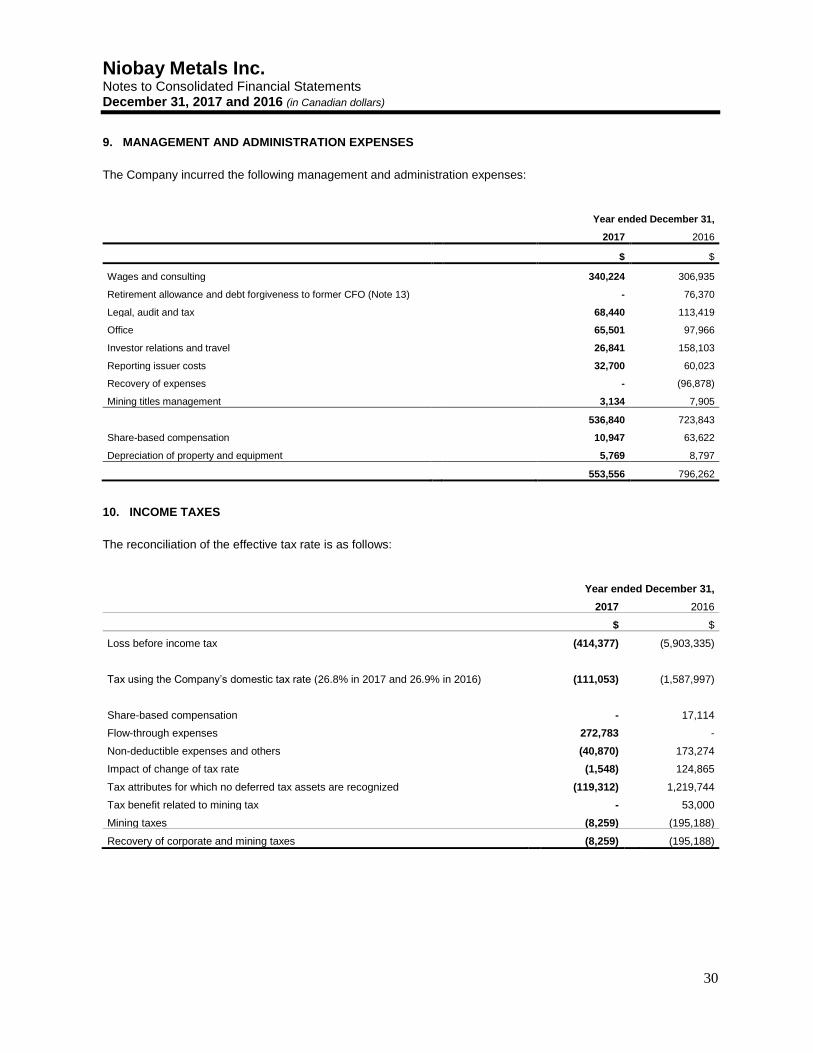
Niobay Metals Inc. Notes to Consolidated Financial Statements December 31, 2017 and 2016 (in Canadian dollars)
30
9. MANAGEMENT AND ADMINISTRATION EXPENSES
The Company incurred the following management and administration expenses:
Year ended December 31,
2017 2016
$ $
Wages and consulting 340,224 306,935
Retirement allowance and debt forgiveness to former CFO (Note 13)
- 76,370
Legal, audit and tax
68,440 113,419
Office 65,501 97,966
Investor relations and travel 26,841 158,103
Reporting issuer costs 32,700 60,023
Recovery of expenses - (96,878)
Mining titles management 3,134 7,905
536,840 723,843
Share-based compensation 10,947 63,622
Depreciation of property and equipment 5,769 8,797
553,556 796,262
10. INCOME TAXES
The reconciliation of the effective tax rate is as follows:
Year ended December 31,
2017
2016
$
$
Loss before income tax (414,377) (5,903,335)
Tax using the Company’s domestic tax rate (26.8% in 2017 and 26.9% in 2016) (111,053) (1,587,997)
Share-based compensation - 17,114
Flow-through expenses 272,783 -
Non-deductible expenses and others (40,870) 173,274
Impact of change of tax rate (1,548) 124,865
Tax attributes for which no deferred tax assets are recognized (119,312) 1,219,744
Tax benefit related to mining tax - 53,000
Mining taxes (8,259) (195,188)
Recovery of corporate and mining taxes (8,259) (195,188)
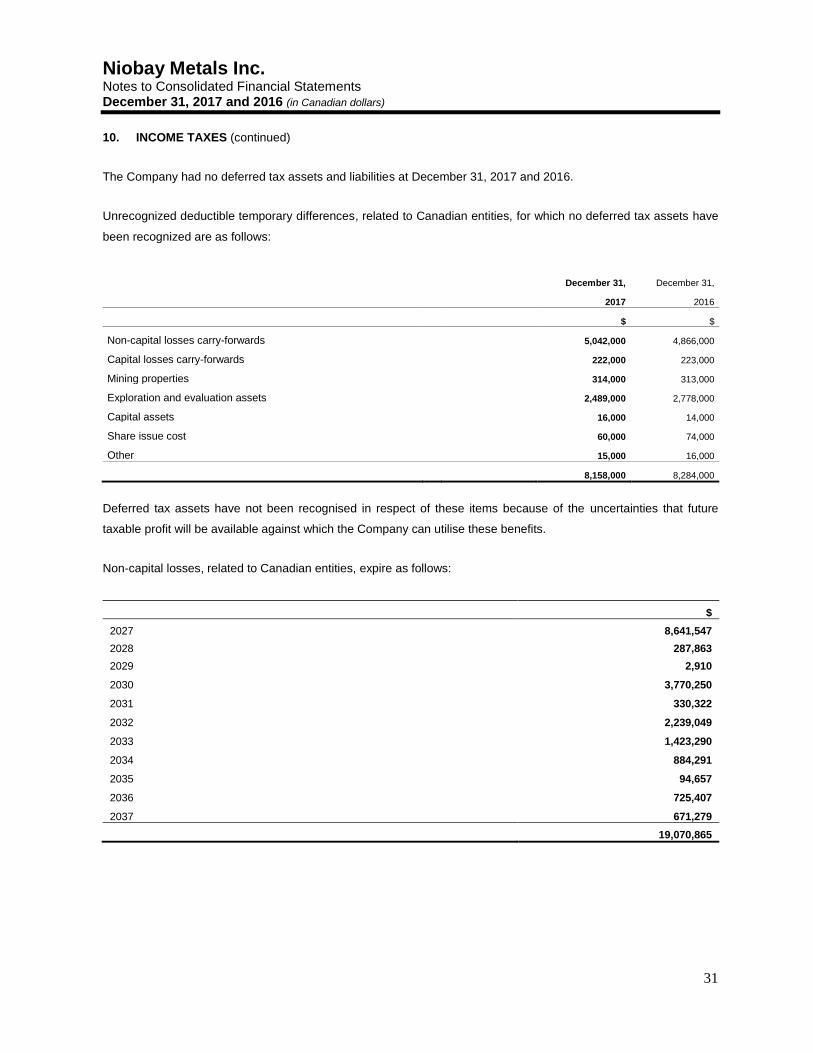
Niobay Metals Inc. Notes to Consolidated Financial Statements December 31, 2017 and 2016 (in Canadian dollars)
31
10. INCOME TAXES (continued)
The Company had no deferred tax assets and liabilities at December 31, 2017 and 2016.
Unrecognized deductible temporary differences, related to Canadian entities, for which no deferred tax assets have
been recognized are as follows:
December 31, December 31,
2017 2016
$ $
Non-capital losses carry-forwards 5,042,000 4,866,000
Capital losses carry-forwards 222,000 223,000
Mining properties 314,000 313,000
Exploration and evaluation assets 2,489,000 2,778,000
Capital assets 16,000 14,000
Share issue cost 60,000 74,000
Other 15,000 16,000
8,158,000 8,284,000
Deferred tax assets have not been recognised in respect of these items because of the uncertainties that future
taxable profit will be available against which the Company can utilise these benefits.
Non-capital losses, related to Canadian entities, expire as follows:
$
2027 8,641,547
2028 287,863
2029 2,910
2030 3,770,250
2031 330,322
2032 2,239,049
2033 1,423,290
2034 884,291
2035 94,657
2036 725,407
2037 671,279
19,070,865
Niobay Metals Inc. Notes to Consolidated Financial Statements December 31, 2017 and 2016 (in Canadian dollars)
32
11. FINANCIAL INSTRUMENTS AND FINANCIAL RISKS
Fair value
Cash and trade accounts payable and accrued liabilities are financial instruments whose fair value approximates
their carrying value due to their short-term maturity and due to market interest rates.
Foreign exchange risk
At December 31, 2017, the balance of financial assets and liabilities denominated in US dollars is not significant (a
net amount of $16,658 at December 31, 2016). A variation of 5% of the US dollar in relation with the Canadian
dollar would have a negligible effect on the loss for the years ended December 31, 2017 and 2016.
Credit risk
The credit risk is the risk that the Company is not paid by a third party who does not respect its agreement
obligations. It is mainly reflected in cash. The carrying value of the Company’s financial assets represents the
maximum credit risk exposure. The Company invests its cash in high quality titles issued by Canadian financial
institutions.
Liquidity risk
The liquidity risk is the risk the Company may encounter when payment of its obligations become due. The
Company manages its liquidity risk by using budgets allowing it to determine the necessary funds required to meet
its exploration plans and administrative expenses. Moreover, the Company ensures that the working capital is
sufficient to meet its current obligations.
At December 31, 2017, the Company had $1,233,957 in cash to meet its current liabilities of $397,604. Management
considers that these funds are insufficient to cover its general administrative expenses and its planned exploration
and evaluation budget for 2018 (Note 2).
Any future funding shortfall may be met in a number of ways, including the issuance of new equity instruments or
other measures. While management has been successful in securing financing in the past, there can be no
insurance it will be able to do so in the future, that such sources of funding or initiatives will be available to the
Company or that they will be available on terms acceptable to the Company. If management is unable to obtain new
funding, the Company may be unable to continue its operations, and amounts realized for assets might be less than
amounts reflected in these consolidated financial statements.
Niobay Metals Inc. Notes to Consolidated Financial Statements December 31, 2017 and 2016 (in Canadian dollars)
33
11. FINANCIAL INSTRUMENTS AND FINANCIAL RISKS (continued)
Interest rate risk
Interest rate risk is the risk that the fair value or future cash flows of a financial instrument will fluctuate due to
changes in market interest rates.
The Company holds the majority of its cash in interest-bearing accounts which are therefore exposed to future cash
flow fluctuations coming from changes in market interest rates. A fluctuation of 100 basis points on market interest
rate would not have a significant impact on the financial results of the Company for the year ended December 31,
2017.
12. CAPITAL MANAGEMENT
In terms of capital management, the objective of the Company is to preserve its ability to continue its mining
exploration while maintaining the current exploration programs and development of mining assets, to provide
sufficient working capital to meet its current commitments and to pursue potential investments. The capital of the
Company consists of equity attributable to shareholders of the Company of $2,864,695 ($2,398,161 at December
31, 2016).
The Company manages its capital structure and makes adjustments to it in accordance with the aforementioned
objectives, as well as in light of changes in economic conditions and the risk characteristics of the underlying assets.
Changes in capital are presented in the consolidated statements of shareholders’ equity.
Niobay Metals Inc. Notes to Consolidated Financial Statements December 31, 2017 and 2016 (in Canadian dollars)
34
13. RELATED PARTIES
Remuneration of directors and key management of the Company
The remuneration awarded to directors and to key management personnel, including the President and CEO and
the CFO, is as follows:
Year ended December 31,
2017 2016
$ $
Salaries, professional fees and other short-term benefits 257,001 176,882
Retirement allowance and debt forgiveness to former CFO - 76,370
Share-based compensation 9,795 56,663
266,796 309,915
A company controlled by the CEO of the Company invoiced $26,400 for the services of a market analyst ($43,925 in
2016) and nil for the rental of office space ($32,500 in 2016).
The Company recorded an amount of $50,000 during the year ended December 31, 2016 as retirement allowance
to the Company’s former CFO and forgave the balance of the loan owed by the former CFO in the amount of
$26,370.
Termination and Change of Control Provisions
The employment agreement between the Company’s president and CEO and the Company contain termination
without cause and change of control provisions. Assuming that the Company’s president and CEO had been
terminated without cause on December 31, 2017, the total amount payable to the Company’s president and CEO
would have totaled $143,050 and following a change in control, the amount payable would have totaled $400,000.
14. CASH FLOWS
Changes in working capital items are as follows:
Year ended December 31,
2017 2016
$ $
Sales taxes receivable (24,710) (35,517)
Tax credits related to resources and mining taxes receivable - 41,697
Prepaid expenses and deposits (7,924) (5,195)
Accounts payable and accrued liabilities (106,814) 134,434
(139,448) 135,419
Niobay Metals Inc. Notes to Consolidated Financial Statements December 31, 2017 and 2016 (in Canadian dollars)
35
15. CONTINGENCIES
Tanzania Revenue Authority (“TRA”)
MDN Tanzania Limited (“MDN Tanzania”) received notices of assessment in April and June 2016 in respect of
withholding taxes and other statutory deductions for the period from 2007 to 2011, claiming an amount of
approximately $300,000 plus accrued interest of approximately $600,000. In 2013, the Company had received
notices of assessment totalling approximately $470,000 in respect of withholding taxes on alleged interest payments
by MDN Tanzania to the Company for the period from 2004 to 2011. No provision has been recorded in these
consolidated financial statements on these matters as management believes that it has always paid its withholding
taxes and other statutory deductions in accordance with local requirements and that the amounts claimed are
unfounded. MDN Tanzania continues to vigorously defend its position with the Tanzanian tax authorities.
Revenu Québec
Following an audit of the tax credits relating to resources claimed by and paid to CMI for the years 2010, 2011 and
2012, Revenu Québec issued in April 2015 a notice of assessment for an amount of $370,517, stipulating that
certain expenses were not eligible for such tax credits relating to resources. Despite its disagreement with the notice
of assessment, the Company recorded a specific provision of $144,000 presented as accounts payable and accrued
liabilities at December 31, 2017 and 2016.
16. SEGMENTED INFORMATION
The Company has one reportable operating segment being the acquisition, exploration and evaluation of mineral
properties. At December 31, 2017 and 2016, all assets are located in Canada.
Niobay Metals Inc. Notes to Consolidated Financial Statements December 31, 2017 and 2016 (in Canadian dollars)
36
17. EVENTS AFTER THE REPORTING DATE
Private placement with Osisko Gold Royalties
On March 28, 2018, Osisko Gold Royalties Ltd. (“Osisko”) purchased, by way of a private placement, 9,000,000
common shares of the Company (the “Shares”) at a price of $0.26 per share for proceeds of $2,340,000 (the
“Financing”), following which Osisko owns approximately 19.7% of Niobay’s issued and outstanding Shares on a
non-diluted basis. Pursuant to the subscription agreement entered into between Niobay and Osisko in connection
with the Financing, so long as Osisko holds not less than 10% of the then issued and outstanding Shares of Niobay,
Osisko has the right to (i) nominate one director to Niobay’s board of directors and (ii) participate in all future equity
financings by Niobay to maintain its relative equity ownership. Upon closing of the Financing, Osisko was granted an
option to purchase a 1.0% royalty on all products to be produced from the James Bay niobium project. The option
will be exercisable by paying $2,000,000 to Niobay at any time within 90 days following the delivery by Niobay to
Osisko of a bankable feasibility study on the project.
Grant of stock options
On April 26, 2018, the Company granted a total of 1,650,000 stock options to its directors, officers and consultants.
The stock options granted will vest over 2 years. The options have a five year term and are exercisable at a price of
$0.25 per share.