Embed Size (px)
Citation preview
Managerial Competencies in Primary Production
The View of a Sample of New Zealand Farmers
Peter Nuthall
FHMG Research Report 04/2002
December 2002 Farm and Horticultural Management Group Lincoln University ISSN 1174-8796
i
CONTENTS
SUMMARY.................................................................................................................1
1. INTRODUCTION ..........................................................................................4
2. THE QUESTIONNAIRE AND THE SAMPLE ...............................................5
3. THE RESPONDENTS ..................................................................................6
4. MANAGERIAL ATTRIBUTES......................................................................9
5. ENTREPRENEURIAL SKILLS...................................................................18
6. PERSONAL ATTRIBUTES ........................................................................25
7. MANAGERIAL STYLE...............................................................................33
8. GOALS AND AIMS ....................................................................................39
9. COMPUTER USE.......................................................................................42
10. MANAGERIAL TRAINING .........................................................................43
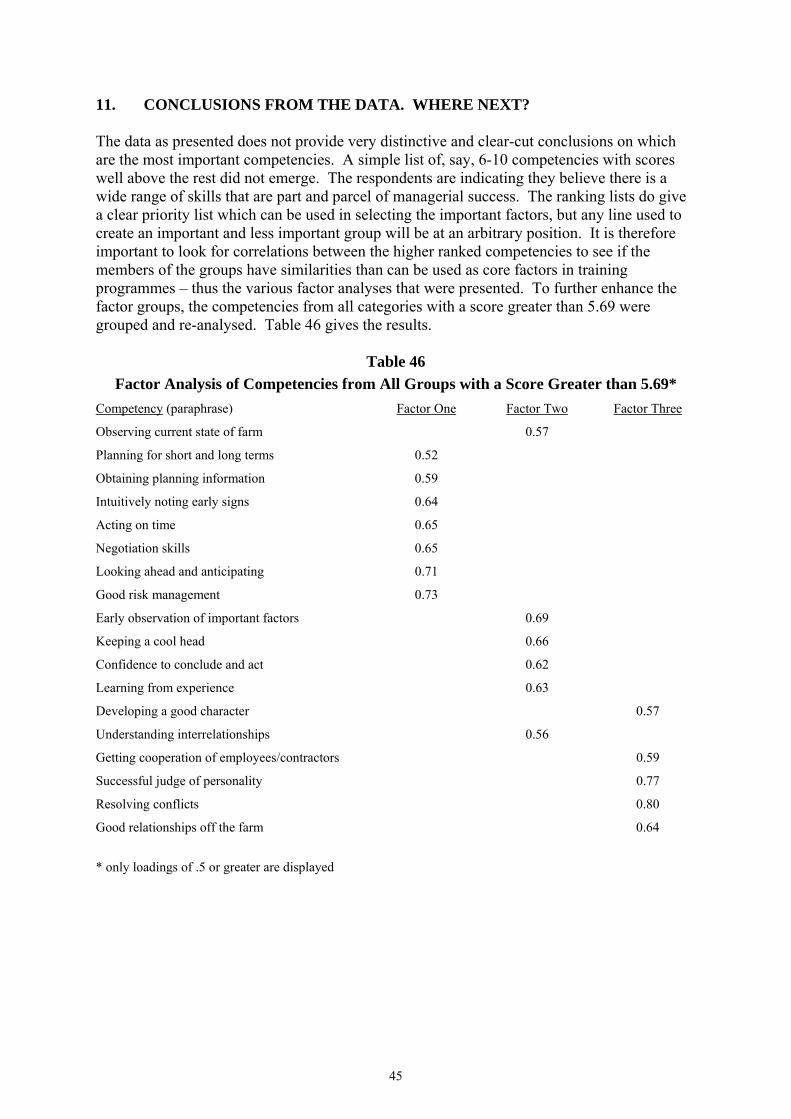
11. CONCLUSIONS FROM THE DATA. WHERE NEXT?..............................45

ii
Acknowledgements
This work received significant support from WOOLPRO (Project LU 14) in the form of financial assistance. This is gratefully acknowledged. Also acknowledged is the survey and data entry assistance provided by Sireerat Chetsumon, who was largely responsible for all this work. And, of course, the assistance of all the respondents is acknowledged. This help is crucial to all research and their time input is very much appreciated.
1
MANAGERIAL COMPETENCIES IN PRIMARY PRODUCTION
THE VIEW OF A SAMPLE OF NEW ZEALAND FARMERS
SUMMARY A mail survey designed to obtain the views of New Zealand primary producers on the important management competencies was sent to a randomly selected sample of 2300 managers in mid-February 2001. The sample was stratified according to region, farm type and area. The response rate was 41.1%. Most production units are ‘family farms’ and 92% employ, including the managers, four or less people. The five most important managerial attributes were (paraphrased): Keeping up-to-date with the current state of the property An ability to identify key factors Making requirements clearly understood (communication) Assessing job priorities Quickly sorting out new situations This priority list is very similar to that proposed by a sample from the members of the New Zealand Institute of Primary Industry Management (NZIPIM). Essentially, the important attributes involve observation, introspection (key factors, job priorities) and communication. It should also be noted, however, that other attributes were also reasonably highly ranked – see the full text. Respondents did, therefore, believe a wide range of skills were important. The ranking list was relatively stable when various sub-divisions were created using age, education, gender, managerial style, self-assessed managerial ability, profit objective variations, computer ownership and farm type. This same conclusion applied to all competencies listed below. For the entrepreneurial skills the following list gives the five highest scored competencies: Understanding deadlines and acting on time An ability to obtain information Being able to negotiate the best deal Understanding risk and reducing its impact An intuition that gives early warning signs While not ranked as highly, a factor analysis also showed that learning new skills, anticipation, and a belief that a manager can control many factors are all important components of a kit bag of skills. The most important personal attributes (paraphrased) with scores of 6 or more on a 1 to 7 scale, were: Early observation of important factors An ability to learn from experience
2
Developing a good moral character Keeping a cool head Maintaining good relationship with bankers, accountants …… The confidence to make quick decisions and act Obtaining the co-operation of employees/contractors. A three factor correlated grouping of all personal attributes included most of this listed group in factor one. The respondents were also asked to provide information on their managerial style as this could impact on the best training packages, and whether in fact managerial skill can be improved for some styles. A factor analysis of the style components gave the following factors as the main components of style: Concern for correctness Conscientious planning Thoughtful creativity Enthusiastic communitarian Consultative logician Benign management All managers can be grouped according to their rating with respect to each of these factors. A cluster analysis with reasonable numbers in each group gave four relatively distinct clusters. Producers’ objectives may also impact on their interest in managerial training. A factor analysis of a range of scored potential goals/aims structured views into five main objectives: Making a comfortable living Improving the condition of the property Ensuring employees enjoy their jobs Minimizing pollution Maintaining good working conditions As it turned out a comparison of people with and without a strong sustainable profit motive did not impact on competency groupings or ranking. It was also found that an increasing number of managers use computers with some 55% ownership and that computer-based managerial training modules were the second choice after locally based tutored training programmes. Given the costs involved, computer-based systems are the most practical. Of all the respondents 71% said they would make use of training programmes to a greater or lesser extent. Those requesting training tended to be computer owners, female, younger and had a lower score on the self-rated managerial skill question. Finally, a factor analysis of the most highly ranked competencies from all areas clearly indicated there were three summary factors which express the respondents’ views of the important components of good management. These factors embody good skills in selecting and managing people, planning and the successful implementation of the plans, and in controlling the implementation through skills such as early observation, deciding and acting

3
quickly, and learning from experience. There are, however, many facets to each of the factors indicating improving managerial skill is probably not a simple and quick operation. On the contrary, it will involve dedication, practice and perseverance.
4
MANAGERIAL COMPETENCIES IN PRIMARY PRODUCTION
THE VIEW OF A SAMPLE OF NEW ZEALAND FARMERS
1. INTRODUCTION This is the second report in a two-component study which ranks the managerial competencies thought to be important in primary production. This ranking is part of the process of selecting which competencies, or skills, to target in developing training programmes for use by sheep farm managers. The competencies targeted are not technical skills, which are, of course, equally important, but aspects of the management process concerned with deciding on which products to produce, how to produce them in terms of the input mixes to use, the quantities of both products (outputs) and inputs, all the timing aspects of the actions necessary, together with all the other myriads of decisions that must be made in running a primary producing property. Thus, the decision making (planning), implementation of the decisions, and control of the whole production process are the areas of concern. In the first report the views of a major sample of members of the New Zealand Institute of Primary Industry Management were presented (Farm and Horticultural Management Group Research Report 03/2002). The relevant parts of the results of this survey will be reported again in this report to enable comparisons with the farmers’ own views. However, the first report should be read in conjunction with this one to provide background material. The report contains brief comments on the questionnaire used, but then focuses on presenting the results in several sections. The sections cover the different competency areas as well as providing details of the characteristics of the respondents (age, education, farm type…….). Information on the farmers’ objectives is also given as these may influence their conception of the important skills. The survey was also used to obtain data on farmers’ computer use as computer-based training packages may be a cost effective way of providing training. Views on the likely use of managerial skill training and the preferred training method were also obtained.
5
2. THE QUESTIONNAIRE AND THE SAMPLE To enable reaching the maximum number of farmers within the financial constraints a mail survey was used. The nature of the questions meant this was a practical approach likely to succeed. The questionnaire was developed after reading the literature on competencies (Farm and Horticultural Management Group Research Report 03/2002) and discussing the possibilities with consultants. The schedule finally used after pre-testing is presented in Appendix A. Besides using a number of consultants, the questionnaire was sent to thirty farmers for testing purposes and subsequently modified according to their comments. This testing occurred over October/November 2000 with the finalised schedules being posted to 2300 farmers in mid-February 2001. Subsequently a reminder letter was posted to those not initially responding. The list of farmers was obtained from Quotable Value New Zealand’s records of all producers. This was divided into sixteen statistical regions, six farm type groupings (intensive and extensive sheep, cattle, deer, dairy, cropping and horticulture) and twelve (hectare) groups. The number selected from each group was based on the proportion of the total population in the group using a random selection procedure. The database contained approximately 39,000 farmers that were thought to be full time operators. Unfortunately approximately 300 questionnaires were returned due to deaths, retirements, or just simply ‘gone – no forwarding address’. In the end 823 usable responses were obtained giving a response rate of approximately 41.1%, which compares favourably with the 43.5% obtained from the NZIPIM members. The response norm for postal surveys is one-third.
6
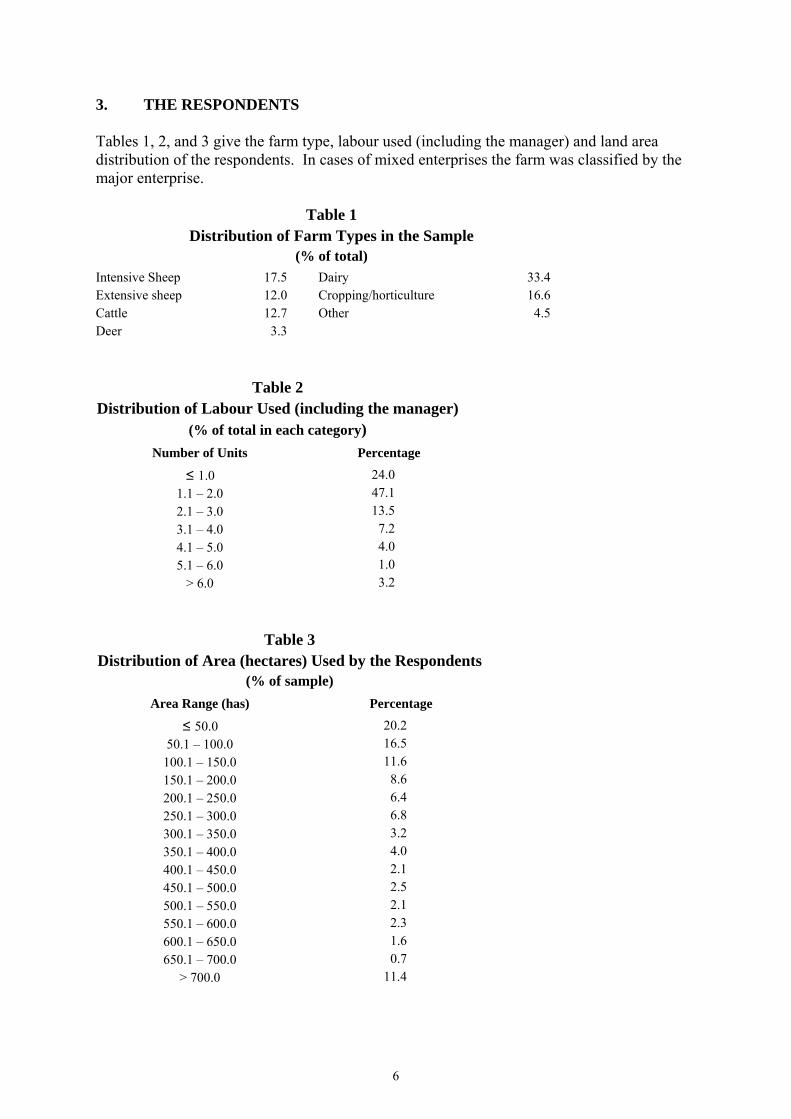
3. THE RESPONDENTS Tables 1, 2, and 3 give the farm type, labour used (including the manager) and land area distribution of the respondents. In cases of mixed enterprises the farm was classified by the major enterprise.
Table 1 Distribution of Farm Types in the Sample
(% of total) Intensive Sheep Extensive sheep Cattle Deer
17.5 12.0 12.7 3.3
Dairy Cropping/horticulture Other
33.4 16.6 4.5
Table 2 Distribution of Labour Used (including the manager)
(% of total in each category) Number of Units Percentage
≤ 1.0 1.1 – 2.0 2.1 – 3.0 3.1 – 4.0 4.1 – 5.0 5.1 – 6.0
> 6.0
24.0 47.1 13.5
7.2 4.0 1.0 3.2
Table 3 Distribution of Area (hectares) Used by the Respondents
(% of sample) Area Range (has) Percentage
≤ 50.0 50.1 – 100.0
100.1 – 150.0 150.1 – 200.0 200.1 – 250.0 250.1 – 300.0 300.1 – 350.0 350.1 – 400.0 400.1 – 450.0 450.1 – 500.0 500.1 – 550.0 550.1 – 600.0 600.1 – 650.0 650.1 – 700.0
> 700.0
20.2 16.5 11.6
8.6 6.4 6.8 3.2 4.0 2.1 2.5 2.1 2.3 1.6 0.7
11.4
7
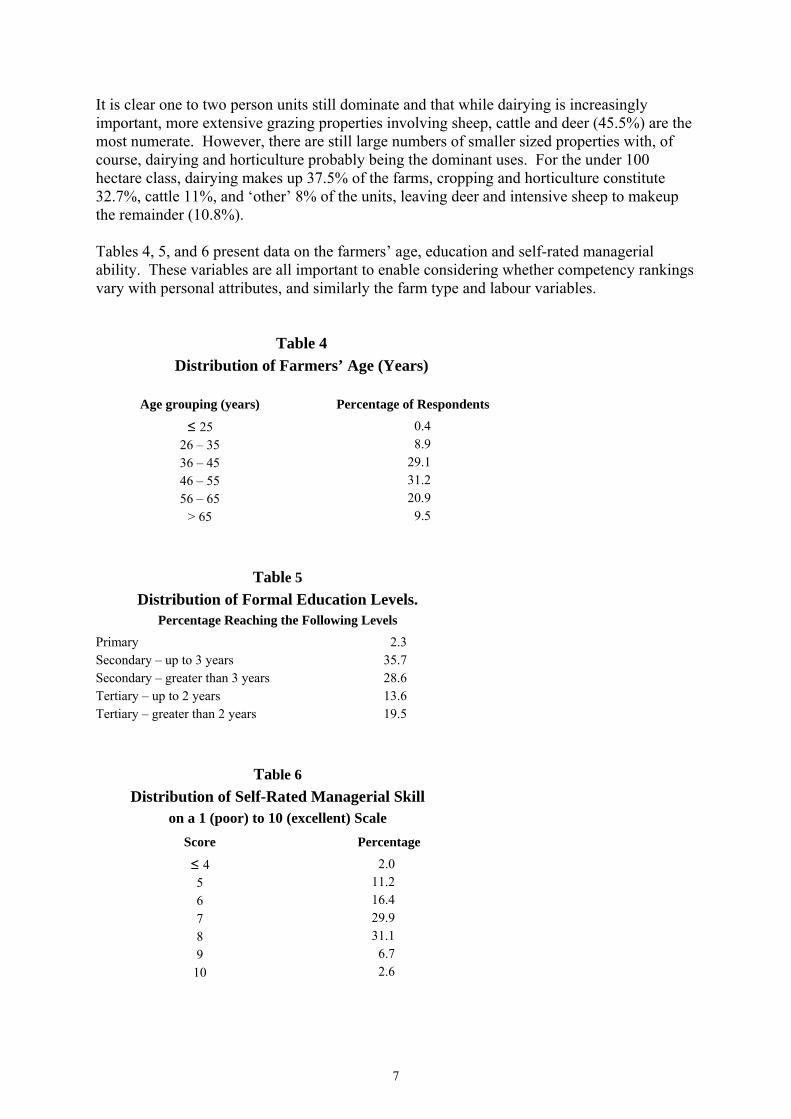
It is clear one to two person units still dominate and that while dairying is increasingly important, more extensive grazing properties involving sheep, cattle and deer (45.5%) are the most numerate. However, there are still large numbers of smaller sized properties with, of course, dairying and horticulture probably being the dominant uses. For the under 100 hectare class, dairying makes up 37.5% of the farms, cropping and horticulture constitute 32.7%, cattle 11%, and ‘other’ 8% of the units, leaving deer and intensive sheep to makeup the remainder (10.8%). Tables 4, 5, and 6 present data on the farmers’ age, education and self-rated managerial ability. These variables are all important to enable considering whether competency rankings vary with personal attributes, and similarly the farm type and labour variables.
Table 4 Distribution of Farmers’ Age (Years)
Age grouping (years) Percentage of Respondents
≤ 25 26 – 35 36 – 45 46 – 55 56 – 65
> 65
0.4 8.9
29.1 31.2 20.9
9.5
Table 5 Distribution of Formal Education Levels.
Percentage Reaching the Following Levels Primary Secondary – up to 3 years Secondary – greater than 3 years Tertiary – up to 2 years Tertiary – greater than 2 years
2.3 35.7 28.6 13.6 19.5
Table 6 Distribution of Self-Rated Managerial Skill
on a 1 (poor) to 10 (excellent) Scale Score Percentage
≤ 4 5 6 7 8 9
10
2.0 11.2 16.4 29.9 31.1
6.7 2.6

8
Clearly, the age distribution is weighted by the older groups, but they believe they have considerable managerial skill, which you might expect with the high numbers receiving more than three years of secondary or tertiary education (61.7%). Male managers still dominate with 88.8%, and many believe they are reasonably intelligent. For the total sample 70.2% rated themselves highly or reasonably intelligent, and 28.4% gave themselves an ‘average intelligence’ rating. It is interesting to note the correlation between highest formal education level attained and self-rated intelligence is only 0.222 (figure significant at the 1% level).
9
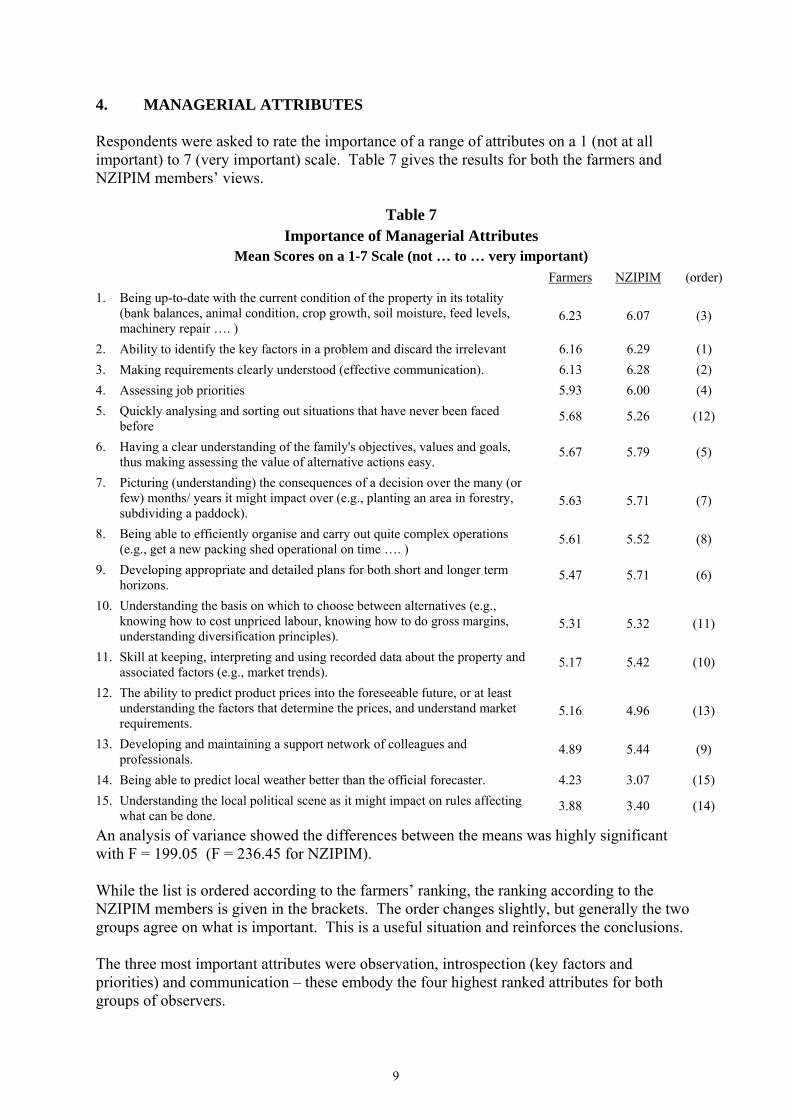
4. MANAGERIAL ATTRIBUTES Respondents were asked to rate the importance of a range of attributes on a 1 (not at all important) to 7 (very important) scale. Table 7 gives the results for both the farmers and NZIPIM members’ views.
Table 7 Importance of Managerial Attributes
Mean Scores on a 1-7 Scale (not … to … very important) Farmers NZIPIM (order) 1. Being up-to-date with the current condition of the property in its totality
(bank balances, animal condition, crop growth, soil moisture, feed levels, machinery repair …. )
6.23
6.07
(3)
2. Ability to identify the key factors in a problem and discard the irrelevant 6.16 6.29 (1) 3. Making requirements clearly understood (effective communication). 6.13 6.28 (2) 4. Assessing job priorities 5.93 6.00 (4) 5. Quickly analysing and sorting out situations that have never been faced
before 5.68 5.26 (12)
6. Having a clear understanding of the family's objectives, values and goals, thus making assessing the value of alternative actions easy.
5.67 5.79 (5)
7. Picturing (understanding) the consequences of a decision over the many (or few) months/ years it might impact over (e.g., planting an area in forestry, subdividing a paddock).
5.63
5.71
(7)
8. Being able to efficiently organise and carry out quite complex operations (e.g., get a new packing shed operational on time …. )
5.61 5.52 (8)
9. Developing appropriate and detailed plans for both short and longer term horizons.
5.47 5.71 (6)
10. Understanding the basis on which to choose between alternatives (e.g., knowing how to cost unpriced labour, knowing how to do gross margins, understanding diversification principles).
5.31
5.32
(11)
11. Skill at keeping, interpreting and using recorded data about the property and associated factors (e.g., market trends).
5.17 5.42 (10)
12. The ability to predict product prices into the foreseeable future, or at least understanding the factors that determine the prices, and understand market requirements.
5.16
4.96
(13)
13. Developing and maintaining a support network of colleagues and professionals.
4.89 5.44 (9)
14. Being able to predict local weather better than the official forecaster. 4.23 3.07 (15) 15. Understanding the local political scene as it might impact on rules affecting
what can be done. 3.88 3.40 (14)
An analysis of variance showed the differences between the means was highly significant with F = 199.05 (F = 236.45 for NZIPIM). While the list is ordered according to the farmers’ ranking, the ranking according to the NZIPIM members is given in the brackets. The order changes slightly, but generally the two groups agree on what is important. This is a useful situation and reinforces the conclusions. The three most important attributes were observation, introspection (key factors and priorities) and communication – these embody the four highest ranked attributes for both groups of observers.
10
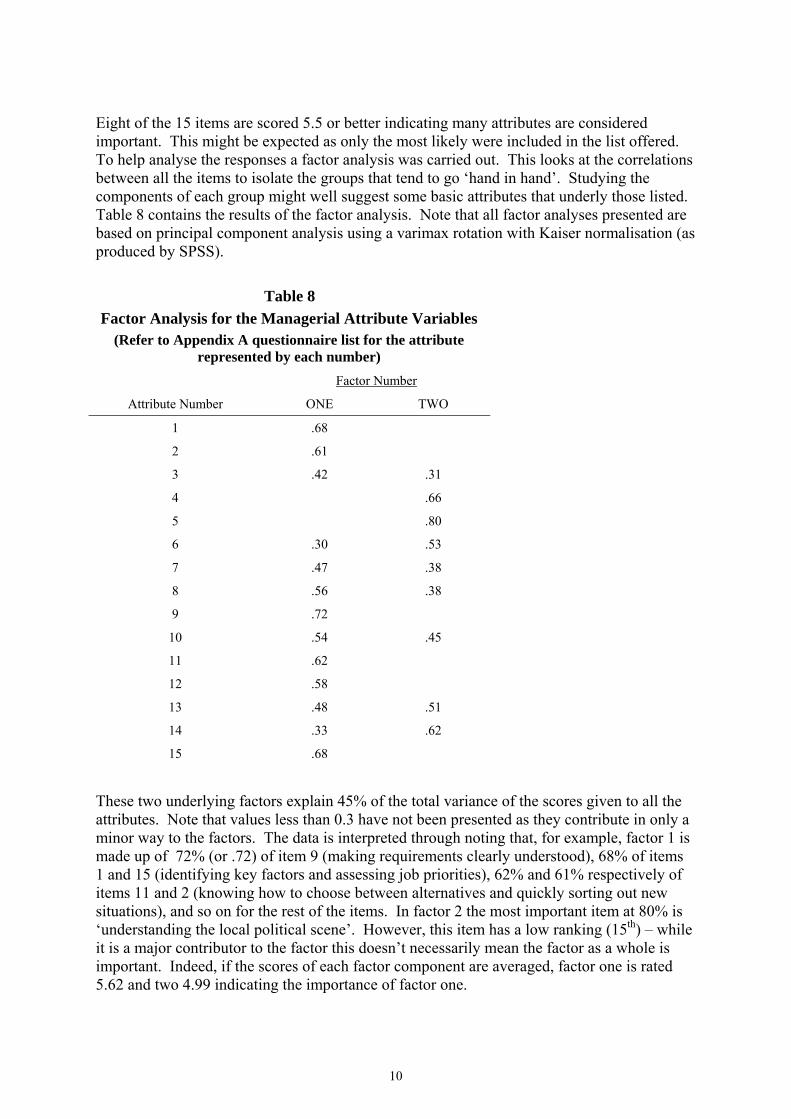
Eight of the 15 items are scored 5.5 or better indicating many attributes are considered important. This might be expected as only the most likely were included in the list offered. To help analyse the responses a factor analysis was carried out. This looks at the correlations between all the items to isolate the groups that tend to go ‘hand in hand’. Studying the components of each group might well suggest some basic attributes that underly those listed. Table 8 contains the results of the factor analysis. Note that all factor analyses presented are based on principal component analysis using a varimax rotation with Kaiser normalisation (as produced by SPSS).
Table 8 Factor Analysis for the Managerial Attribute Variables
(Refer to Appendix A questionnaire list for the attribute represented by each number)
Factor Number
Attribute Number ONE TWO
1 .68
2 .61
3 .42 .31
4 .66
5 .80
6 .30 .53
7 .47 .38
8 .56 .38
9 .72
10 .54 .45
11 .62
12 .58
13 .48 .51
14 .33 .62
15 .68
These two underlying factors explain 45% of the total variance of the scores given to all the attributes. Note that values less than 0.3 have not been presented as they contribute in only a minor way to the factors. The data is interpreted through noting that, for example, factor 1 is made up of 72% (or .72) of item 9 (making requirements clearly understood), 68% of items 1 and 15 (identifying key factors and assessing job priorities), 62% and 61% respectively of items 11 and 2 (knowing how to choose between alternatives and quickly sorting out new situations), and so on for the rest of the items. In factor 2 the most important item at 80% is ‘understanding the local political scene’. However, this item has a low ranking (15th) – while it is a major contributor to the factor this doesn’t necessarily mean the factor as a whole is important. Indeed, if the scores of each factor component are averaged, factor one is rated 5.62 and two 4.99 indicating the importance of factor one.
11
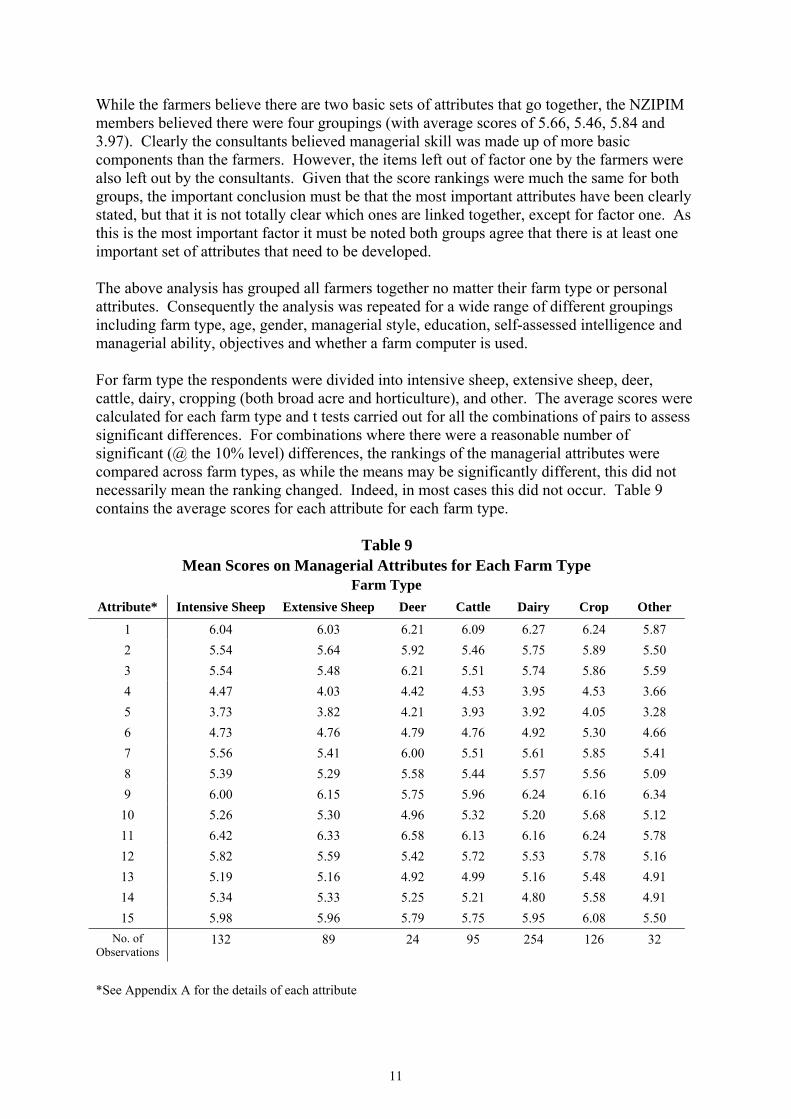
While the farmers believe there are two basic sets of attributes that go together, the NZIPIM members believed there were four groupings (with average scores of 5.66, 5.46, 5.84 and 3.97). Clearly the consultants believed managerial skill was made up of more basic components than the farmers. However, the items left out of factor one by the farmers were also left out by the consultants. Given that the score rankings were much the same for both groups, the important conclusion must be that the most important attributes have been clearly stated, but that it is not totally clear which ones are linked together, except for factor one. As this is the most important factor it must be noted both groups agree that there is at least one important set of attributes that need to be developed. The above analysis has grouped all farmers together no matter their farm type or personal attributes. Consequently the analysis was repeated for a wide range of different groupings including farm type, age, gender, managerial style, education, self-assessed intelligence and managerial ability, objectives and whether a farm computer is used. For farm type the respondents were divided into intensive sheep, extensive sheep, deer, cattle, dairy, cropping (both broad acre and horticulture), and other. The average scores were calculated for each farm type and t tests carried out for all the combinations of pairs to assess significant differences. For combinations where there were a reasonable number of significant (@ the 10% level) differences, the rankings of the managerial attributes were compared across farm types, as while the means may be significantly different, this did not necessarily mean the ranking changed. Indeed, in most cases this did not occur. Table 9 contains the average scores for each attribute for each farm type.
Table 9 Mean Scores on Managerial Attributes for Each Farm Type
Farm Type Attribute* Intensive Sheep Extensive Sheep Deer Cattle Dairy Crop Other
1 6.04 6.03 6.21 6.09 6.27 6.24 5.87 2 5.54 5.64 5.92 5.46 5.75 5.89 5.50 3 5.54 5.48 6.21 5.51 5.74 5.86 5.59 4 4.47 4.03 4.42 4.53 3.95 4.53 3.66 5 3.73 3.82 4.21 3.93 3.92 4.05 3.28 6 4.73 4.76 4.79 4.76 4.92 5.30 4.66 7 5.56 5.41 6.00 5.51 5.61 5.85 5.41 8 5.39 5.29 5.58 5.44 5.57 5.56 5.09 9 6.00 6.15 5.75 5.96 6.24 6.16 6.34
10 5.26 5.30 4.96 5.32 5.20 5.68 5.12 11 6.42 6.33 6.58 6.13 6.16 6.24 5.78 12 5.82 5.59 5.42 5.72 5.53 5.78 5.16 13 5.19 5.16 4.92 4.99 5.16 5.48 4.91 14 5.34 5.33 5.25 5.21 4.80 5.58 4.91 15 5.98 5.96 5.79 5.75 5.95 6.08 5.50
No. of Observations
132 89 24 95 254 126 32
*See Appendix A for the details of each attribute
12
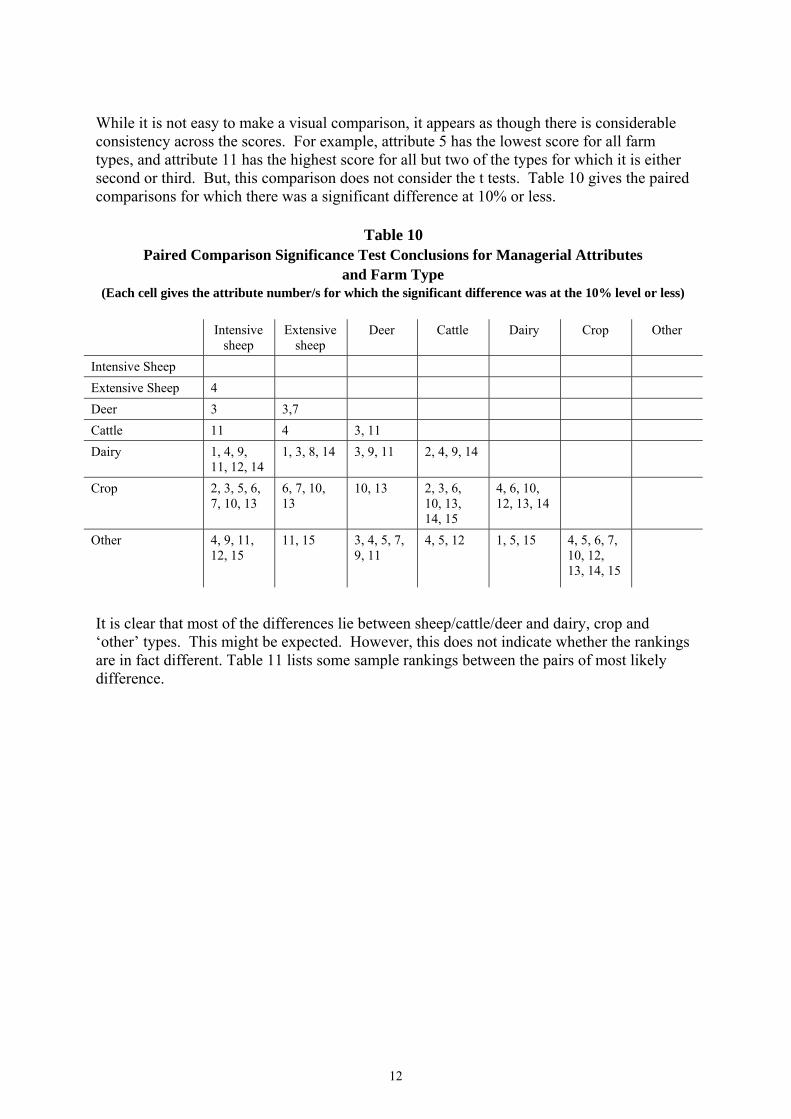
While it is not easy to make a visual comparison, it appears as though there is considerable consistency across the scores. For example, attribute 5 has the lowest score for all farm types, and attribute 11 has the highest score for all but two of the types for which it is either second or third. But, this comparison does not consider the t tests. Table 10 gives the paired comparisons for which there was a significant difference at 10% or less.
Table 10 Paired Comparison Significance Test Conclusions for Managerial Attributes
and Farm Type (Each cell gives the attribute number/s for which the significant difference was at the 10% level or less)
Intensive
sheep Extensive
sheep Deer Cattle Dairy Crop Other
Intensive Sheep Extensive Sheep 4 Deer 3 3,7 Cattle 11 4 3, 11 Dairy 1, 4, 9,
11, 12, 14 1, 3, 8, 14 3, 9, 11 2, 4, 9, 14
Crop 2, 3, 5, 6, 7, 10, 13
6, 7, 10, 13
10, 13 2, 3, 6, 10, 13, 14, 15
4, 6, 10, 12, 13, 14
Other 4, 9, 11, 12, 15
11, 15 3, 4, 5, 7, 9, 11
4, 5, 12 1, 5, 15 4, 5, 6, 7, 10, 12, 13, 14, 15
It is clear that most of the differences lie between sheep/cattle/deer and dairy, crop and ‘other’ types. This might be expected. However, this does not indicate whether the rankings are in fact different. Table 11 lists some sample rankings between the pairs of most likely difference.
13
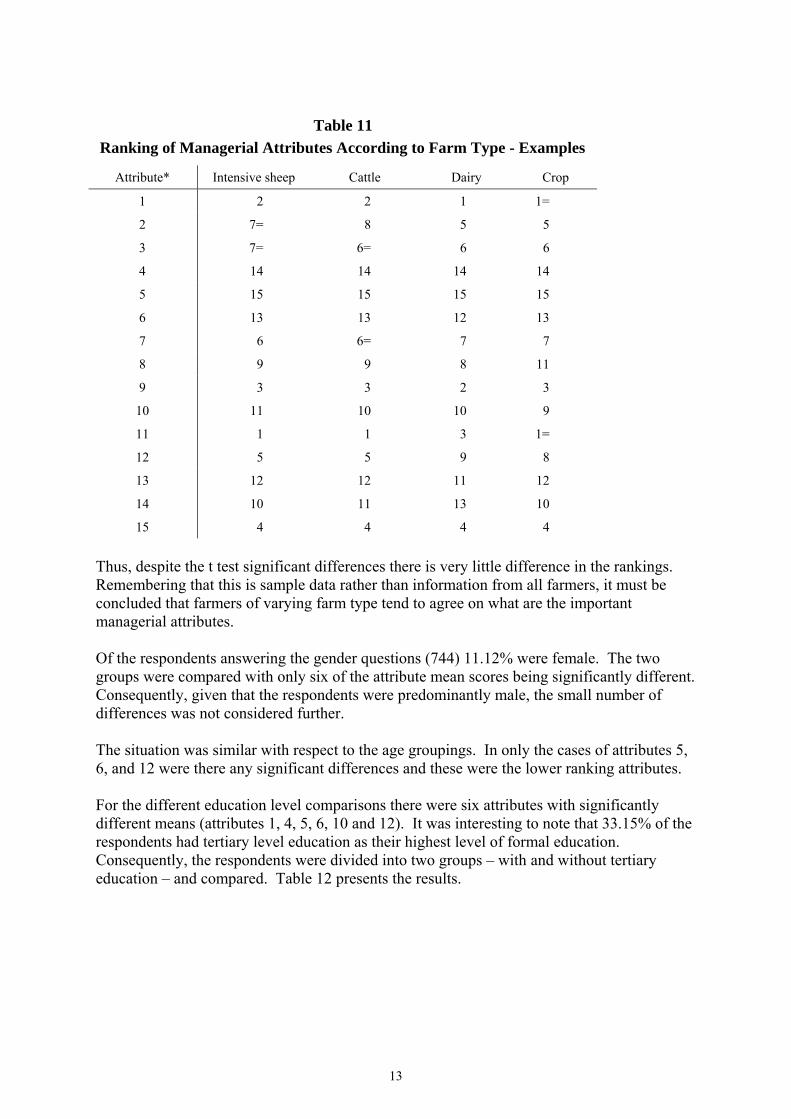
Table 11
Ranking of Managerial Attributes According to Farm Type - Examples
Attribute* Intensive sheep Cattle Dairy Crop
1 2 2 1 1=
2 7= 8 5 5
3 7= 6= 6 6
4 14 14 14 14
5 15 15 15 15
6 13 13 12 13
7 6 6= 7 7
8 9 9 8 11
9 3 3 2 3
10 11 10 10 9
11 1 1 3 1=
12 5 5 9 8
13 12 12 11 12
14 10 11 13 10
15 4 4 4 4 Thus, despite the t test significant differences there is very little difference in the rankings. Remembering that this is sample data rather than information from all farmers, it must be concluded that farmers of varying farm type tend to agree on what are the important managerial attributes. Of the respondents answering the gender questions (744) 11.12% were female. The two groups were compared with only six of the attribute mean scores being significantly different. Consequently, given that the respondents were predominantly male, the small number of differences was not considered further. The situation was similar with respect to the age groupings. In only the cases of attributes 5, 6, and 12 were there any significant differences and these were the lower ranking attributes. For the different education level comparisons there were six attributes with significantly different means (attributes 1, 4, 5, 6, 10 and 12). It was interesting to note that 33.15% of the respondents had tertiary level education as their highest level of formal education. Consequently, the respondents were divided into two groups – with and without tertiary education – and compared. Table 12 presents the results.
14
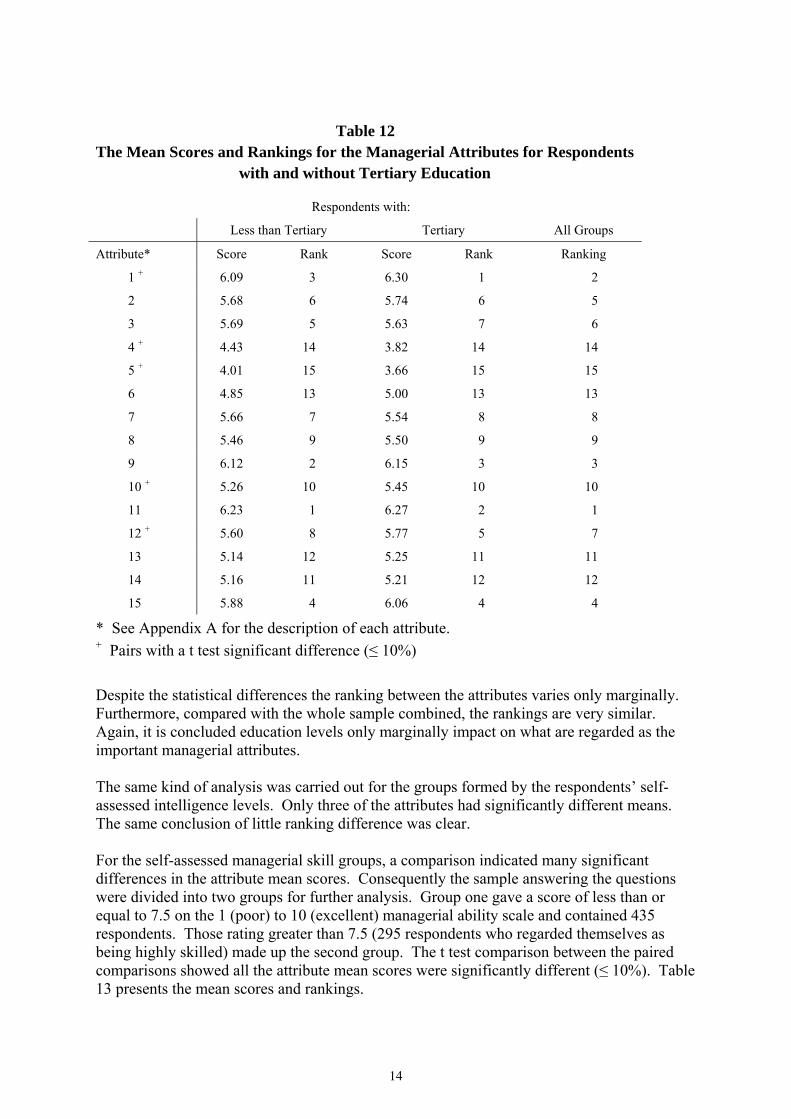
Table 12
The Mean Scores and Rankings for the Managerial Attributes for Respondents with and without Tertiary Education
Respondents with:
Less than Tertiary Tertiary All Groups
Attribute* Score Rank Score Rank Ranking
1 + 6.09 3 6.30 1 2
2 5.68 6 5.74 6 5
3 5.69 5 5.63 7 6
4 + 4.43 14 3.82 14 14
5 + 4.01 15 3.66 15 15
6 4.85 13 5.00 13 13
7 5.66 7 5.54 8 8
8 5.46 9 5.50 9 9
9 6.12 2 6.15 3 3
10 + 5.26 10 5.45 10 10
11 6.23 1 6.27 2 1
12 + 5.60 8 5.77 5 7
13 5.14 12 5.25 11 11
14 5.16 11 5.21 12 12
15 5.88 4 6.06 4 4
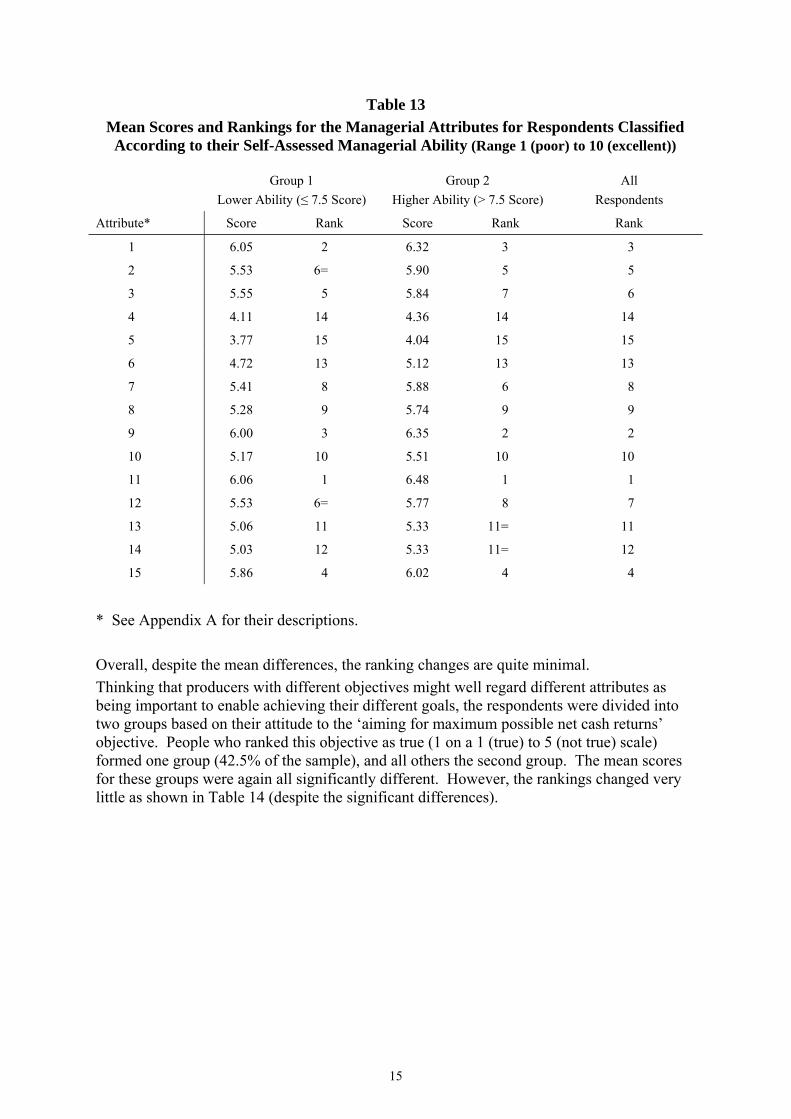
* See Appendix A for the description of each attribute. + Pairs with a t test significant difference (≤ 10%) Despite the statistical differences the ranking between the attributes varies only marginally. Furthermore, compared with the whole sample combined, the rankings are very similar. Again, it is concluded education levels only marginally impact on what are regarded as the important managerial attributes. The same kind of analysis was carried out for the groups formed by the respondents’ self-assessed intelligence levels. Only three of the attributes had significantly different means. The same conclusion of little ranking difference was clear. For the self-assessed managerial skill groups, a comparison indicated many significant differences in the attribute mean scores. Consequently the sample answering the questions were divided into two groups for further analysis. Group one gave a score of less than or equal to 7.5 on the 1 (poor) to 10 (excellent) managerial ability scale and contained 435 respondents. Those rating greater than 7.5 (295 respondents who regarded themselves as being highly skilled) made up the second group. The t test comparison between the paired comparisons showed all the attribute mean scores were significantly different (≤ 10%). Table 13 presents the mean scores and rankings.
15
Table 13 Mean Scores and Rankings for the Managerial Attributes for Respondents Classified
According to their Self-Assessed Managerial Ability (Range 1 (poor) to 10 (excellent))
Group 1 Lower Ability (≤ 7.5 Score)
Group 2 Higher Ability (> 7.5 Score)
All Respondents
Attribute* Score Rank Score Rank Rank
1 6.05 2 6.32 3 3
2 5.53 6= 5.90 5 5
3 5.55 5 5.84 7 6
4 4.11 14 4.36 14 14
5 3.77 15 4.04 15 15
6 4.72 13 5.12 13 13
7 5.41 8 5.88 6 8
8 5.28 9 5.74 9 9
9 6.00 3 6.35 2 2
10 5.17 10 5.51 10 10
11 6.06 1 6.48 1 1
12 5.53 6= 5.77 8 7
13 5.06 11 5.33 11= 11
14 5.03 12 5.33 11= 12
15 5.86 4 6.02 4 4
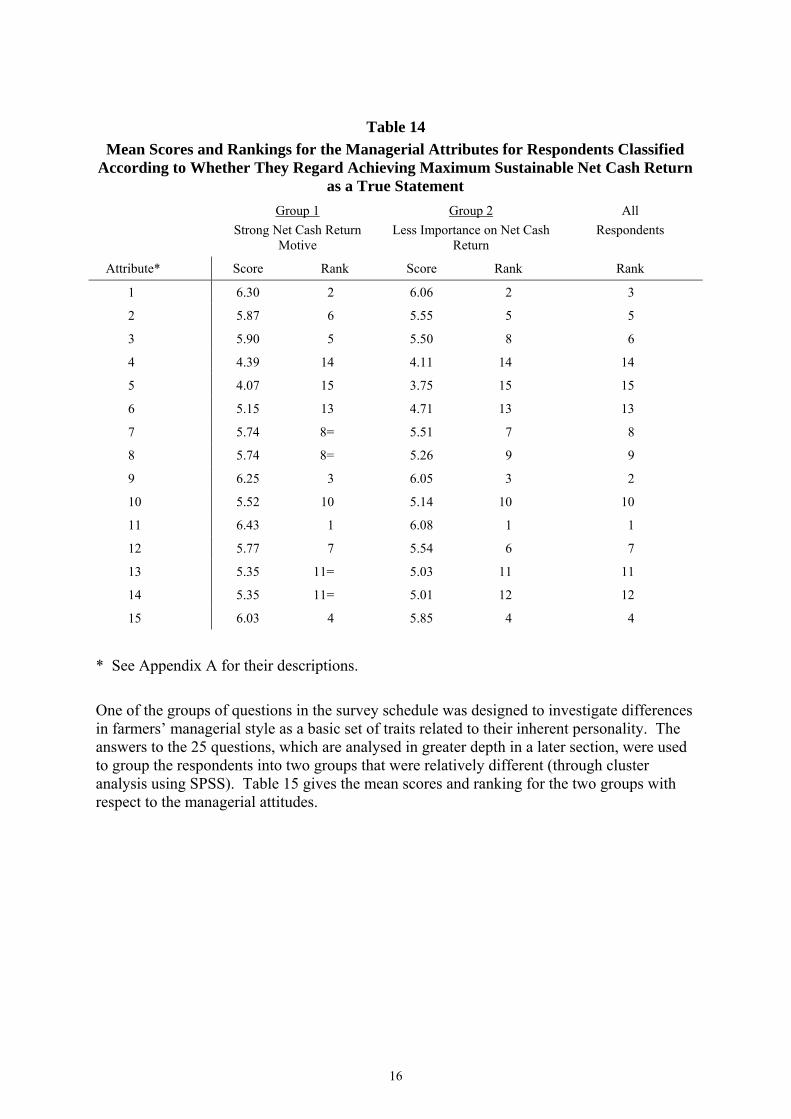
* See Appendix A for their descriptions. Overall, despite the mean differences, the ranking changes are quite minimal. Thinking that producers with different objectives might well regard different attributes as being important to enable achieving their different goals, the respondents were divided into two groups based on their attitude to the ‘aiming for maximum possible net cash returns’ objective. People who ranked this objective as true (1 on a 1 (true) to 5 (not true) scale) formed one group (42.5% of the sample), and all others the second group. The mean scores for these groups were again all significantly different. However, the rankings changed very little as shown in Table 14 (despite the significant differences).
16
Table 14
Mean Scores and Rankings for the Managerial Attributes for Respondents Classified According to Whether They Regard Achieving Maximum Sustainable Net Cash Return
as a True Statement Group 1
Strong Net Cash Return Motive
Group 2 Less Importance on Net Cash
Return
All Respondents
Attribute* Score Rank Score Rank Rank
1 6.30 2 6.06 2 3
2 5.87 6 5.55 5 5
3 5.90 5 5.50 8 6
4 4.39 14 4.11 14 14
5 4.07 15 3.75 15 15
6 5.15 13 4.71 13 13
7 5.74 8= 5.51 7 8
8 5.74 8= 5.26 9 9
9 6.25 3 6.05 3 2
10 5.52 10 5.14 10 10
11 6.43 1 6.08 1 1
12 5.77 7 5.54 6 7
13 5.35 11= 5.03 11 11
14 5.35 11= 5.01 12 12
15 6.03 4 5.85 4 4
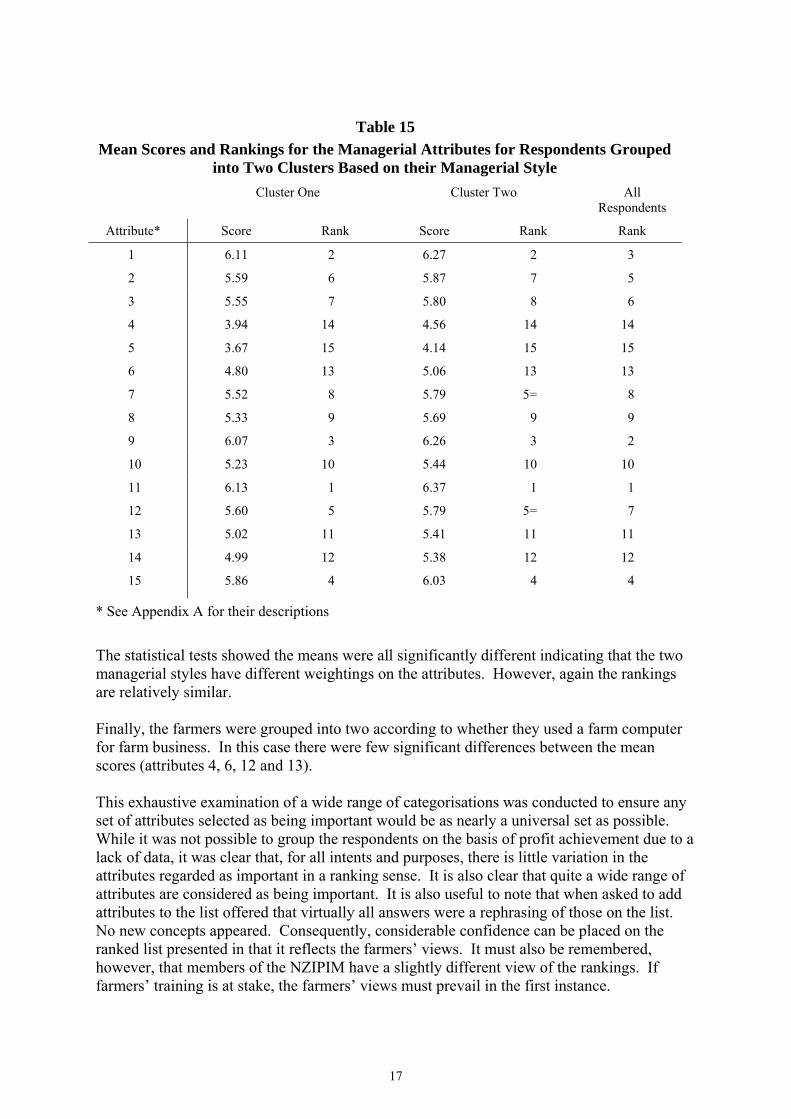
* See Appendix A for their descriptions. One of the groups of questions in the survey schedule was designed to investigate differences in farmers’ managerial style as a basic set of traits related to their inherent personality. The answers to the 25 questions, which are analysed in greater depth in a later section, were used to group the respondents into two groups that were relatively different (through cluster analysis using SPSS). Table 15 gives the mean scores and ranking for the two groups with respect to the managerial attitudes.
17
Table 15
Mean Scores and Rankings for the Managerial Attributes for Respondents Grouped into Two Clusters Based on their Managerial Style
Cluster One Cluster Two All Respondents
Attribute* Score Rank Score Rank Rank
1 6.11 2 6.27 2 3
2 5.59 6 5.87 7 5
3 5.55 7 5.80 8 6
4 3.94 14 4.56 14 14
5 3.67 15 4.14 15 15
6 4.80 13 5.06 13 13
7 5.52 8 5.79 5= 8
8 5.33 9 5.69 9 9
9 6.07 3 6.26 3 2
10 5.23 10 5.44 10 10
11 6.13 1 6.37 1 1
12 5.60 5 5.79 5= 7
13 5.02 11 5.41 11 11
14 4.99 12 5.38 12 12
15 5.86 4 6.03 4 4
* See Appendix A for their descriptions The statistical tests showed the means were all significantly different indicating that the two managerial styles have different weightings on the attributes. However, again the rankings are relatively similar. Finally, the farmers were grouped into two according to whether they used a farm computer for farm business. In this case there were few significant differences between the mean scores (attributes 4, 6, 12 and 13). This exhaustive examination of a wide range of categorisations was conducted to ensure any set of attributes selected as being important would be as nearly a universal set as possible. While it was not possible to group the respondents on the basis of profit achievement due to a lack of data, it was clear that, for all intents and purposes, there is little variation in the attributes regarded as important in a ranking sense. It is also clear that quite a wide range of attributes are considered as being important. It is also useful to note that when asked to add attributes to the list offered that virtually all answers were a rephrasing of those on the list. No new concepts appeared. Consequently, considerable confidence can be placed on the ranked list presented in that it reflects the farmers’ views. It must also be remembered, however, that members of the NZIPIM have a slightly different view of the rankings. If farmers’ training is at stake, the farmers’ views must prevail in the first instance.
18
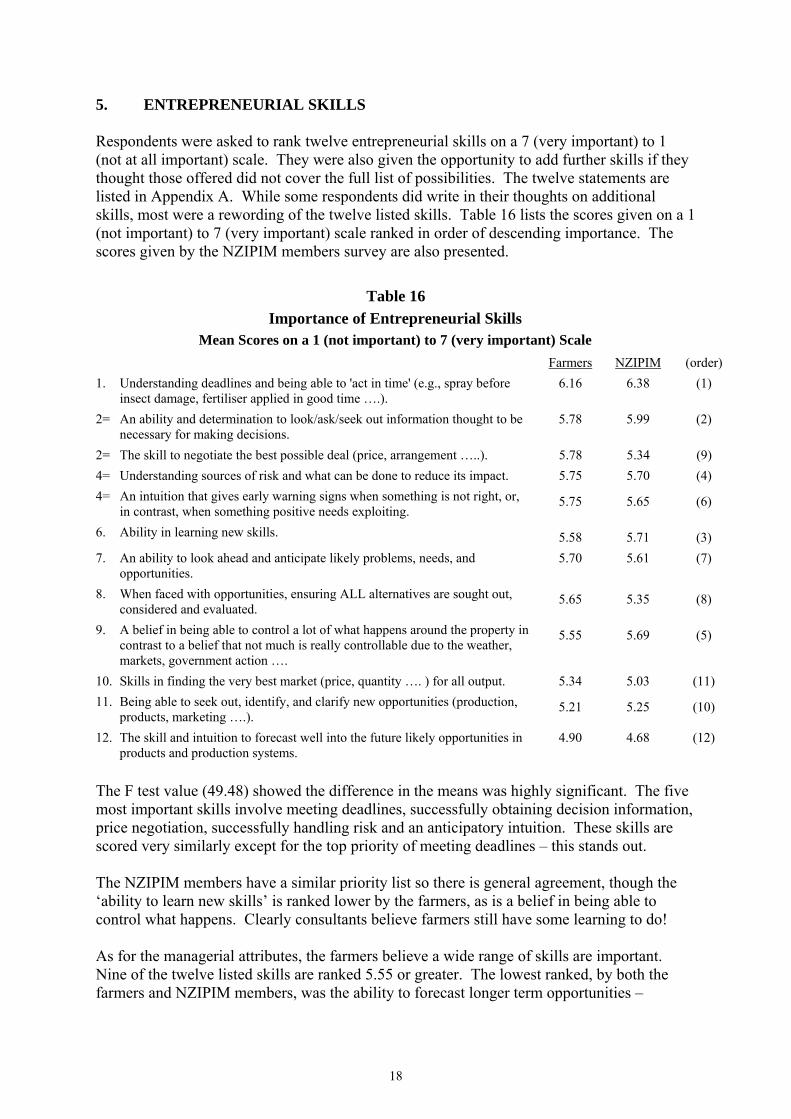
5. ENTREPRENEURIAL SKILLS Respondents were asked to rank twelve entrepreneurial skills on a 7 (very important) to 1 (not at all important) scale. They were also given the opportunity to add further skills if they thought those offered did not cover the full list of possibilities. The twelve statements are listed in Appendix A. While some respondents did write in their thoughts on additional skills, most were a rewording of the twelve listed skills. Table 16 lists the scores given on a 1 (not important) to 7 (very important) scale ranked in order of descending importance. The scores given by the NZIPIM members survey are also presented.
Table 16 Importance of Entrepreneurial Skills
Mean Scores on a 1 (not important) to 7 (very important) Scale Farmers NZIPIM (order) 1. Understanding deadlines and being able to 'act in time' (e.g., spray before
insect damage, fertiliser applied in good time ….). 6.16 6.38 (1)
2= An ability and determination to look/ask/seek out information thought to be necessary for making decisions.
5.78 5.99 (2)
2= The skill to negotiate the best possible deal (price, arrangement …..). 5.78 5.34 (9) 4= Understanding sources of risk and what can be done to reduce its impact. 5.75 5.70 (4) 4= An intuition that gives early warning signs when something is not right, or,
in contrast, when something positive needs exploiting. 5.75 5.65 (6)
6. Ability in learning new skills. 5.58 5.71 (3) 7. An ability to look ahead and anticipate likely problems, needs, and
opportunities. 5.70 5.61 (7)
8. When faced with opportunities, ensuring ALL alternatives are sought out, considered and evaluated.
5.65 5.35 (8)
9. A belief in being able to control a lot of what happens around the property in contrast to a belief that not much is really controllable due to the weather, markets, government action ….
5.55 5.69 (5)
10. Skills in finding the very best market (price, quantity …. ) for all output. 5.34 5.03 (11) 11. Being able to seek out, identify, and clarify new opportunities (production,
products, marketing ….). 5.21 5.25 (10)
12. The skill and intuition to forecast well into the future likely opportunities in products and production systems.
4.90 4.68 (12)
The F test value (49.48) showed the difference in the means was highly significant. The five most important skills involve meeting deadlines, successfully obtaining decision information, price negotiation, successfully handling risk and an anticipatory intuition. These skills are scored very similarly except for the top priority of meeting deadlines – this stands out. The NZIPIM members have a similar priority list so there is general agreement, though the ‘ability to learn new skills’ is ranked lower by the farmers, as is a belief in being able to control what happens. Clearly consultants believe farmers still have some learning to do! As for the managerial attributes, the farmers believe a wide range of skills are important. Nine of the twelve listed skills are ranked 5.55 or greater. The lowest ranked, by both the farmers and NZIPIM members, was the ability to forecast longer term opportunities –
19
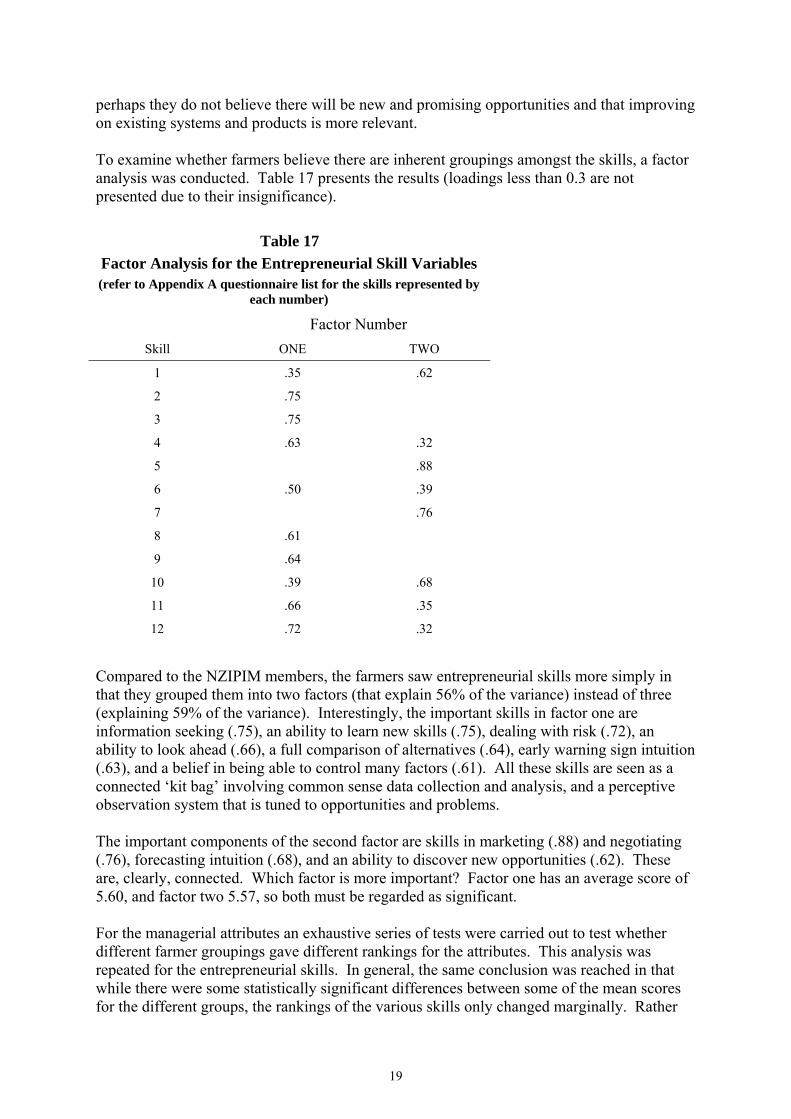
perhaps they do not believe there will be new and promising opportunities and that improving on existing systems and products is more relevant. To examine whether farmers believe there are inherent groupings amongst the skills, a factor analysis was conducted. Table 17 presents the results (loadings less than 0.3 are not presented due to their insignificance).
Table 17 Factor Analysis for the Entrepreneurial Skill Variables (refer to Appendix A questionnaire list for the skills represented by
each number)
Factor Number Skill ONE TWO
1 .35 .62
2 .75
3 .75
4 .63 .32
5 .88
6 .50 .39
7 .76
8 .61
9 .64
10 .39 .68
11 .66 .35
12 .72 .32
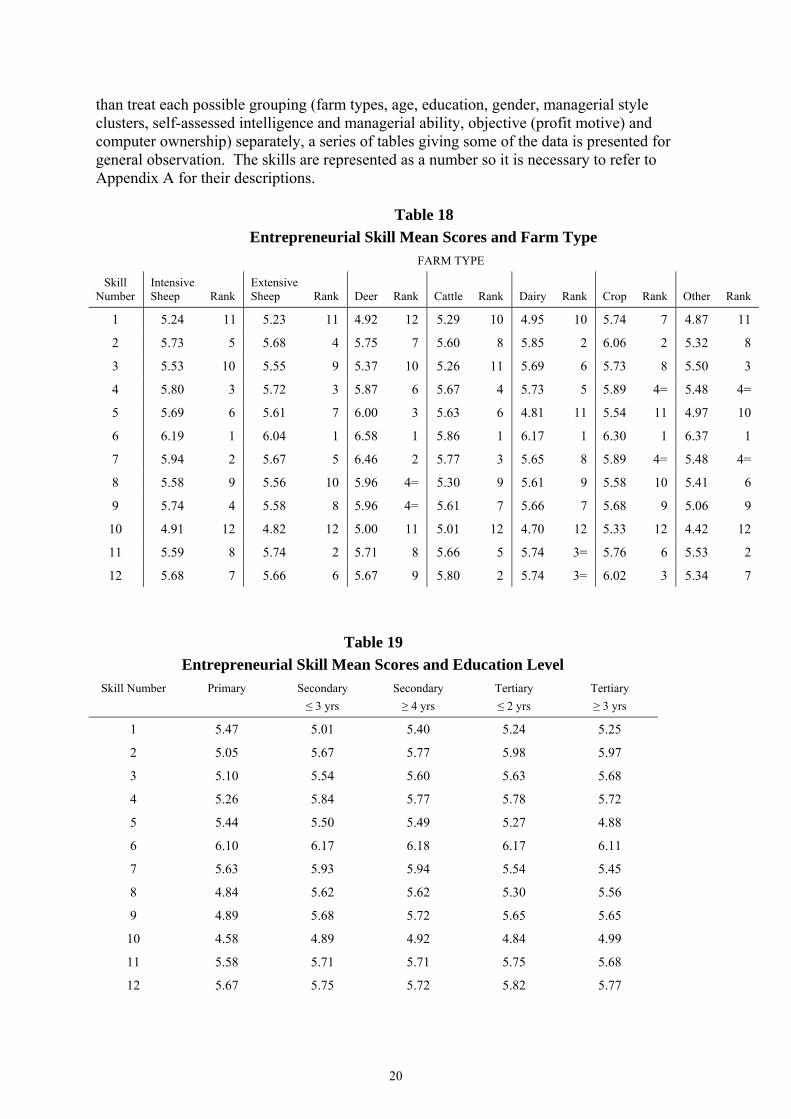
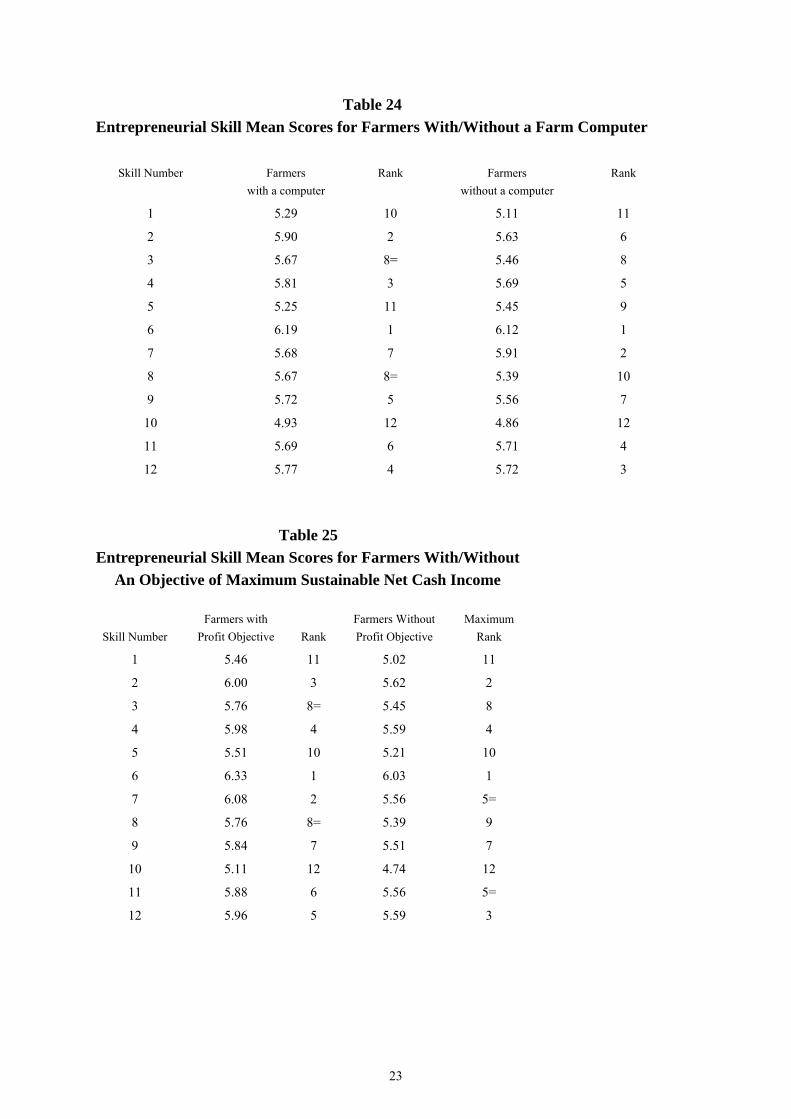
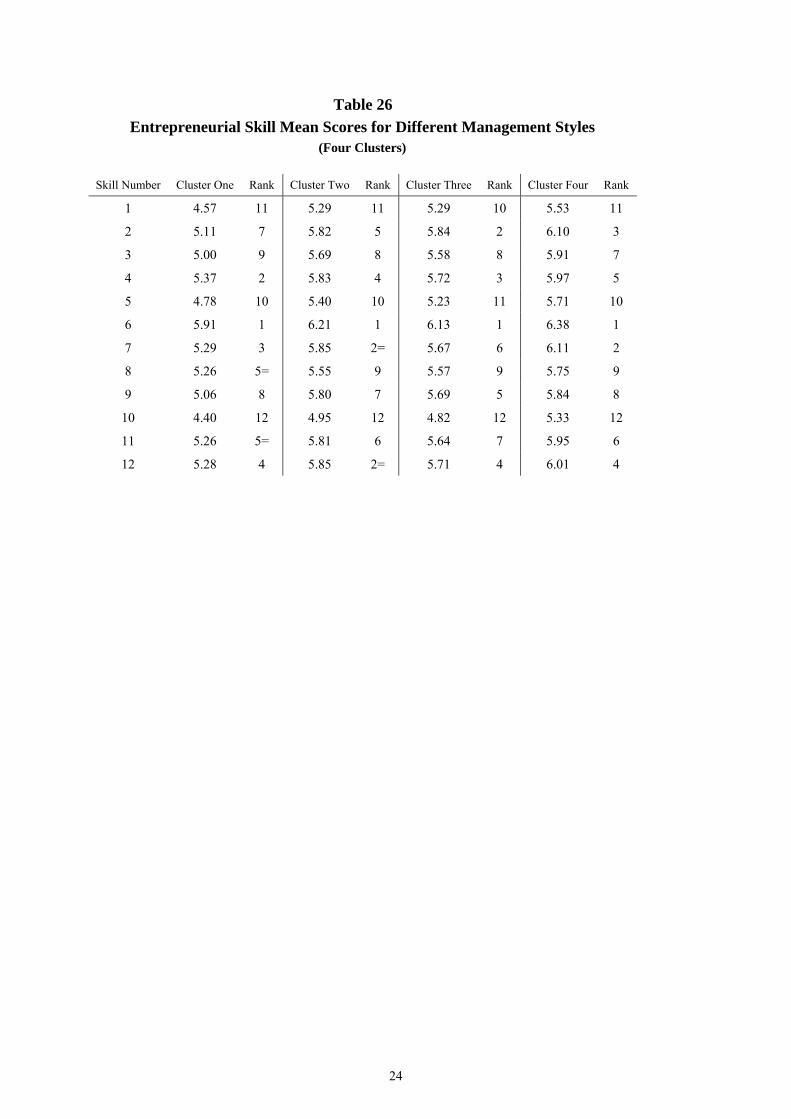
Compared to the NZIPIM members, the farmers saw entrepreneurial skills more simply in that they grouped them into two factors (that explain 56% of the variance) instead of three (explaining 59% of the variance). Interestingly, the important skills in factor one are information seeking (.75), an ability to learn new skills (.75), dealing with risk (.72), an ability to look ahead (.66), a full comparison of alternatives (.64), early warning sign intuition (.63), and a belief in being able to control many factors (.61). All these skills are seen as a connected ‘kit bag’ involving common sense data collection and analysis, and a perceptive observation system that is tuned to opportunities and problems. The important components of the second factor are skills in marketing (.88) and negotiating (.76), forecasting intuition (.68), and an ability to discover new opportunities (.62). These are, clearly, connected. Which factor is more important? Factor one has an average score of 5.60, and factor two 5.57, so both must be regarded as significant. For the managerial attributes an exhaustive series of tests were carried out to test whether different farmer groupings gave different rankings for the attributes. This analysis was repeated for the entrepreneurial skills. In general, the same conclusion was reached in that while there were some statistically significant differences between some of the mean scores for the different groups, the rankings of the various skills only changed marginally. Rather
20
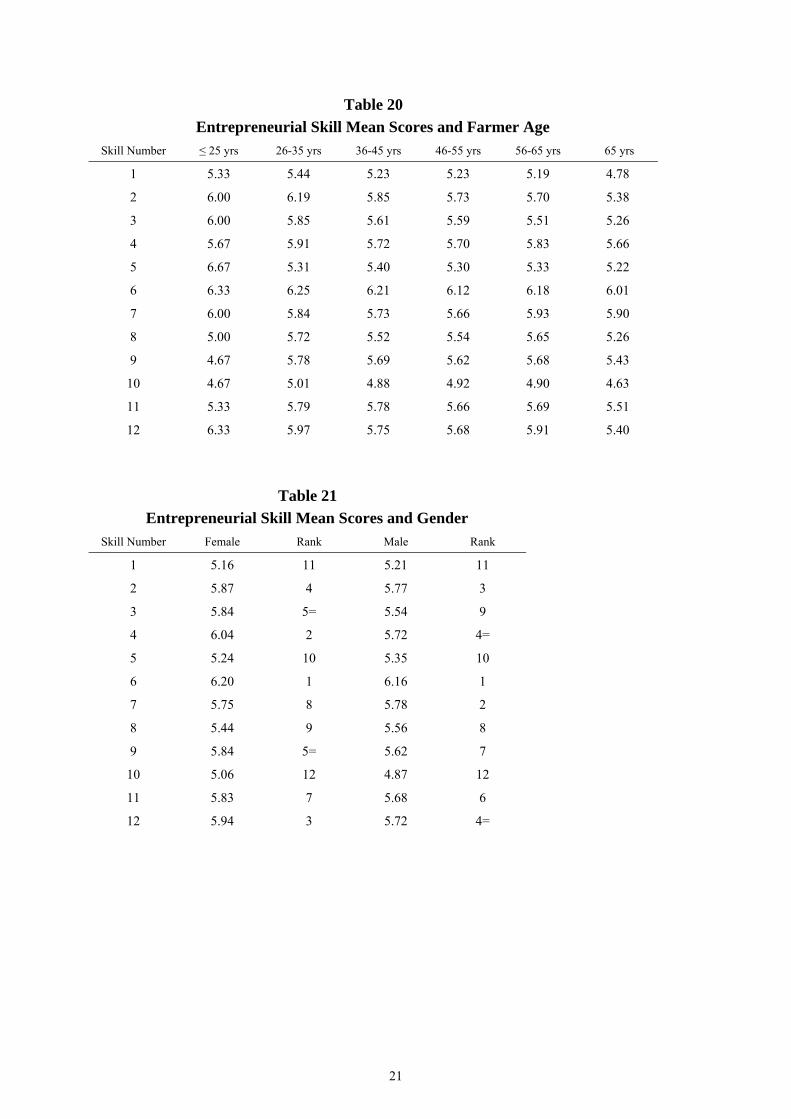
than treat each possible grouping (farm types, age, education, gender, managerial style clusters, self-assessed intelligence and managerial ability, objective (profit motive) and computer ownership) separately, a series of tables giving some of the data is presented for general observation. The skills are represented as a number so it is necessary to refer to Appendix A for their descriptions.
Table 18 Entrepreneurial Skill Mean Scores and Farm Type
FARM TYPE
Skill Number
Intensive Sheep
Rank
Extensive Sheep
Rank
Deer
Rank
Cattle
Rank
Dairy
Rank
Crop
Rank
Other
Rank
1 5.24 11 5.23 11 4.92 12 5.29 10 4.95 10 5.74 7 4.87 11
2 5.73 5 5.68 4 5.75 7 5.60 8 5.85 2 6.06 2 5.32 8
3 5.53 10 5.55 9 5.37 10 5.26 11 5.69 6 5.73 8 5.50 3
4 5.80 3 5.72 3 5.87 6 5.67 4 5.73 5 5.89 4= 5.48 4=
5 5.69 6 5.61 7 6.00 3 5.63 6 4.81 11 5.54 11 4.97 10
6 6.19 1 6.04 1 6.58 1 5.86 1 6.17 1 6.30 1 6.37 1
7 5.94 2 5.67 5 6.46 2 5.77 3 5.65 8 5.89 4= 5.48 4=
8 5.58 9 5.56 10 5.96 4= 5.30 9 5.61 9 5.58 10 5.41 6
9 5.74 4 5.58 8 5.96 4= 5.61 7 5.66 7 5.68 9 5.06 9
10 4.91 12 4.82 12 5.00 11 5.01 12 4.70 12 5.33 12 4.42 12
11 5.59 8 5.74 2 5.71 8 5.66 5 5.74 3= 5.76 6 5.53 2
12 5.68 7 5.66 6 5.67 9 5.80 2 5.74 3= 6.02 3 5.34 7
Table 19 Entrepreneurial Skill Mean Scores and Education Level
Skill Number Primary Secondary ≤ 3 yrs
Secondary ≥ 4 yrs
Tertiary ≤ 2 yrs
Tertiary ≥ 3 yrs
1 5.47 5.01 5.40 5.24 5.25
2 5.05 5.67 5.77 5.98 5.97
3 5.10 5.54 5.60 5.63 5.68
4 5.26 5.84 5.77 5.78 5.72
5 5.44 5.50 5.49 5.27 4.88
6 6.10 6.17 6.18 6.17 6.11
7 5.63 5.93 5.94 5.54 5.45
8 4.84 5.62 5.62 5.30 5.56
9 4.89 5.68 5.72 5.65 5.65
10 4.58 4.89 4.92 4.84 4.99
11 5.58 5.71 5.71 5.75 5.68
12 5.67 5.75 5.72 5.82 5.77
21
Table 20 Entrepreneurial Skill Mean Scores and Farmer Age
Skill Number ≤ 25 yrs 26-35 yrs 36-45 yrs 46-55 yrs 56-65 yrs 65 yrs
1 5.33 5.44 5.23 5.23 5.19 4.78
2 6.00 6.19 5.85 5.73 5.70 5.38
3 6.00 5.85 5.61 5.59 5.51 5.26
4 5.67 5.91 5.72 5.70 5.83 5.66
5 6.67 5.31 5.40 5.30 5.33 5.22
6 6.33 6.25 6.21 6.12 6.18 6.01
7 6.00 5.84 5.73 5.66 5.93 5.90
8 5.00 5.72 5.52 5.54 5.65 5.26
9 4.67 5.78 5.69 5.62 5.68 5.43
10 4.67 5.01 4.88 4.92 4.90 4.63
11 5.33 5.79 5.78 5.66 5.69 5.51
12 6.33 5.97 5.75 5.68 5.91 5.40
Table 21 Entrepreneurial Skill Mean Scores and Gender
Skill Number Female Rank Male Rank
1 5.16 11 5.21 11
2 5.87 4 5.77 3
3 5.84 5= 5.54 9
4 6.04 2 5.72 4=
5 5.24 10 5.35 10
6 6.20 1 6.16 1
7 5.75 8 5.78 2
8 5.44 9 5.56 8
9 5.84 5= 5.62 7
10 5.06 12 4.87 12
11 5.83 7 5.68 6
12 5.94 3 5.72 4=
22
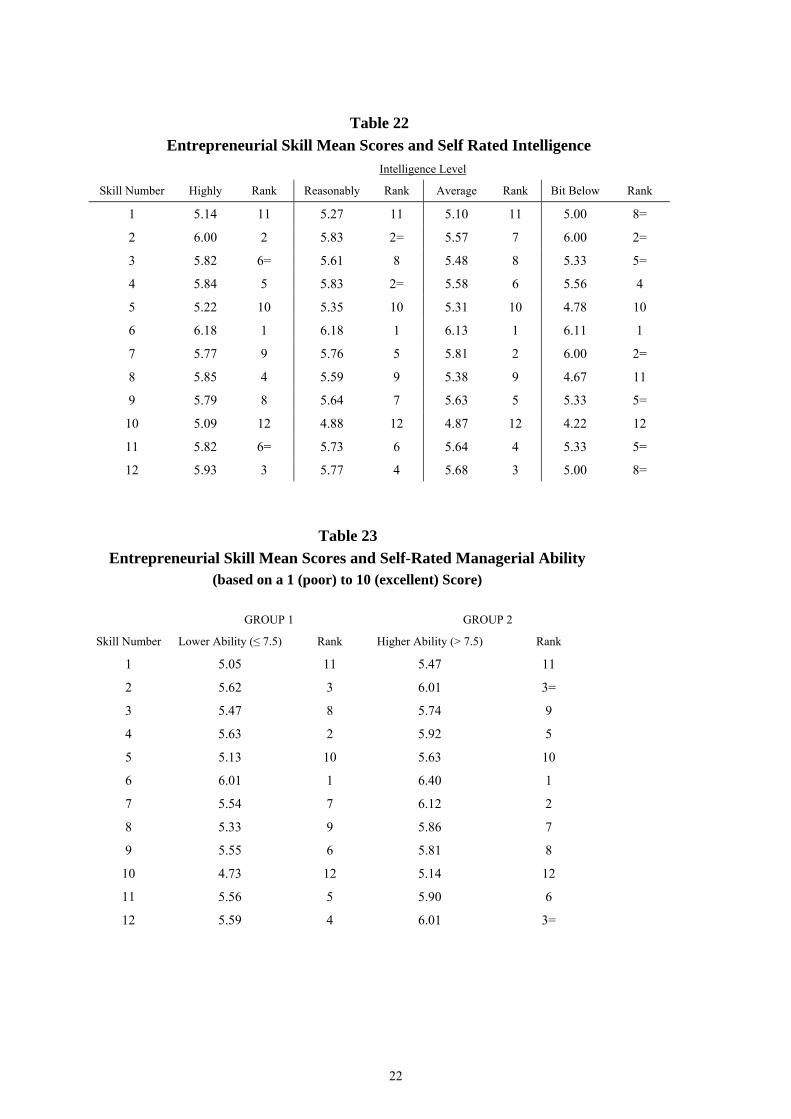
Table 22
Entrepreneurial Skill Mean Scores and Self Rated Intelligence Intelligence Level
Skill Number Highly Rank Reasonably Rank Average Rank Bit Below Rank
1 5.14 11 5.27 11 5.10 11 5.00 8=
2 6.00 2 5.83 2= 5.57 7 6.00 2=
3 5.82 6= 5.61 8 5.48 8 5.33 5=
4 5.84 5 5.83 2= 5.58 6 5.56 4
5 5.22 10 5.35 10 5.31 10 4.78 10
6 6.18 1 6.18 1 6.13 1 6.11 1
7 5.77 9 5.76 5 5.81 2 6.00 2=
8 5.85 4 5.59 9 5.38 9 4.67 11
9 5.79 8 5.64 7 5.63 5 5.33 5=
10 5.09 12 4.88 12 4.87 12 4.22 12
11 5.82 6= 5.73 6 5.64 4 5.33 5=
12 5.93 3 5.77 4 5.68 3 5.00 8=
Table 23 Entrepreneurial Skill Mean Scores and Self-Rated Managerial Ability
(based on a 1 (poor) to 10 (excellent) Score)
GROUP 1 GROUP 2
Skill Number Lower Ability (≤ 7.5) Rank Higher Ability (> 7.5) Rank
1 5.05 11 5.47 11
2 5.62 3 6.01 3=
3 5.47 8 5.74 9
4 5.63 2 5.92 5
5 5.13 10 5.63 10
6 6.01 1 6.40 1
7 5.54 7 6.12 2
8 5.33 9 5.86 7
9 5.55 6 5.81 8
10 4.73 12 5.14 12
11 5.56 5 5.90 6
12 5.59 4 6.01 3=
23
Table 24 Entrepreneurial Skill Mean Scores for Farmers With/Without a Farm Computer
Skill Number Farmers
with a computer Rank Farmers
without a computer Rank
1 5.29 10 5.11 11
2 5.90 2 5.63 6
3 5.67 8= 5.46 8
4 5.81 3 5.69 5
5 5.25 11 5.45 9
6 6.19 1 6.12 1
7 5.68 7 5.91 2
8 5.67 8= 5.39 10
9 5.72 5 5.56 7
10 4.93 12 4.86 12
11 5.69 6 5.71 4
12 5.77 4 5.72 3
Table 25 Entrepreneurial Skill Mean Scores for Farmers With/Without
An Objective of Maximum Sustainable Net Cash Income
Skill Number
Farmers with Profit Objective
Rank
Farmers Without Profit Objective
Maximum Rank
1 5.46 11 5.02 11
2 6.00 3 5.62 2
3 5.76 8= 5.45 8
4 5.98 4 5.59 4
5 5.51 10 5.21 10
6 6.33 1 6.03 1
7 6.08 2 5.56 5=
8 5.76 8= 5.39 9
9 5.84 7 5.51 7
10 5.11 12 4.74 12
11 5.88 6 5.56 5=
12 5.96 5 5.59 3
24
Table 26 Entrepreneurial Skill Mean Scores for Different Management Styles
(Four Clusters)
Skill Number Cluster One Rank Cluster Two Rank Cluster Three Rank Cluster Four Rank
1 4.57 11 5.29 11 5.29 10 5.53 11
2 5.11 7 5.82 5 5.84 2 6.10 3
3 5.00 9 5.69 8 5.58 8 5.91 7
4 5.37 2 5.83 4 5.72 3 5.97 5
5 4.78 10 5.40 10 5.23 11 5.71 10
6 5.91 1 6.21 1 6.13 1 6.38 1
7 5.29 3 5.85 2= 5.67 6 6.11 2
8 5.26 5= 5.55 9 5.57 9 5.75 9
9 5.06 8 5.80 7 5.69 5 5.84 8
10 4.40 12 4.95 12 4.82 12 5.33 12
11 5.26 5= 5.81 6 5.64 7 5.95 6
12 5.28 4 5.85 2= 5.71 4 6.01 4
25
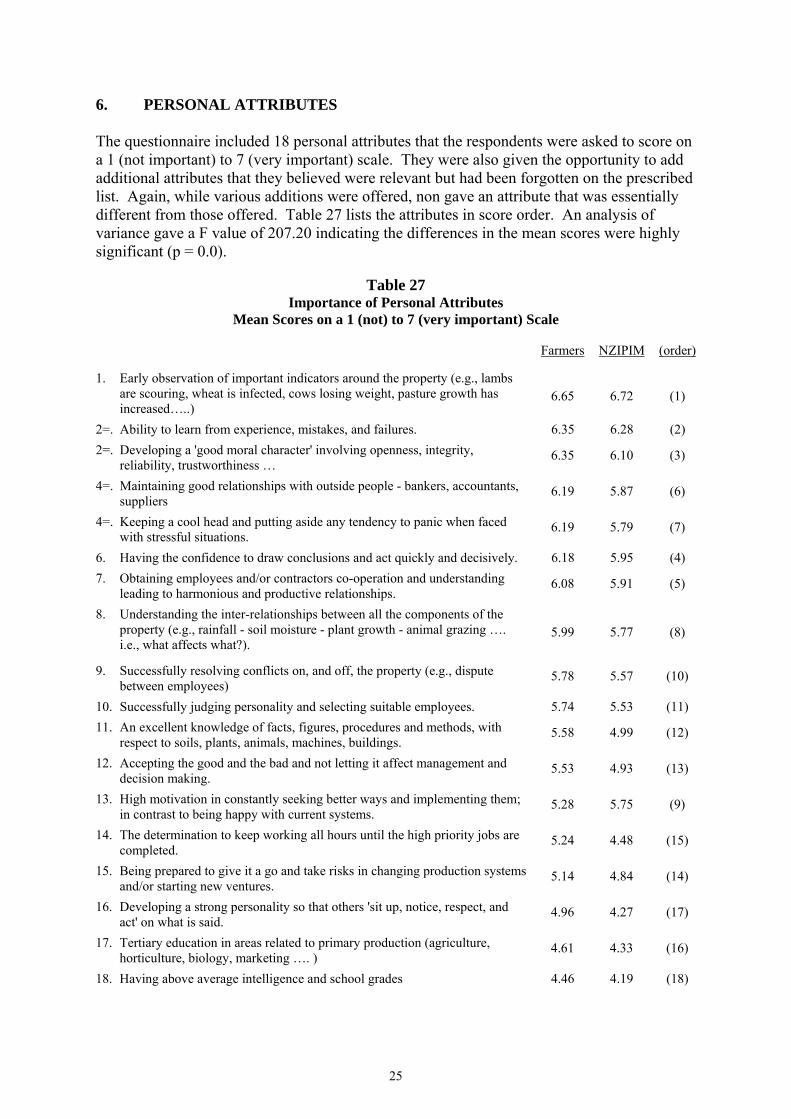
6. PERSONAL ATTRIBUTES The questionnaire included 18 personal attributes that the respondents were asked to score on a 1 (not important) to 7 (very important) scale. They were also given the opportunity to add additional attributes that they believed were relevant but had been forgotten on the prescribed list. Again, while various additions were offered, non gave an attribute that was essentially different from those offered. Table 27 lists the attributes in score order. An analysis of variance gave a F value of 207.20 indicating the differences in the mean scores were highly significant (p = 0.0).
Table 27 Importance of Personal Attributes
Mean Scores on a 1 (not) to 7 (very important) Scale
Farmers NZIPIM (order)
1. Early observation of important indicators around the property (e.g., lambs are scouring, wheat is infected, cows losing weight, pasture growth has increased…..)
6.65
6.72
(1)
2=. Ability to learn from experience, mistakes, and failures. 6.35 6.28 (2) 2=. Developing a 'good moral character' involving openness, integrity,
reliability, trustworthiness … 6.35 6.10 (3)
4=. Maintaining good relationships with outside people - bankers, accountants, suppliers
6.19 5.87 (6)
4=. Keeping a cool head and putting aside any tendency to panic when faced with stressful situations.
6.19 5.79 (7)
6. Having the confidence to draw conclusions and act quickly and decisively. 6.18 5.95 (4) 7. Obtaining employees and/or contractors co-operation and understanding
leading to harmonious and productive relationships. 6.08 5.91 (5)
8. Understanding the inter-relationships between all the components of the property (e.g., rainfall - soil moisture - plant growth - animal grazing …. i.e., what affects what?).
5.99
5.77
(8)
9. Successfully resolving conflicts on, and off, the property (e.g., dispute between employees)
5.78 5.57 (10)
10. Successfully judging personality and selecting suitable employees. 5.74 5.53 (11) 11. An excellent knowledge of facts, figures, procedures and methods, with
respect to soils, plants, animals, machines, buildings. 5.58 4.99 (12)
12. Accepting the good and the bad and not letting it affect management and decision making.
5.53 4.93 (13)
13. High motivation in constantly seeking better ways and implementing them; in contrast to being happy with current systems.
5.28 5.75 (9)
14. The determination to keep working all hours until the high priority jobs are completed.
5.24 4.48 (15)
15. Being prepared to give it a go and take risks in changing production systems and/or starting new ventures.
5.14 4.84 (14)
16. Developing a strong personality so that others 'sit up, notice, respect, and act' on what is said.
4.96 4.27 (17)
17. Tertiary education in areas related to primary production (agriculture, horticulture, biology, marketing …. )
4.61 4.33 (16)
18. Having above average intelligence and school grades 4.46 4.19 (18)
26
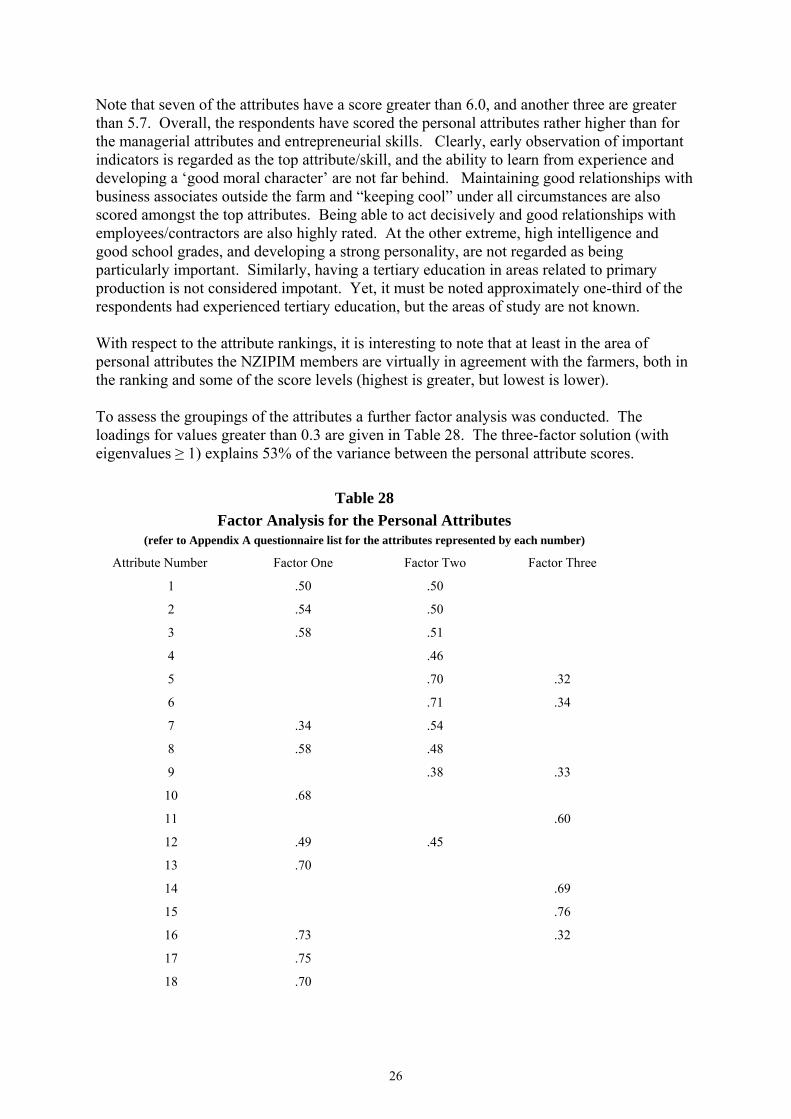
Note that seven of the attributes have a score greater than 6.0, and another three are greater than 5.7. Overall, the respondents have scored the personal attributes rather higher than for the managerial attributes and entrepreneurial skills. Clearly, early observation of important indicators is regarded as the top attribute/skill, and the ability to learn from experience and developing a ‘good moral character’ are not far behind. Maintaining good relationships with business associates outside the farm and “keeping cool” under all circumstances are also scored amongst the top attributes. Being able to act decisively and good relationships with employees/contractors are also highly rated. At the other extreme, high intelligence and good school grades, and developing a strong personality, are not regarded as being particularly important. Similarly, having a tertiary education in areas related to primary production is not considered impotant. Yet, it must be noted approximately one-third of the respondents had experienced tertiary education, but the areas of study are not known. With respect to the attribute rankings, it is interesting to note that at least in the area of personal attributes the NZIPIM members are virtually in agreement with the farmers, both in the ranking and some of the score levels (highest is greater, but lowest is lower). To assess the groupings of the attributes a further factor analysis was conducted. The loadings for values greater than 0.3 are given in Table 28. The three-factor solution (with eigenvalues ≥ 1) explains 53% of the variance between the personal attribute scores.
Table 28 Factor Analysis for the Personal Attributes
(refer to Appendix A questionnaire list for the attributes represented by each number)
Attribute Number Factor One Factor Two Factor Three
1 .50 .50
2 .54 .50
3 .58 .51
4 .46
5 .70 .32
6 .71 .34
7 .34 .54
8 .58 .48
9 .38 .33
10 .68
11 .60
12 .49 .45
13 .70
14 .69
15 .76
16 .73 .32
17 .75
18 .70
27
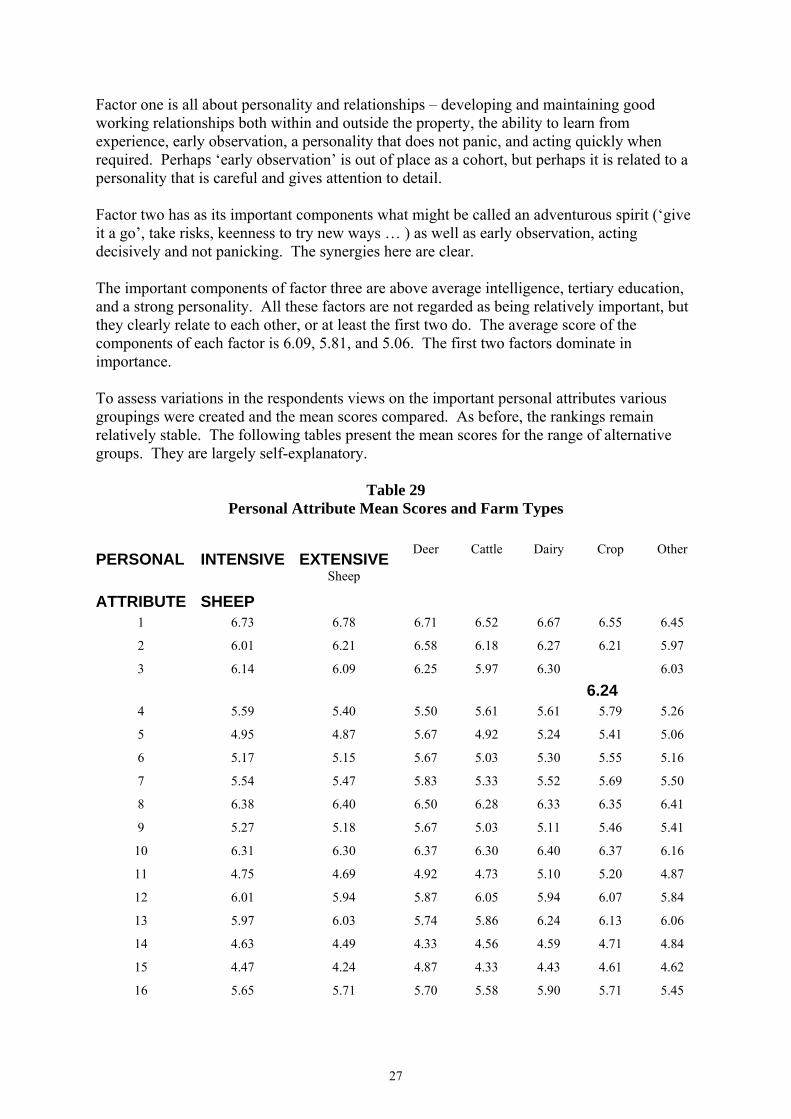
Factor one is all about personality and relationships – developing and maintaining good working relationships both within and outside the property, the ability to learn from experience, early observation, a personality that does not panic, and acting quickly when required. Perhaps ‘early observation’ is out of place as a cohort, but perhaps it is related to a personality that is careful and gives attention to detail. Factor two has as its important components what might be called an adventurous spirit (‘give it a go’, take risks, keenness to try new ways … ) as well as early observation, acting decisively and not panicking. The synergies here are clear. The important components of factor three are above average intelligence, tertiary education, and a strong personality. All these factors are not regarded as being relatively important, but they clearly relate to each other, or at least the first two do. The average score of the components of each factor is 6.09, 5.81, and 5.06. The first two factors dominate in importance. To assess variations in the respondents views on the important personal attributes various groupings were created and the mean scores compared. As before, the rankings remain relatively stable. The following tables present the mean scores for the range of alternative groups. They are largely self-explanatory.
Table 29 Personal Attribute Mean Scores and Farm Types
PERSONAL
ATTRIBUTE
INTENSIVE
SHEEP
EXTENSIVESheep
Deer
Cattle
Dairy
Crop
Other
1 6.73 6.78 6.71 6.52 6.67 6.55 6.45
2 6.01 6.21 6.58 6.18 6.27 6.21 5.97
3 6.14 6.09 6.25 5.97 6.30
6.24 6.03
4 5.59 5.40 5.50 5.61 5.61 5.79 5.26
5 4.95 4.87 5.67 4.92 5.24 5.41 5.06
6 5.17 5.15 5.67 5.03 5.30 5.55 5.16
7 5.54 5.47 5.83 5.33 5.52 5.69 5.50
8 6.38 6.40 6.50 6.28 6.33 6.35 6.41
9 5.27 5.18 5.67 5.03 5.11 5.46 5.41
10 6.31 6.30 6.37 6.30 6.40 6.37 6.16
11 4.75 4.69 4.92 4.73 5.10 5.20 4.87
12 6.01 5.94 5.87 6.05 5.94 6.07 5.84
13 5.97 6.03 5.74 5.86 6.24 6.13 6.06
14 4.63 4.49 4.33 4.56 4.59 4.71 4.84
15 4.47 4.24 4.87 4.33 4.43 4.61 4.62
16 5.65 5.71 5.70 5.58 5.90 5.71 5.45
28
17 5.64 5.57 5.96 5.70 5.92 5.88 5.55
18 6.25 6.25 6.29 6.15 6.23 6.06 6.09
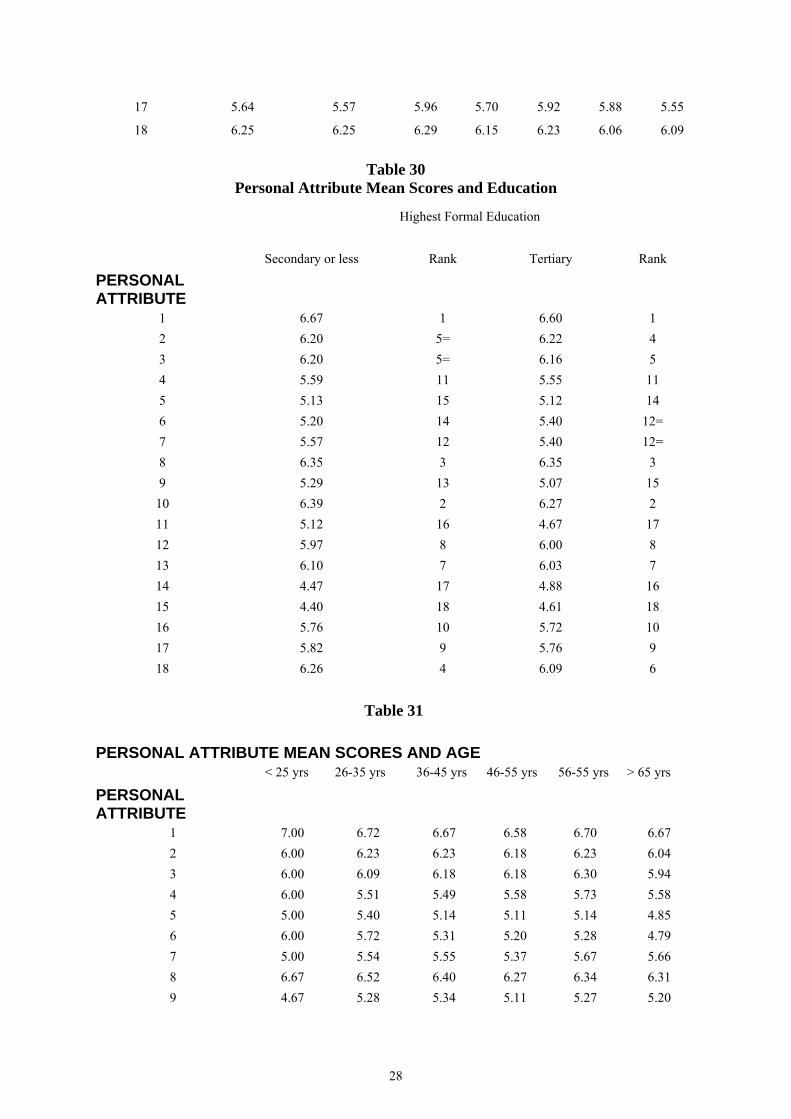
Table 30 Personal Attribute Mean Scores and Education
Highest Formal Education
PERSONAL ATTRIBUTE
Secondary or less Rank Tertiary Rank
1 6.67 1 6.60 1 2 6.20 5= 6.22 4 3 6.20 5= 6.16 5 4 5.59 11 5.55 11 5 5.13 15 5.12 14 6 5.20 14 5.40 12= 7 5.57 12 5.40 12= 8 6.35 3 6.35 3 9 5.29 13 5.07 15
10 6.39 2 6.27 2 11 5.12 16 4.67 17 12 5.97 8 6.00 8 13 6.10 7 6.03 7 14 4.47 17 4.88 16 15 4.40 18 4.61 18 16 5.76 10 5.72 10 17 5.82 9 5.76 9 18 6.26 4 6.09 6
Table 31
PERSONAL ATTRIBUTE MEAN SCORES AND AGE
PERSONAL ATTRIBUTE
< 25 yrs 26-35 yrs 36-45 yrs 46-55 yrs 56-55 yrs > 65 yrs
1 7.00 6.72 6.67 6.58 6.70 6.67 2 6.00 6.23 6.23 6.18 6.23 6.04 3 6.00 6.09 6.18 6.18 6.30 5.94 4 6.00 5.51 5.49 5.58 5.73 5.58 5 5.00 5.40 5.14 5.11 5.14 4.85 6 6.00 5.72 5.31 5.20 5.28 4.79 7 5.00 5.54 5.55 5.37 5.67 5.66 8 6.67 6.52 6.40 6.27 6.34 6.31 9 4.67 5.28 5.34 5.11 5.27 5.20
29
10 6.00 6.30 6.32 6.20 6.53 6.58 11 5.33 5.03 4.85 4.67 5.30 5.30 12 6.67 5.97 5.94 5.96 6.06 5.95 13 6.67 5.92 6.06 6.08 6.10 6.24 14 6.00 4.27 4.38 4.65 4.85 4.78 15 4.67 4.36 4.29 4.35 4.69 4.81 16 5.67 5.51 5.71 5.76 5.83 5.79 17 5.67 5.73 5.77 5.74 5.86 5.81 18 7.00 6.04 6.14 6.18 6.31 6.23
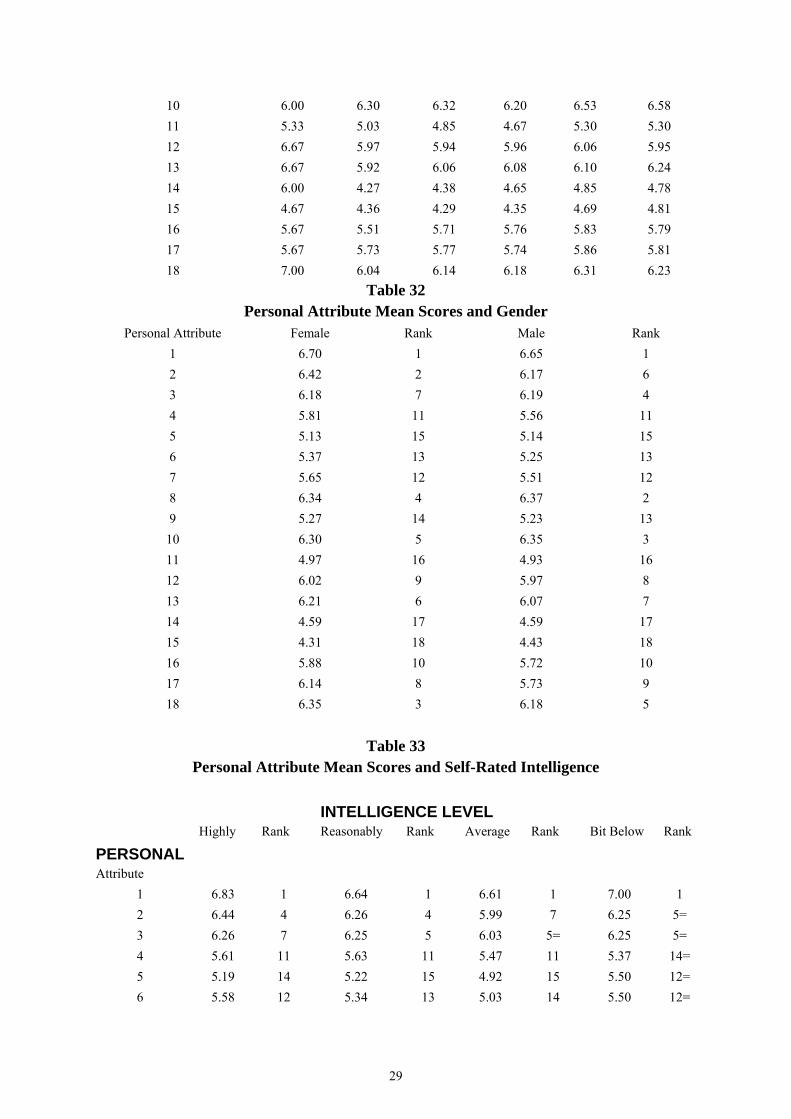
Table 32 Personal Attribute Mean Scores and Gender
Personal Attribute Female Rank Male Rank 1 6.70 1 6.65 1 2 6.42 2 6.17 6 3 6.18 7 6.19 4 4 5.81 11 5.56 11 5 5.13 15 5.14 15 6 5.37 13 5.25 13 7 5.65 12 5.51 12 8 6.34 4 6.37 2 9 5.27 14 5.23 13
10 6.30 5 6.35 3 11 4.97 16 4.93 16 12 6.02 9 5.97 8 13 6.21 6 6.07 7 14 4.59 17 4.59 17 15 4.31 18 4.43 18 16 5.88 10 5.72 10 17 6.14 8 5.73 9 18 6.35 3 6.18 5
Table 33
Personal Attribute Mean Scores and Self-Rated Intelligence
INTELLIGENCE LEVEL
PERSONAL Attribute
Highly Rank Reasonably Rank Average Rank Bit Below Rank
1 6.83 1 6.64 1 6.61 1 7.00 1 2 6.44 4 6.26 4 5.99 7 6.25 5= 3 6.26 7 6.25 5 6.03 5= 6.25 5= 4 5.61 11 5.63 11 5.47 11 5.37 14= 5 5.19 14 5.22 15 4.92 15 5.50 12= 6 5.58 12 5.34 13 5.03 14 5.50 12=
30
7 5.51 13 5.57 12 5.45 12 5.37 14= 8 6.59 2 6.36 2 6.27 3 6.75 2 9 4.91 16 5.25 14 5.30 13 6.12 8
10 6.54 3 6.35 3 6.31 2 6.25 5 11 4.92 15 5.01 16 4.91 16 4.62 16 12 6.13 8 5.97 8 5.96 8 6.12 8= 13 6.43 5 6.06 7 6.03 5= 6.50 4 14 4.28 18 4.72 17 4.53 17 3.87 17 15 4.54 17 4.61 18 4.19 18 3.25 18 16 5.77 10 5.79 9 5.64 10 5.62 11 17 6.06 9 5.80 10 5.68 9 5.87 10 18 6.30 6 6.22 6 6.11 4 6.62 3
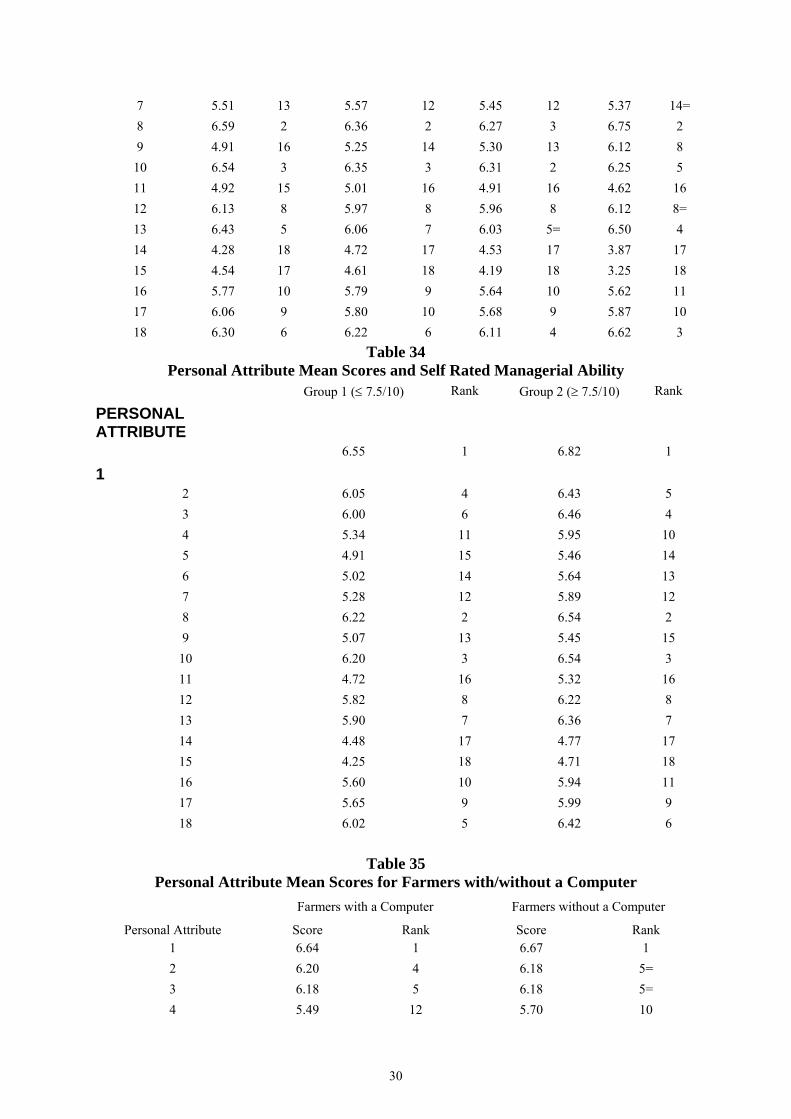
Table 34 Personal Attribute Mean Scores and Self Rated Managerial Ability
PERSONAL ATTRIBUTE
Group 1 (≤ 7.5/10) Rank Group 2 (≥ 7.5/10) Rank
1 6.55 1 6.82 1
2 6.05 4 6.43 5 3 6.00 6 6.46 4 4 5.34 11 5.95 10 5 4.91 15 5.46 14 6 5.02 14 5.64 13 7 5.28 12 5.89 12 8 6.22 2 6.54 2 9 5.07 13 5.45 15
10 6.20 3 6.54 3 11 4.72 16 5.32 16 12 5.82 8 6.22 8 13 5.90 7 6.36 7 14 4.48 17 4.77 17 15 4.25 18 4.71 18 16 5.60 10 5.94 11 17 5.65 9 5.99 9 18 6.02 5 6.42 6
Table 35
Personal Attribute Mean Scores for Farmers with/without a Computer Farmers with a Computer Farmers without a Computer
Personal Attribute Score Rank Score Rank 1 6.64 1 6.67 1 2 6.20 4 6.18 5= 3 6.18 5 6.18 5= 4 5.49 12 5.70 10
31
5 5.24 14 5.02 16 6 5.38 13 5.15 14 7 5.54 11 5.51 12 8 6.37 2 6.34 3 9 5.20 15 5.28 13
10 6.30 3 6.41 2 11 4.84 16 5.10 15 12 5.95 8 6.04 8 13 6.05 7 6.12 7 14 4.59 17 4.63 17 15 4.43 18 4.49 18 16 5.81 9 5.66 11 17 5.79 10 5.78 9 18 6.13 6 6.27 4
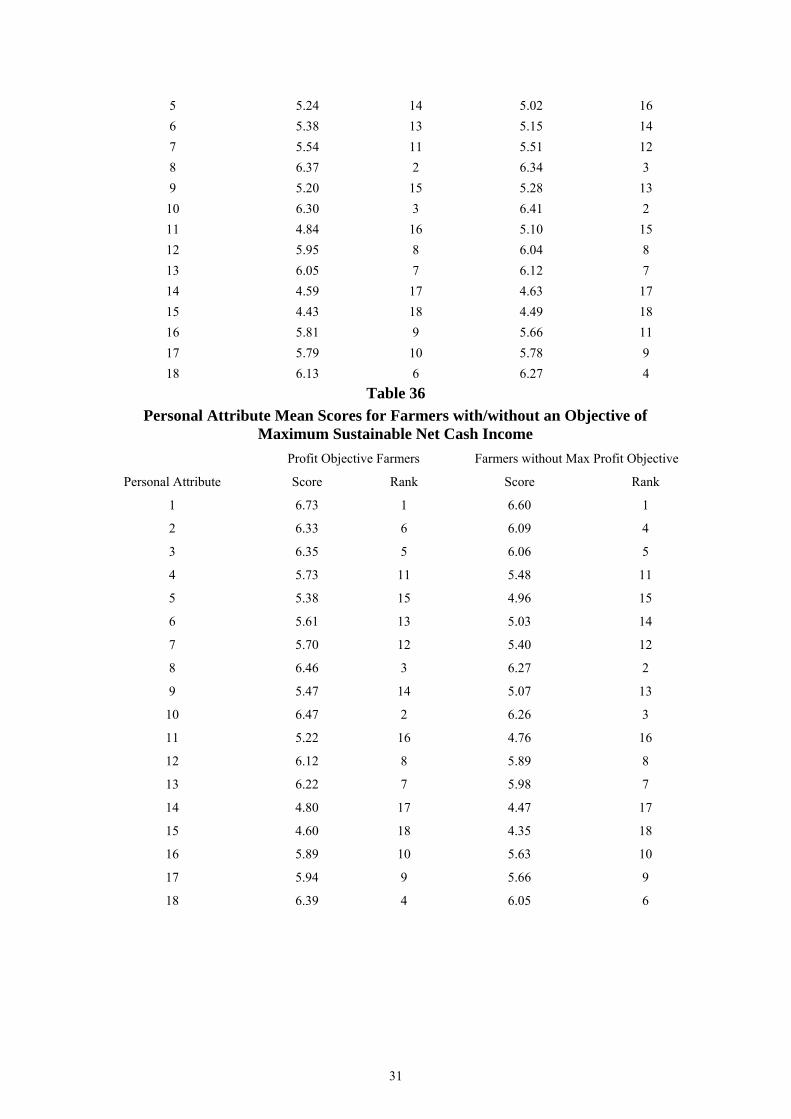
Table 36 Personal Attribute Mean Scores for Farmers with/without an Objective of
Maximum Sustainable Net Cash Income Profit Objective Farmers Farmers without Max Profit Objective
Personal Attribute Score Rank Score Rank
1 6.73 1 6.60 1
2 6.33 6 6.09 4
3 6.35 5 6.06 5
4 5.73 11 5.48 11
5 5.38 15 4.96 15
6 5.61 13 5.03 14
7 5.70 12 5.40 12
8 6.46 3 6.27 2
9 5.47 14 5.07 13
10 6.47 2 6.26 3
11 5.22 16 4.76 16
12 6.12 8 5.89 8
13 6.22 7 5.98 7
14 4.80 17 4.47 17
15 4.60 18 4.35 18
16 5.89 10 5.63 10
17 5.94 9 5.66 9
18 6.39 4 6.05 6
32
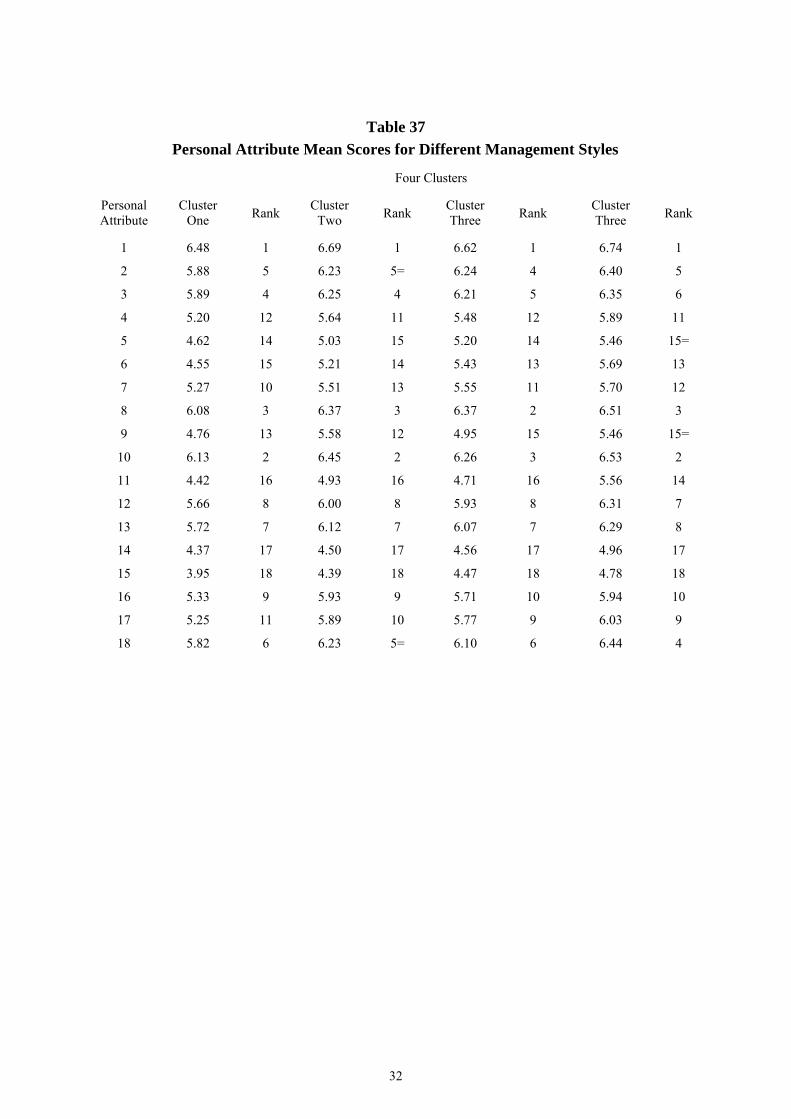
Table 37
Personal Attribute Mean Scores for Different Management Styles
Four Clusters
Personal Attribute
Cluster One Rank Cluster
Two Rank Cluster Three Rank Cluster
Three Rank
1 6.48 1 6.69 1 6.62 1 6.74 1
2 5.88 5 6.23 5= 6.24 4 6.40 5
3 5.89 4 6.25 4 6.21 5 6.35 6
4 5.20 12 5.64 11 5.48 12 5.89 11
5 4.62 14 5.03 15 5.20 14 5.46 15=
6 4.55 15 5.21 14 5.43 13 5.69 13
7 5.27 10 5.51 13 5.55 11 5.70 12
8 6.08 3 6.37 3 6.37 2 6.51 3
9 4.76 13 5.58 12 4.95 15 5.46 15=
10 6.13 2 6.45 2 6.26 3 6.53 2
11 4.42 16 4.93 16 4.71 16 5.56 14
12 5.66 8 6.00 8 5.93 8 6.31 7
13 5.72 7 6.12 7 6.07 7 6.29 8
14 4.37 17 4.50 17 4.56 17 4.96 17
15 3.95 18 4.39 18 4.47 18 4.78 18
16 5.33 9 5.93 9 5.71 10 5.94 10
17 5.25 11 5.89 10 5.77 9 6.03 9
18 5.82 6 6.23 5= 6.10 6 6.44 4
33
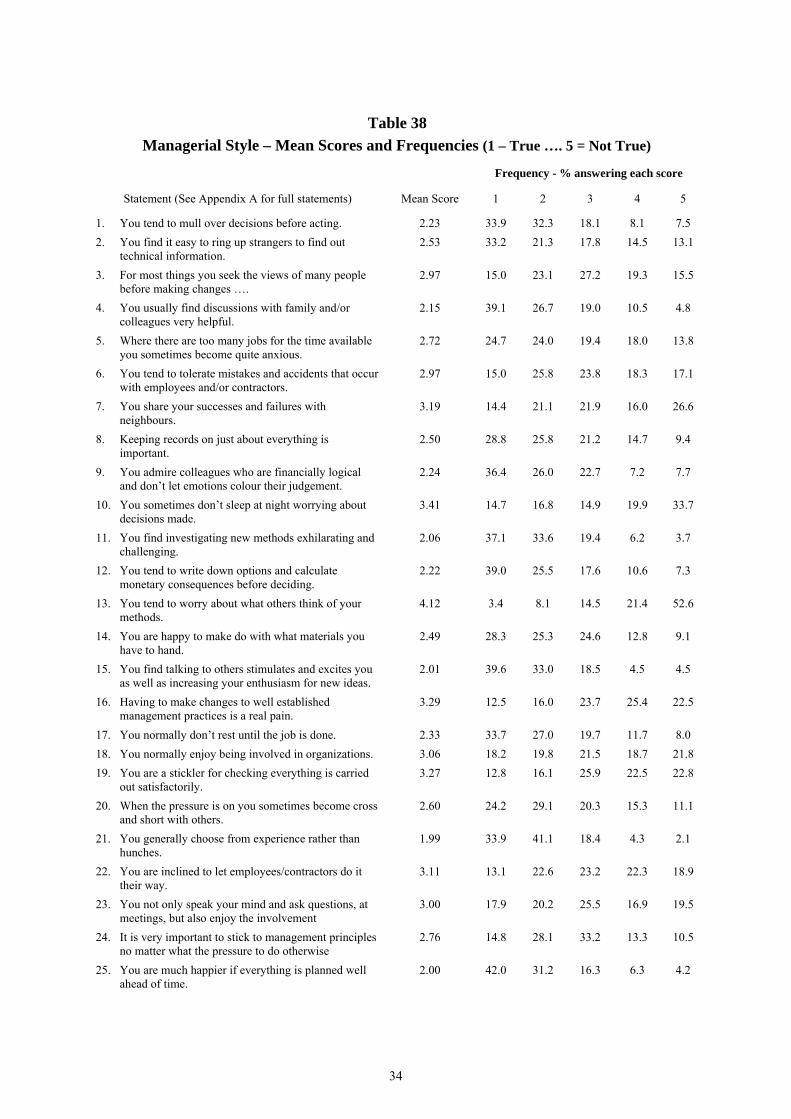
7. MANAGERIAL STYLE Psychologists generally believe personality is made up of five basic traits (Matthews & Deary, 1998). In any individual the expression of each trait is determined by a person’s genetic makeup and environmental influences. It seems the environment’s influence is about 65% of a person’s personality. Whatever the case, it is possible that an individual’s personality will influence their managerial skill and their potential to improve it through training. Similarly, their inherent intelligence might also influence skill and improve potential. Thus the inclusion of self rated intelligence and education levels in the survey. It would be desirable to actually measure intelligence, but this is clearly not possible in a mail survey. But it was possible to include questions designed to assess a person’s managerial style. These are based on this five-trait theory of personality, so 25 questions – five based on each trait – were included. As the questions (See Appendix A) were concluded in managerial terms, it is appropriate to refer to ‘managerial style’ rather than personality. As the question set was developed for this survey, a body of knowledge has yet to be built up on the standard ‘styles’ that exist in the rural community. The responses provide a start in this direction, as did the NZIPIM members’ responses, but in a different management arena, though the two sets could, logically, be similar. There is no right or wrong management style, though particular styles might be better suited to primary production. This is yet to be determined. In this first instance it is important to record the styles for use in analysing correlations with other factors. Thus the use of ‘management style clusters’ in the analysis presented in this report. Table 38 records the range of answers that exist to each question, and the subsequent table gives details of the clusters the respondents can be grouped into, each one reflecting people who gave similar answers to the questions. This clustering is based on plotting all answers in 25 dimensional space, and recording the memberships of each cluster appearing on the plot. In most cases they are not major spaces between the clusters as a full range exists so there are some relatively arbitrary decisions in where to draw the lines between the groups.
34
Table 38
Managerial Style – Mean Scores and Frequencies (1 – True …. 5 = Not True)
Frequency - % answering each score
Statement (See Appendix A for full statements) Mean Score 1 2 3 4 5
1. You tend to mull over decisions before acting. 2.23 33.9 32.3 18.1 8.1 7.5 2. You find it easy to ring up strangers to find out
technical information. 2.53 33.2 21.3 17.8 14.5 13.1
3. For most things you seek the views of many people before making changes ….
2.97 15.0 23.1 27.2 19.3 15.5
4. You usually find discussions with family and/or colleagues very helpful.
2.15 39.1 26.7 19.0 10.5 4.8
5. Where there are too many jobs for the time available you sometimes become quite anxious.
2.72 24.7 24.0 19.4 18.0 13.8
6. You tend to tolerate mistakes and accidents that occur with employees and/or contractors.
2.97 15.0 25.8 23.8 18.3 17.1
7. You share your successes and failures with neighbours.
3.19 14.4 21.1 21.9 16.0 26.6
8. Keeping records on just about everything is important.
2.50 28.8 25.8 21.2 14.7 9.4
9. You admire colleagues who are financially logical and don’t let emotions colour their judgement.
2.24 36.4 26.0 22.7 7.2 7.7
10. You sometimes don’t sleep at night worrying about decisions made.
3.41 14.7 16.8 14.9 19.9 33.7
11. You find investigating new methods exhilarating and challenging.
2.06 37.1 33.6 19.4 6.2 3.7
12. You tend to write down options and calculate monetary consequences before deciding.
2.22 39.0 25.5 17.6 10.6 7.3
13. You tend to worry about what others think of your methods.
4.12 3.4 8.1 14.5 21.4 52.6
14. You are happy to make do with what materials you have to hand.
2.49 28.3 25.3 24.6 12.8 9.1
15. You find talking to others stimulates and excites you as well as increasing your enthusiasm for new ideas.
2.01 39.6 33.0 18.5 4.5 4.5
16. Having to make changes to well established management practices is a real pain.
3.29 12.5 16.0 23.7 25.4 22.5
17. You normally don’t rest until the job is done. 2.33 33.7 27.0 19.7 11.7 8.0 18. You normally enjoy being involved in organizations. 3.06 18.2 19.8 21.5 18.7 21.8 19. You are a stickler for checking everything is carried
out satisfactorily. 3.27 12.8 16.1 25.9 22.5 22.8
20. When the pressure is on you sometimes become cross and short with others.
2.60 24.2 29.1 20.3 15.3 11.1
21. You generally choose from experience rather than hunches.
1.99 33.9 41.1 18.4 4.3 2.1
22. You are inclined to let employees/contractors do it their way.
3.11 13.1 22.6 23.2 22.3 18.9
23. You not only speak your mind and ask questions, at meetings, but also enjoy the involvement
3.00 17.9 20.2 25.5 16.9 19.5
24. It is very important to stick to management principles no matter what the pressure to do otherwise
2.76 14.8 28.1 33.2 13.3 10.5
25. You are much happier if everything is planned well ahead of time.
2.00 42.0 31.2 16.3 6.3 4.2
35
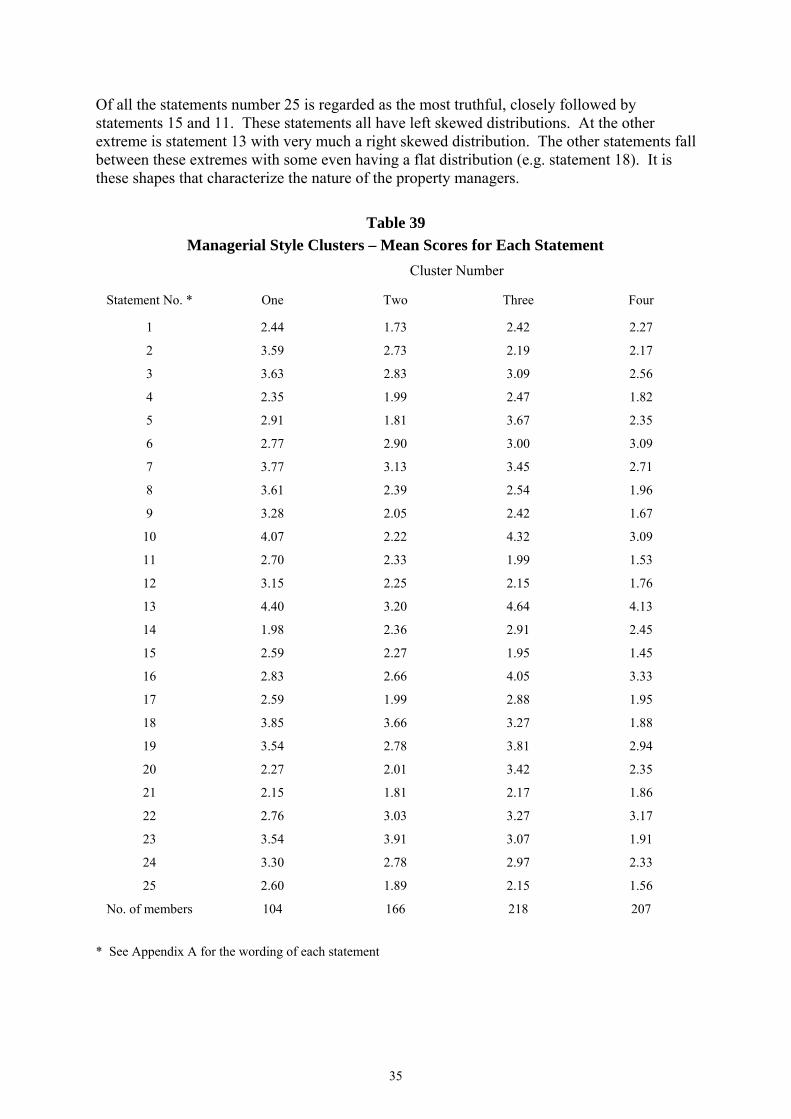
Of all the statements number 25 is regarded as the most truthful, closely followed by statements 15 and 11. These statements all have left skewed distributions. At the other extreme is statement 13 with very much a right skewed distribution. The other statements fall between these extremes with some even having a flat distribution (e.g. statement 18). It is these shapes that characterize the nature of the property managers.
Table 39 Managerial Style Clusters – Mean Scores for Each Statement
Cluster Number
Statement No. * One Two Three Four
1 2.44 1.73 2.42 2.27
2 3.59 2.73 2.19 2.17
3 3.63 2.83 3.09 2.56
4 2.35 1.99 2.47 1.82
5 2.91 1.81 3.67 2.35
6 2.77 2.90 3.00 3.09
7 3.77 3.13 3.45 2.71
8 3.61 2.39 2.54 1.96
9 3.28 2.05 2.42 1.67
10 4.07 2.22 4.32 3.09
11 2.70 2.33 1.99 1.53
12 3.15 2.25 2.15 1.76
13 4.40 3.20 4.64 4.13
14 1.98 2.36 2.91 2.45
15 2.59 2.27 1.95 1.45
16 2.83 2.66 4.05 3.33
17 2.59 1.99 2.88 1.95
18 3.85 3.66 3.27 1.88
19 3.54 2.78 3.81 2.94
20 2.27 2.01 3.42 2.35
21 2.15 1.81 2.17 1.86
22 2.76 3.03 3.27 3.17
23 3.54 3.91 3.07 1.91
24 3.30 2.78 2.97 2.33
25 2.60 1.89 2.15 1.56
No. of members 104 166 218 207
* See Appendix A for the wording of each statement
36
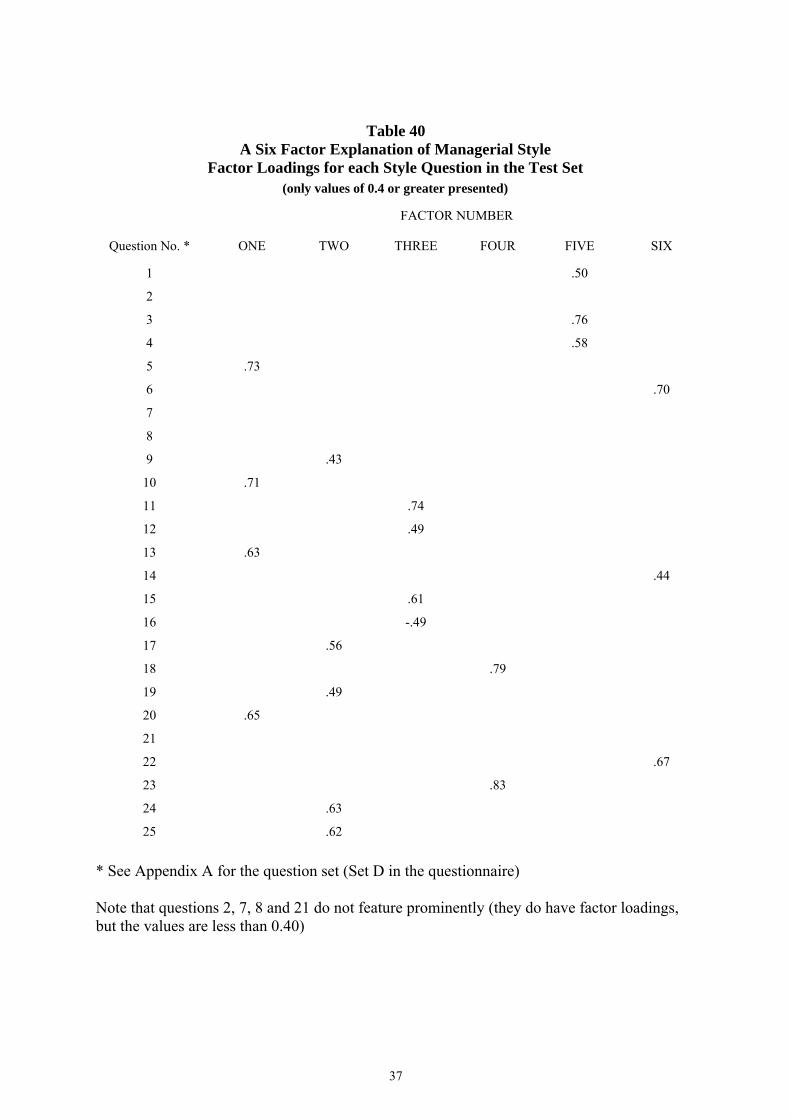
Each cluster has its own distinctive features as portrayed by the mean scores. For example, consider the first three statements. For statement one (mulling over decisions) cluster two people certainly do this, but not members of the other clusters. For statement two, members of cluster one do not find it easy to ring up strangers (introverts), so immediately distinctions between the members of each cluster start appearing. For statement three (wide consultation), members of clusters one and three are less inclined to do this than the others (as you would expect of introverts). Thus, it is clear how the distinctive groups emerge. These groups might well require different training due to their inherent features – thus the groups containing introverts may require systems encouraging them to consult more widely and seek wide sources of information which, in the end, enable improved decisions. A solution that gave four clusters was selected largely because each cluster contained a reasonable number of respondents. This decision was somewhat arbitrary as there are many other more detailed cluster groupings. Searching for these is not, however, particularly helpful. The data makes it clear there is a range of managerial styles and, consequently this must be allowed for in developing training systems. To assess which group a particular manager falls in, it would be necessary to administer the series of questions. As noted, managerial style will be partly genetically based, and partly family/education background based (environment). It is therefore possible that observing related, but simple, factors may enable predicting style. To test this possibility a simple linear regression for the relationship between cluster membership and gender, self-rated intelligence and managerial skill was calculated. Perhaps peoples’ view of themselves reflects managerial style? The equation obtained was: Cluster membership = 2.38 – 0.273 Gender – 0.171 SRI + 0.18 SRS (R2 = .287) Where gender = 1 for female SRI/S = self-rated intelligence/skill on the scale used in the questionnaire The equation was highly significant (F = 18.63) and all the parameters similarly (respective t values 6.41, 2.23, 2.48 and 5.61). While the degree of correlation is not great, this aspect could be further investigated at a later stage. As groups of statements making up the managerial style test have similarities based on the five factor personality theory (Matthews and Deary, 1998) it is useful to consider which sets of answers are correlated and, therefore, what factors make up the basic components of managerial style. To determine these a series of factor analyses were conducted. Table 40 presents the results of a six-factor solution. This explains 44% of the variance whereas an eight-factor solution explains 52%. The increase of 8% was not regarded as being helpful given it adds a further two factors (the scree plot suggests six factors give the best explanation).
37
Table 40
A Six Factor Explanation of Managerial Style Factor Loadings for each Style Question in the Test Set
(only values of 0.4 or greater presented)
FACTOR NUMBER
Question No. * ONE TWO THREE FOUR FIVE SIX
1 .50
2
3 .76
4 .58
5 .73
6 .70
7
8
9 .43
10 .71
11 .74
12 .49
13 .63
14 .44
15 .61
16 -.49
17 .56
18 .79
19 .49
20 .65
21
22 .67
23 .83
24 .63
25 .62 * See Appendix A for the question set (Set D in the questionnaire) Note that questions 2, 7, 8 and 21 do not feature prominently (they do have factor loadings, but the values are less than 0.40)
38
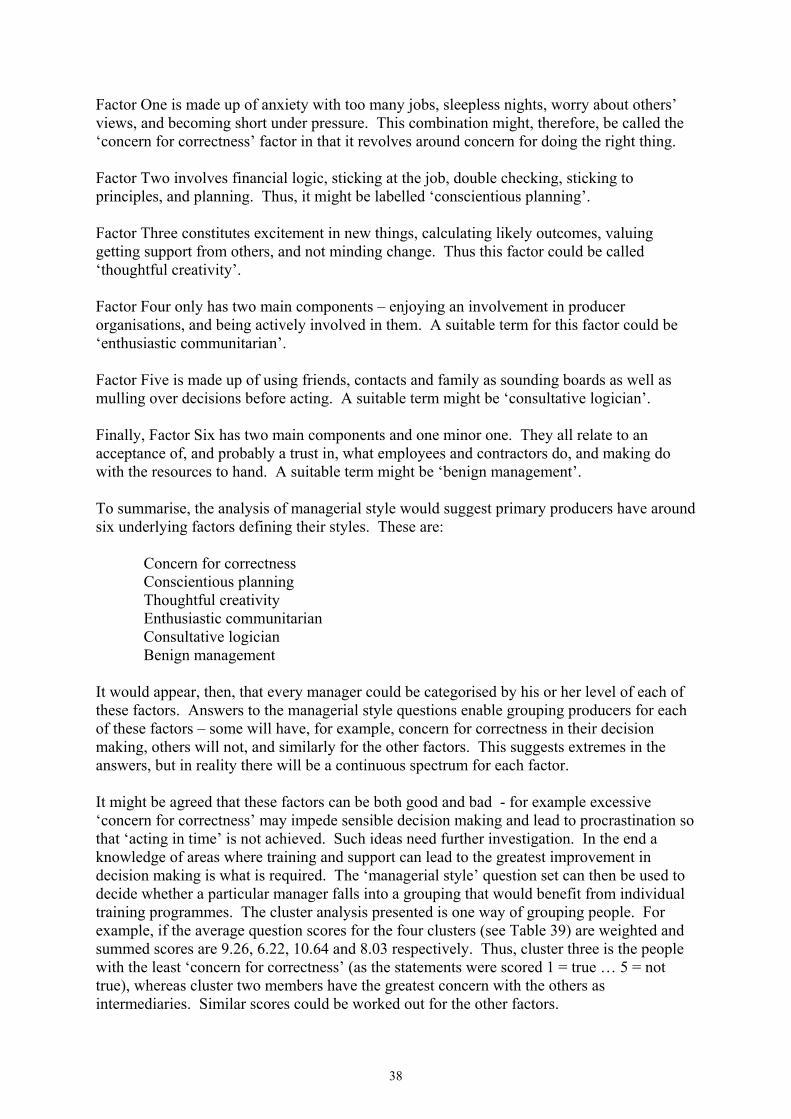
Factor One is made up of anxiety with too many jobs, sleepless nights, worry about others’ views, and becoming short under pressure. This combination might, therefore, be called the ‘concern for correctness’ factor in that it revolves around concern for doing the right thing. Factor Two involves financial logic, sticking at the job, double checking, sticking to principles, and planning. Thus, it might be labelled ‘conscientious planning’. Factor Three constitutes excitement in new things, calculating likely outcomes, valuing getting support from others, and not minding change. Thus this factor could be called ‘thoughtful creativity’. Factor Four only has two main components – enjoying an involvement in producer organisations, and being actively involved in them. A suitable term for this factor could be ‘enthusiastic communitarian’. Factor Five is made up of using friends, contacts and family as sounding boards as well as mulling over decisions before acting. A suitable term might be ‘consultative logician’. Finally, Factor Six has two main components and one minor one. They all relate to an acceptance of, and probably a trust in, what employees and contractors do, and making do with the resources to hand. A suitable term might be ‘benign management’. To summarise, the analysis of managerial style would suggest primary producers have around six underlying factors defining their styles. These are: Concern for correctness Conscientious planning Thoughtful creativity Enthusiastic communitarian Consultative logician Benign management It would appear, then, that every manager could be categorised by his or her level of each of these factors. Answers to the managerial style questions enable grouping producers for each of these factors – some will have, for example, concern for correctness in their decision making, others will not, and similarly for the other factors. This suggests extremes in the answers, but in reality there will be a continuous spectrum for each factor. It might be agreed that these factors can be both good and bad - for example excessive ‘concern for correctness’ may impede sensible decision making and lead to procrastination so that ‘acting in time’ is not achieved. Such ideas need further investigation. In the end a knowledge of areas where training and support can lead to the greatest improvement in decision making is what is required. The ‘managerial style’ question set can then be used to decide whether a particular manager falls into a grouping that would benefit from individual training programmes. The cluster analysis presented is one way of grouping people. For example, if the average question scores for the four clusters (see Table 39) are weighted and summed scores are 9.26, 6.22, 10.64 and 8.03 respectively. Thus, cluster three is the people with the least ‘concern for correctness’ (as the statements were scored 1 = true … 5 = not true), whereas cluster two members have the greatest concern with the others as intermediaries. Similar scores could be worked out for the other factors.
39
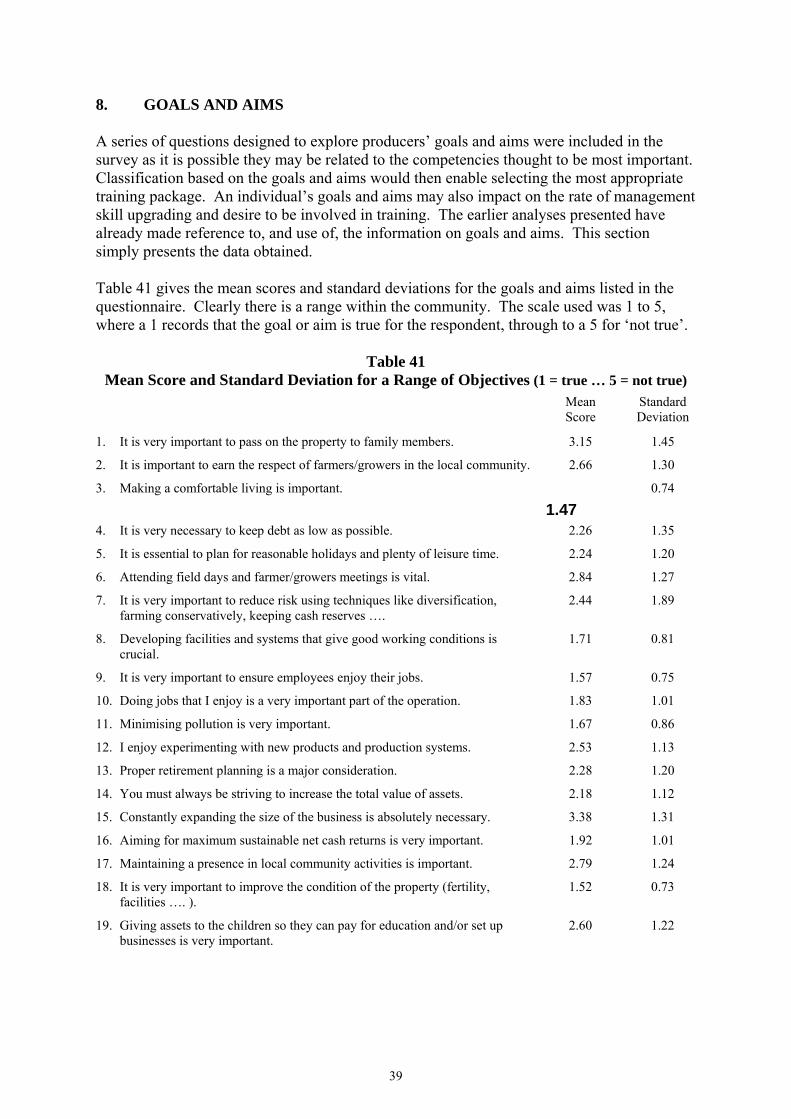
8. GOALS AND AIMS A series of questions designed to explore producers’ goals and aims were included in the survey as it is possible they may be related to the competencies thought to be most important. Classification based on the goals and aims would then enable selecting the most appropriate training package. An individual’s goals and aims may also impact on the rate of management skill upgrading and desire to be involved in training. The earlier analyses presented have already made reference to, and use of, the information on goals and aims. This section simply presents the data obtained. Table 41 gives the mean scores and standard deviations for the goals and aims listed in the questionnaire. Clearly there is a range within the community. The scale used was 1 to 5, where a 1 records that the goal or aim is true for the respondent, through to a 5 for ‘not true’.
Table 41 Mean Score and Standard Deviation for a Range of Objectives (1 = true … 5 = not true)
Mean Score
Standard Deviation
1. It is very important to pass on the property to family members. 3.15 1.45
2. It is important to earn the respect of farmers/growers in the local community. 2.66 1.30
3. Making a comfortable living is important.
1.47 0.74
4. It is very necessary to keep debt as low as possible. 2.26 1.35
5. It is essential to plan for reasonable holidays and plenty of leisure time. 2.24 1.20
6. Attending field days and farmer/growers meetings is vital. 2.84 1.27
7. It is very important to reduce risk using techniques like diversification, farming conservatively, keeping cash reserves ….
2.44 1.89
8. Developing facilities and systems that give good working conditions is crucial.
1.71 0.81
9. It is very important to ensure employees enjoy their jobs. 1.57 0.75
10. Doing jobs that I enjoy is a very important part of the operation. 1.83 1.01
11. Minimising pollution is very important. 1.67 0.86
12. I enjoy experimenting with new products and production systems. 2.53 1.13
13. Proper retirement planning is a major consideration. 2.28 1.20
14. You must always be striving to increase the total value of assets. 2.18 1.12
15. Constantly expanding the size of the business is absolutely necessary. 3.38 1.31
16. Aiming for maximum sustainable net cash returns is very important. 1.92 1.01
17. Maintaining a presence in local community activities is important. 2.79 1.24
18. It is very important to improve the condition of the property (fertility, facilities …. ).
1.52 0.73
19. Giving assets to the children so they can pay for education and/or set up businesses is very important.
2.60 1.22
40
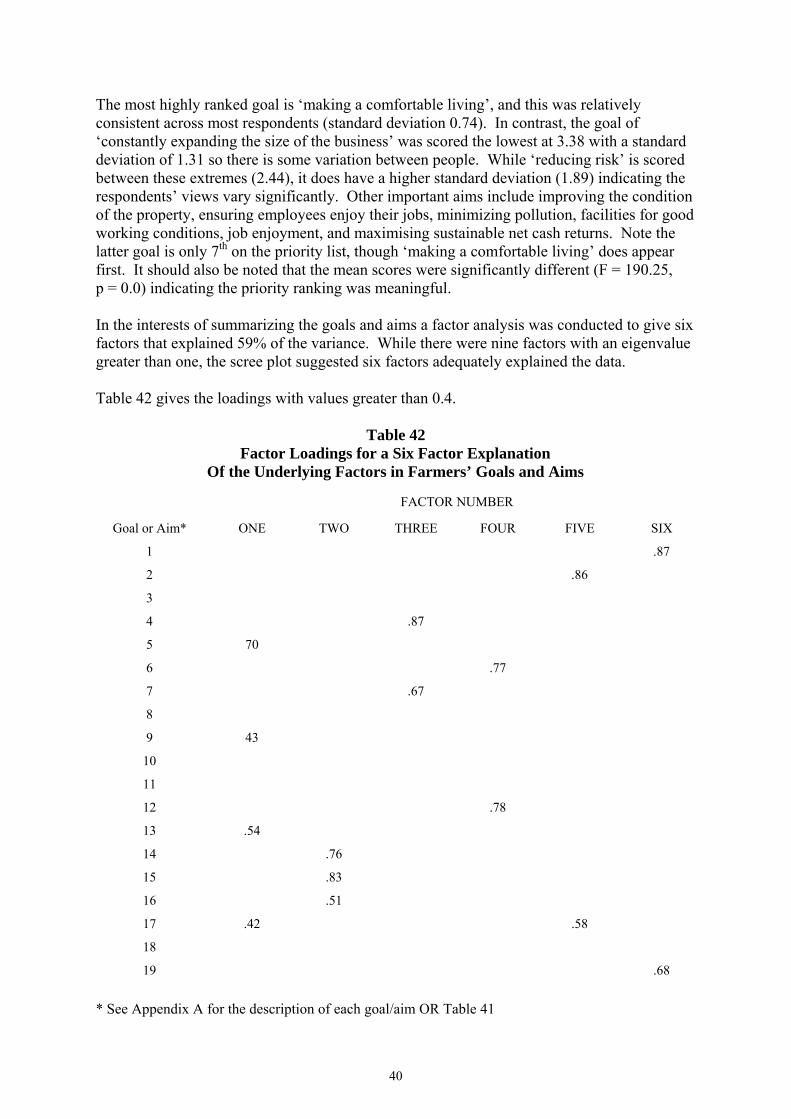
The most highly ranked goal is ‘making a comfortable living’, and this was relatively consistent across most respondents (standard deviation 0.74). In contrast, the goal of ‘constantly expanding the size of the business’ was scored the lowest at 3.38 with a standard deviation of 1.31 so there is some variation between people. While ‘reducing risk’ is scored between these extremes (2.44), it does have a higher standard deviation (1.89) indicating the respondents’ views vary significantly. Other important aims include improving the condition of the property, ensuring employees enjoy their jobs, minimizing pollution, facilities for good working conditions, job enjoyment, and maximising sustainable net cash returns. Note the latter goal is only 7th on the priority list, though ‘making a comfortable living’ does appear first. It should also be noted that the mean scores were significantly different (F = 190.25, p = 0.0) indicating the priority ranking was meaningful. In the interests of summarizing the goals and aims a factor analysis was conducted to give six factors that explained 59% of the variance. While there were nine factors with an eigenvalue greater than one, the scree plot suggested six factors adequately explained the data. Table 42 gives the loadings with values greater than 0.4.
Table 42 Factor Loadings for a Six Factor Explanation
Of the Underlying Factors in Farmers’ Goals and Aims
FACTOR NUMBER
Goal or Aim* ONE TWO THREE FOUR FIVE SIX
1 .87
2 .86
3
4 .87
5 70
6 .77
7 .67
8
9 43
10
11
12 .78
13 .54
14 .76
15 .83
16 .51
17 .42 .58
18
19 .68
* See Appendix A for the description of each goal/aim OR Table 41
41
Note that goal/aim numbers 3, 8, 10, 11 and 18 do not feature as significant components of the factors. This doesn’t mean they are unimportant – on the contrary, they are, but they are independent, rather than correlated with several goals/aims. Factor one features leisure, retirement and employees’ enjoyment (the ‘fun’ factor), factor two features profit and assets (the ‘wealth’ factor), factor three involves the debt and risk minimisation goals (risk aversion factor). Factor four involves field days and new things (innovative factor), whereas factor five is about community and respect (reputation factor) and finally, factor six concerns financially supporting the family (family orientation factor). It is interesting to note most of the goals not featuring directly in the factors are encompassed by the other factors. For example, ‘making a comfortable living’ (goal 3) does not appear, yet this would largely be covered by the ‘wealth factor’. The goal not featuring at all is ‘minimising pollution’. This clearly stands out on its own as a highly rated aim. In summary, the factors are called (i) fun, (ii) wealth, (iii) risk aversion, (iv) innovation, (v) reputation, and (vi) family. They clearly cover most aspects. Any one farmer/family will have an importance ranking for each. This ranking may well influence their attitude to managerial skill improvement.
42
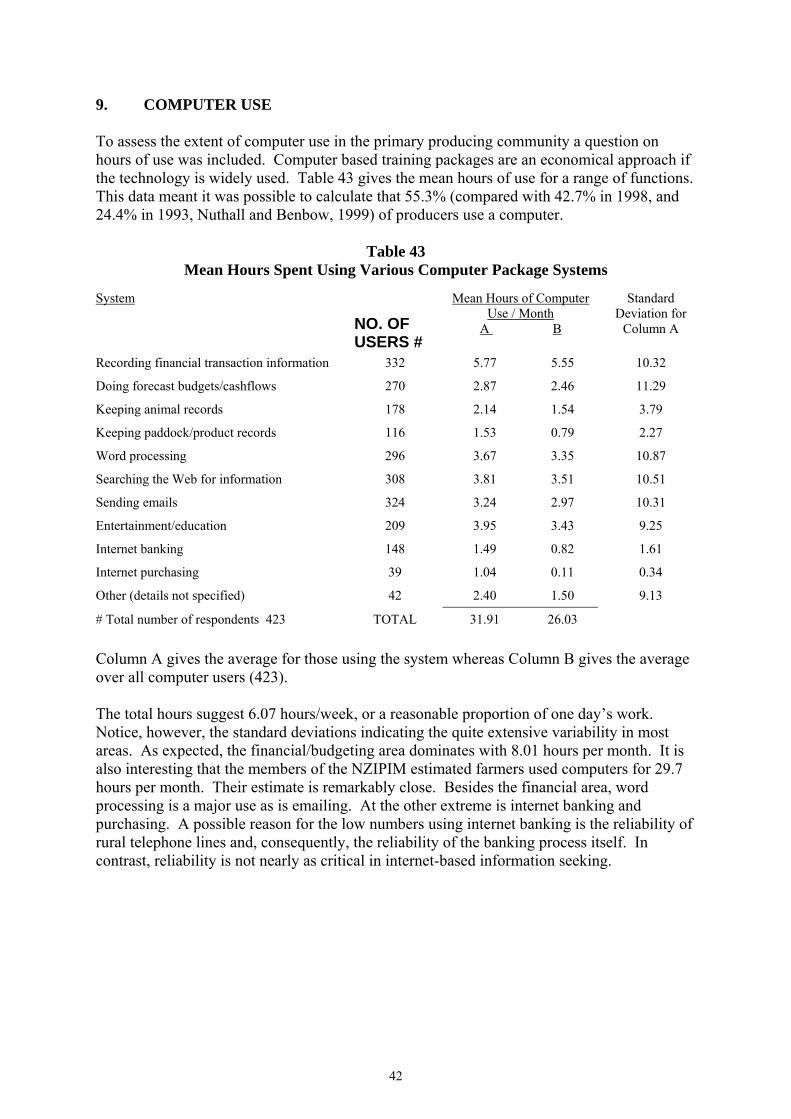
9. COMPUTER USE To assess the extent of computer use in the primary producing community a question on hours of use was included. Computer based training packages are an economical approach if the technology is widely used. Table 43 gives the mean hours of use for a range of functions. This data meant it was possible to calculate that 55.3% (compared with 42.7% in 1998, and 24.4% in 1993, Nuthall and Benbow, 1999) of producers use a computer.
Table 43 Mean Hours Spent Using Various Computer Package Systems
System
NO. OF USERS #
Mean Hours of Computer Use / Month
A B
Standard Deviation for
Column A
Recording financial transaction information 332 5.77 5.55 10.32
Doing forecast budgets/cashflows 270 2.87 2.46 11.29
Keeping animal records 178 2.14 1.54 3.79
Keeping paddock/product records 116 1.53 0.79 2.27
Word processing 296 3.67 3.35 10.87
Searching the Web for information 308 3.81 3.51 10.51
Sending emails 324 3.24 2.97 10.31
Entertainment/education 209 3.95 3.43 9.25
Internet banking 148 1.49 0.82 1.61
Internet purchasing 39 1.04 0.11 0.34
Other (details not specified) 42 2.40 1.50 9.13
# Total number of respondents 423 TOTAL 31.91 26.03 Column A gives the average for those using the system whereas Column B gives the average over all computer users (423). The total hours suggest 6.07 hours/week, or a reasonable proportion of one day’s work. Notice, however, the standard deviations indicating the quite extensive variability in most areas. As expected, the financial/budgeting area dominates with 8.01 hours per month. It is also interesting that the members of the NZIPIM estimated farmers used computers for 29.7 hours per month. Their estimate is remarkably close. Besides the financial area, word processing is a major use as is emailing. At the other extreme is internet banking and purchasing. A possible reason for the low numbers using internet banking is the reliability of rural telephone lines and, consequently, the reliability of the banking process itself. In contrast, reliability is not nearly as critical in internet-based information seeking.
43
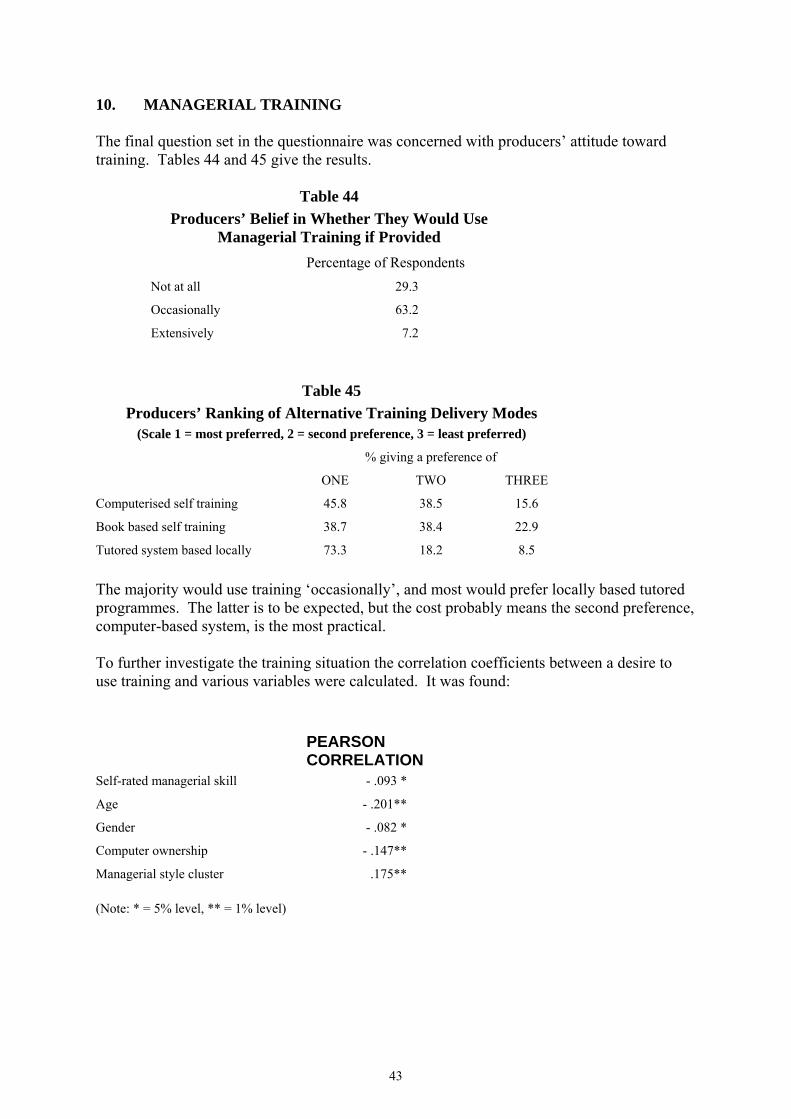
10. MANAGERIAL TRAINING The final question set in the questionnaire was concerned with producers’ attitude toward training. Tables 44 and 45 give the results.
Table 44
Producers’ Belief in Whether They Would Use Managerial Training if Provided
Percentage of Respondents Not at all 29.3
Occasionally 63.2
Extensively 7.2
Table 45 Producers’ Ranking of Alternative Training Delivery Modes
(Scale 1 = most preferred, 2 = second preference, 3 = least preferred)
% giving a preference of
ONE TWO THREE
Computerised self training 45.8 38.5 15.6
Book based self training 38.7 38.4 22.9
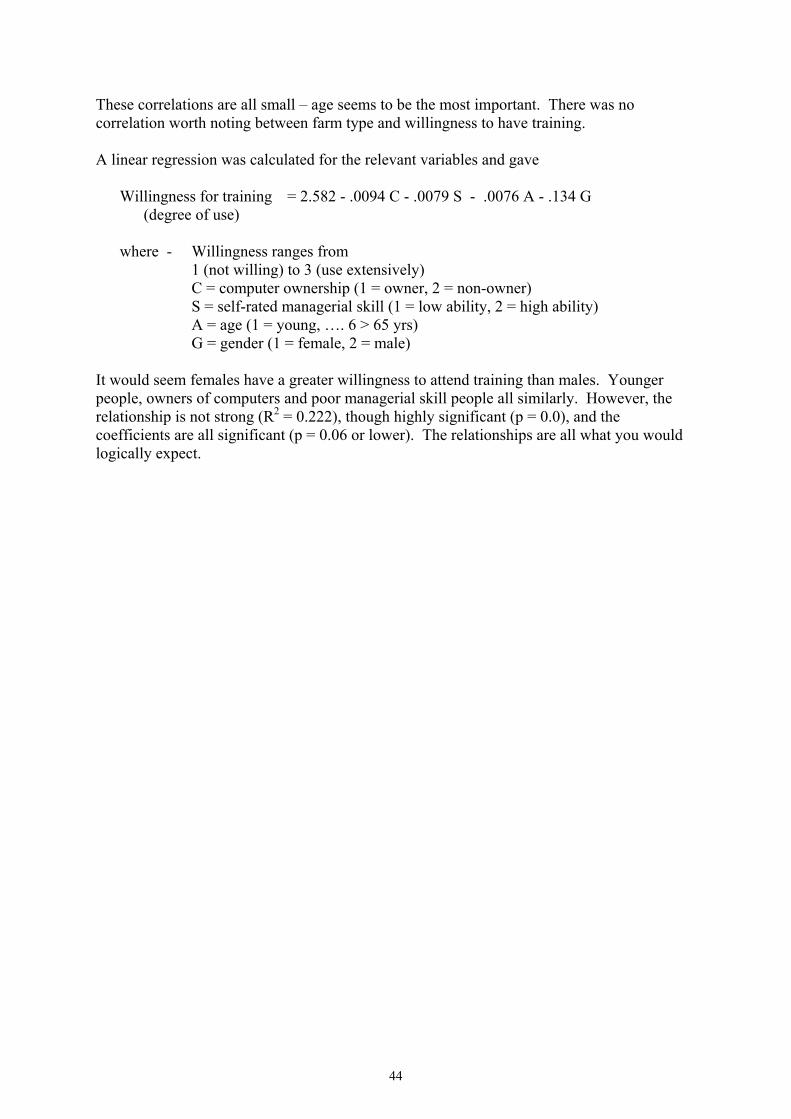
Tutored system based locally 73.3 18.2 8.5 The majority would use training ‘occasionally’, and most would prefer locally based tutored programmes. The latter is to be expected, but the cost probably means the second preference, computer-based system, is the most practical. To further investigate the training situation the correlation coefficients between a desire to use training and various variables were calculated. It was found:
PEARSON CORRELATION
Self-rated managerial skill - .093 *
Age - .201**
Gender - .082 *
Computer ownership - .147**
Managerial style cluster .175** (Note: * = 5% level, ** = 1% level)
44
These correlations are all small – age seems to be the most important. There was no correlation worth noting between farm type and willingness to have training. A linear regression was calculated for the relevant variables and gave
Willingness for training = 2.582 - .0094 C - .0079 S - .0076 A - .134 G (degree of use)
where - Willingness ranges from 1 (not willing) to 3 (use extensively) C = computer ownership (1 = owner, 2 = non-owner) S = self-rated managerial skill (1 = low ability, 2 = high ability) A = age (1 = young, …. 6 > 65 yrs) G = gender (1 = female, 2 = male)
It would seem females have a greater willingness to attend training than males. Younger people, owners of computers and poor managerial skill people all similarly. However, the relationship is not strong (R2 = 0.222), though highly significant (p = 0.0), and the coefficients are all significant (p = 0.06 or lower). The relationships are all what you would logically expect.
45
11. CONCLUSIONS FROM THE DATA. WHERE NEXT? The data as presented does not provide very distinctive and clear-cut conclusions on which are the most important competencies. A simple list of, say, 6-10 competencies with scores well above the rest did not emerge. The respondents are indicating they believe there is a wide range of skills that are part and parcel of managerial success. The ranking lists do give a clear priority list which can be used in selecting the important factors, but any line used to create an important and less important group will be at an arbitrary position. It is therefore important to look for correlations between the higher ranked competencies to see if the members of the groups have similarities than can be used as core factors in training programmes – thus the various factor analyses that were presented. To further enhance the factor groups, the competencies from all categories with a score greater than 5.69 were grouped and re-analysed. Table 46 gives the results.
Table 46 Factor Analysis of Competencies from All Groups with a Score Greater than 5.69*
Competency (paraphrase) Factor One Factor Two Factor Three
Observing current state of farm 0.57
Planning for short and long terms 0.52
Obtaining planning information 0.59
Intuitively noting early signs 0.64
Acting on time 0.65
Negotiation skills 0.65
Looking ahead and anticipating 0.71
Good risk management 0.73
Early observation of important factors 0.69
Keeping a cool head 0.66
Confidence to conclude and act 0.62
Learning from experience 0.63
Developing a good character 0.57
Understanding interrelationships 0.56
Getting cooperation of employees/contractors 0.59
Successful judge of personality 0.77
Resolving conflicts 0.80
Good relationships off the farm 0.64
* only loadings of .5 or greater are displayed
46
The factors all had eigenvalues greater than one, and explained 54% of the variance with a very high level of significance (p = 0.0). It is clear factor three is about good skills in selecting and managing people. Factors one and two are more complicated and involve several competencies. Factor one is about planning and associated issues such as information gathering and risk management. It is also about effective implementation of the plans – looking ahead and anticipation, intuitively picking up important signs, successful negotiations and acting on time. Summarising – it’s about planning, implementing and control. Factor two is similar and really reinforces the implementation component of factor one through early observation skills, keeping a cool head, confidence to decide and act quickly, learning from experience and understanding all the interrelationships between the components of any system. There are clear messages here on the farmers’ views of what constitutes the components of good management. Furthermore, these components are relatively stable across different sectors of the primary producing industry as it was shown the rankings change very little with age, education, farm type, managerial style, gender, profit objective variations and computer ownership. References: Matthews, G., and Deary, I.J. (1998) Personality Traits. Cambridge University Press,
Cambridge, UK. Nuthall, P., and Benbow, C. (1999) Computer System Uptake and Use on New Zealand
Farms. Research Report 99/01, Farm & Horticultural Management Group, Lincoln University.
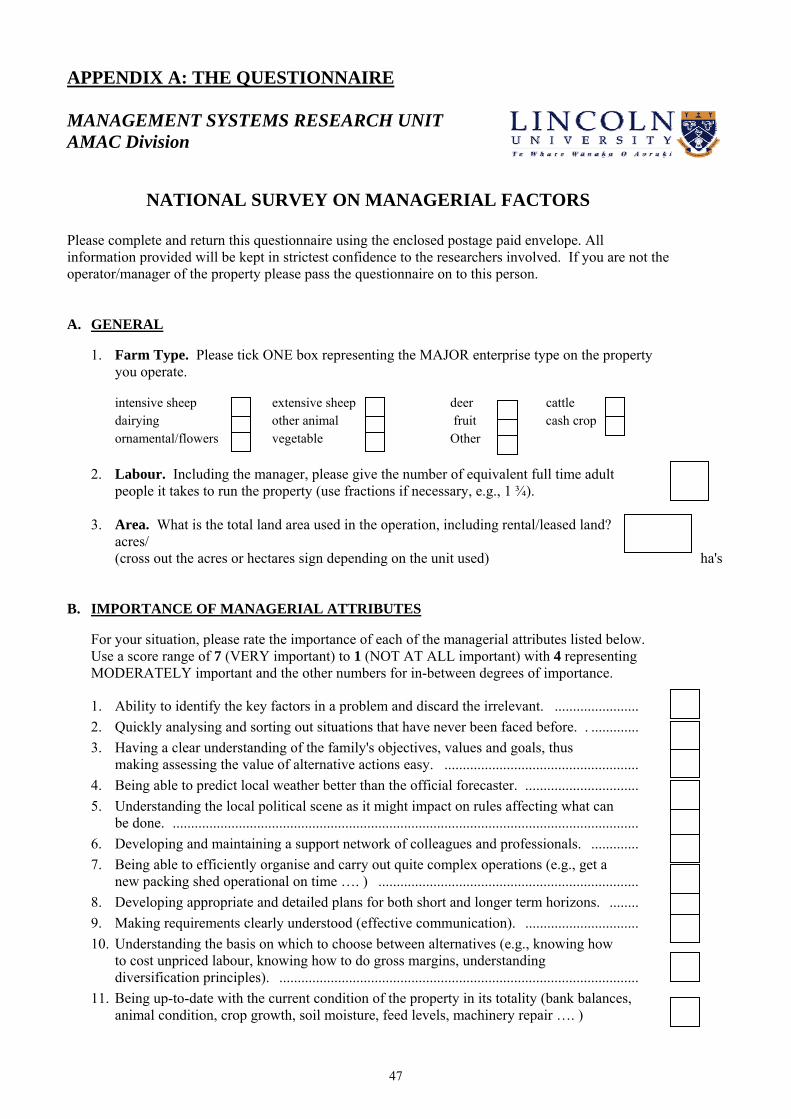
47
APPENDIX A: THE QUESTIONNAIRE MANAGEMENT SYSTEMS RESEARCH UNIT AMAC Division
NATIONAL SURVEY ON MANAGERIAL FACTORS
Please complete and return this questionnaire using the enclosed postage paid envelope. All information provided will be kept in strictest confidence to the researchers involved. If you are not the operator/manager of the property please pass the questionnaire on to this person. A. GENERAL
1. Farm Type. Please tick ONE box representing the MAJOR enterprise type on the property you operate.
intensive sheep extensive sheep deer cattle dairying other animal fruit cash crop ornamental/flowers vegetable Other
2. Labour. Including the manager, please give the number of equivalent full time adult people it takes to run the property (use fractions if necessary, e.g., 1 ¾).
3. Area. What is the total land area used in the operation, including rental/leased land?
acres/ (cross out the acres or hectares sign depending on the unit used) ha's
B. IMPORTANCE OF MANAGERIAL ATTRIBUTES For your situation, please rate the importance of each of the managerial attributes listed below. Use a score range of 7 (VERY important) to 1 (NOT AT ALL important) with 4 representing
MODERATELY important and the other numbers for in-between degrees of importance.
1. Ability to identify the key factors in a problem and discard the irrelevant. ....................... 2. Quickly analysing and sorting out situations that have never been faced before. . ............. 3. Having a clear understanding of the family's objectives, values and goals, thus
making assessing the value of alternative actions easy. ..................................................... 4. Being able to predict local weather better than the official forecaster. ............................... 5. Understanding the local political scene as it might impact on rules affecting what can
be done. ............................................................................................................................... 6. Developing and maintaining a support network of colleagues and professionals. ............. 7. Being able to efficiently organise and carry out quite complex operations (e.g., get a
new packing shed operational on time …. ) ....................................................................... 8. Developing appropriate and detailed plans for both short and longer term horizons. ........ 9. Making requirements clearly understood (effective communication). ............................... 10. Understanding the basis on which to choose between alternatives (e.g., knowing how
to cost unpriced labour, knowing how to do gross margins, understanding diversification principles). ..................................................................................................
11. Being up-to-date with the current condition of the property in its totality (bank balances, animal condition, crop growth, soil moisture, feed levels, machinery repair …. )
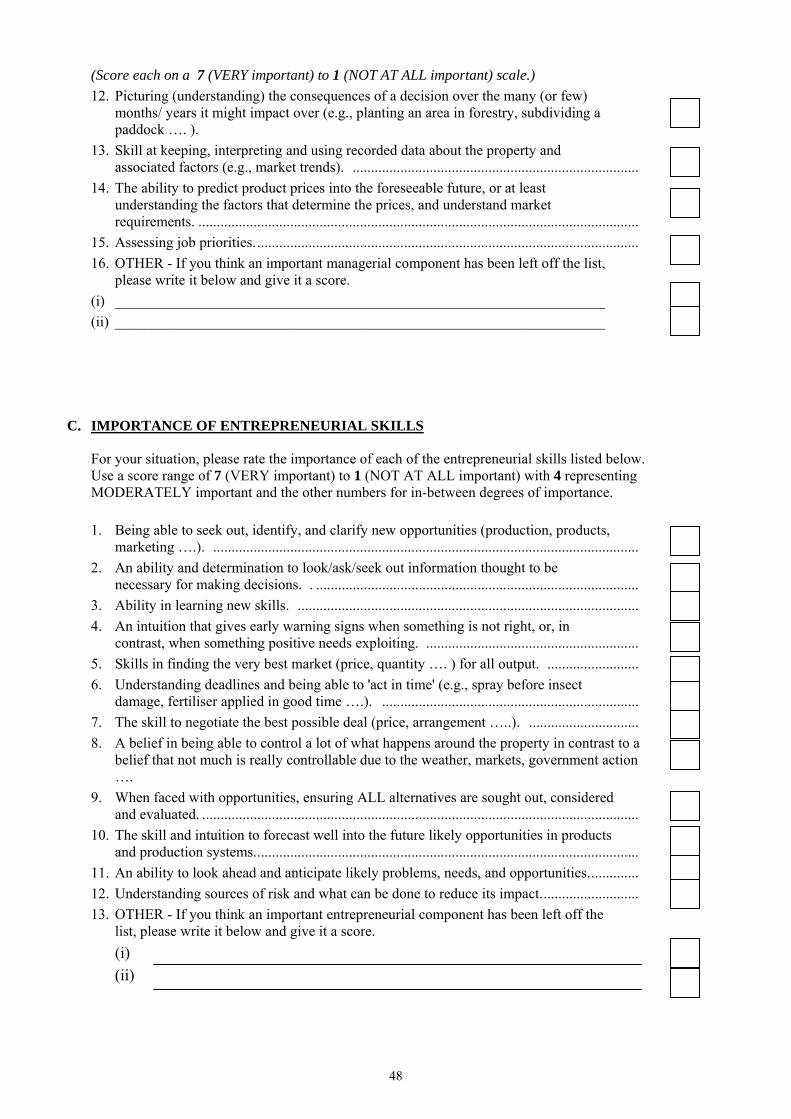
48
(Score each on a 7 (VERY important) to 1 (NOT AT ALL important) scale.) 12. Picturing (understanding) the consequences of a decision over the many (or few)
months/ years it might impact over (e.g., planting an area in forestry, subdividing a paddock …. ).
13. Skill at keeping, interpreting and using recorded data about the property and associated factors (e.g., market trends). ..............................................................................
14. The ability to predict product prices into the foreseeable future, or at least understanding the factors that determine the prices, and understand market requirements. ........................................................................................................................
15. Assessing job priorities......................................................................................................... 16. OTHER - If you think an important managerial component has been left off the list,
please write it below and give it a score. (i) ___________________________________________________________________ (ii) ___________________________________________________________________
C. IMPORTANCE OF ENTREPRENEURIAL SKILLS
For your situation, please rate the importance of each of the entrepreneurial skills listed below. Use a score range of 7 (VERY important) to 1 (NOT AT ALL important) with 4 representing MODERATELY important and the other numbers for in-between degrees of importance. 1. Being able to seek out, identify, and clarify new opportunities (production, products,
marketing ….). .................................................................................................................... 2. An ability and determination to look/ask/seek out information thought to be
necessary for making decisions. . ........................................................................................ 3. Ability in learning new skills. ............................................................................................. 4. An intuition that gives early warning signs when something is not right, or, in
contrast, when something positive needs exploiting. .......................................................... 5. Skills in finding the very best market (price, quantity …. ) for all output. ......................... 6. Understanding deadlines and being able to 'act in time' (e.g., spray before insect
damage, fertiliser applied in good time ….). ...................................................................... 7. The skill to negotiate the best possible deal (price, arrangement …..). .............................. 8. A belief in being able to control a lot of what happens around the property in contrast to a
belief that not much is really controllable due to the weather, markets, government action ….
9. When faced with opportunities, ensuring ALL alternatives are sought out, considered and evaluated. .......................................................................................................................
10. The skill and intuition to forecast well into the future likely opportunities in products and production systems.........................................................................................................
11. An ability to look ahead and anticipate likely problems, needs, and opportunities.............. 12. Understanding sources of risk and what can be done to reduce its impact........................... 13. OTHER - If you think an important entrepreneurial component has been left off the
list, please write it below and give it a score. (i) (ii)
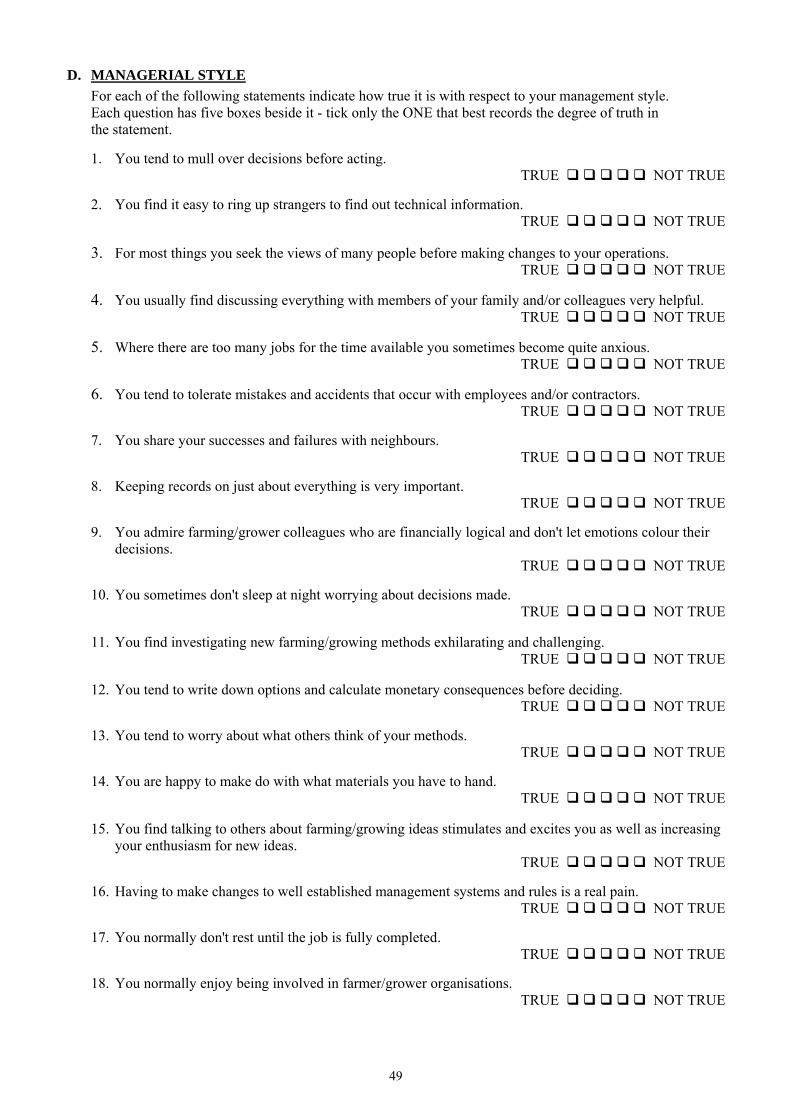
49
D. MANAGERIAL STYLE For each of the following statements indicate how true it is with respect to your management style.
Each question has five boxes beside it - tick only the ONE that best records the degree of truth in the statement.
1. You tend to mull over decisions before acting.
TRUE NOT TRUE
2. You find it easy to ring up strangers to find out technical information. TRUE NOT TRUE
3. For most things you seek the views of many people before making changes to your operations.
TRUE NOT TRUE
4. You usually find discussing everything with members of your family and/or colleagues very helpful. TRUE NOT TRUE
5. Where there are too many jobs for the time available you sometimes become quite anxious.
TRUE NOT TRUE
6. You tend to tolerate mistakes and accidents that occur with employees and/or contractors. TRUE NOT TRUE
7. You share your successes and failures with neighbours.
TRUE NOT TRUE
8. Keeping records on just about everything is very important. TRUE NOT TRUE
9. You admire farming/grower colleagues who are financially logical and don't let emotions colour their
decisions. TRUE NOT TRUE
10. You sometimes don't sleep at night worrying about decisions made.
TRUE NOT TRUE
11. You find investigating new farming/growing methods exhilarating and challenging. TRUE NOT TRUE
12. You tend to write down options and calculate monetary consequences before deciding.
TRUE NOT TRUE
13. You tend to worry about what others think of your methods. TRUE NOT TRUE
14. You are happy to make do with what materials you have to hand.
TRUE NOT TRUE
15. You find talking to others about farming/growing ideas stimulates and excites you as well as increasing your enthusiasm for new ideas.
TRUE NOT TRUE
16. Having to make changes to well established management systems and rules is a real pain. TRUE NOT TRUE
17. You normally don't rest until the job is fully completed.
TRUE NOT TRUE
18. You normally enjoy being involved in farmer/grower organisations. TRUE NOT TRUE
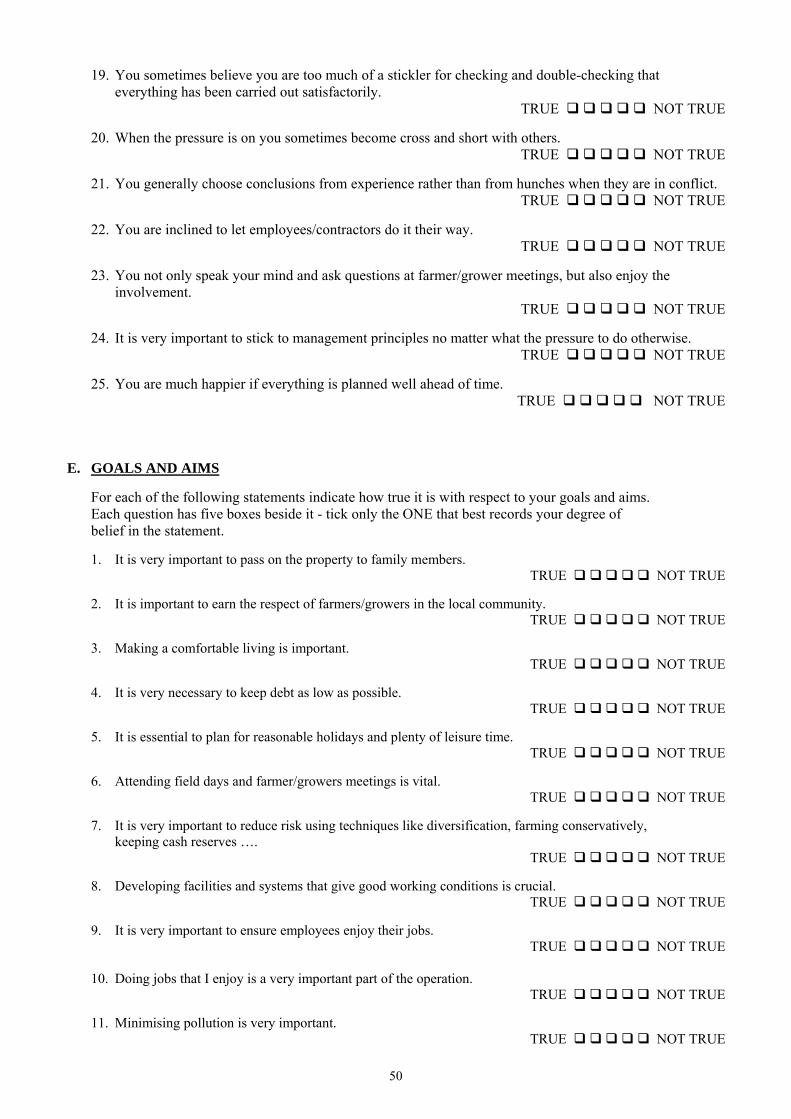
50
19. You sometimes believe you are too much of a stickler for checking and double-checking that everything has been carried out satisfactorily.
TRUE NOT TRUE
20. When the pressure is on you sometimes become cross and short with others. TRUE NOT TRUE
21. You generally choose conclusions from experience rather than from hunches when they are in conflict.
TRUE NOT TRUE
22. You are inclined to let employees/contractors do it their way. TRUE NOT TRUE
23. You not only speak your mind and ask questions at farmer/grower meetings, but also enjoy the
involvement. TRUE NOT TRUE
24. It is very important to stick to management principles no matter what the pressure to do otherwise.
TRUE NOT TRUE
25. You are much happier if everything is planned well ahead of time. TRUE NOT TRUE
E. GOALS AND AIMS
For each of the following statements indicate how true it is with respect to your goals and aims. Each question has five boxes beside it - tick only the ONE that best records your degree of belief in the statement.
1. It is very important to pass on the property to family members.
TRUE NOT TRUE 2. It is important to earn the respect of farmers/growers in the local community.
TRUE NOT TRUE 3. Making a comfortable living is important.
TRUE NOT TRUE 4. It is very necessary to keep debt as low as possible.
TRUE NOT TRUE 5. It is essential to plan for reasonable holidays and plenty of leisure time.
TRUE NOT TRUE 6. Attending field days and farmer/growers meetings is vital.
TRUE NOT TRUE
7. It is very important to reduce risk using techniques like diversification, farming conservatively, keeping cash reserves ….
TRUE NOT TRUE 8. Developing facilities and systems that give good working conditions is crucial.
TRUE NOT TRUE 9. It is very important to ensure employees enjoy their jobs.
TRUE NOT TRUE 10. Doing jobs that I enjoy is a very important part of the operation.
TRUE NOT TRUE 11. Minimising pollution is very important.
TRUE NOT TRUE
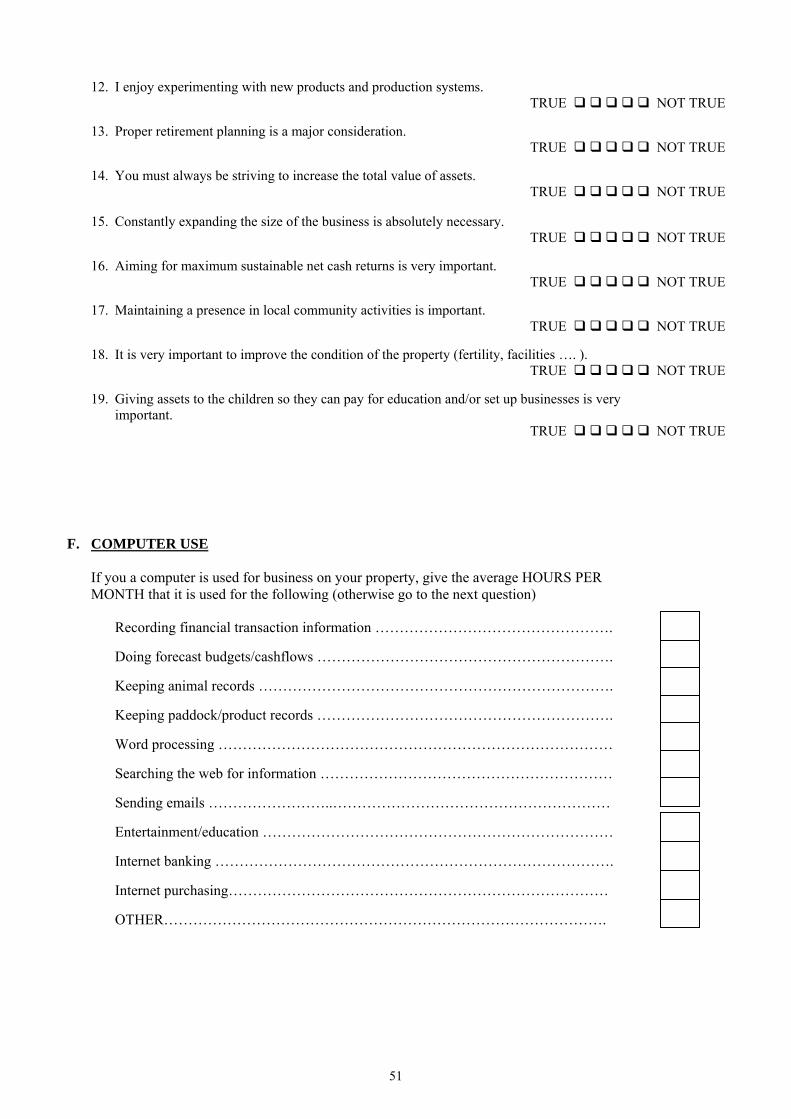
51
12. I enjoy experimenting with new products and production systems.
TRUE NOT TRUE 13. Proper retirement planning is a major consideration.
TRUE NOT TRUE 14. You must always be striving to increase the total value of assets.
TRUE NOT TRUE 15. Constantly expanding the size of the business is absolutely necessary.
TRUE NOT TRUE 16. Aiming for maximum sustainable net cash returns is very important.
TRUE NOT TRUE 17. Maintaining a presence in local community activities is important.
TRUE NOT TRUE 18. It is very important to improve the condition of the property (fertility, facilities …. ).
TRUE NOT TRUE 19. Giving assets to the children so they can pay for education and/or set up businesses is very
important. TRUE NOT TRUE
F. COMPUTER USE If you a computer is used for business on your property, give the average HOURS PER
MONTH that it is used for the following (otherwise go to the next question)
Recording financial transaction information ………………………………………….
Doing forecast budgets/cashflows …………………………………………………….
Keeping animal records ……………………………………………………………….
Keeping paddock/product records …………………………………………………….
Word processing ………………………………………………………………………
Searching the web for information ……………………………………………………
Sending emails ……………………..…………………………………………………
Entertainment/education ………………………………………………………………
Internet banking ……………………………………………………………………….
Internet purchasing……………………………………………………………………
OTHER……………………………………………………………………………….
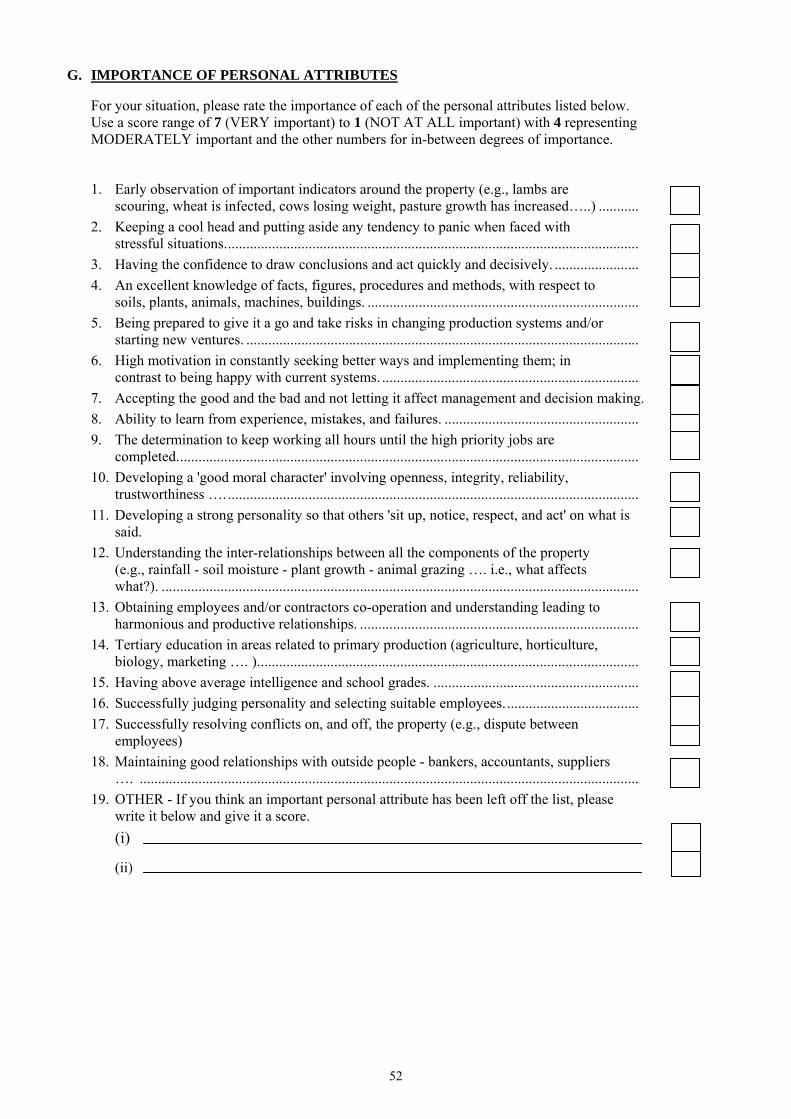
52
G. IMPORTANCE OF PERSONAL ATTRIBUTES
For your situation, please rate the importance of each of the personal attributes listed below. Use a score range of 7 (VERY important) to 1 (NOT AT ALL important) with 4 representing MODERATELY important and the other numbers for in-between degrees of importance.
1. Early observation of important indicators around the property (e.g., lambs are scouring, wheat is infected, cows losing weight, pasture growth has increased…..) ...........
2. Keeping a cool head and putting aside any tendency to panic when faced with stressful situations.................................................................................................................
3. Having the confidence to draw conclusions and act quickly and decisively. ....................... 4. An excellent knowledge of facts, figures, procedures and methods, with respect to
soils, plants, animals, machines, buildings. .......................................................................... 5. Being prepared to give it a go and take risks in changing production systems and/or
starting new ventures. ........................................................................................................... 6. High motivation in constantly seeking better ways and implementing them; in
contrast to being happy with current systems. ...................................................................... 7. Accepting the good and the bad and not letting it affect management and decision making. 8. Ability to learn from experience, mistakes, and failures. ..................................................... 9. The determination to keep working all hours until the high priority jobs are
completed.............................................................................................................................. 10. Developing a 'good moral character' involving openness, integrity, reliability,
trustworthiness …................................................................................................................. 11. Developing a strong personality so that others 'sit up, notice, respect, and act' on what is
said. 12. Understanding the inter-relationships between all the components of the property
(e.g., rainfall - soil moisture - plant growth - animal grazing …. i.e., what affects what?). ..................................................................................................................................
13. Obtaining employees and/or contractors co-operation and understanding leading to harmonious and productive relationships. ............................................................................
14. Tertiary education in areas related to primary production (agriculture, horticulture, biology, marketing …. )........................................................................................................
15. Having above average intelligence and school grades. ........................................................ 16. Successfully judging personality and selecting suitable employees..................................... 17. Successfully resolving conflicts on, and off, the property (e.g., dispute between
employees) 18. Maintaining good relationships with outside people - bankers, accountants, suppliers
…. ........................................................................................................................................ 19. OTHER - If you think an important personal attribute has been left off the list, please
write it below and give it a score. (i) (ii)
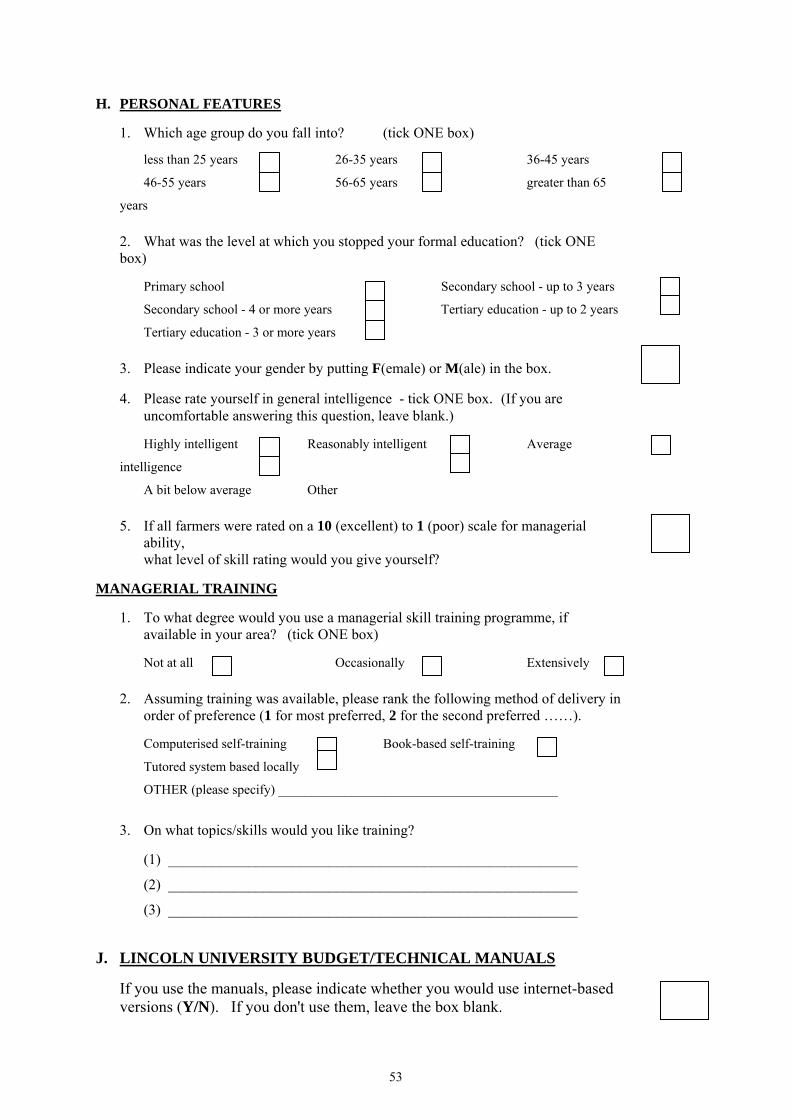
53
H. PERSONAL FEATURES
1. Which age group do you fall into? (tick ONE box) less than 25 years 26-35 years 36-45 years
46-55 years 56-65 years greater than 65
years 2. What was the level at which you stopped your formal education? (tick ONE
box) Primary school Secondary school - up to 3 years
Secondary school - 4 or more years Tertiary education - up to 2 years
Tertiary education - 3 or more years 3. Please indicate your gender by putting F(emale) or M(ale) in the box. 4. Please rate yourself in general intelligence - tick ONE box. (If you are
uncomfortable answering this question, leave blank.) Highly intelligent Reasonably intelligent Average
intelligence
A bit below average Other
5. If all farmers were rated on a 10 (excellent) to 1 (poor) scale for managerial ability, what level of skill rating would you give yourself?
MANAGERIAL TRAINING
1. To what degree would you use a managerial skill training programme, if available in your area? (tick ONE box)
Not at all Occasionally Extensively 2. Assuming training was available, please rank the following method of delivery in
order of preference (1 for most preferred, 2 for the second preferred ……). Computerised self-training Book-based self-training
Tutored system based locally OTHER (please specify) __________________________________________ 3. On what topics/skills would you like training? (1) ________________________________________________________
(2) ________________________________________________________
(3) ________________________________________________________
J. LINCOLN UNIVERSITY BUDGET/TECHNICAL MANUALS If you use the manuals, please indicate whether you would use internet-based versions (Y/N). If you don't use them, leave the box blank.