Embed Size (px)
Citation preview
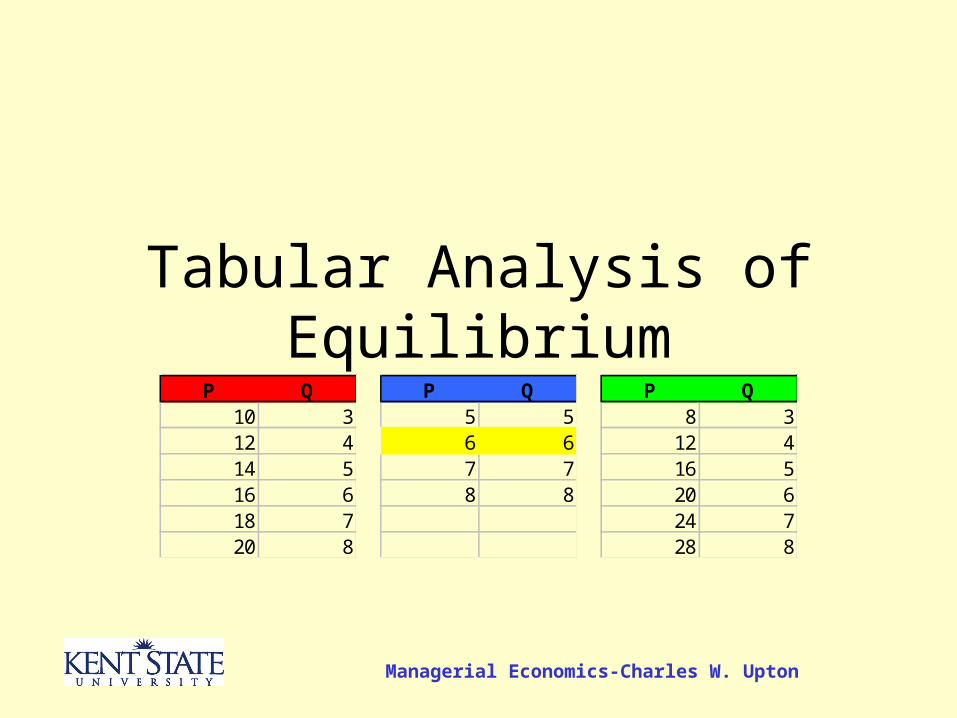
Managerial Economics-Charles W. Upton
Tabular Analysis of EquilibriumP Q
10 312 414 516 618 720 8
P Q5 56 67 78 8
P Q8 312 416 520 624 728 8
Tabular Analysis of Equilibrium 2
Agenda
• The previous lecture worked with graphical cost functions.
• Now we turn to tabular cost functions.
Tabular Analysis of Equilibrium 3
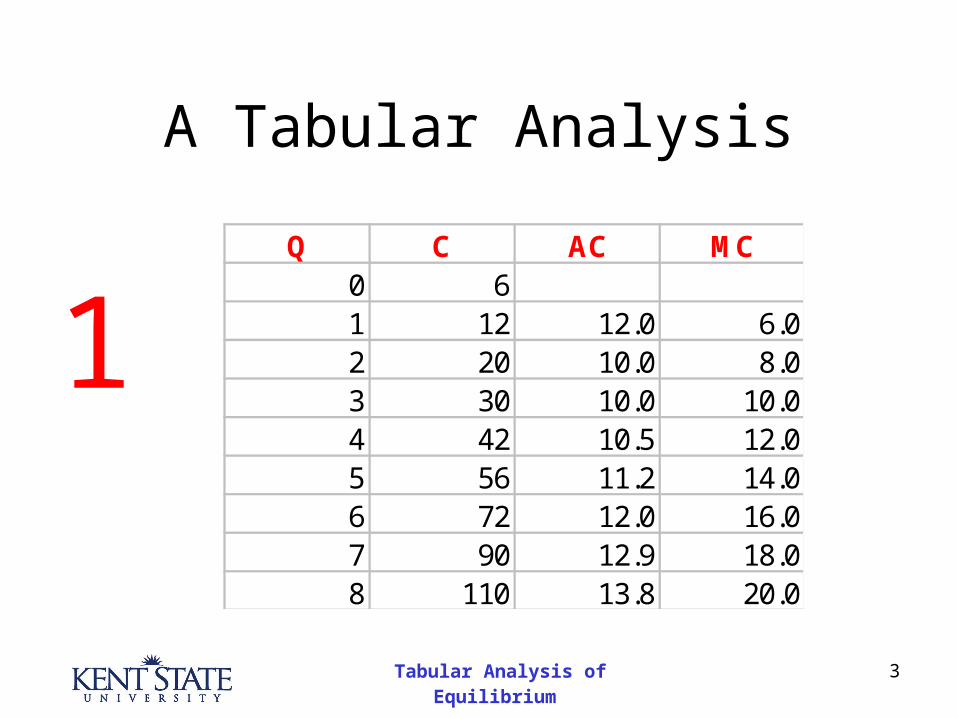
A Tabular Analysis
Q C AC MC0 61 12 12.0 6.02 20 10.0 8.03 30 10.0 10.04 42 10.5 12.05 56 11.2 14.06 72 12.0 16.07 90 12.9 18.08 110 13.8 20.0
1
Tabular Analysis of Equilibrium 4
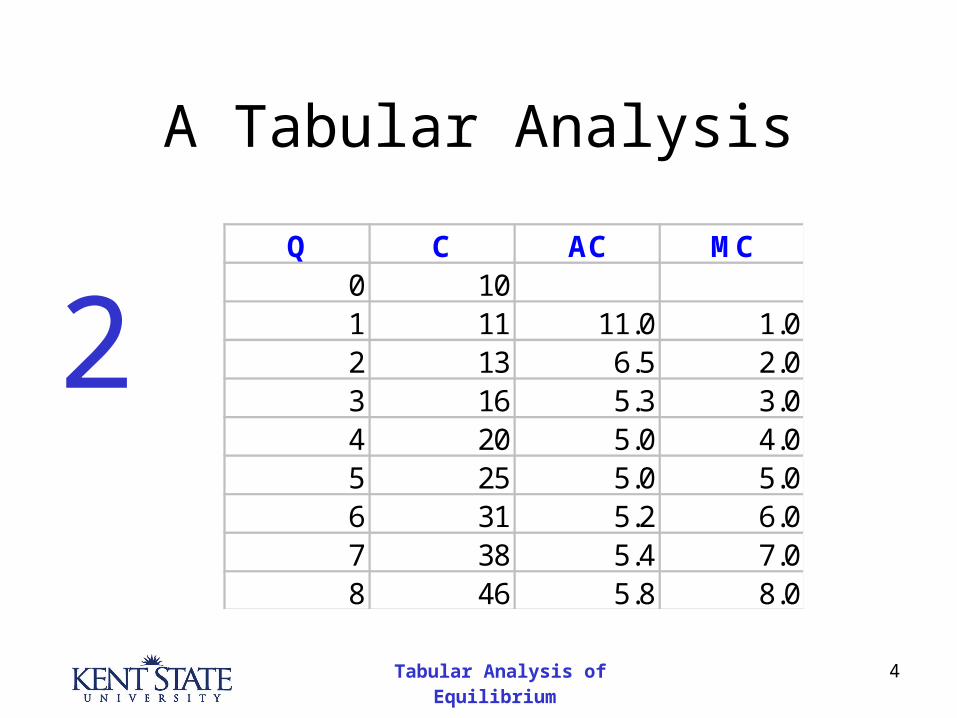
A Tabular Analysis
Q C AC MC0 101 11 11.0 1.02 13 6.5 2.03 16 5.3 3.04 20 5.0 4.05 25 5.0 5.06 31 5.2 6.07 38 5.4 7.08 46 5.8 8.0
2
Tabular Analysis of Equilibrium 5
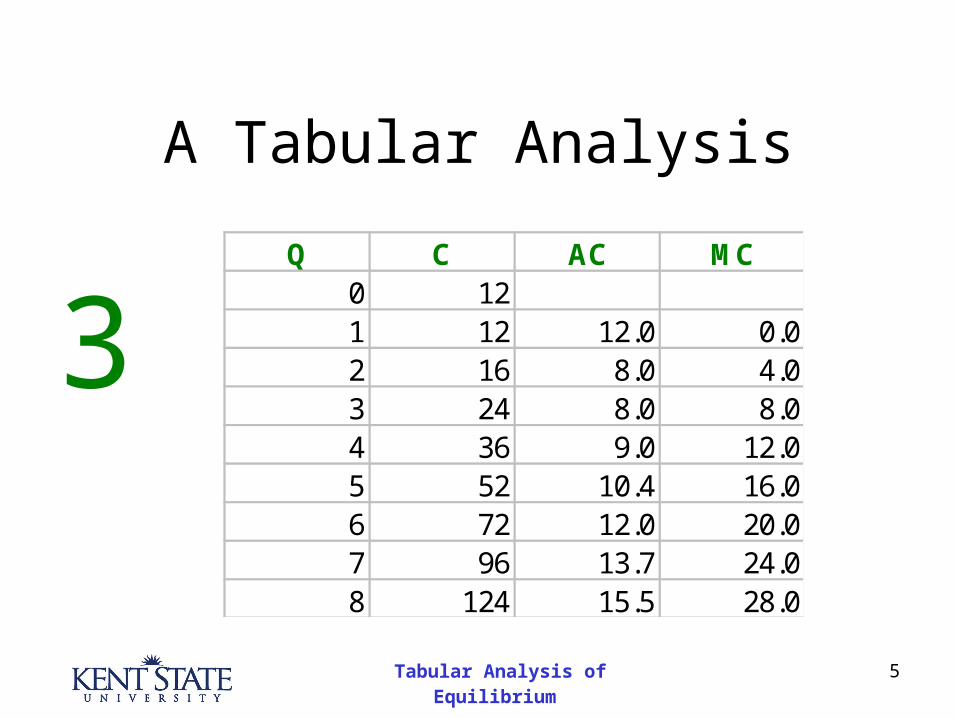
A Tabular Analysis
Q C AC MC0 121 12 12.0 0.02 16 8.0 4.03 24 8.0 8.04 36 9.0 12.05 52 10.4 16.06 72 12.0 20.07 96 13.7 24.08 124 15.5 28.0
3
Tabular Analysis of Equilibrium 6
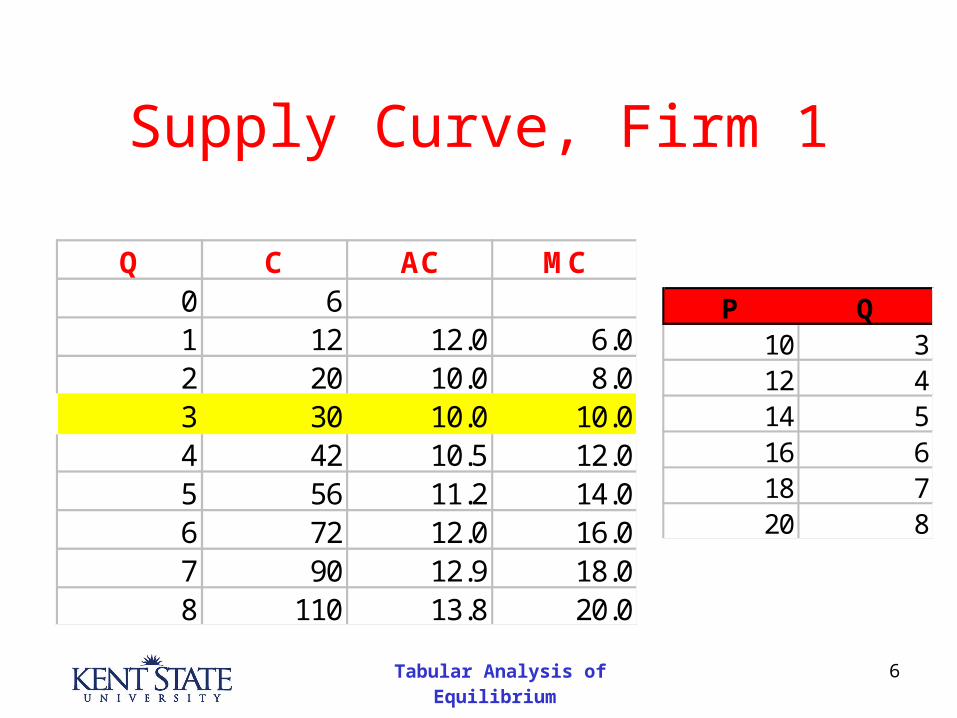
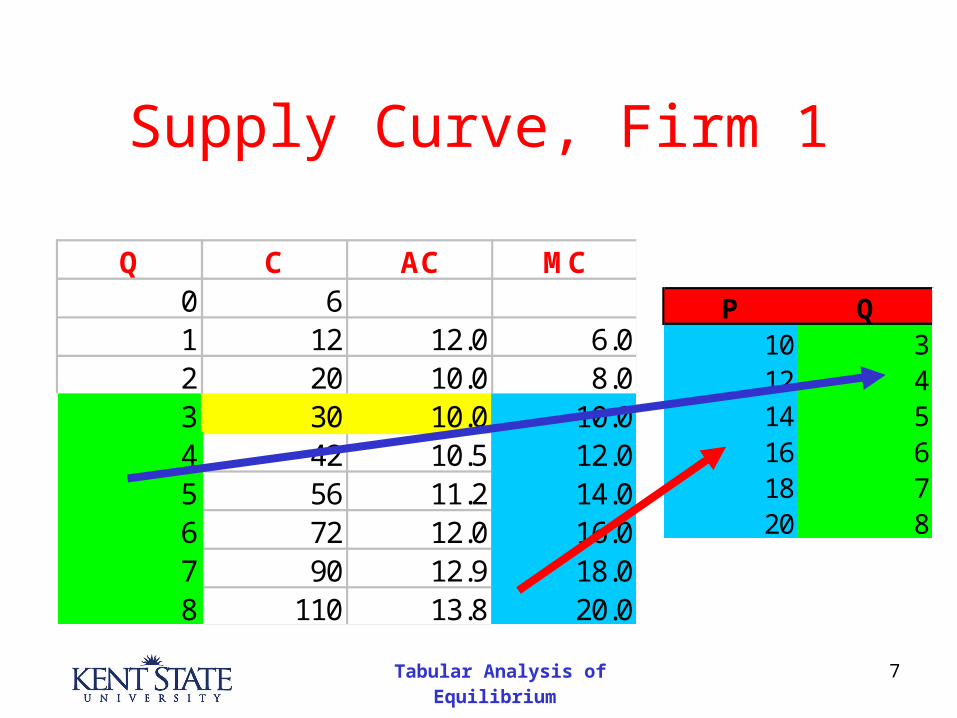
Supply Curve, Firm 1
Q C AC MC0 61 12 12.0 6.02 20 10.0 8.03 30 10.0 10.04 42 10.5 12.05 56 11.2 14.06 72 12.0 16.07 90 12.9 18.08 110 13.8 20.0
P Q10 312 414 516 618 720 8
Tabular Analysis of Equilibrium 7
Supply Curve, Firm 1
Q C AC MC0 61 12 12.0 6.02 20 10.0 8.03 30 10.0 10.04 42 10.5 12.05 56 11.2 14.06 72 12.0 16.07 90 12.9 18.08 110 13.8 20.0
P Q10 312 414 516 618 720 8
Tabular Analysis of Equilibrium 8
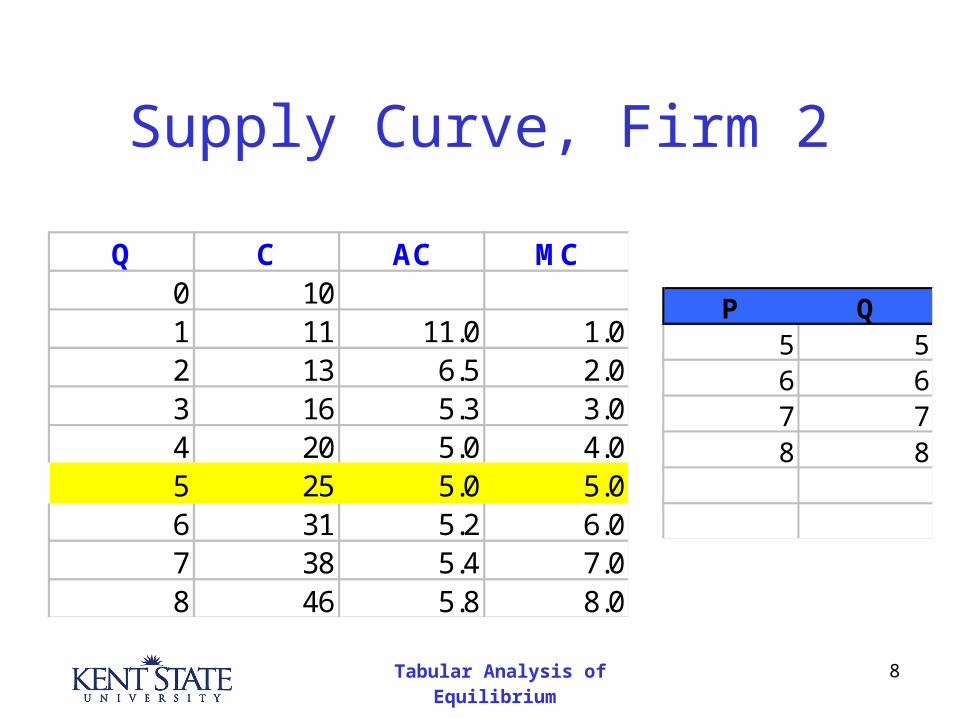
Supply Curve, Firm 2
Q C AC MC0 101 11 11.0 1.02 13 6.5 2.03 16 5.3 3.04 20 5.0 4.05 25 5.0 5.06 31 5.2 6.07 38 5.4 7.08 46 5.8 8.0
P Q5 56 67 78 8
Tabular Analysis of Equilibrium 9
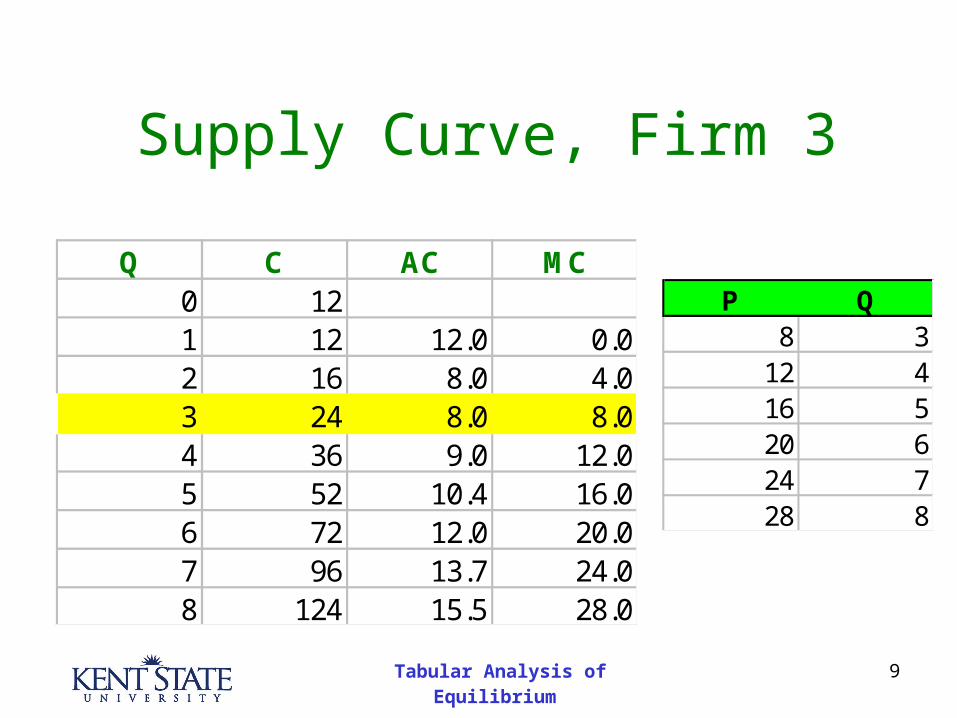
Supply Curve, Firm 3
Q C AC MC0 121 12 12.0 0.02 16 8.0 4.03 24 8.0 8.04 36 9.0 12.05 52 10.4 16.06 72 12.0 20.07 96 13.7 24.08 124 15.5 28.0
P Q8 312 416 520 624 728 8
Tabular Analysis of Equilibrium 10
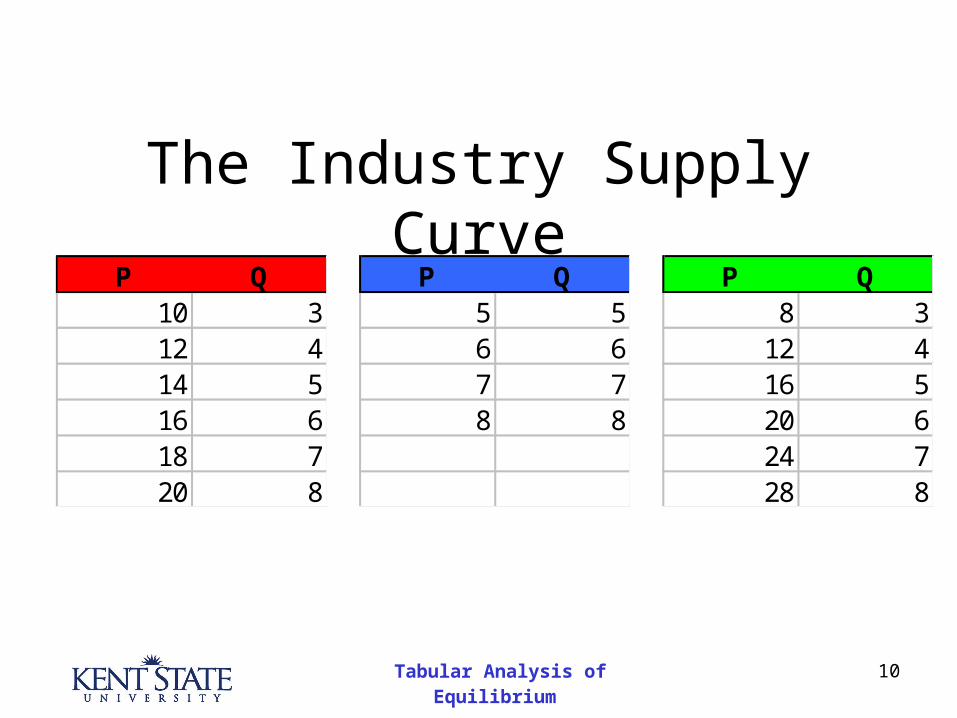
The Industry Supply CurveP Q
10 312 414 516 618 720 8
P Q5 56 67 78 8
P Q8 312 416 520 624 728 8
Tabular Analysis of Equilibrium 11
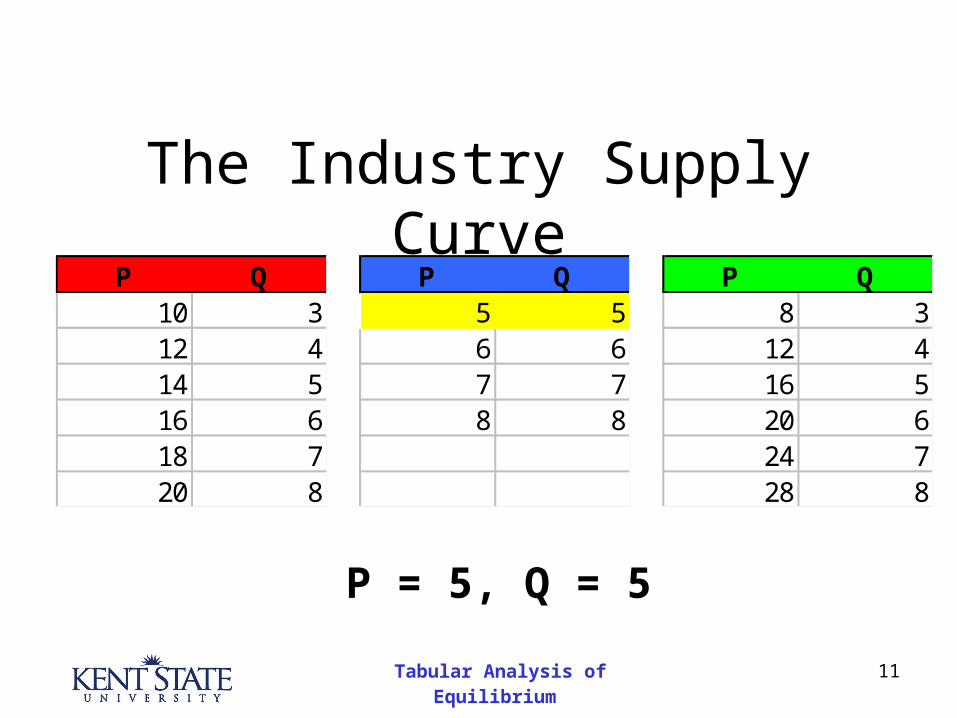
The Industry Supply CurveP Q
10 312 414 516 618 720 8
P Q5 56 67 78 8
P Q8 312 416 520 624 728 8
P = 5, Q = 5
Tabular Analysis of Equilibrium 12
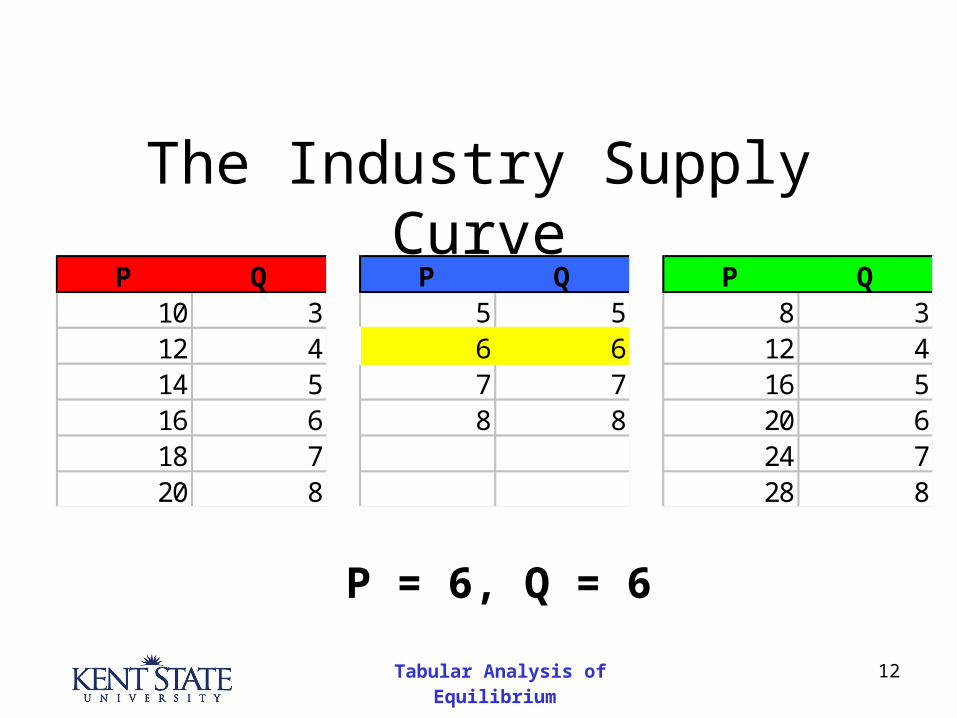
The Industry Supply CurveP Q
10 312 414 516 618 720 8
P Q5 56 67 78 8
P Q8 312 416 520 624 728 8
P = 6, Q = 6
Tabular Analysis of Equilibrium 13
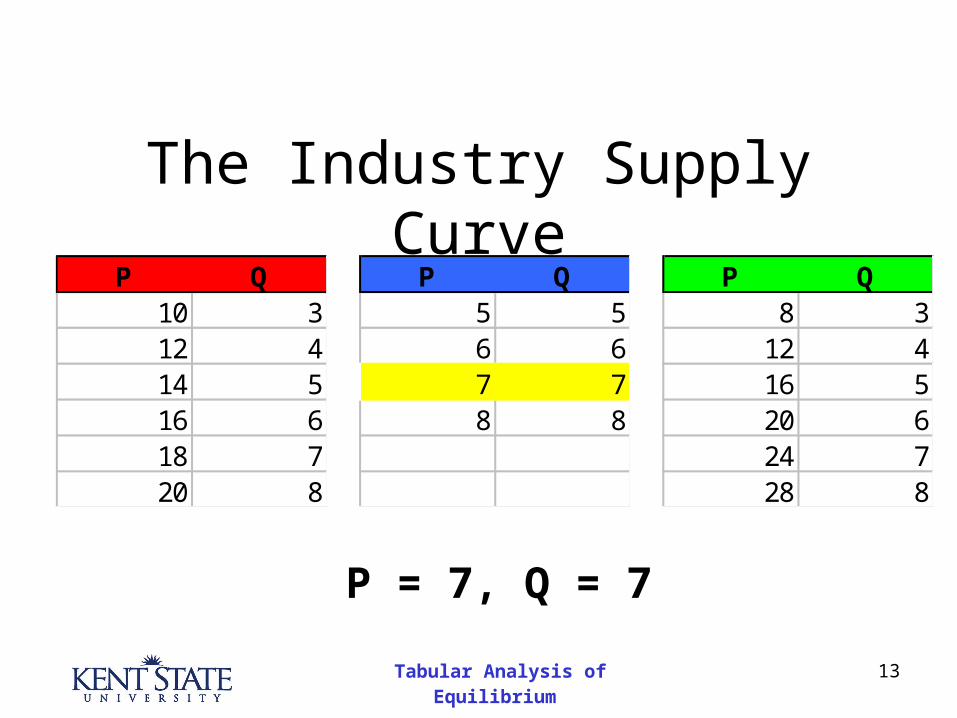
The Industry Supply CurveP Q
10 312 414 516 618 720 8
P Q5 56 67 78 8
P Q8 312 416 520 624 728 8
P = 7, Q = 7
Tabular Analysis of Equilibrium 14
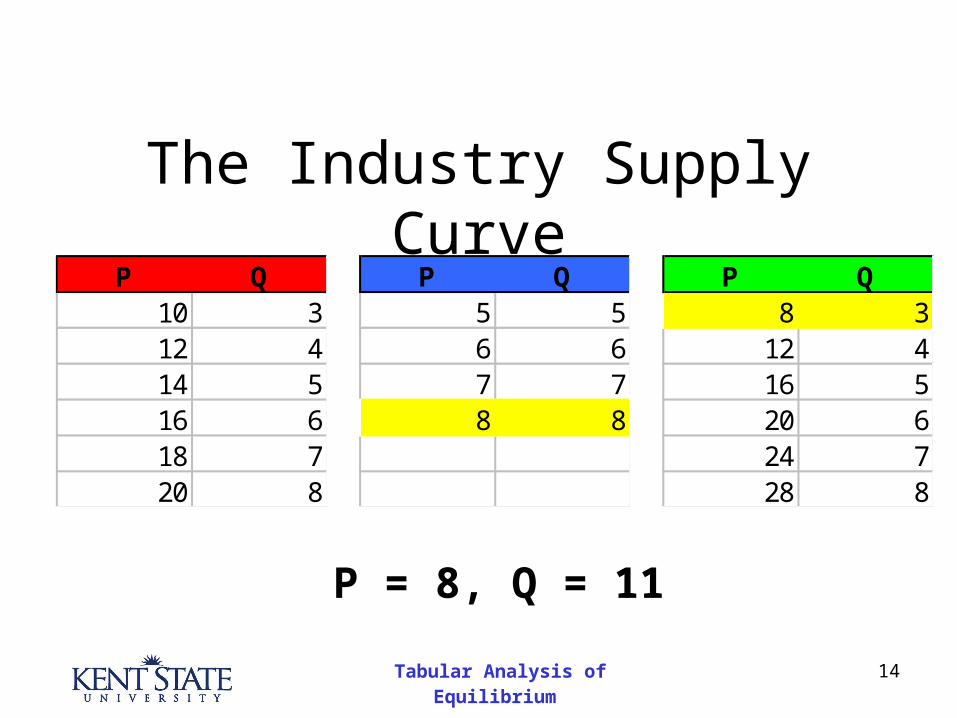
The Industry Supply CurveP Q
10 312 414 516 618 720 8
P Q5 56 67 78 8
P Q8 312 416 520 624 728 8
P = 8, Q = 11
Tabular Analysis of Equilibrium 15
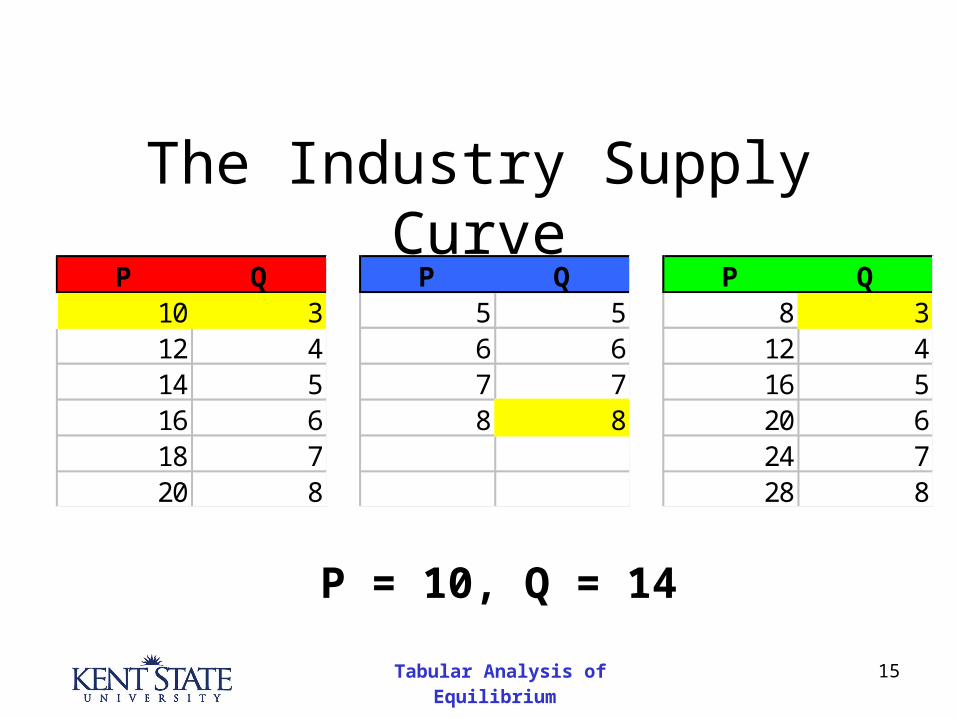
The Industry Supply CurveP Q
10 312 414 516 618 720 8
P Q5 56 67 78 8
P Q8 312 416 520 624 728 8
P = 10, Q = 14
Tabular Analysis of Equilibrium 16
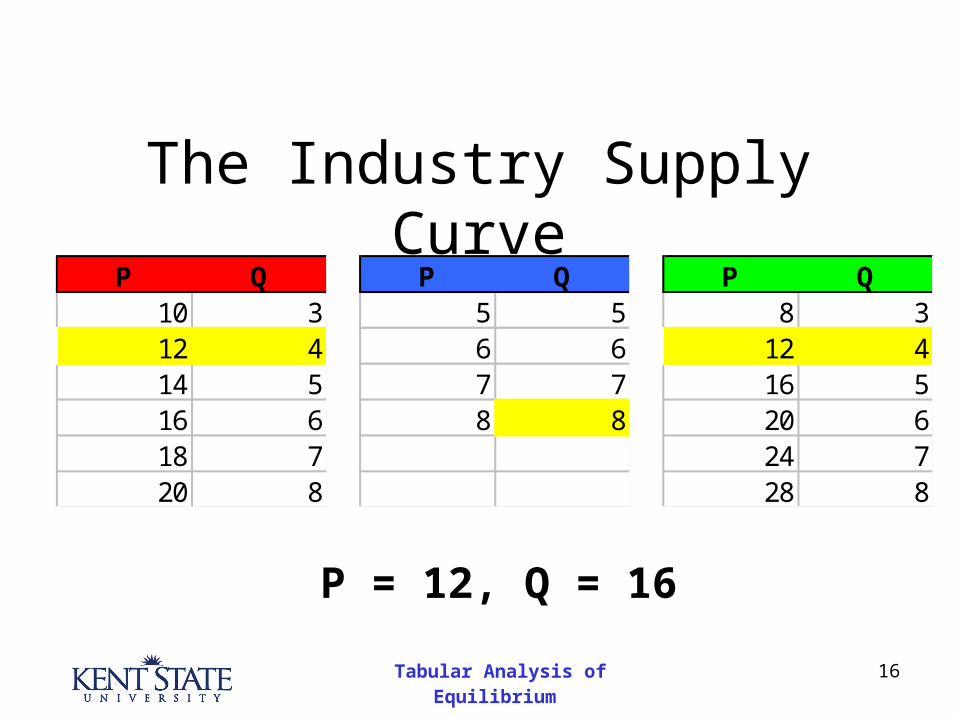
The Industry Supply CurveP Q
10 312 414 516 618 720 8
P Q5 56 67 78 8
P Q8 312 416 520 624 728 8
P = 12, Q = 16
Tabular Analysis of Equilibrium 17
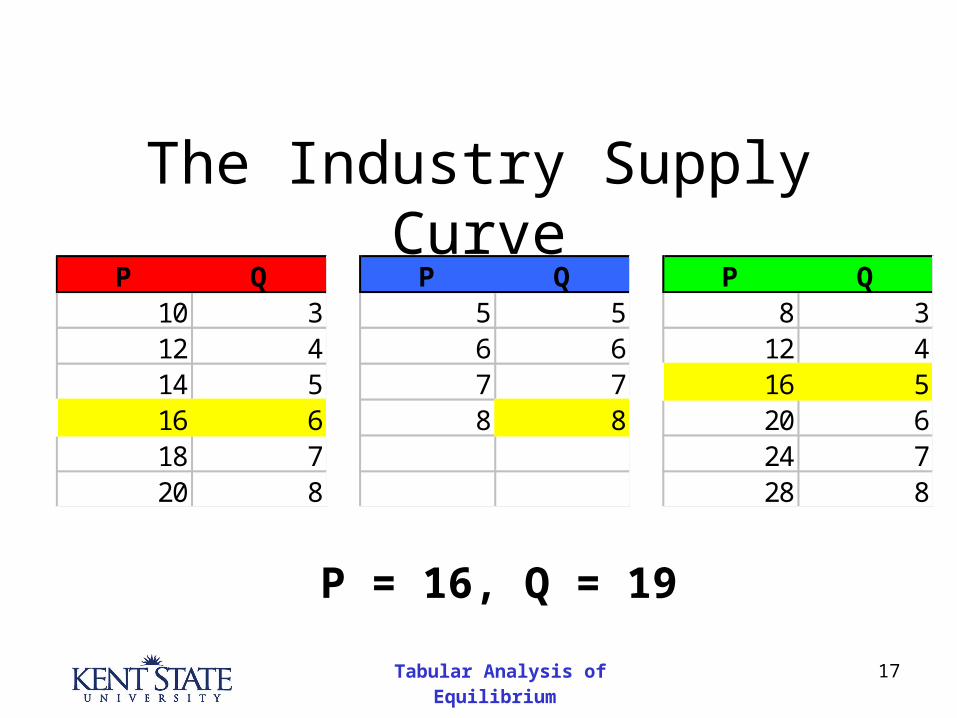
The Industry Supply CurveP Q
10 312 414 516 618 720 8
P Q5 56 67 78 8
P Q8 312 416 520 624 728 8
P = 16, Q = 19
Tabular Analysis of Equilibrium 18
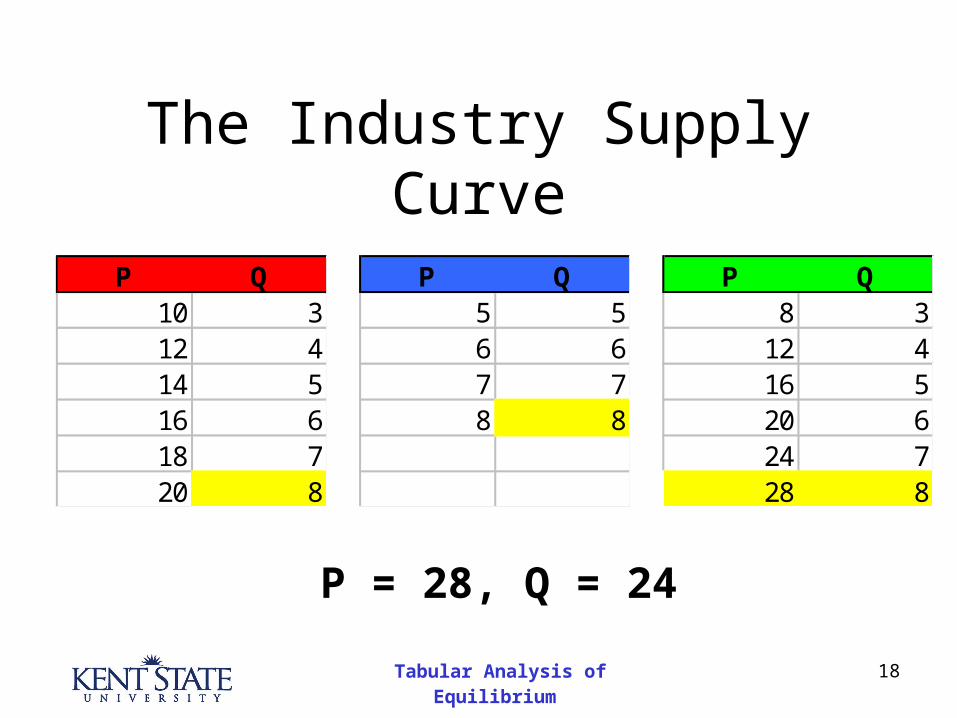
The Industry Supply Curve
P Q10 312 414 516 618 720 8
P Q5 56 67 78 8
P Q8 312 416 520 624 728 8
P = 28, Q = 24
Tabular Analysis of Equilibrium 19
Summary
• We find industry supply by adding firm supply curves.
Tabular Analysis of Equilibrium 20
Summary
• We find industry supply by adding firm supply curves.
• At some prices, marginal firms are not in industry.
Tabular Analysis of Equilibrium 21
Summary
• We find industry supply by adding firm supply curves.
• At some prices, marginal firms are not in industry.
• We could compute each firm’s profit at different prices.
Tabular Analysis of Equilibrium 22
Summary
• We find industry supply by adding firm supply curves.
• At some prices, marginal firms are not in industry.
• We could compute each firm’s profit at different prices.
• We could also compute industry price elasticity of supply.

Tabular Analysis of Equilibrium 23
End
©2005 Charles W. Upton