Embed Size (px)
Citation preview
Managerial Strategies and Behavior in Networks:
A Model with Evidence from U.S. Public Education*
Kenneth J. Meier
Department of Political ScienceTexas A&M University
4348 TAMUSCollege Station, TX 77843-4348 USA
and
Laurence J. O’Toole, Jr.
Department of Political ScienceBaldwin Hall
The University of GeorgiaAthens, GA 30606 [email protected]
Published in the Journal of Public Administration Research andTheory 11 (July 2001), 271-294.
Prepared for presentation at the panel on “New Trends in NetworkTheory and Network Management” at the Fifth InternationalResearch Symposium on Public Management, CIES, University ofBarcelona, 9-11 April 2001.
*We acknowledge the helpful comments of Stuart Bretschneider, AmyKneedler Donahue, H. George Frederickson, Carolyn Heinrich,Patricia Ingraham, Laurence E. Lynn, Jr., H. Brinton Milward, andHal G. Rainey on various aspects of this research program. Inaddition, we are grateful for detailed comments on an earlierversion of this manuscript from Amy Kneedler Donahue, H. GeorgeFrederickson, Laurence E. Lynn, Jr., and H. Brinton Milward. Needless to say, this paper is the responsibility of the authorsonly.
1
Managerial Strategies and Behavior in Networks:
A Model with Evidence from U.S. Public Education*
Public managers often operate in settings involving public
and other institutional actors networked in patterns of
interdependence. Considerable attention has been focused on
networks, as scholars in a number of countries have sought to
understand and analyze the phenomenon (for instance Bogason and
Toonen 1998; Bressers, O’Toole, and Richardson 1995; Hufen and
Ringeling 1990; Jordan and Schubert 1992; Kickert et al. 1997;
Klijn 1996; Marin and Mayntz 1991; Marsh and Rhodes 1992; O’Toole
1997; and Provan and Milward 1995). While much attention has
been directed to explaining the emergence of networked public
management contexts and to theorizing about how managerial action
is likely to be influenced by and to influence such settings, a
range of additional issues has yet to be explored.
To date, researchers have not offered careful specification
of the relevant models even though such work is a necessary part
of developing sound explanations. Linking managerial actions in
networks explicitly with assessments of actual program
performance is also important.
These issues are dealt with directly in this paper. In
particular, we address these core questions: Do public managers’
efforts in and on the networks in which they operate affect
program performance? And if so, how? In focusing on these
2
subjects, we use a mathematical model of public management as
developed in other recent work (O’Toole and Meier 1999, 2000).
We isolate key features of the model for systematic empirical
examination in one important policy sector: public education in
the United States. We then investigate how the actions of these
public managers in interacting with their networked settings
contribute to the educational performance of their jurisdictions.
We do so via analysis of data from approximately 500 school
districts in one large, diverse American state -- Texas –- while
controlling for an array of other influences on performance.
Our prime focus in this study is to explore with some care
the impact of a strategic choice public managers often face: how
much energy and effort should they devote to operating in the
network (i.e., outside the core production organization) versus
their efforts inside the organization? We are interested in
testing the notion that the strategic choice to manage the
network makes a measurable difference in program results. We
also want to explore evidence on how managers who operate in
their networks are able to use their contexts to help make things
work better.
Networks, Performance, and Public Management
Public managers often operate in network settings in which
their own organizations are interdependent with a congeries of
other actors over whom they exercise little formal control. By
3
network we mean a pattern of two or more units, in which not all
the major components are encompassed within a single hierarchical
array (O’Toole 1997). Actors in networks often inhabit
bureaucratic units, but these units (or parts of units) are in
turn connected with other units outside the lines of formal
authority. While some programs are explicitly mandated to
operate via complex networked institutional arrangements (for
systematic evidence, see Hall and O’Toole 2000), other forms of
networked action often emerge through voluntary, negotiated,
self-organizing actions of participants (Gage and Mandell 1990;
Ostrom 1990). In the era of the so-called “hollow state,”
increasingly large slices of public action are structured through
complex multiparty relations, often involving contract ties and
intergovernmental links (Milward and Provan 2000). Network nodes
can consist of units spanning agencies, governments, and sectors
-- including public-private arrays. These developments are not
restricted to one country but have been documented widely
(examples include Bogason and Toonen 1998; Kickert et al. 1997;
O’Toole 1998; Peterson and O’Toole 2001; and Scharpf 1993).
Network arrangements can vary on a number of dimensions, but
there is little question networks are crucial for the delivery of
many important public programs and services (Frederickson 1999).
How public managers undertake their responsibilities in
network settings and what impacts such efforts have, therefore,
4
are obviously central issues. With regard to the former, a
strong case can be made that management in networks is different
in important respects from management within a hierarchy (Gage
and Mandell 1990; Klijn 1996; O’Toole 1997, 2000; Provan and
Milward 1995). Recent research on local governments in the
United States offers some persuasive evidence in this regard
(Agranoff and McGuire 2000).
Does managing in the network make a difference in how well
public programs work? Until recently, little systematic research
has investigated public-managerial impacts in general, let alone
the network variant. (For recent analyses of the governance
inputs to performance, see Lynn and Heinrich 2000; Lynn, Heinrich
and Hill 2000.) Still, given the indications that effective
management in network settings calls for somewhat different
actions and approaches from management in a relatively
straightforward hierarchy, an investigation of managers’ network
impacts on performance is apropos.
When public managers operate in network settings, of course,
they face many options for action and many strategic choices.
Arguably the most important of these is the decision about how
much time and energy to work in the network, and in which
directions (with which other network actors). After all,
managers must also consider that perhaps efforts should be
devoted to buffering program activities from the potentially

1We are analyzing some additional strategic choices made bynetwork managers via further empirical research not reported inthis study.
2Although the education literature rarely includesmanagement explicitly, some of that literature is relevant to thestudy of public management (see Bessent and Bessent 1980;Duncombe and Yinger 1997; Gross, Mason, and McEachern 1958;Hanushek 1986; Levin 1997; Purkey and Smith 1983; Zeigler, Kehoeand Reisman 1985); and Zigarelli 1996.
5
turbulent and uncertain network impacts. And managers also must
devote attention to the internal management of their units. Many
other strategic choices confront managers who function in
networks, of course, including which issues to raise with others
in the network, what positions to take, what style to exhibit,
how to balance short-term versus long-term needs, and so forth.
But the foundational choices are how much and with whom to
undertake network management itself. We concentrate on this
topic in the analysis that follows.1
The Networked World of U.S. Public Education
We explore the core issue in an important empirical policy
context that has rarely been investigated by public management
scholars: education.2 In the United States, the public
educational function is conducted by locally managed school
districts, typically designed as separate, special-purpose
governments, and not formally interdependent with other
production units. The special-district design itself was
developed precisely to buffer educational efforts from the

6
potentially confounding actions of other governmental actors
(Tyack 1974).
Nonetheless, the technical and political demands placed upon
school district superintendents -- the chief administrators of
the districts -- encourage them to develop, solidify, and use
ties with other important actors in their environments. The most
important of these are typically their own school board (the
elected body responsible for sketching broad policy for the
district), the relevant state-level educational department (a
source of primarily formula-based funding that varies in
importance from state to state, as well as a unit that issues
some regulations that apply to the local districts), state-level
legislators (who frame general educational policy), local
business leaders (who can play crucial roles in supporting the
locally enacted taxing decisions that drive much of school
district revenue), and other superintendents (professional
colleagues and sources of experience and innovation in the
turbulent world of public education). School districts, in
short, are organizations that are imbedded in a network.
In contemporary American public education, where funding
issues are critical and many ostensibly separate policy problems
(e.g., drug abuse, broken families) intrude in highly visible
ways in the educational process, schools have become
battlegrounds for a range of policy disputes (Chubb and Moe 1990;
3Some of the networked relationships are mandatory andimposed from the environment. An instance is the authority givento state auditors to check on fiscal matters. In most cases,however, the superintendent can develop new relationships or seekto alter mandated relationships in such a way to benefit thedistrict.
7
Meier and Stewart 1991). Efforts to reform schools and influence
educational policy are frequently debated and adopted in realms
where the school district is only one voice among many.
Accordingly, superintendents may have reason to devote managerial
energy and effort to understanding and leveraging their networked
environment. This network orientation is more extensive in the
U.S. context than in most other countries. An OECD study of 14
national education systems found that more education decisions
had to be made in consultation with others (44%) in the U.S. than
in any other Western democracy (OECD 1995: 52). U.S. systems
were also rated the lowest in terms of local (that is, school
district) autonomy.
Superintendents manage their districts — a headquarters
office along with sets of schools, which in turn are managed by
school “principals” (as the term is used) — within this broader
constellation of other actors, who may be potentially important
as sources of funds, staff, ideas, guidance, other resources, and
turbulence. The extent and kind of network to build, maintain,
and use is a matter largely under control of the superintendent.3
Network management, then, is an opportunity available to
8
those superintendents who recognize their interdependence and opt
to try to manage it actively. To network, in this context, is
therefore a key strategic option; and this is the issue we focus
on in the empirical portion of this study. The next section
sketches a mathematical model of the impact of public management
on public program performance and then offers and justifies more
simplified renditions for testing.
The Model and Its Refinements
In recent work, we have modeled the impact of public
management on program performance (O’Toole and Meier 1999, 2000).
We emphasize that programs’ institutional arrangements differ
greatly, and these variations are likely to be consequential for
the role and influence of managers. We are particularly
interested in that aspect of variation reflected in a continuum
of stable and well-buffered hierarchy (H), at one pole, and
flexible, more open network, on the other.
To treat seriously the general tendency for programs and
program performance to change incrementally, we build on an
autoregressive function. Adjustments to performance can be
caused by a wide array of forces, including myriad factors in the
environment -- and also the efforts of managers. Indeed, there
are reasons to expect public management in networks to matter
even more than otherwise (O’Toole 2000). The general model is:
[1] Ot = $1(H+M1)Ot-1 + $2(Xt/H)(M3/M4) + ,t

4We use the term M2 to designate the overall managerialeffort toward the networked environment, including both M3 andM4. That, is, M2 = M3/M4.
9
where
O is some measure of public program output or performance,
H is a measure of hierarchy normalized to range from 0 (pure
network) to 1 (pure hierarchy),
M denotes management which can be divided into three parts
M1 management’s contribution to program stability
through additions to hierarchy/structure,
M3 management’s efforts to exploit environmental
changes and forces,
M4 management’s effort to buffer environmental shocks,4
X is a vector of forces in the program’s environment,
, is an error term,
the subscripts for O, X, and , denote time periods, and
$1 and $2 are estimable parameters.
The several M’s reflect the multiple functions or activities of
management. The first term of the model can be considered the
internal or structural portion; the second term captures the
environmental segment. Public management is important in both
the structural and the environmental component of the model.
Structure also appears in each term, structural stability
contributing to program maintenance (represented in the first
term) and also creating a barrier to the environmental forces (in
10
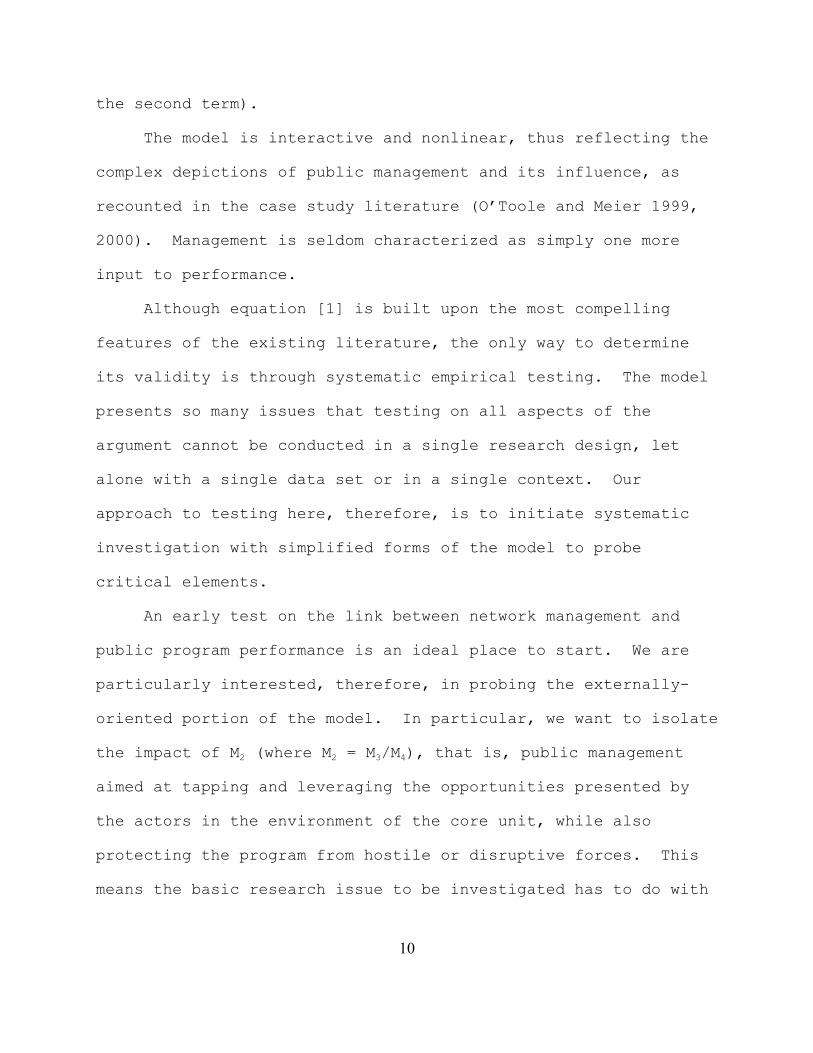
the second term).
The model is interactive and nonlinear, thus reflecting the
complex depictions of public management and its influence, as
recounted in the case study literature (O’Toole and Meier 1999,
2000). Management is seldom characterized as simply one more
input to performance.
Although equation [1] is built upon the most compelling
features of the existing literature, the only way to determine
its validity is through systematic empirical testing. The model
presents so many issues that testing on all aspects of the
argument cannot be conducted in a single research design, let
alone with a single data set or in a single context. Our
approach to testing here, therefore, is to initiate systematic
investigation with simplified forms of the model to probe
critical elements.
An early test on the link between network management and
public program performance is an ideal place to start. We are
particularly interested, therefore, in probing the externally-
oriented portion of the model. In particular, we want to isolate
the impact of M2 (where M2 = M3/M4), that is, public management
aimed at tapping and leveraging the opportunities presented by
the actors in the environment of the core unit, while also
protecting the program from hostile or disruptive forces. This
means the basic research issue to be investigated has to do with

11
the second or environmental term in the general model, and in
particular with the M2 specified in that term.
Rearranging terms in equation [1] yields the following:
[2] Ot = $1(H+M1)Ot-1 + $2XtM2(1/H) + ,t
The first term in an autoregressive model such as this would
surely be the dominant one in empirical settings: current
performance can be expected to be heavily driven by past
performance. Our primary interest, nonetheless, is in the second
term. We want to know whether exerting managerial skill and
effort in the network matters for program output. If it does,
the impact of M2 over more extended time periods can be expected
to be considerable, as it feeds into output through each cycle
(via the lagged dependent variable) and thus amplifies its
impact.
Two options for exploring the second term can be indicated,
each simplifying the general model in reasonable ways. One way
would be to retain the autoregressive feature as well as the key
elements representing network management (M2) and environmental
forces (X), while screening out the other managerial functions as
well as the structural variable (H). There is no prima facie
reason to expect the other aspects of public management within a
given case to covary with the network management function so the

5The actual correlation between network management andinteraction with one’s school principals (a hierarchical form ofmanagement, thus part of M1), in the data analyzed below, is .18suggesting that while the two are distinct, they are notcontradictory.
6Underspecification is clearly less of a problem in theautoregressive form of the model since any omitted variables arelikely to affect current outputs via past outputs. Only those
12
term M1 can be dropped from a simplified model.5 The H terms, as
well, can be omitted for present purposes. While the structural
setting matters, the empirical context we are examining consists
of a set of managerial cases highly similar in basic structural
features. All are not only in the same policy sector; they are
also the same particular type of program setting, institutional
design, and managerial level: local public school system
superintendents. By selecting a set of cases where public
managers confront structurally similar settings, structural
variation is minimized and we can examine their strategic choices
about how to interact in the network without confounding impacts
arising from widely differing structural contexts.
Accordingly, then, a simplified version of the model can be
considered:
[3] Ot = $1Ot-1 + $2XtM2 + ,t
Equation [3] is equation [2] following removal of H and the
other managerial form, M1, as variables. The model in this form
is clearly underspecified, but the simplification does allow for
testing of important components of the general model.6 Using

variables that affect current outputs but not last year’soutputs, therefore, are likely to be a problem. The greatestconcern should be whether there are omitted factors that covarywith elements included in the model.
13
[3], we can test the proposition that network management matters
for performance. And we can also explore whether and how
networking managers deal with shocks or perturbations from the
environment (X) in fashions different from managers who do not
network. These are substantial advantages.
One disadvantage that this version carries, nonetheless, is
that, given the degree of dominance that the autoregressive term
exerts in the model, detecting the impact of M2, which appears in
the much smaller second term, may be difficult. For this reason,
an empirical test involving this form of the simplified model can
be considered as a rather stringent one.
Another adjustment could also be useful to examine. This
version drops the autoregressive term altogether, in the interest
of focusing on the environmental impact itself. Thus:
[4] Ot = $2XtM2 + ,t
Estimating this form means sacrificing some further explanatory
power for the purpose of conducting an empirical test more
sensitive to the operation of M2 and its interaction with a
matrix of environmental forces.
Both versions, [3] and [4], are included in the analysis
that follows. Despite the fact that these forms of the model
14
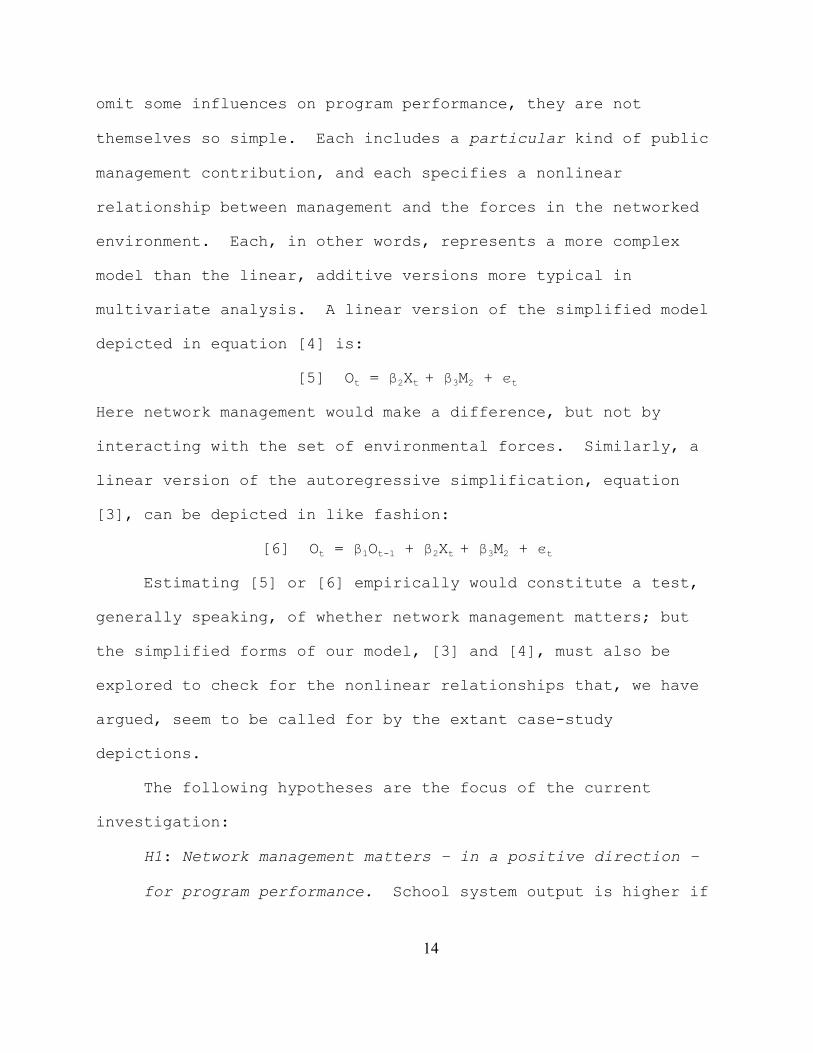
omit some influences on program performance, they are not
themselves so simple. Each includes a particular kind of public
management contribution, and each specifies a nonlinear
relationship between management and the forces in the networked
environment. Each, in other words, represents a more complex
model than the linear, additive versions more typical in
multivariate analysis. A linear version of the simplified model
depicted in equation [4] is:
[5] Ot = $2Xt + $3M2 + ,t
Here network management would make a difference, but not by
interacting with the set of environmental forces. Similarly, a
linear version of the autoregressive simplification, equation
[3], can be depicted in like fashion:
[6] Ot = $1Ot-1 + $2Xt + $3M2 + ,t
Estimating [5] or [6] empirically would constitute a test,
generally speaking, of whether network management matters; but
the simplified forms of our model, [3] and [4], must also be
explored to check for the nonlinear relationships that, we have
argued, seem to be called for by the extant case-study
depictions.
The following hypotheses are the focus of the current
investigation:
H1: Network management matters – in a positive direction –
for program performance. School system output is higher if

15
superintendents exert management effort in the network
surrounding them.
H2: Network management matters for how management relates to
both educational system inputs and environmental
perturbations. In practical terms, network managers deal
with environmental shocks in different ways than do those
public managers who do not manage in the network. Network
management interacts in a nonlinear fashion with the matrix
of environmental forces to which school districts are
exposed.
H3: The way that network managers tap their surroundings is
to exploit opportunities and buffer impediments to program
performance. That is, the form of the nonlinear function can
be expected to show network managers tapping resources in
their networked environments to enhance program performance.
To the extent that environmental shocks challenge or
threaten program performance, network managers can be
expected to protect the core performance bureaucracy from
these forces.
The next section provides information on the data, context,
and procedures used in empirical testing. Findings are then
presented and discussed, and some implications are sketched.
Methods
7Districts that responded to the survey were no differentfrom nonrespondents in terms of enrollment, enrollment growth,students’ race, ethnicity and poverty, or test scores. Therewere slight differences in a few other factors. Respondents had.48 more students per class, paid their teachers $200 more peryear but had annual operating budgets of about $100 per studentless.
8Independent means that the school district is notsubordinate to another unit such as a city. Independentdistricts have their own elected board, have the ability to taxand set budgets, and acquire bonding authority by a vote of theresidents.
16
The Units of Analysis
We conducted our empirical test of networking management
styles and performance on a subset of Texas school districts.
All district superintendents were sent a mail questionnaire to
collect information about management styles, goals, and time
allocations. A follow-up contact produced a return rate of 55%.
Of these 507 responses were useable in our analysis.7 We pooled
five years (1995-99) of data on performance and control variables
to produce a total of 2535 cases for analysis. All data other
than the survey were taken from the data sets of the Texas
Education Agency.
As mentioned earlier, school districts in the United States
are generally independent8 local governments with their own
taxing powers; all districts in the sample are organized in this
way. They are also subject to both state and federal rules and
regulations and receive funds from both sources. The amount of
state funding and state control varies from state to state. The

9Our formal presentation of theory (see O’Toole and Meier1999) holds that structures and management are reciprocallyrelated. One function of management is to create, modify, and
17
state of Texas pays for approximately 50% of the costs of
education, but its oversight is generally limited to issues of
accountability (testing, attendance, time in class, number of
courses, etc.). In contrast to other states, the Texas system is
considered relatively decentralized with most authority residing
with the local school districts. Each district determines its own
curriculum and makes all its own personnel decisions.
Although schools and school districts are the most common
public organizations in the United States, they have some
distinct characteristics. Schools districts are highly
professionalized with elaborate certification processes for
various occupations. The organizations themselves tend to be
highly decentralized with a great deal of discretion vested at
the street level (classroom). The findings here, if they can be
generalized, would be applicable to similar types of
organizations.
Measuring a Management Networking Style
If managing in a network has a behavioral as well as a
structural dimension, then one should be able to measure
networking differences -- the behavioral dimension -- even across
program settings that are ostensibly similar in structure,
including those with core units that are hierarchies.9 A network

maintain structures. As a result, whether the behavioraldimension that we measure here represents “management” or“structure” is less important. We attempted to sort out theseprecursors by limiting the analysis to districts with the samesuperintendent over this five year period, and the result weresimilar to those presented here.
10In our measure of M2, we include school boards as anelement of the networked environment of the superintendent. Since the board-superintendent relationship is designated inprincipal-agent form, it might be argued that the tie is“internal” to the district, even if not internal to theeducational bureaucracy and its day-to-day operations. Thisinterpretation would argue for a recalculated M2 measure basedonly on superintendents’ interactions with the other four sets of
18
management style would be characterized by greater interaction
with environmental actors who are not direct line subordinates or
superiors. In the present case of school superintendents, we
have selected five sets of actors from the organization’s
environment –- school board members, local business leaders,
other school superintendents, state legislators, and the Texas
Education Agency. We asked each superintendent to note how often
they were in contact with each of these others, on a six point
scale ranging from daily to never. Superintendents with a
networking management style should interact more frequently with
all five other sets of actors than should a superintendent with a
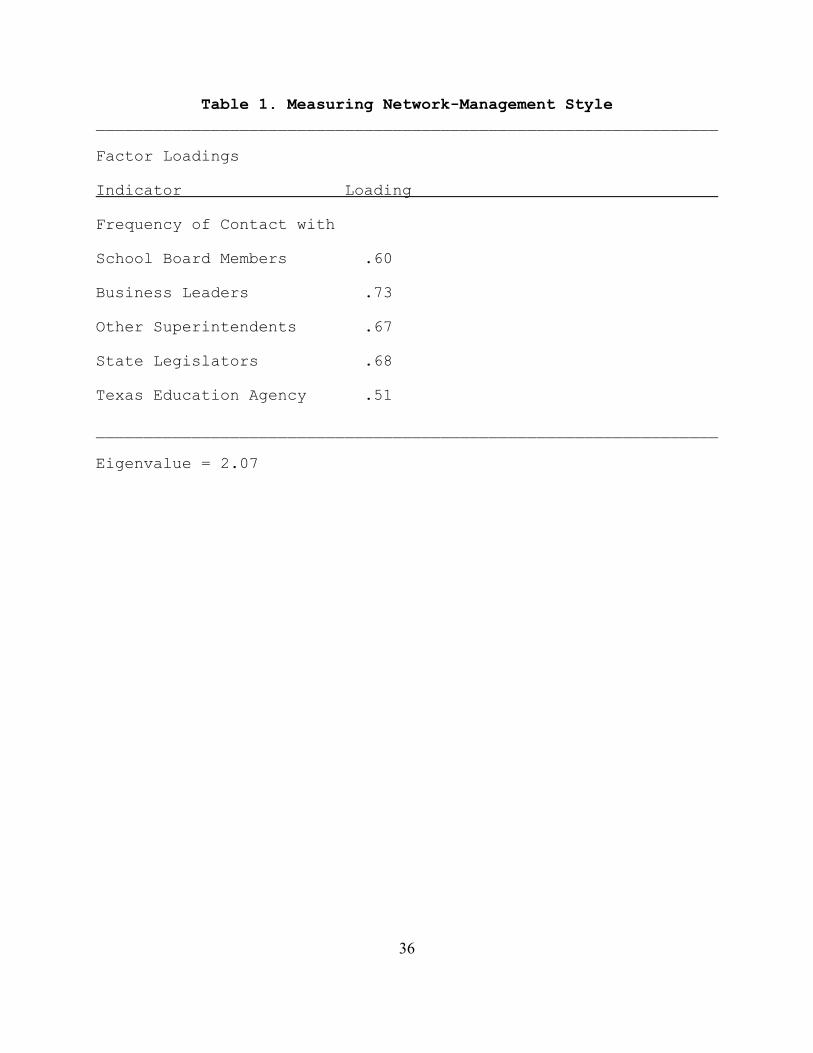
traditional hierarchical management style. A composite network
management style scale was created via factor analysis (see Table
1). All five items positively loaded on the first factor
producing an eigenvalue of 2.07; no other factors were
significant.10 Factor scores from this analysis were then used

actors identified here. We treat school boards as part of theenvironment in the analysis that follows since we think that onbalance this notion is more appropriate, but we have alsoperformed the entire set of analyses again with M2 measured onlyon the other four types of interactions. The results are verysimilar to those reported here. Omitting boards from the studystrengthens the impact of M2 on performance modestly in thelinear versions of the simplified model and weakens slightly theevidence on nonlinearity. The correlation between the twomeasures of network management is .96. The network managementstyle factor correlates at -.27 with time spent managing thedistrict (in contrast to time spent in contacts outside theorganization).
11This paper is our first empirical step in operationalizingour model. It is part of a larger research agenda; future workwill be devoted to measuring and testing how other aspects ofmanagement might affect program and organizational performance.
19
as a measure of management networking or M2 with higher scores
indicating a greater network orientation.
[Table 1 about here]
Clearly, this measure is simplified. It ignores all aspects
of networking aside from frequency and direction -- for instance,
skill, reputation, and a number of strategic considerations.11
Further, it taps a particular kind of networking activity:
interactions of managers in clusters of dyadic interactions.
Networks can range considerably in the extent to which they are
integrated and the degree to which all actors are directly linked
to the full range of others. Still, the measure taps the effort
managers choose to put into managing externally, in the

12Clearly, both “sides” can initiate interactions. Anecdotalevidence suggests that skillful superintendents generally do notwait passively to be contacted.
13Networking can, of course, occur at other levels of theorganization and this measure will underestimate total networkingby the organization. Some of the network links are also clearlymore important than others, and equal weighting might obscurethis. These and other measurement problems are likely toattenuate any relationships found.
14In policy analysis terms test scores are an outcome ratherthan an output.
20
network.12 Furthermore, the factor-analytic results suggest that
the notion of network management as a strategic choice is a
coherent concept that makes empirical sense.13
The Dependent Variable
Our measure of program output14 or performance (O) is the
percentage of students in each school district who pass state-
required, standardized reading, writing, and mathematics tests
each year. While tests such as these clearly do not measure the
entire student learning experience, they are frequently used in
assessments of the effectiveness of schools and school districts
(Jencks and Phillips 1998; Hanushek 1986). At a minimum, schools
should be expected to produce students who have basic reading and
math skills, and pass rates on these exams serve as good
indicators of how schools perform in furnishing students with
these skills. The exams themselves are highly salient, and
results are front-page news when released. The importance of the
exam scores suggests that they should be a relatively good

15Our measure of network effectiveness differs from much ofthe literature which uses survivability (see Yuchtman andSeashore 1967; Provan and Milward 2001).
21
performance measure for an assessment of management activities.15
Environmental Variables
Environments provide both opportunities and constraints (X
variables). Although program environments in general and those
of school districts in particular are complex, we simplify our
analysis by drawing from findings in the research literature on
educational policy (for example, Hanushek 1996; Hedges and
Greenwald 1996) and focusing on only two sets of environmental
variables –- one cluster for the task difficulty (or constraints)
facing the unit and the other for program resources (or
opportunities). Task difficulty reflects the truism that some
students are easier to educate than others. The literature
consistently finds that poverty and race are correlated with
greater education problems (Jencks and Phillips 1998). Poverty
and race are associated both with a lack of educational resources
in the home and with other factors (e.g. single-parent
households) that can affect student learning. The three specific
measures of environmental constraints that we include are the
percentage of black students, the percentage of Latino students,
and the percentage of poor students (measured as the percentage
of students eligible for free school lunch programs). Each of
these control variables, as a constraint, should be negatively

22
related to student performance.
Although the relationship between resources and student
performance is controversial in education policy (Hedges and
Greenwald 1996; Hanushek 1996), students of organization assume a
direct linkage between resources and performance (Simon 1947;
Thompson 1967). Recent education research using well-crafted
longitudinal data sets and well-designed experiments
generally shows that additional resources are associated with
higher student performance (Evans, Murray and Schwab 1997;
Wenglinsky 1997). Five measures of resources are included –-
average teacher salary, average class size, average years of
teacher experience, percentage of noncertified teachers, and
percentage of funds from state government. Teacher salaries and
teacher experience should be positively related to student
performance; class size and teacher noncertification should be
negatively related to performance (one can think of either small
classes as a resource or large classes as a constraint). Funds
from the state are included because state government provides a
large portion of district resources, especially in low income
districts.
School districts differ from other organizations in that
they have less control over their inputs and resources. Public
schools have to educate everyone who shows up; they have to
adjust how they educate students to differing student needs.

23
Similarly, the school district only raises a portion of its
resources via its own taxing powers (and even that portion is
limited by public support). It must convince other governments
and other actors to provide it money that is needed to hire
staff, building facilities, and educate students. Students and
resources, therefore, should be considered as part of the school
system’s environment, as the X variables in our models.
Because our data are pooled (five years), we have also
included a set of control variables to deal with the time-series
aspect of the data set. Dummy variables for individual years
were included in each equation. These dummy variables were
always jointly significant reflecting the overall positive trends
in the student performance. To deal with the other source of
problems related to pools, we assessed the cross-sections of each
equation for heteroscedasticity problems. The levels of
heteroscedasticity were modest and had little impact on the
findings presented here.
Findings
Our strategy of analysis will be to begin with relatively
simple models and build up to more complex variants that provide
stronger tests of our theory. We will start with tests to
determine whether management matters at all in the performance of
these school systems (thus testing H1) then move to tests of
whether the relationship of management to performance is

24
nonlinear; and if so, how (H2, H3). A second, more stringent,
set of tests will then take place within an autoregressive model
of program performance.
Our simplest nonlinear model of management, equation [4], is
reproduced below:
[4] Ot = $2XtM2 + ,t
As the first step to assessing this relationship, we begin with
the linear, additive relationship depicted earlier:
[5] Ot = $2Xt + $3M2 + ,t
In this model the question is whether management matters when one
controls for the constraints and resources facing the school
district (the vector of X variables). The test of this model,
handled via standard OLS multiple regression, appears in Table 2.
The column designated “Base Model” contains all the X variables,
and the next column (“Network+”) adds the management measure to
this equation. The X variables generally predict as expected
with negative relationships for all constraints (percent black,
Latino and poor students), noncertified teachers and class size,
and positive relationships for the resource variables (with the
exception of state aid). When the network management variable is
added to this equation, it produces a strong positive
coefficient. Programs characterized by greater network
management are programs that generate relatively higher outputs.
Because the management variable is measured as a factor score
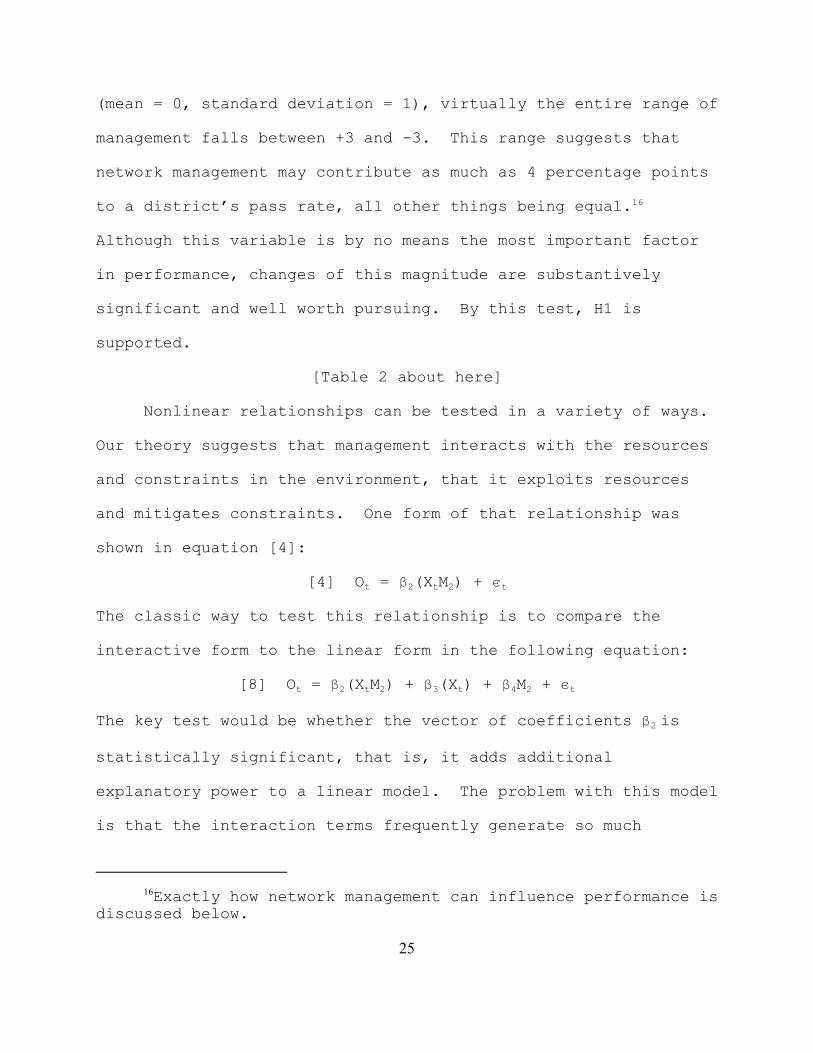
16Exactly how network management can influence performance isdiscussed below.
25
(mean = 0, standard deviation = 1), virtually the entire range of
management falls between +3 and -3. This range suggests that
network management may contribute as much as 4 percentage points
to a district’s pass rate, all other things being equal.16
Although this variable is by no means the most important factor
in performance, changes of this magnitude are substantively
significant and well worth pursuing. By this test, H1 is
supported.
[Table 2 about here]
Nonlinear relationships can be tested in a variety of ways.
Our theory suggests that management interacts with the resources
and constraints in the environment, that it exploits resources
and mitigates constraints. One form of that relationship was
shown in equation [4]:
[4] Ot = $2(XtM2) + ,t
The classic way to test this relationship is to compare the
interactive form to the linear form in the following equation:
[8] Ot = $2(XtM2) + $3(Xt) + $4M2 + ,t
The key test would be whether the vector of coefficients $2 is
statistically significant, that is, it adds additional
explanatory power to a linear model. The problem with this model
is that the interaction terms frequently generate so much
26
collinearity that individual coefficients can not be precisely
estimated. The actual coefficients are important because we have
specific hypotheses about how management affects the
environmental variables, that is, it should increase the impact
of resources and reduce the impact of constraints.
To test these specific estimates, an alternative approach is
necessary. We divide the sample into two parts –- districts with
high network management (those with scores above 0) and districts
with low network management (scores below 0):
[9] Ot = $2(Xt) + ,t M2 > 0
[10] Ot = $2(Xt) + ,t M2 < 0
The results of these models produced by splitting the sample are
shown in Table 3. The constraints can be examined first. Our
theory suggests that for high levels of network management, the
size, or impact, of each of these should drop in absolute value.
Although the coefficients do not change dramatically, in two
cases (blacks and Latinos) the hypothesis is confirmed. In one
case (low income) it is not. In terms of the four cases of
resources (state aid is not significant and can be ignored),
three are as predicted. Districts with more network management
get more out of teachers’ salaries and reductions in class size
and are less affected by noncertified teachers. Teacher
experience shows an interesting pattern of significance for low-
networked districts and insignificance for the high-networked
17The resource measures should be thought of as generalmeasures of resources from the environment rather thanspecifically teacher salaries and class size. Access toresources correlates with both teachers’ salaries and class sizeas well as a variety of other factors.
27
districts. While this result ostensibly contradicts our
hypothesis, it means that high-networked districts are not
affected by having less experienced teachers.
[Table 3 about here]
Five of the seven relationships found in Table 3 are
consistent with our nonlinear, interactive theory of management.
Although this might not seem like strong support for the theory,
examining the individual coefficients provides additional
corroboration. Most of the relationships differ from each other
in only marginal ways. The differences between four sets of the
relationships, however, are substantial. Districts characterized
by a high network management style get 2.7 times the impact from
higher teacher salaries, receive 5.5 times the impact from
smaller classes, get only 42% of the negative impact of
noncertified teachers, and are not affected at all by
inexperienced teachers.17 Even with the relatively crude test
presented here (a simple measure of managing in the network, a
deliberately underspecified model), therefore, management does
matter; and it matters by interacting with program resources and
constraints in predicted directions. H2 (nonlinearity) and H3
(direction of relationships) are supported by these tests.
28
The pattern of relationships merits some additional comment.
Management is about choice and decision making. Quite clearly
managers allocate more time and effort to some constraints and
resources than to others. As a result, expecting all resources
to become more valuable and all constraints to become less
negative may not only be expecting too much, it might also
conflict with what the manager is trying to do. In other words,
the results may be evidence that managers make strategic
networking choices beyond the fundamental ones of how often? and
with whom? An effective manager might well focus on a small
number of strategic factors that can be manipulated to get better
results while at the same time accepting some modest negative
tradeoffs on less important variables. The relationships in
Table 3 are consistent with such an interpretation. The negative
findings are relatively small, as are a few of the positive
findings. Three of the impacts are substantial -– those
regarding teachers’ salaries, class size, and noncertified
teachers. Getting large positive results on these three
variables more than compensates for the modest negative changes
on other factors.
Autoregressive Models
Because organizations stress standard operating procedures,
specialization, and consistency, they tend to be relatively
predictable and stable from year to year. They are, in methods
29
terms, autoregressive systems (O’Toole and Meier 1999). A
stronger and more difficult test of our theory of management
involves moving to an autoregressive model where current
performance is determined in part by past performance. Again our
strategy of analysis will be the same. First, we examine whether
management matters at all; and then, we examine whether or not
the impact is nonlinear. The autoregressive model analogous to
equation [5] -- one treating management as simply another
additive input -- is:
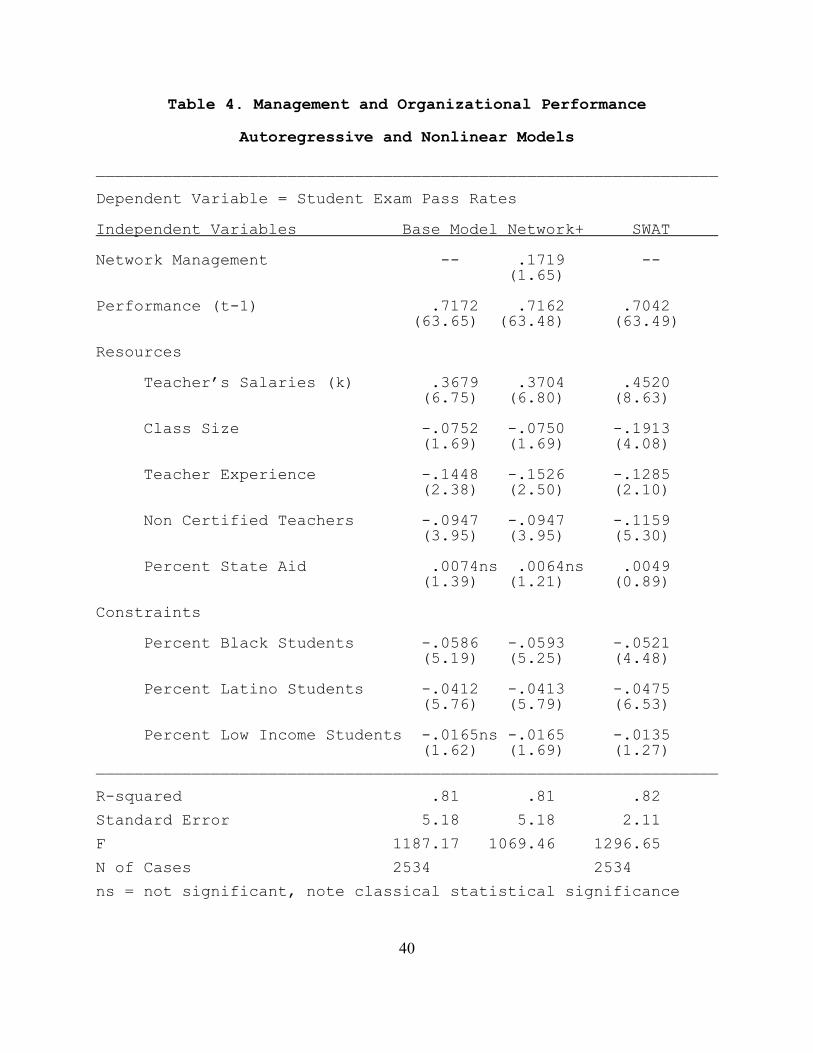
[6] Ot = $1Ot-1 + $2Xt + $3M2 + ,t
The basic linear model without management is shown in the
first column of Table 4. The lagged dependent variable dominates
the equation. The constraints remain negative, though with
diminished impact; similarly the resources remain positive but
with smaller impacts. The lagged dependent variable essentially
limits the influence of these variables to their impacts on
changes from year to year, and this short-term impact by
definition must be smaller than a one-shot estimate of impact on
a cross-section. Despite the stringent nature of this test,
management continues to have a positive impact on performance.
For the full range of this variable, management could make a
difference of as much as one percentage point per year on the
pass rate. While this may not appear to be a substantial, with
the autoregressive model these impacts continue to affect future
18The long-run performance of the management variable has avalue of approximately .6 which means the maximum total impact isapproximately 3.6 percentage points, an estimate very similar tothe estimate for nonautoregressive models.
19For our purposes, SWAT is preferable to quantileregression. The former retains the comparison to the remainingunits in the analysis. And SWAT assumes that differences in thedependent variable are real — that is, that the residual tapsreal performance differences. Quantile regression assumes thatmuch of the residuals consists of idiosyncratic variation or evenerror.
30
performance for several years into the future (see Pyndick and
Rubinfeld 1990; O’Toole and Meier 1999).18 By this stringent
test, therefore, H1 is again supported.
[Table 4 about here]
Assessing the nonlinear impacts in an autoregressive model
is somewhat more difficult given that the autoregressive term so
dominates the equation. The result is that the remaining
coefficients are often less stable so that a standard interaction
often has too much collinearity, and dividing the sample could
leave too little variance to provide efficient estimates. An
alternative approach is to use substantively weighted analytical
techniques (SWAT), a form of exploratory data analysis that
allows one to focus on interesting subsets of data (Meier and
Gill 2000).19 Applied to the current case, the logic is as
follows. If management has a nonlinear/interactive relationship
with forces and inputs from the environment, then those units
characterized by high levels of network management should operate
31
with a different set of relationships than the average
organization. Hypothetically, this suggests that if one
replicated the analysis reported in Table 4 with a sample of
units but only had those with high levels of network management,
the regression coefficients would change.
To get at this hypothetical situation, SWAT asks what would
happen if the population of units were to contain many more with
high levels of network management and many fewer with low levels
of network management. SWAT creates such an artificial universe
by reweighting cases in the existing sample. Comparing the
regression from this sample from a hypothetical population to the
sample from the existing population should provide some leverage
on whether management matters more or in different ways in these
sets of situations. In the specific case, we designated those
school districts with network management scores above 1.36 (about
10 percent of the total) as having a high level of network
management. We used a higher threshold in this situation rather
than just the top half because the autoregressive specification
is likely to wash out relatively small differences in management
activities. School districts with a network management score
below 1.36 were weighted at 0.1 compared to weights of 1.0 for
those above this threshold. This process artificially creates a
sample that has only one-tenth as many districts in the low
category and ten times as many (relatively) in the high network

32
management category. The results of this weighted regression are
shown in column 3 of Table 4.
The coefficients in column 3 are not parameter estimates
(since they deal with a hypothetical universe) but are
informative when contrasted with the OLS regression coefficients
because they show how a set of units with a higher degree of
network management might use resources differently. The previous
results in Table 3 suggest teacher salaries, noncertified
teachers, and class size are likely to be the key variables.
Most of the SWAT/OLS differences are relatively small, but in two
cases, teachers salaries and class size, the differences in
coefficients are substantial. In both cases the implication is
that programs with more network management get more out of their
resources. The SWAT equation stressing high levels of management
has a teacher salary coefficient approximately 24% larger,and the
class size coefficient is 254% times larger than that for the
same variable in the base OLS regression.
The consistency of these two relationships with the same
relationships in the nonautoregressive model in Table 3 is
reasonable evidence that one style of management is likely to
interact with program inputs from the environment to produce
outputs above what would be expected in a strictly linear
relationship. Again, H2 and H3 are supported even in the
estimations of an autoregressive model.
20Visits to various schools indicate that the process mightbe that networking behavior is also associated with otherbehaviors that improve the levels of organizational cohesion. Both good and bad schools frequently have the same programs; thedifference is often in the commitment of teachers andadministrators to making programs work.
33
In this analysis we have not demonstrated the process by
which managing in the network generates better results. We have
several hypotheses. First, management’s greater attention to the
environment might create buffers from external shocks and thus
permit lower level personnel (teachers, principals) to be more
effective. Second, a networking style might encourage a more
decentralized internal management approach, an approach advocated
by much current education reform literature. Third, the
networking might expose the superintendent to innovative programs
operated by other districts. Fourth, managerial networking might
convince external stakeholders to grant more autonomy to the
school district and thus allow the district to exploit the
expertise it has. In all four cases organizations might be able
to use resources more effectively.20 These and other hypotheses
for the linkage between network management and performance are
all plausible; future research can be designed to evaluate these
hypotheses.
Conclusions
This research presents the first systematic effort to test
for the impact of public management on program performance using
21What is more, managers in our sample do so even though theytend to spend less time on the internal management of productionitself.
34
the O’Toole-Meier model. The study focuses on efforts to manage
the network of actors that affect one type of program: public
education. In districts where superintendents engage in more
network interactions, performance improves even if one controls
for a variety of factors that affect this performance and even in
a autoregressive model. Further, the interactive nature of
management is apparent both in relatively simple assessments of
management and in relatively complex autoregressive assessments.
Network management appears to allow superintendents to translate
resources into outputs at a more efficient rate.21 In short, the
hypotheses under examination are supported by this analysis.
Since public school systems probably face less complicated and
less populated networks than many other public programs, the
results of this study strongly suggest the importance of network
management more broadly for today’s public programs.
Still, the results here are only a first step in an
empirical theory of public management. Numerous questions remain
to be answered. When do managers decide to buffer environmental
influences and when do they decide to exploit them? What
conditions lead a manager to devote resources to network
management rather than internal management? What is the impact
of management -- internal management as well as network

35
management -- as the degree of hierarchy declines? How is this
affected by the need to create networks with other actors? What
are the factors that managers opt to manipulate and what factors
do they simply seek to minimize? How well does the present
theory of management work in situations where core production
organizations are structured differently?
These and other questions remain to be addressed. Still,
the results of this study offer encouragement for those who are
convinced that public management matters, that network management
itself can be important for performance, and that complex models
of public management are worthy of serious attention.
36
Table 1. Measuring Network-Management Style_________________________________________________________________
Factor Loadings
Indicator Loading
Frequency of Contact with
School Board Members .60
Business Leaders .73
Other Superintendents .67
State Legislators .68
Texas Education Agency .51
_________________________________________________________________
Eigenvalue = 2.07

37
Table 2. Management and Organizational Performance:
Additive Linear Estimation_________________________________________________________________
Dependent Variable = Student Exam Pass Rates
Independent Variables Base Model Network+
Network Management -- .7035 (4.60)
Resources
Teacher’s Salaries (k) .4875 .4665 (4.49) (4.31)
Class Size -.3199 -.3117 (4.83) (4.72)
Teacher Experience .2048 .1943 (2.10) (1.90)
Non Certified Teachers -.1874 -.1873 (5.28) (5.30)
Percent State Aid -.0127ns -.0173 (1.53) (2.09) Constraints
Percent Black Students -.2153 -.2167 (13.35) (13.49)
Percent Latino Students -.1099 -.1091 (10.43) (10.39)
Percent Low Income Students -.1671 -.1670 (11.12) (11.16)_________________________________________________________________
R-squared .58 .59
Standard Error 7.65 7.62
F 294.96 276.07
N of Cases 2534 2534 Dummy variables for individual years not reportedns= not significant

38
Table 3. Management and Organizational Performance:
Nonlinear Impacts_________________________________________________________________
Dependent Variable = Student Exam Pass Rates Level of Management Networking
Independent Variables High Low
Resources
Teacher’s Salaries (k) .7727 .2835 (4.55) (1.98)
Class Size -.6620 -.1211ns (5.90) (1.47)
Teacher Experience -.1256 .4556 (.85) (3.51)
Non Certified Teachers -.1100 -.2638 (2.20) (5.30)
Percent State Aid -.0189ns -.0073ns (1.39) (0.69) Constraints
Percent Black Students -.1846 -.2291 (7.20) (13.49)
Percent Latino Students -.1003 -.1147 (6.18) (10.39)
Percent Low Income Students -.1966 -.1537 (8.53) (11.16)_________________________________________________________________
R-squared .57 .61
Standard Error 7.60 7.61
F 124.23 176.83
N of Cases 1154 1380 Dummy variables for individual years not reported
ns= not significant

39
40
Table 4. Management and Organizational Performance
Autoregressive and Nonlinear Models _________________________________________________________________
Dependent Variable = Student Exam Pass Rates
Independent Variables Base Model Network+ SWAT
Network Management -- .1719 -- (1.65)
Performance (t-1) .7172 .7162 .7042 (63.65) (63.48) (63.49)
Resources
Teacher’s Salaries (k) .3679 .3704 .4520 (6.75) (6.80) (8.63)
Class Size -.0752 -.0750 -.1913 (1.69) (1.69) (4.08)
Teacher Experience -.1448 -.1526 -.1285 (2.38) (2.50) (2.10)
Non Certified Teachers -.0947 -.0947 -.1159 (3.95) (3.95) (5.30)
Percent State Aid .0074ns .0064ns .0049 (1.39) (1.21) (0.89) Constraints
Percent Black Students -.0586 -.0593 -.0521 (5.19) (5.25) (4.48)
Percent Latino Students -.0412 -.0413 -.0475 (5.76) (5.79) (6.53)
Percent Low Income Students -.0165ns -.0165 -.0135 (1.62) (1.69) (1.27)_________________________________________________________________
R-squared .81 .81 .82
Standard Error 5.18 5.18 2.11
F 1187.17 1069.46 1296.65
N of Cases 2534 2534
ns = not significant, note classical statistical significance

41
does not apply to SWAT models.

42
References
Agranoff, Robert, and Michael McGuire. 2000. Managing acrossGovernments and Organizations. Unpublished book manuscript.
Bogason, Peter, and Theo A.J. Toonen, eds. 1998. “ComparingNetworks.” Symposium in Public Administration 76, 2: 205-407.
Bessent, Authella M. and E. Wailand Bessent. 1980. "Determiningthe Comparative Efficiency of Schools through DataEnvelopment Analysis." Education Administration Quarterly 16(2): 57-75.
Bressers, Hans, Laurence J. O’Toole, Jr., and Jeremy Richardson,eds. 1995. Networks for Water Policy: A ComparativePerspective. London: Frank Cass.
Chubb, John and Terry M. Moe. 1990. Politics, Markets andAmerica’s Schools. Washington: Brookings.
Duncombe, William and John Yinger. 1997. "Why Is It So Hard toHelp Central City Schools?" Journal of Policy Analysis andManagement 16: 85-113.
Evans, William N., Shelia E. Murray, and Robert M. Schwab. 1997."Schoolhouses, Courthouses, and Statehouses After Serrano."Journal of Policy Analysis and Management 16 (Winter): 10-31.
Frederickson, H. George. 1999. “The Repositioning of AmericanPublic Administration.” PS 32, 4: 701-711.
Gage, Robert W., and Myrna P. Mandell, eds. 1990. Strategiesfor Managing Intergovernmental Policies and Networks. NewYork: Praeger.
Gross, Neal, Ward S. Mason, and Alexander W. McEachern. 1958. Explorations in Role Analysis: Studies of the SchoolSuperintendency Role. New York: John Wiley and Sons.
Hall, Thad E., and Laurence J. O’Toole, Jr. 2000. “Structuresfor Policy Implementation: An Analysis of NationalLegislation, 1965-1966 and 1993-1994.” Administration andSociety 31, 6: 667-686.
Hanushek, Erik. 1996. “School Resources and Student Performance.@In Does Money Matter?, Gary Burtless, ed. Washington, D.C.:Brookings Institution.
Hanushek, Eric A. 1986. "The Economics of Schooling: Productionand Efficiency in Public Schools." Journal of EconomicLiterature 24: 1141-1177.
Hedges, Larry V. and Rob Greenwald. 1996. “Have Times Changed?The Relation Between School Resources and StudentPerformance.@ In Does Money Matter?, Gary Burtless, ed.Washington, D.C.: Brookings.
Heinrich, Carolyn J. and Laurence E. Lynn, Jr., eds. 2000. Government Performance: New Perspectives. Washington, DC:

43
Georgetown University Press.Hufen, Hans, and Arthur Ringeling, eds. 1990. Beleidsnetwerken:
Overheids-, semi-overheids-, en particuliere organisaties inwisselwerking. The Hague: VUGA.
Jordan, Grant, and K. Schubert. 1992. “A Preliminary Orderingof Policy Network Labels.” European Journal of PoliticalResearch 21, 1-2: 7-27.
Jencks, Christopher, and Meredith Phillips, Eds. 1998. The Black-White Test Score Gap. Washington, D.C.: The BrookingsInstitution.
Kickert, Walter J.M., Erik-Hans Klijn, and J.F.M. Koppenjan, eds. 1997. Managing Complex Networks: Strategies for the PublicSector. London: Sage.
Klijn, Erik-Hans. 1996. Regels en sturing in netwerken. Delft:Eburon.
Levin, Henry M. 1997. "Raising School Productivity: An X-Efficiency Approach." Economics of Education Review 16: 303-311.
Lynn, Laurence E., Jr., Carolyn J. Heinrich, and Carolyn J. Hill. 2000. “Studying Governance and Public Management:Challenges and Prospects.” Journal of Public AdministrationResearch and Theory 10, 2: 233-61.
Marin, B., and Renate Mayntz, eds. 1991. Policy Networks:Empirical Evidence and Theoretical Considerations. Boulder,Colorado: Westview Press.
Marsh, David., and R.A.W. Rhodes, eds. 1992. Policy Networks inBritish Government. Oxford: Clarendon Press.
Meier, Kenneth J. and Joseph Stewart. 1991. The Politics ofHispanic Education. Albany: SUNY Press.
Meier, Kenneth J. and Jeff Gill. 2000. What Works: A NewApproach to Program and Policy Analysis. Boulder, CO:Westview Press.
Milward, H. Brinton, and Keith G. Provan. 2000. “Governing theHollow State.” Journal of Public Administration Researchand Theory 10, 2: 359-79.
Organisation for Economic Cooperation and Development. 1995. Decision-Making in 14 OECD Education Systems. Paris: OECD.
O’Toole, Laurence J., Jr. 1997. “Treating Networks Seriously:Practical and Research-based Agendas in PublicAdministration. Public Administration Review 57, 1: 45-52.
O’Toole, Laurence J., Jr. 1998. Institutions, Policy andOutputs for Acidification: The Case of Hungary. Aldershot,UK: Ashgate.
O’Toole, Laurence J., Jr. 2000. “Different Public Managements? Implications of Structural Context in Hierarchies andNetworks.” In Jeffrey Brudney, O’Toole, and Hal G. Rainey,eds., Advancing Public Management. Washington, D.C.:
44
Georgetown University Press, 1-12.O’Toole, Laurence J., Jr., and Kenneth J. Meier. 1999.
“Modeling the Impact of Public Management: Implications ofStructural Context.” Journal of Public Management Researchand Theory 9, 4: 505-526.
O’Toole, Laurence J., Jr., and Kenneth J. Meier. 2000. “Networks, Hierarchies, and Public Management: Modeling theNonlinearities.” In Carolyn J. Heinrich and Laurence E.Lynn, eds., Government Performance: New Perspectives. Washington, DC: Georgetown University Press.
Ostrom, Elinor. 1990. Governing the Commons: The Evolution ofInstitutions of Collective Action. Cambridge: CambridgeUniversity Press.
Peterson, John, and Laurence J. O’Toole, Jr. 2001. “FederalGovernance in the US and the EU: A Policy NetworkPerspective.” In Kalypso Nicolaidis and Robert Howse, eds.,The Federal Vision: Legitimacy and Levels of Governance inthe US and the EU. Oxford: Oxford University Press,forthcoming.
Pindyck, Robert S. and Daniel L. Rubinfeld. 1991. EconometricModels & Economic Forecasts. New York: McGraw-Hill.
Provan, Keith G., and H. Brinton Milward. 1995. “A PreliminaryTheory of Network Effectiveness: A Comparative Study of FourMental Health Systems. Administrative Science Quarterly 40,1: 1-33.
Provan, Keith G., and H. Brinton Milward. 2001. “Do NetworksReally Work? A Framework for Evaluating Public-SectorOrganizational Networks.” Public Administration Review 61(forthcoming).
Purkey, Stewart and Marshall S. Smith. 1983. "Effective Schools:A Review." The Elementary School Journal 83: 427-452.
Scharpf, Fritz W., ed. 1993. Games in Hierarchies and Networks:Analytical and Empirical Approaches to the Study ofGovernmental Institutions. Boulder, Colorado: Westview Press.
Tyack, David B. 1974. The One Best System: A History ofAmerican Urban Education. Cambridge: Harvard UniversityPress.
Simon, Herbert A. 1947. Administrative Behavior. New York: TheFree Press.
Thompson, James D. 1967. Organizations in Action. New York:McGraw Hill.
Wenglinsky, Harold. 1997. How Educational Expenditures ImproveStudent Performance and How They Don’t. Princeton, NJ:Educational Testing Service.
Yuchtman, Ephraim and Stanley Seashore. 1967. “A SystemsResource Approach to Organizational Effectiveness.” American

45
Sociological Review 32: 891-903.Zeigler, L. Harmon, Ellen Kehoe, and Jane Reisman. 1985. City
Managers and School Superintendents. New York: Praeger.Zigarelli, Michael A. 1996. "An Empirical Test of Conclusions
From Effective Schools Research." The Journal of EducationalResearch 90: 103.