Embed Size (px)
Citation preview

Maria Antonia BrovelliPresenter: Truong Xuan Quang
DIIAR, Politecnico di Milano – Como Campus, ItalyGérald Fenoy
GeoLabs sarl, avenue des Platanes 34970 Lattes, France
Managing Satellite Precipitation Data(PERSIANN) Through Web GeoServices:A Case Study in North Vietnam
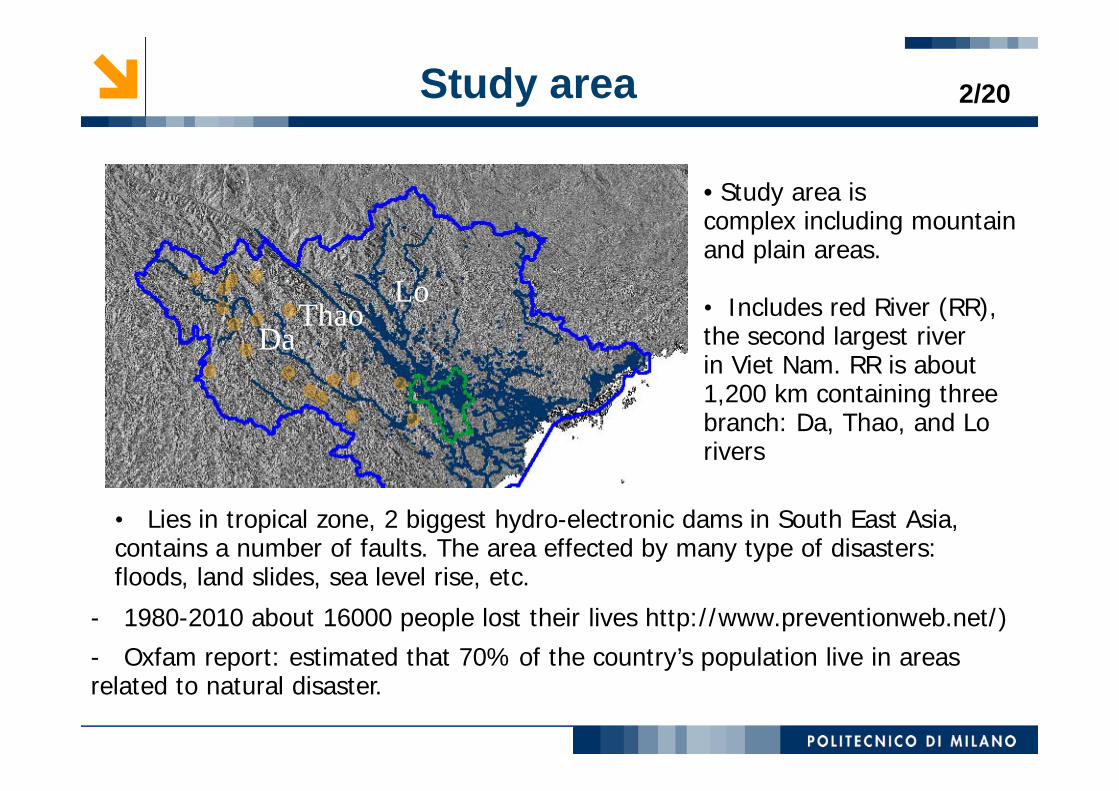
Study area
- 1980-2010 about 16000 people lost their lives http://www.preventionweb.net/)- Oxfam report: estimated that 70% of the country’s population live in areasrelated to natural disaster.
• Study area iscomplex including mountain and plain areas.
• Includes red River (RR), the second largest river in Viet Nam. RR is about 1,200 km containing three branch: Da, Thao, and Lo rivers
• Lies in tropical zone, 2 biggest hydro-electronic dams in South East Asia, contains a number of faults. The area effected by many type of disasters: floods, land slides, sea level rise, etc.
DaThao
Lo
2/20
Intelligent Geoportal
The Goal
-Develop the Intelligent Geoportal (IGP) concentrating on Hydro-Meteorological Data for North Vietnam.
- A Spatial Data Infrastructure (SDI) is a framework to make data available for all levels government, commercial and nonprofit sectors, users and
scientists.
- A Geoportal provides access to spatial data and associated with web service (discovery, display, editing, analysis of data).
-A spatial information infrastructure (SII) provides access to information, data from SII has been processed, organized and presented through user interface.
- An Intelligent Geoportal is geoportal that provides complex functionality through user interface for a specific application.
3
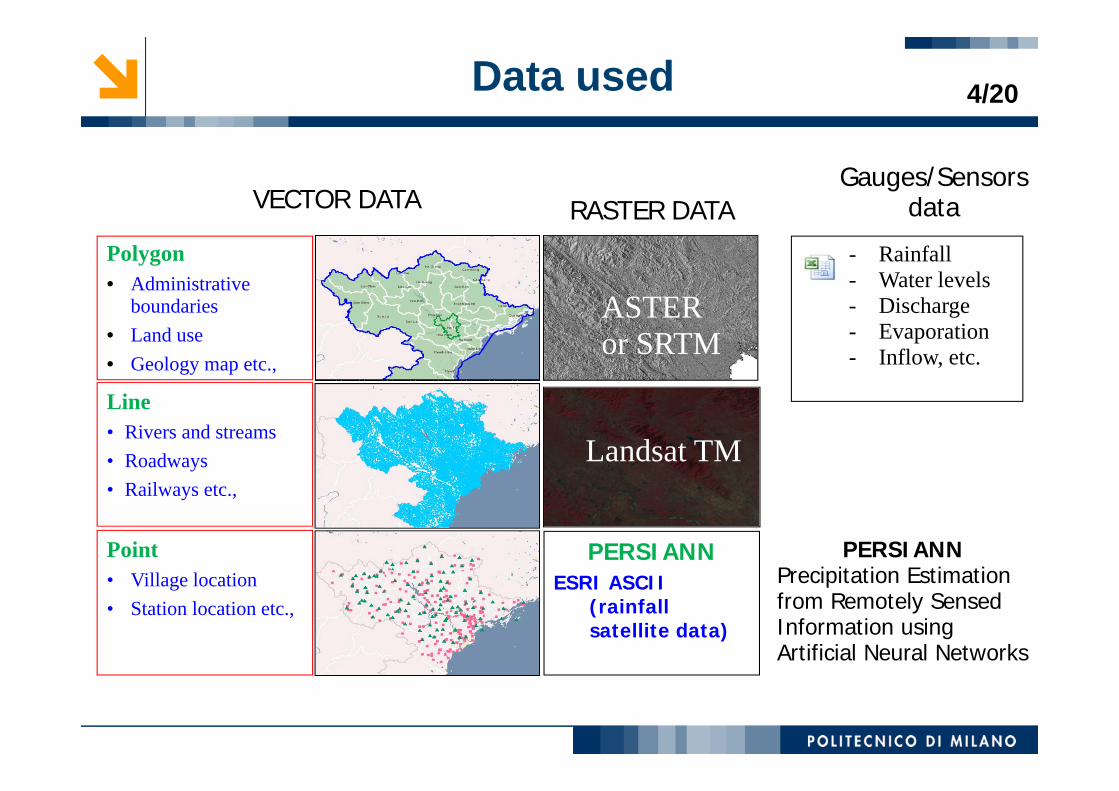
Data used
Polygon• Administrative
boundaries• Land use• Geology map etc.,
VECTOR DATA
Line• Rivers and streams• Roadways• Railways etc.,
Point• Village location• Station location etc.,
Gauges/Sensorsdata
- Rainfall- Water levels- Discharge- Evaporation- Inflow, etc.
PERSIANNESRI ASCII
(rainfall satellite data)
RASTER DATA
ASTER or SRTM
Landsat TM
PERSIANNPrecipitation Estimation from Remotely Sensed Information using Artificial Neural Networks
4/20
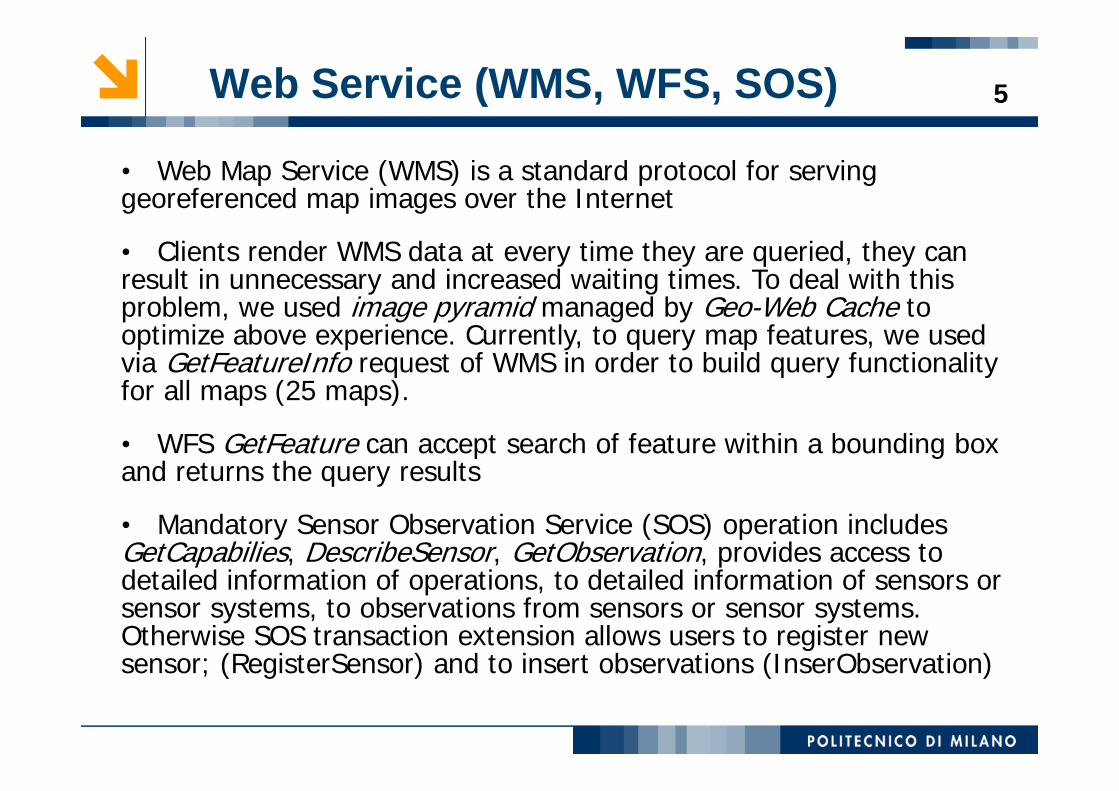
Web Service (WMS, WFS, SOS)
• Web Map Service (WMS) is a standard protocol for serving georeferenced map images over the Internet
• Clients render WMS data at every time they are queried, they can result in unnecessary and increased waiting times. To deal with this problem, we used image pyramid managed by Geo-Web Cache to optimize above experience. Currently, to query map features, we used via GetFeatureInfo request of WMS in order to build query functionality for all maps (25 maps).
• WFS GetFeature can accept search of feature within a bounding box and returns the query results
• Mandatory Sensor Observation Service (SOS) operation includes GetCapabilies, DescribeSensor, GetObservation, provides access to detailed information of operations, to detailed information of sensors or sensor systems, to observations from sensors or sensor systems. Otherwise SOS transaction extension allows users to register new sensor; (RegisterSensor) and to insert observations (InserObservation)
5
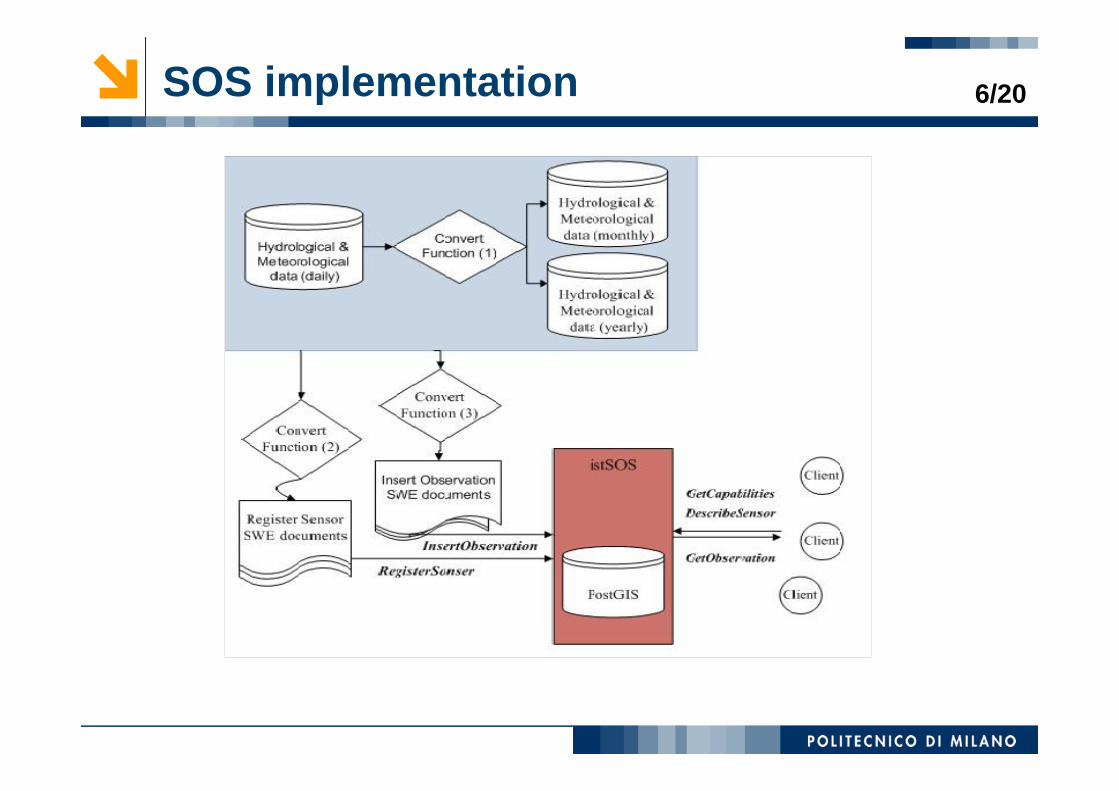
SOS implementation 6/20
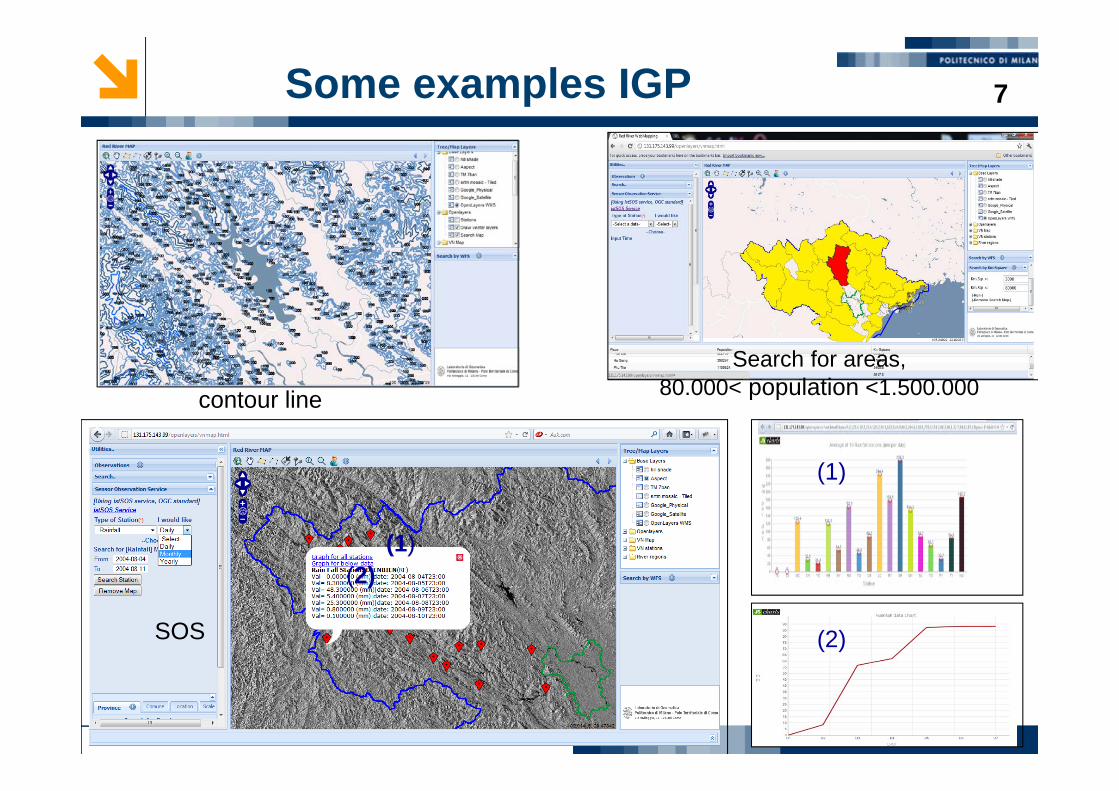
Some examples IGP
contour line
SOS
(1)(2)
(1)
(2)
Search for areas, 80.000< population <1.500.000
7
Technology and Limitation
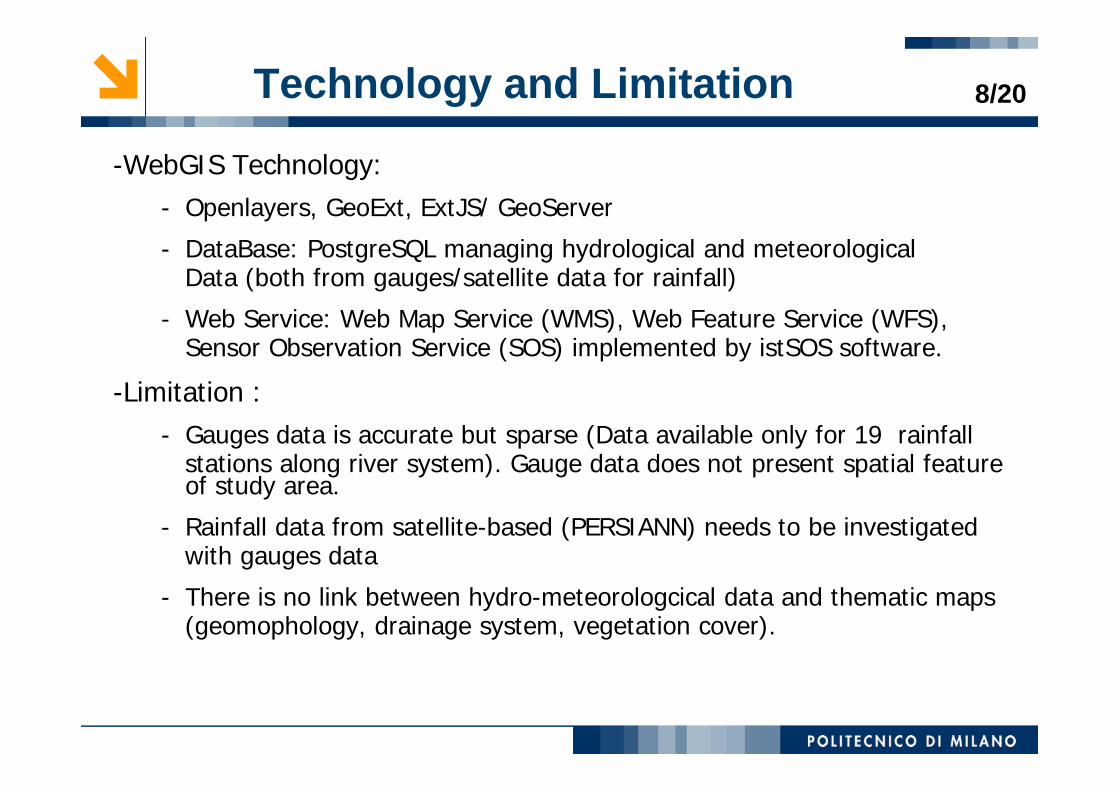
-WebGIS Technology:- Openlayers, GeoExt, ExtJS/ GeoServer
- DataBase: PostgreSQL managing hydrological and meteorological Data (both from gauges/satellite data for rainfall)
- Web Service: Web Map Service (WMS), Web Feature Service (WFS), Sensor Observation Service (SOS) implemented by istSOS software.
-Limitation : - Gauges data is accurate but sparse (Data available only for 19 rainfall
stations along river system). Gauge data does not present spatial feature of study area.
- Rainfall data from satellite-based (PERSIANN) needs to be investigated with gauges data
- There is no link between hydro-meteorologcical data and thematic maps(geomophology, drainage system, vegetation cover).
8/20
Decision Support System (DSS)-To improve WebGIS (solve previous problem and present them inWebGIS)
- To build up a web-based DSS for rainfall monitoring, the system has to make comparisons between PERSIANN and rain gauges data directly or indirectly.
- Direct comparison: analysis of correlation and percentage ofsimultaneous rain or no-rain even between PERSIANN and rain gauges;comparison of PERSIANN maps with maps obtained from rain gauge data interpolation
- Indirect comparison: analysis based on the Revised Universal Soil Loss Equation (RUSLE) model.
9

Web-Based DSS with WPS
Implemented functionalities:
• Basic Statistics
• PERSIANN Visualization
• Interpolation
• Direct comparison
• Indirect comparison (test with RUSLE)
Software for implementing WPS is ZOO-Project including ZOO-Kernel and ZOO services (ZOO configuration file .zcfg + your Code), ZOO service support many different languages (Python, Php, Java, JavaScript, etc..)
10/20
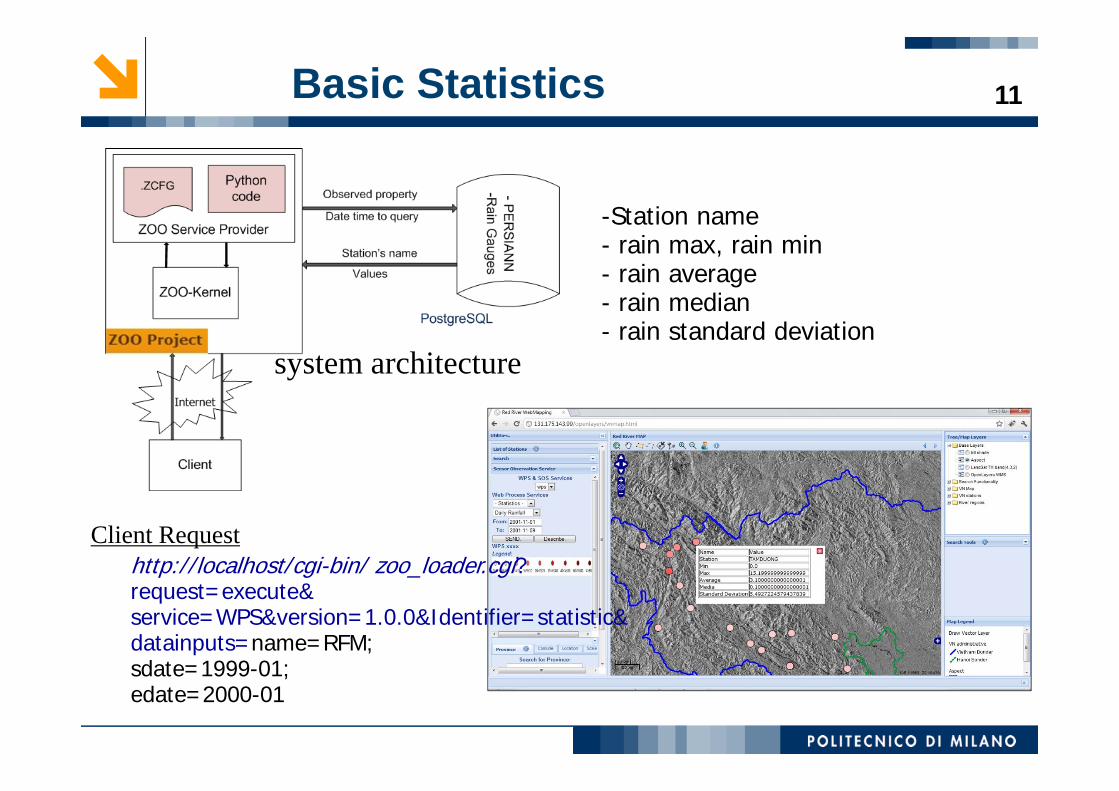
Basic Statistics
http://localhost/cgi-bin/ zoo_loader.cgi?request=execute&service=WPS&version=1.0.0&Identifier=statistic&datainputs=name=RFM;sdate=1999-01;edate=2000-01
-Station name- rain max, rain min- rain average- rain median- rain standard deviation
system architecture
11
Client Request
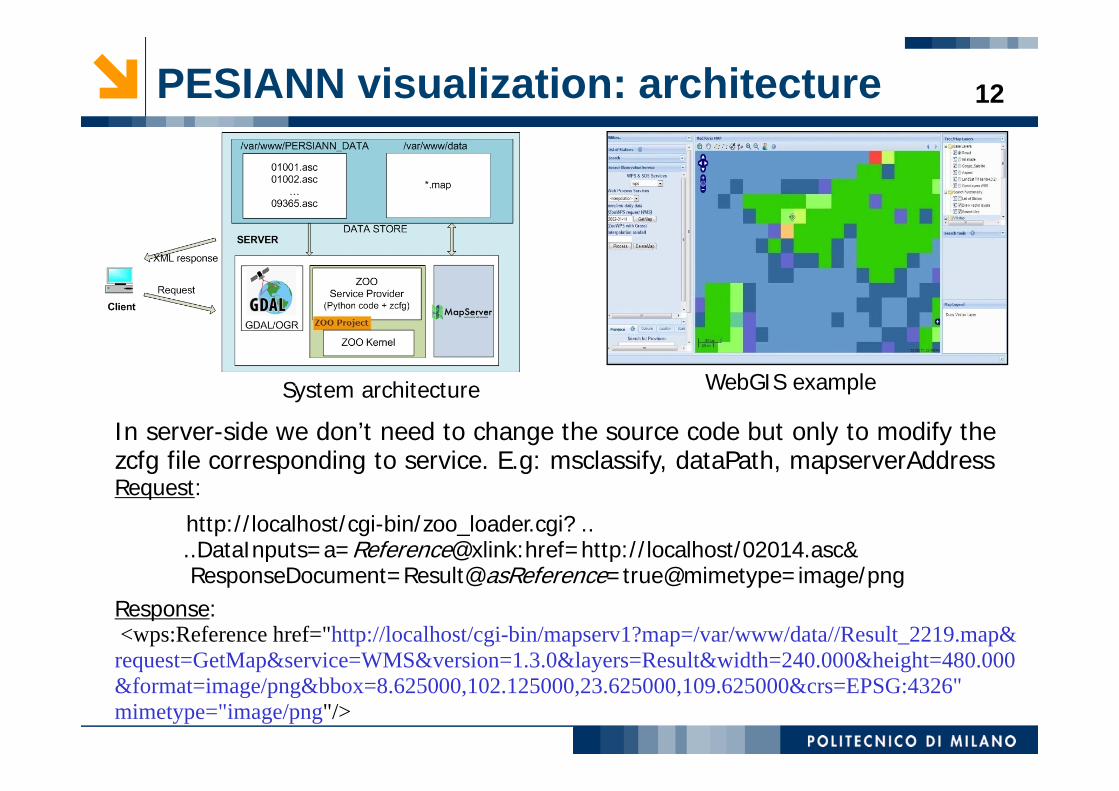
PESIANN visualization: architecture
System architecture WebGIS example
In server-side we don’t need to change the source code but only to modify the zcfg file corresponding to service. E.g: msclassify, dataPath, mapserverAddressRequest:
http://localhost/cgi-bin/zoo_loader.cgi? ....DataInputs=a=Reference@xlink:href=http://localhost/02014.asc& ResponseDocument=Result@asReference=true@mimetype=image/png
Response: <wps:Reference href="http://localhost/cgi-bin/mapserv1?map=/var/www/data//Result_2219.map&
request=GetMap&service=WMS&version=1.3.0&layers=Result&width=240.000&height=480.000&format=image/png&bbox=8.625000,102.125000,23.625000,109.625000&crs=EPSG:4326" mimetype="image/png"/>
12
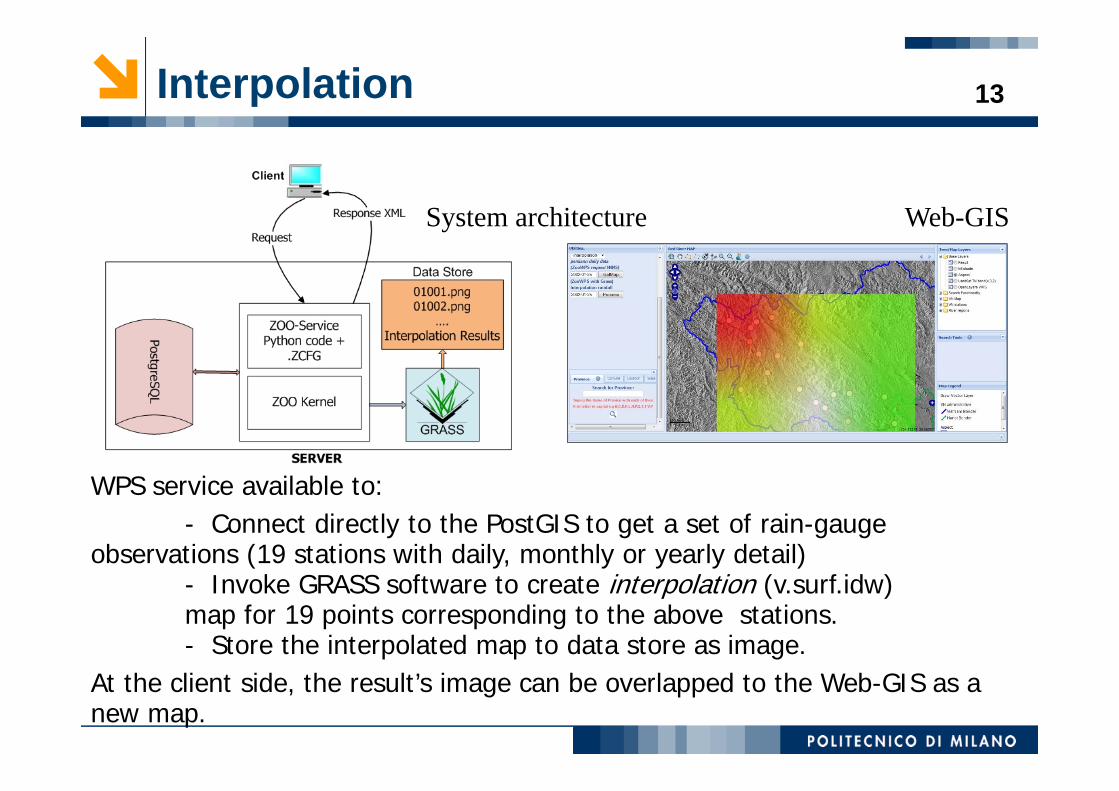
Interpolation
Web-GIS
WPS service available to: - Connect directly to the PostGIS to get a set of rain-gauge
observations (19 stations with daily, monthly or yearly detail)- Invoke GRASS software to create interpolation (v.surf.idw) map for 19 points corresponding to the above stations.- Store the interpolated map to data store as image.
At the client side, the result’s image can be overlapped to the Web-GIS as a new map.
System architecture
13
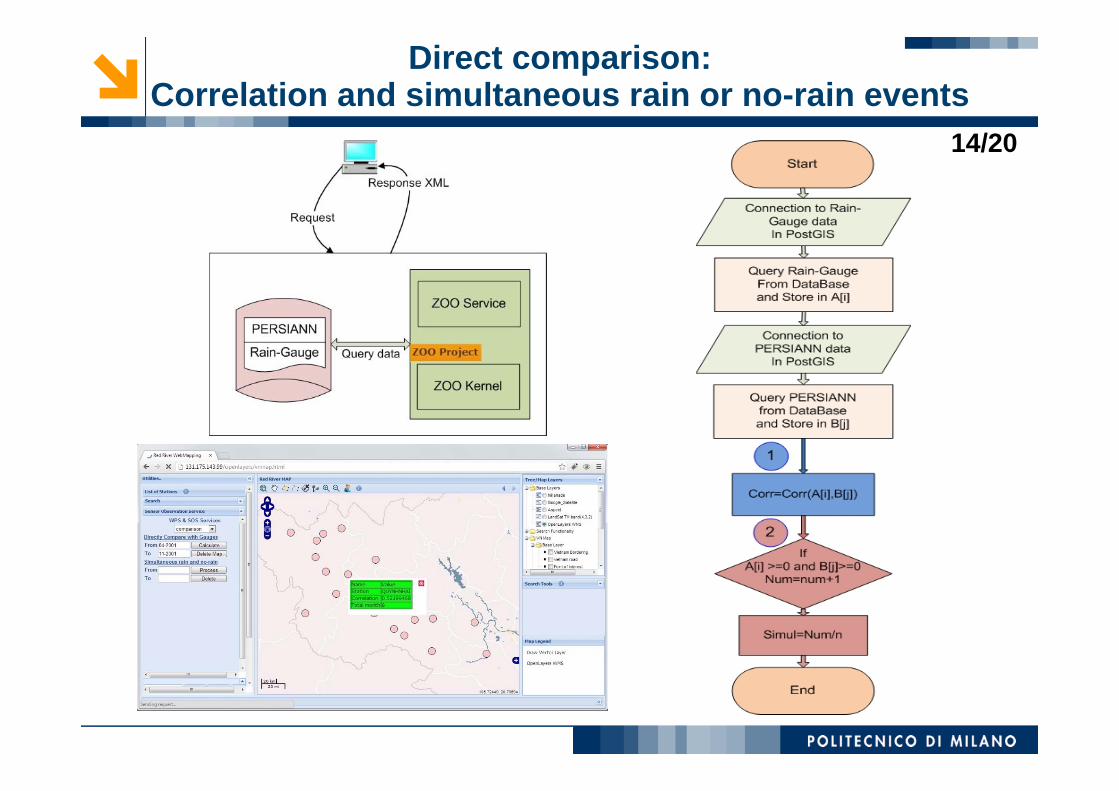
Direct comparison: Correlation and simultaneous rain or no-rain events
14/20
Indirect comparison: RUSLE
The RUSLE equation: PCSLKRA
C (Land cover factor) includes: water body, vegetation, city, etc., values = [0..0.85], digitized from Vietnam Atlas in 2004
n ]0b / b(r)[sin m 22.1] / [A(r) 1)(mLS
A(r): upslope contributing areab: slope length,m = [0.4-0.6] and n=[1-1.4]
(t.ha-1 timeUnit-1)timeUnit depend on R factor (in month or year)
K (Soil Erosion Factor) includes: fine sand, very fine sand, clay, etc,values = [0.10 to 0.42], obtained from Vietnam Atlas in 2004
P (prevention practice factor) based on the landuse and slope map.Slope classes vary from 0-5% to 50-100% , values = [0.10 to 0.33]
R (rainfall factor): can be interpolated from 2 sources PERSIANN and Rain-gauge for 19 rainfall stations.
L: slop length, S: slop steepness
15
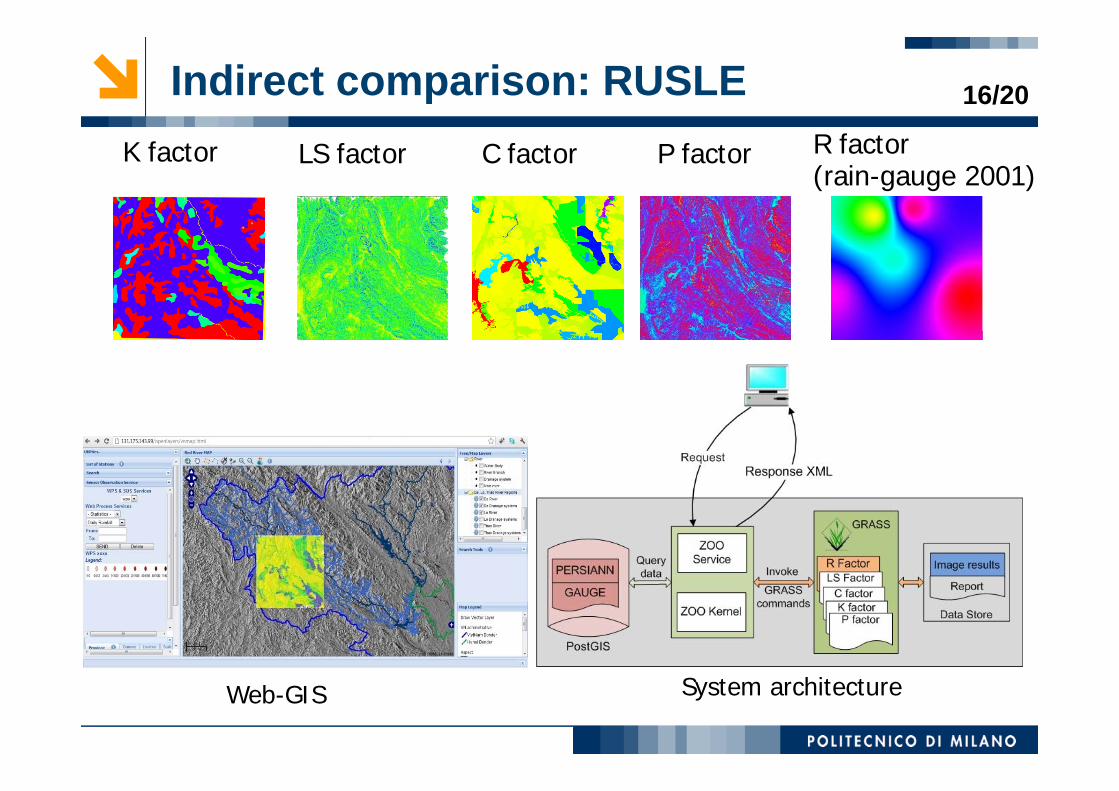
K factor LS factor C factor P factor R factor (rain-gauge 2001)
System architecture
Indirect comparison: RUSLE
Web-GIS
16/20
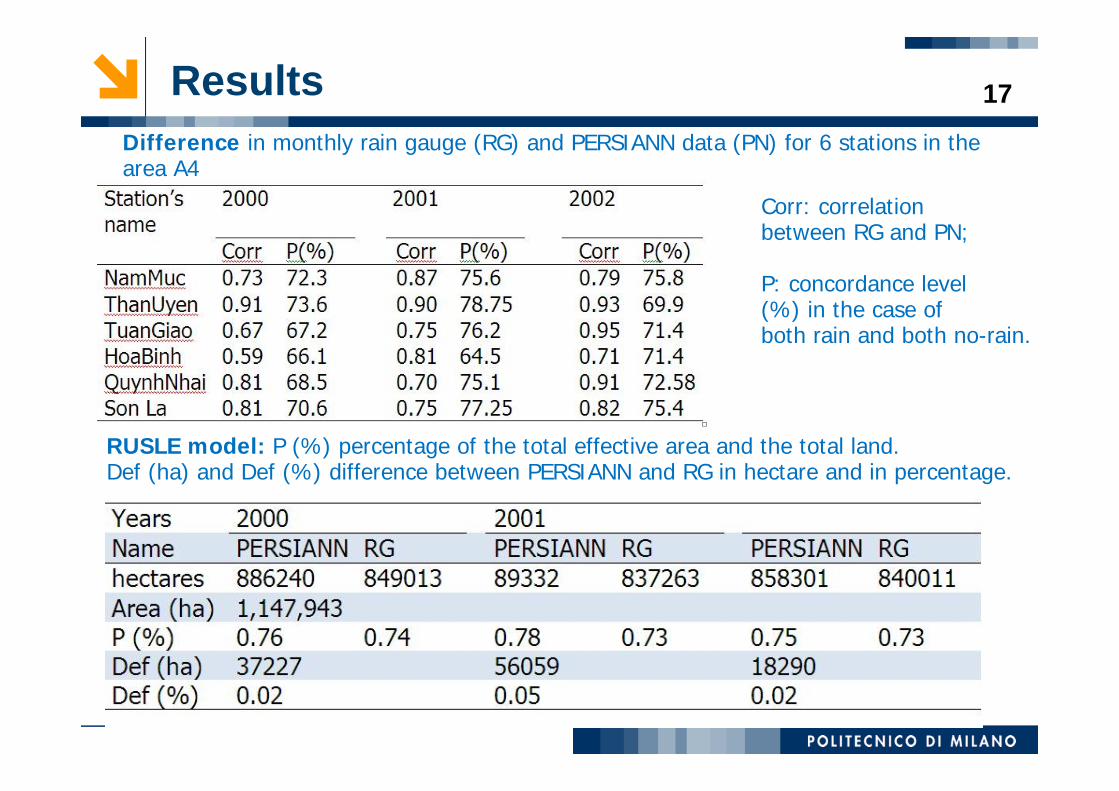
ResultsDifference in monthly rain gauge (RG) and PERSIANN data (PN) for 6 stations in the area A4
Corr: correlation between RG and PN;
P: concordance level (%) in the case of both rain and both no-rain.
RUSLE model: P (%) percentage of the total effective area and the total land.Def (ha) and Def (%) difference between PERSIANN and RG in hectare and in percentage.
17
Conclusions
The Intelligent GeoPortal makes available, besides the traditional functionalities, also tables and charts of sensor data series corresponding to long periods of time. The system also allows to register new sensors and insert observations by online/off-line
The DSS allows monitoring the accuracy of PERSIANN by means of comparisons with the RG data. The correlations in short time (daily, weekly interval) are extremely low. The visualization of PERSIANN data and interpolation’s result from RG doesn’t merge.
The correlation of month accumulation between RG and PERSIANN are strong linear relationship (e.g: in year 2002, in Tuan Giao station Corr= 0.95.
Applying RUSLE for precipitation depend on rain-gauge interpolation map or to the PERSIANN one, the difference in percentage varies from 0.02% to 0.04% bringing to a soil loss rate for the area smaller than 100 t.ha-1 year-1.
18/20

Thank you !