Embed Size (px)
Citation preview

Managing Spray Irrigation of Nutrients
John PanuskaNatural Resources Extension Specialist
Biological Systems Engineering, UW- Madison
Jim LeverichOn Farm Research Coordinator
University of Wisconsin
Wisconsin Crop Management Conference
March 17, 2013
The Manure Management Challenge
Manure is valuable for soil health and cropsProvides nitrogen, phosphorus and organic matter
Manure is a pollutant in lakes & streamsCause excessive plant growth in natural watersDeplete oxygen from natural watersA source of bacteria / pathogens
The goal is to get manure in the root zoneand keep it there . . . . .

On-Farm Water and Nutrient
Management
Measure to Manage!
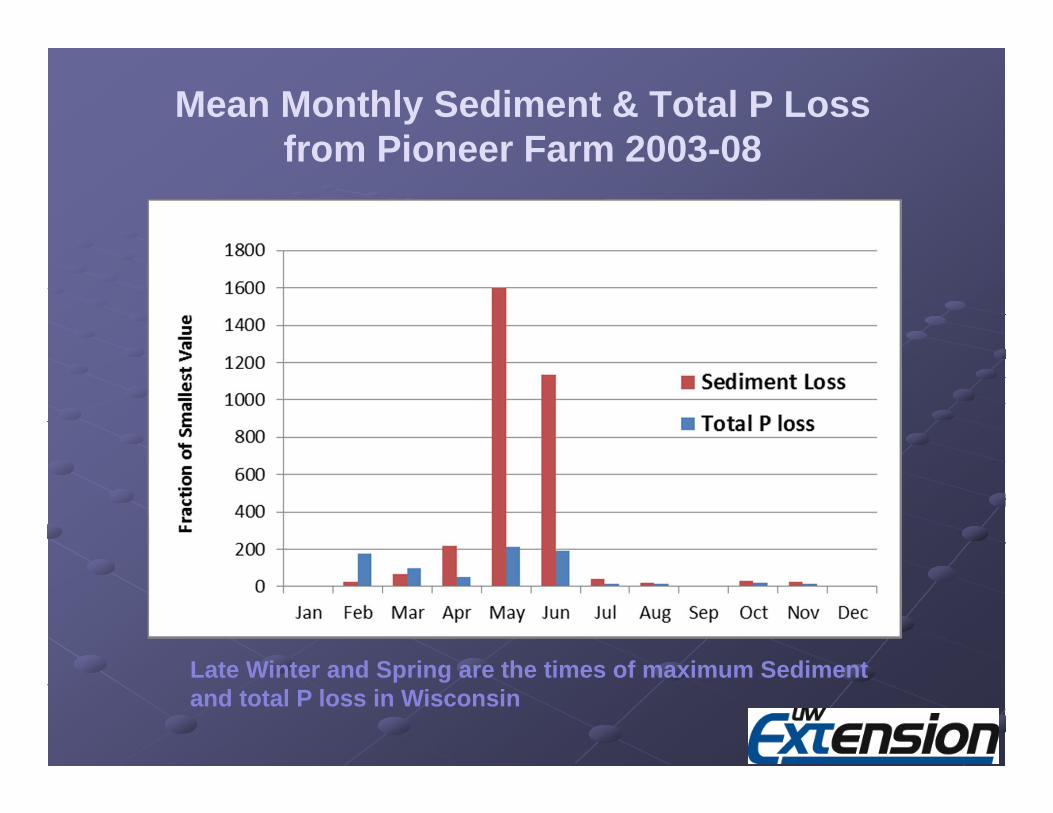
Mean Monthly Sediment & Total P Loss from Pioneer Farm 2003-08
Late Winter and Spring are the times of maximum Sediment and total P loss in Wisconsin
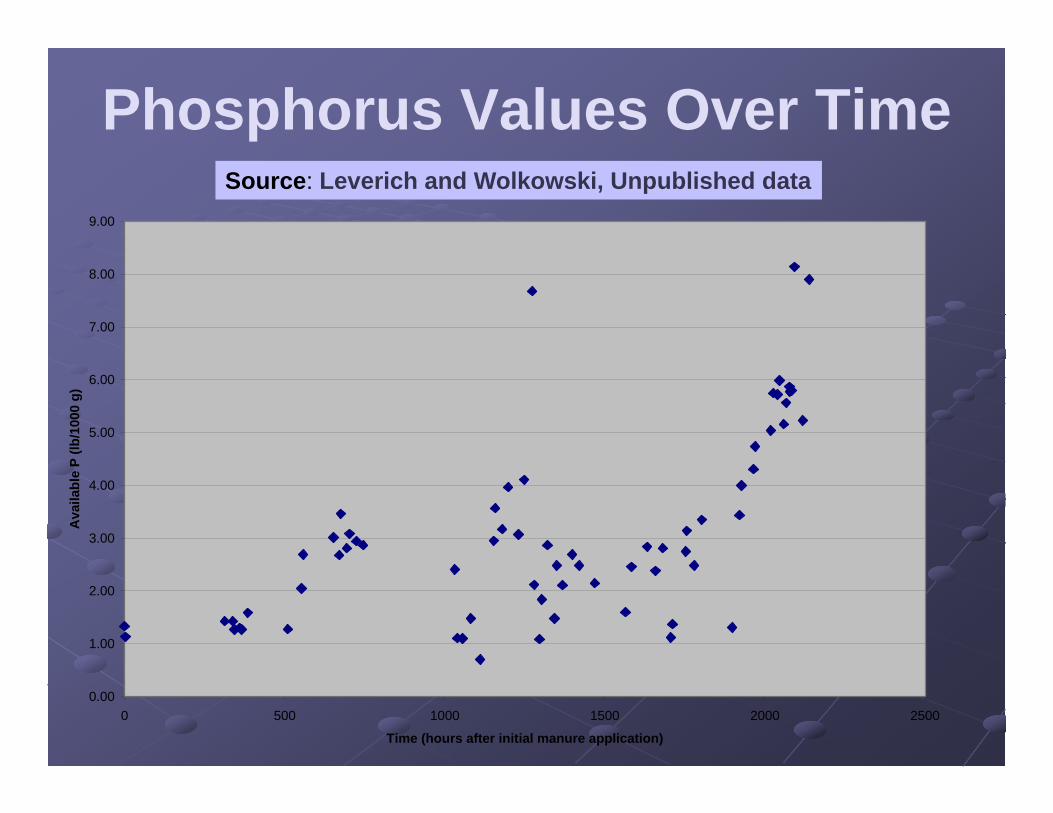
Phosphorus Values Over TimeFigure 3. Relationship between time and manure P content, 2007
0.00
1.00
2.00
3.00
4.00
5.00
6.00
7.00
8.00
9.00
0 500 1000 1500 2000 2500
Time (hours after initial manure application)
Ava
ilabl
e P
(lb/1
000
g)
Source: Leverich and Wolkowski, Unpublished data

Partition manure into high and low P fractions Apply low P fraction (permeate) on high soil test P fields High P fraction (concentrate) for low-P or distant fields
Better control of environmental impacts: More nutrient consistency for better nutrient management.
Distribute nutrients over full growing season, in small doses via “fertigation” with high N/low P liquid fraction
versuslarge single quantities at potentially risky Spring and Fall periods
Less over-the-road manure hauling Fewer lagoons needed
Manure Processing (Separation) Can Reduce This Environmental Risk
Manure Separation
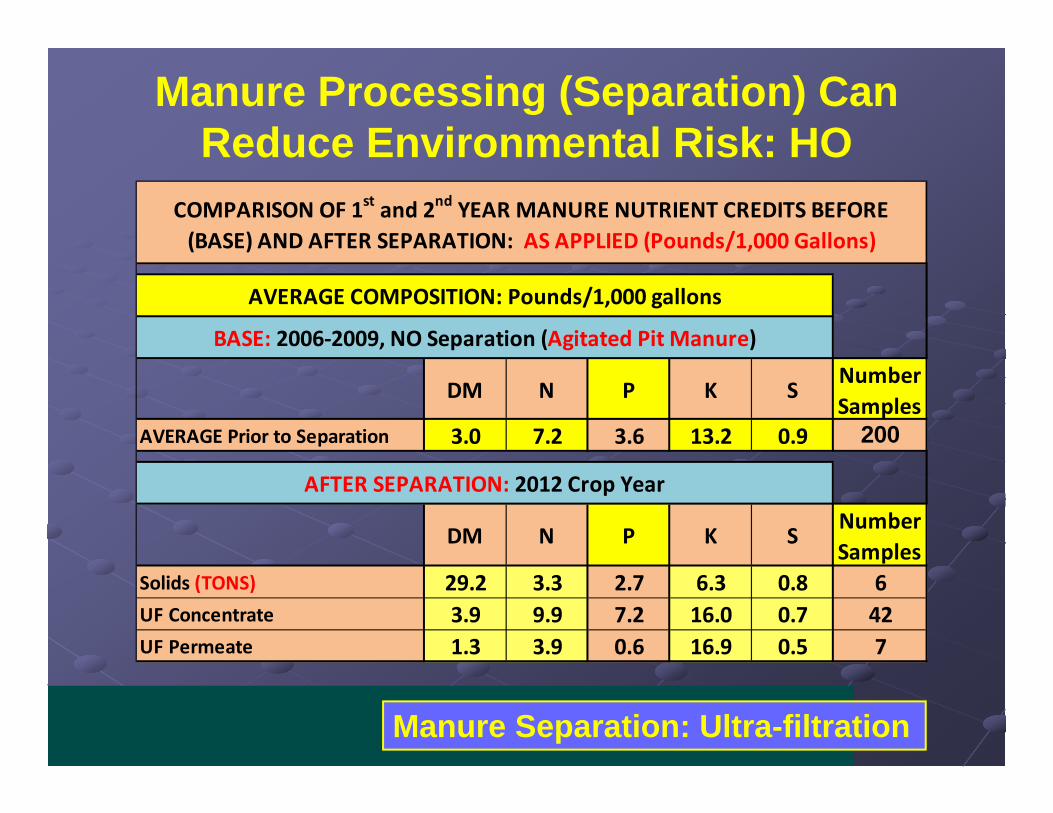
Manure Processing (Separation) Can Reduce Environmental Risk: HO
Manure Separation: Ultra-filtration
DM N P K SNumber Samples
AVERAGE Prior to Separation 3.0 7.2 3.6 13.2 0.9 200
DM N P K S Number Samples
Solids (TONS) 29.2 3.3 2.7 6.3 0.8 6UF Concentrate 3.9 9.9 7.2 16.0 0.7 42UF Permeate 1.3 3.9 0.6 16.9 0.5 7
COMPARISON OF 1st and 2nd YEAR MANURE NUTRIENT CREDITS BEFORE (BASE) AND AFTER SEPARATION: AS APPLIED (Pounds/1,000 Gallons)
AFTER SEPARATION: 2012 Crop Year
BASE: 2006‐2009, NO Separation (Agitated Pit Manure)
AVERAGE COMPOSITION: Pounds/1,000 gallons

Manure Processing (Separation) Can Reduce Environmental Risk: HO
Manure Separation: Ultra-filtration
DM N P K SNumber Samples
AVERAGE Prior to Separation 39% 20% 51% 29% 42% 200
DM N P K SNumber Samples
Solids (TONS) 4% 12% 21% 9% 35% 6UF Concentrate 13% 19% 19% 15% 32% 42UF Permeate 11% 5% 22% 9% 34% 7
AFTER SEPARATION: 2012 Crop Year
COMPARISON OF 1st and 2nd YEAR MANURE NUTRIENT CREDITS BEFORE (BASE) AND AFTER SEPARATION: AS APPLIED (Pounds/1,000 Gallons)
COEFFICIENT of VARIATION (CV): % of AVERAGE
BASE: 2006‐2009, NO Separation (Agitated Pit Manure)
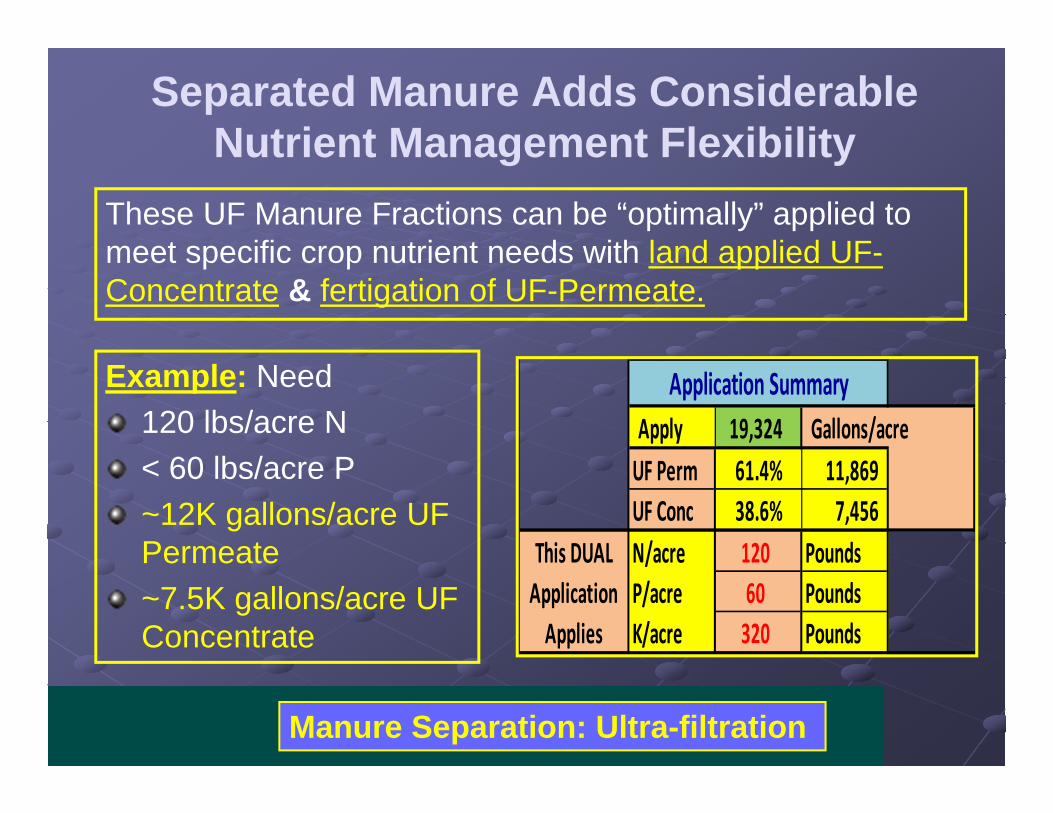
Example: Need120 lbs/acre N< 60 lbs/acre P~12K gallons/acre UF Permeate~7.5K gallons/acre UF Concentrate
Separated Manure Adds Considerable Nutrient Management Flexibility
Manure Separation: Ultra-filtration
Apply 19,324 Gallons/acreUF Perm 61.4% 11,869 UF Conc 38.6% 7,456 N/acre 120 PoundsP/acre 60 PoundsK/acre 320 Pounds
Application Summary
This DUAL Application Applies
These UF Manure Fractions can be “optimally” applied to meet specific crop nutrient needs with land applied UF-Concentrate & fertigation of UF-Permeate.

Mechanical Solids Separation
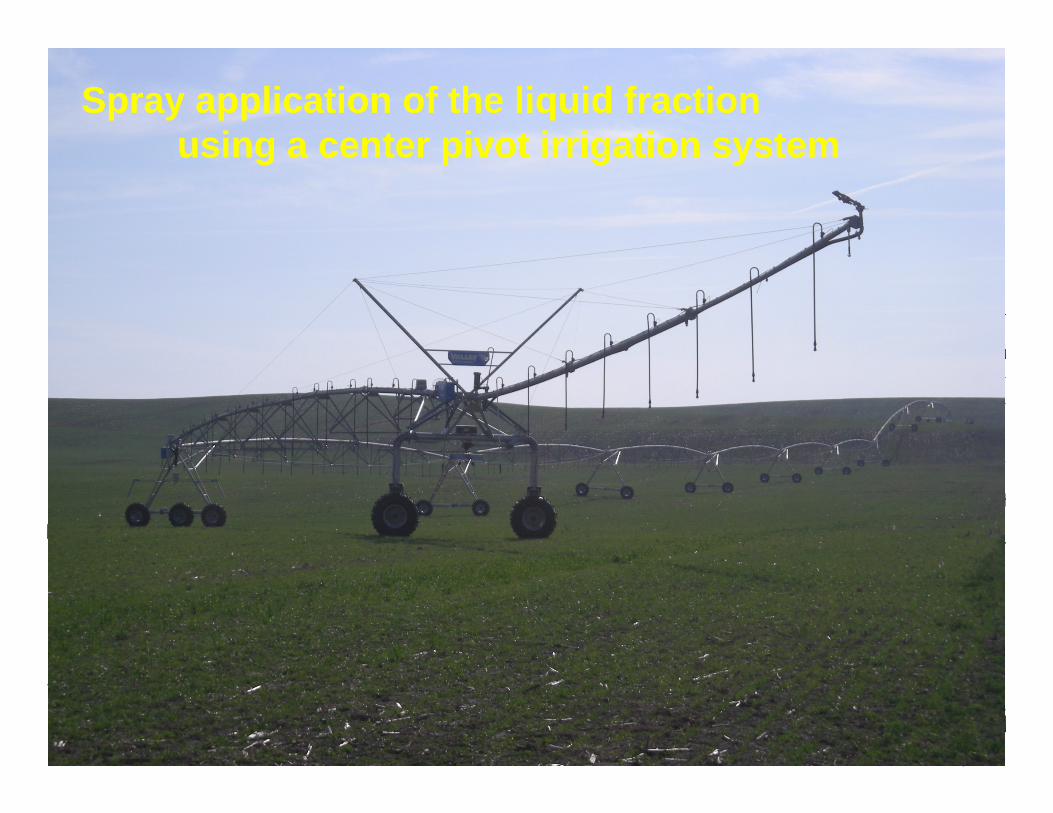
Spray application of the liquid fraction using a center pivot irrigation system
Plant root zone
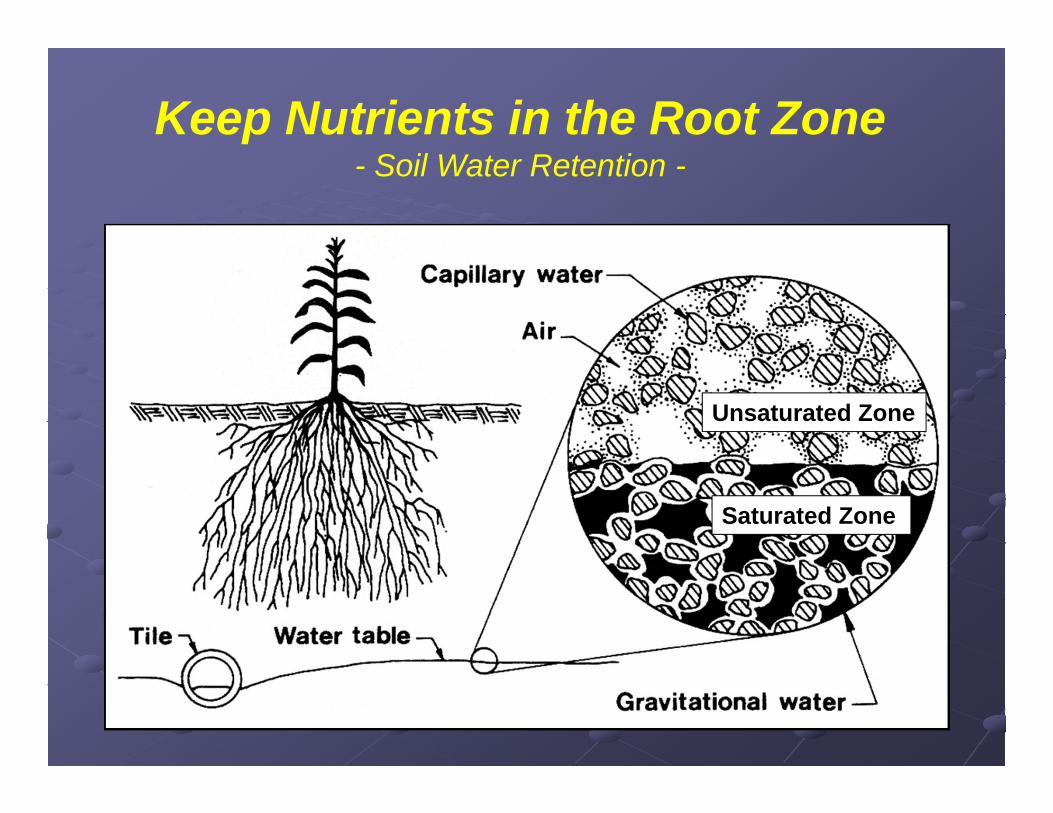
Keep Nutrients in the Root Zone- Soil Water Retention -
Unsaturated Zone
Saturated Zone

23214453Clay
20204051Silty clay
18183649Clay loam
17143147Loam
1292143Sandy Loam
871538Sandy
TotalAvailable Water(% by volume)
PermanentWilting Point
(% by volume)Field Capacity(% by volume)
Total Pore Space
(% by volume)Soil Texture
23214453Clay
20204051Silty clay
18183649Clay loam
17143147Loam
1292143Sandy Loam
871538Sandy
TotalAvailable Water(% by volume)
PermanentWilting Point
(% by volume)Field Capacity(% by volume)
Total Pore Space
(% by volume)Soil Texture
Keep Nutrients in the Root Zone- Soil Water Retention -

Keep Nutrients in the Root Zone- Plant Water Removal Pattern -
The effective root depth is that portion of the root zone where the crop extracts the majority of its water
Deep Probe
Shallow Probe
40% Zone
D E
P T
H
30%
20%
10
Deep Probe
D/4
D/4
D/4
D/4
Plant Water Removal
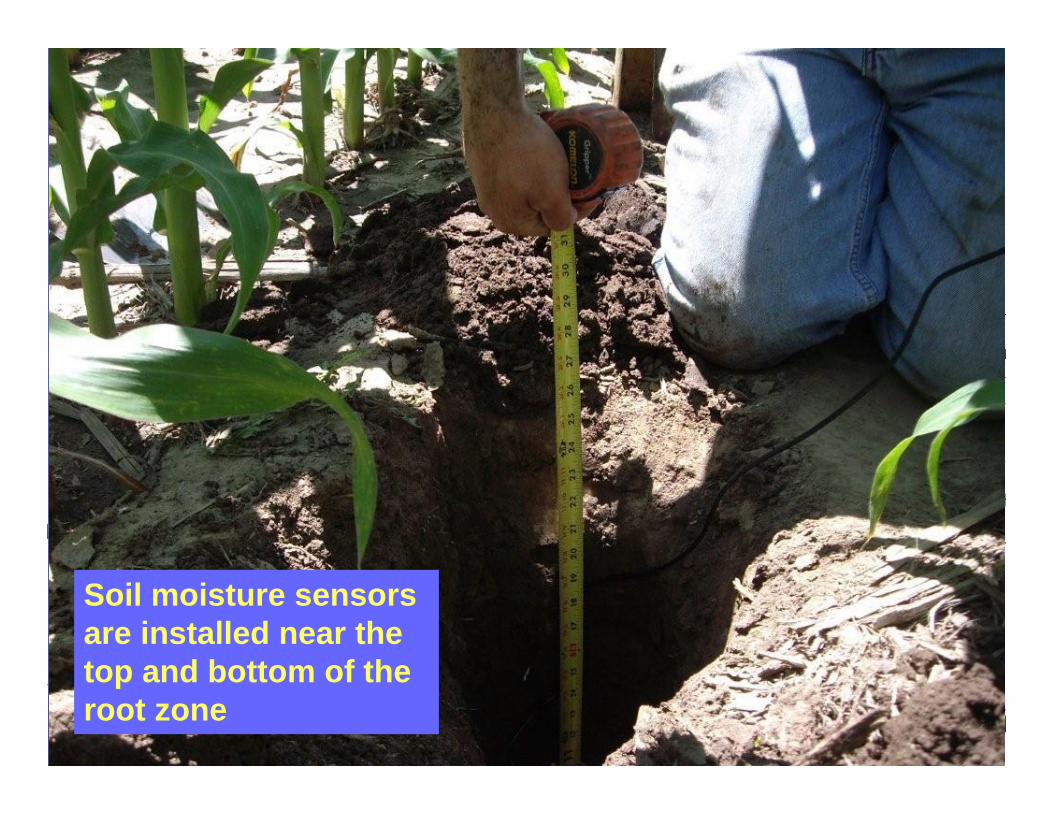
Soil moisture sensors are installed near the top and bottom of theroot zone
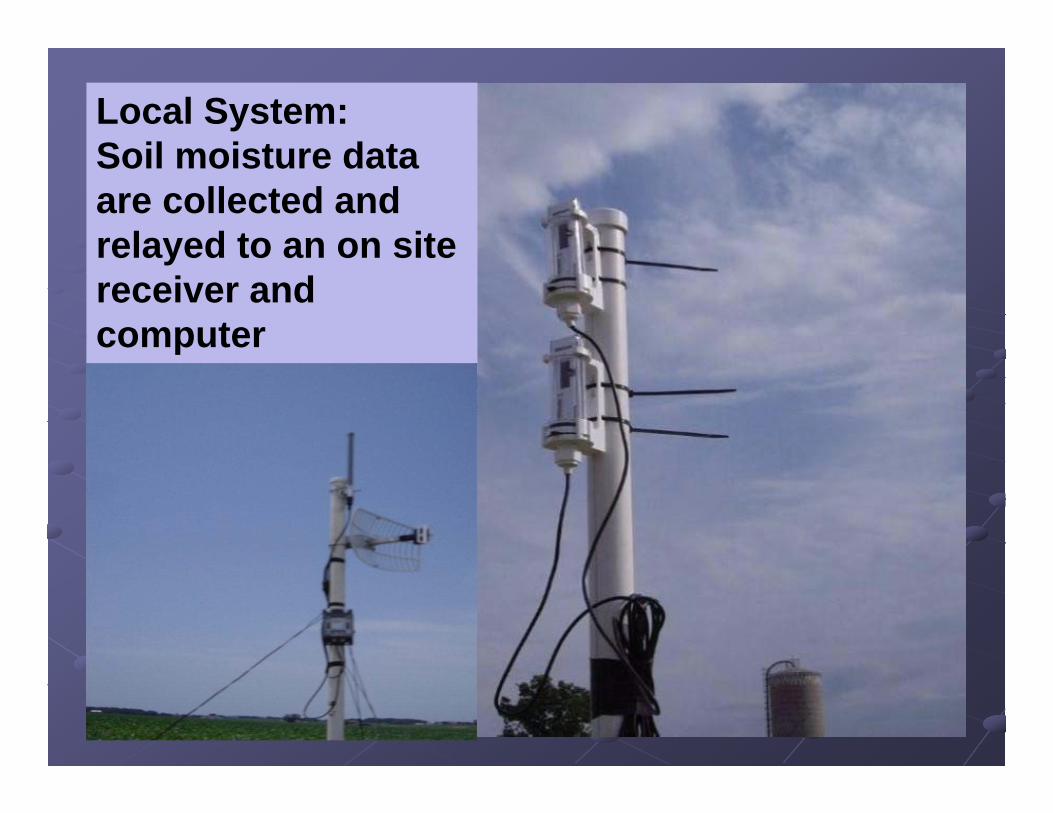
Local System:Soil moisture data are collected and relayed to an on site receiver and computer
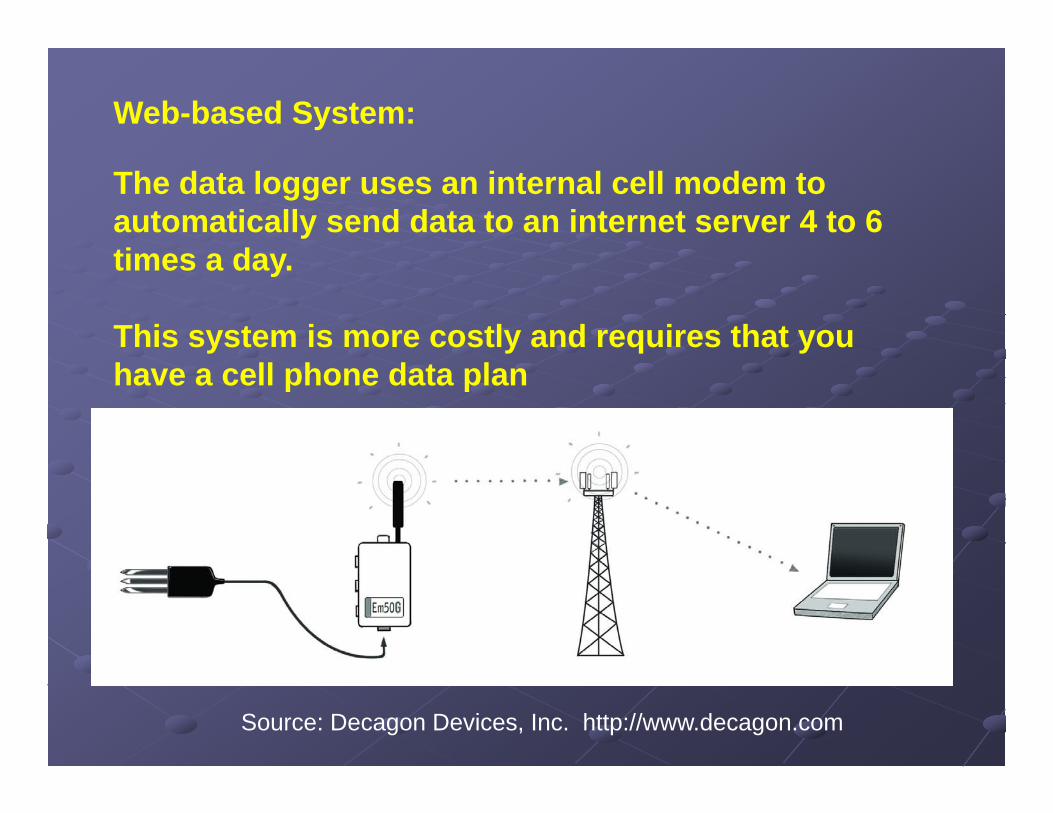
Web-based System:
The data logger uses an internal cell modem to automatically send data to an internet server 4 to 6 times a day.
This system is more costly and requires that you have a cell phone data plan
Source: Decagon Devices, Inc. http://www.decagon.com
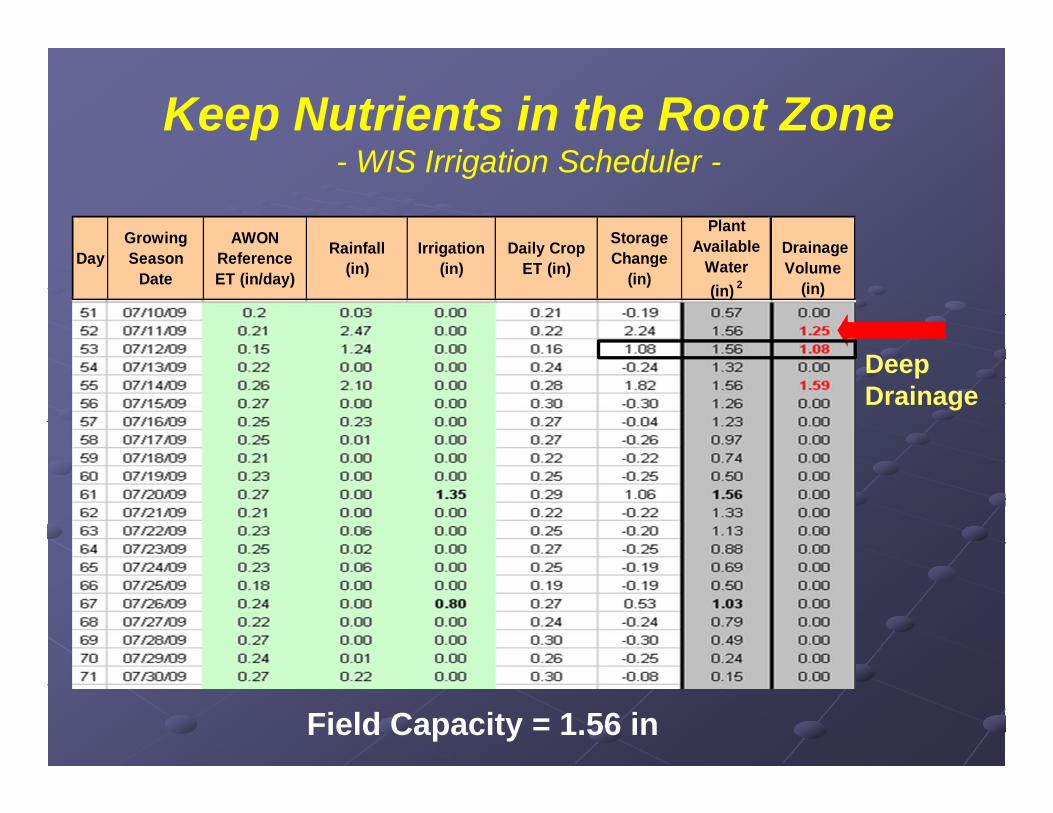
Keep Nutrients in the Root Zone- WIS Irrigation Scheduler -
DayGrowing Season
Date
AWON Reference ET (in/day)
Rainfall (in)
Irrigation (in)
Daily Crop ET (in)
Storage Change
(in)
Plant Available
Water (in) 2
Drainage Volume
(in)
Deep Drainage
Field Capacity = 1.56 in
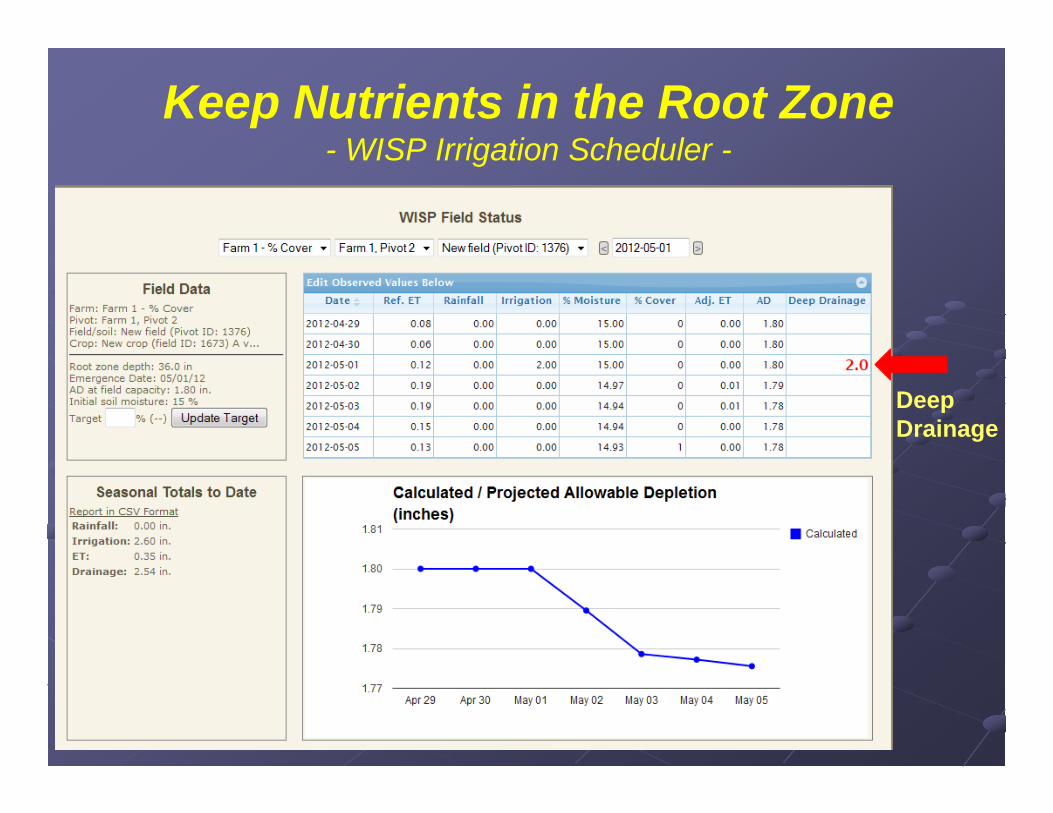
Keep Nutrients in the Root Zone- WISP Irrigation Scheduler -
Deep Drainage
Keep Nutrients in the Root Zone- WISP Irrigation Scheduler -
The Wisconsin Irrigation Scheduler (WIS) Excel spreadsheet is available at:
http://bse.wisc.edu/John_Panuska.htm
The Wisconsin Irrigation Scheduling Program (WISP) web-based tool is available at:
http://wisp.cals.wisc.edu/
QUESTIONS