Embed Size (px)
Citation preview

MANAJEMEN PROYEK

DEFINING THE PROJECT
08/10/2014 2Manajemen Industri Teknologi
Informasi - Ganjil 2012

Where We Are Now
4–3

Defining the Project
08/10/2014 Manajemen Industri Teknologi Informasi - Ganjil 2012 4
Step 1• Defining the Project Scope
Step 2• Establishing Project Priorities
Step 3• Creating the Work Breakdown Structure
Step 4• Integrating the WBS with the Organization
Step 5• Coding the WBS for the Information System
Step 1: Defining the Project Scope
08/10/2014 Manajemen Industri Teknologi Informasi - Ganjil 2012 5
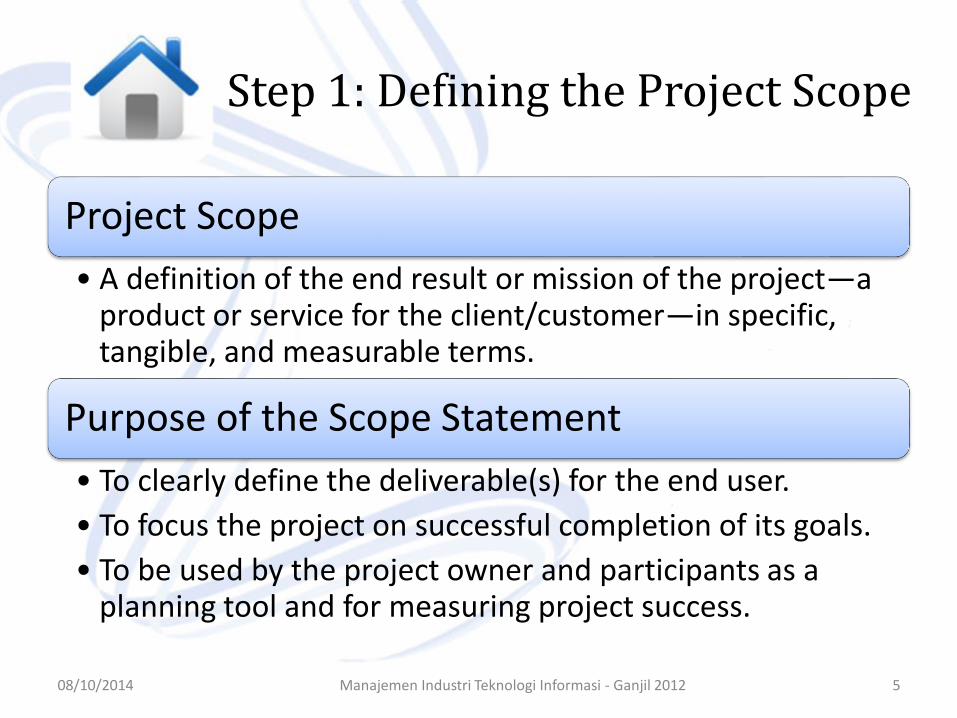
Project Scope
• A definition of the end result or mission of the project—a product or service for the client/customer—in specific, tangible, and measurable terms.
Purpose of the Scope Statement
• To clearly define the deliverable(s) for the end user.
• To focus the project on successful completion of its goals.
• To be used by the project owner and participants as a planning tool and for measuring project success.

Project Scope Checklist
08/10/2014 Manajemen Industri Teknologi Informasi - Ganjil 2012 6
Project objective
Deliverables
Milestones
Technical requirements
Limits and exclusions
Reviews with customer

Project Scope: Terms and Definitions
08/10/2014 Manajemen Industri Teknologi Informasi - Ganjil 2012 7
• Also called statements of work (SOW)Scope
Statements
• Can contain an expanded version of scope statement
• A document authorizing the project manager to initiate and lead the project.
Project Charter
• The tendency for the project scope to expand over time due to changing requirements, specifications, and priorities.
Scope Creep

Step 2: Establishing Project Priorities
08/10/2014 Manajemen Industri Teknologi Informasi - Ganjil 2012 8
Causes of Project Trade-offs
• Shifts in the relative importance of criterions related to cost, time, and performance parameters
• Budget–Cost
• Schedule–Time
• Performance–Scope
Managing the Priorities of Project Trade-offs
• Constrain: a parameter is a fixed requirement.
• Enhance: optimizing a parameter over others.
• Accept: reducing (or not meeting) a parameter requirement.

Project Management Trade-offs
4–9
FIGURE 4.1

Project Priority Matrix
08/10/2014 Manajemen Industri Teknologi Informasi - Ganjil 2012 10
Step 3: Creating the Work Breakdown Structure
08/10/2014 Manajemen Industri Teknologi Informasi - Ganjil 2012 11
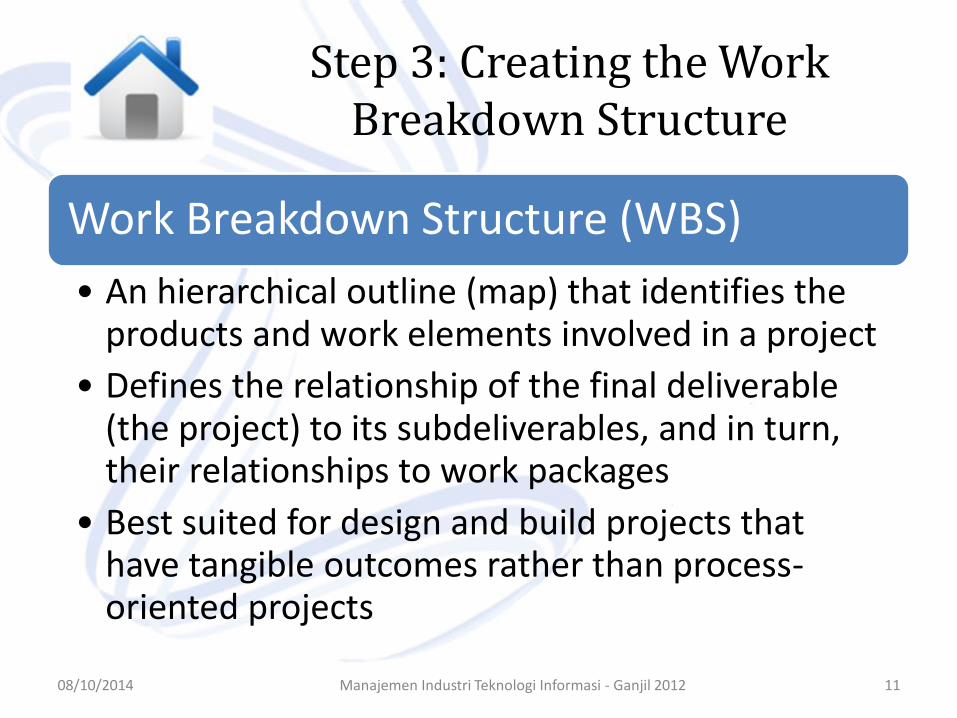
Work Breakdown Structure (WBS)
• An hierarchical outline (map) that identifies the products and work elements involved in a project
• Defines the relationship of the final deliverable (the project) to its subdeliverables, and in turn, their relationships to work packages
• Best suited for design and build projects that have tangible outcomes rather than process-oriented projects
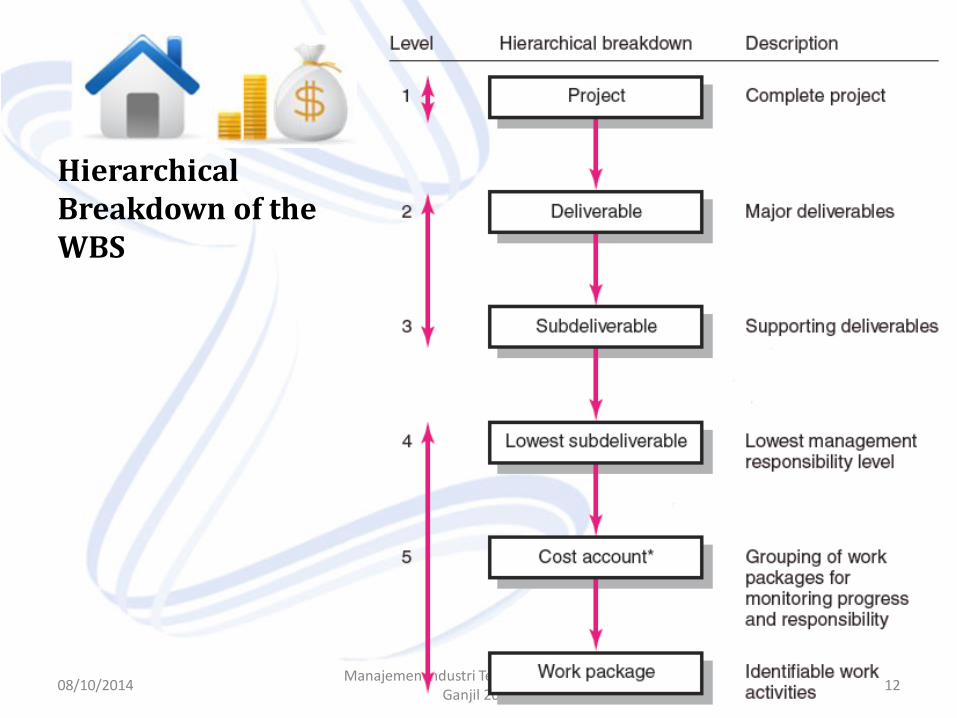
Hierarchical Breakdown of the WBS
08/10/2014Manajemen Industri Teknologi Informasi -
Ganjil 201212

How WBS Helps the Project Manager
08/10/2014 Manajemen Industri Teknologi Informasi - Ganjil 2012 13
Facilitates evaluation of cost, time, and technical performance of the organization on a project
Provides management with information appropriate to each organizational level
Helps in the development of the organization breakdown structure (OBS), which assigns project responsibilities to organizational units and individuals
Helps manage plan, schedule, and budget
Defines communication channels and assists in coordinating the various project elements

Work Breakdown Structure
08/10/2014 Manajemen Industri Teknologi Informasi - Ganjil 2012 14

Work PackagesIs the Lowest Level of the WBS.
08/10/2014 Manajemen Industri Teknologi Informasi - Ganjil 2012 15
It is output-oriented in that it:
• Defines work (what)
• Identifies time to complete a work package (how long)
• Identifies a time-phased budget to complete a work package (cost)
• Identifies resources needed to complete a work package (how much)
• Identifies a single person responsible for units of work (who)

Step 4: Integrating the WBS with the Organization
08/10/2014 Manajemen Industri Teknologi Informasi - Ganjil 2012 16
Organizational Breakdown Structure (OBS)
• Depicts how the firm is organized to discharge its work responsibility for a project
• Provides a framework to summarize organization work unit performance
• Identifies organization units responsible for work packages
• Ties the organizational units to cost control accounts
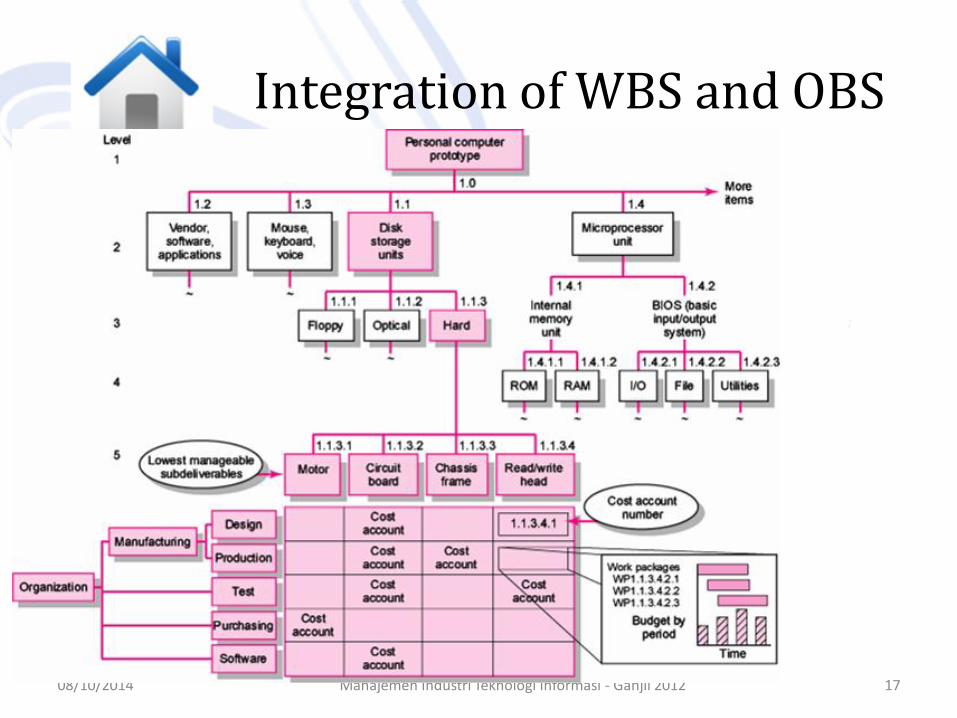
Integration of WBS and OBS
08/10/2014 Manajemen Industri Teknologi Informasi - Ganjil 2012 17

Step 5: Coding the WBS for the Information System
08/10/2014 Manajemen Industri Teknologi Informasi - Ganjil 2012 18
WBS Coding System
• Defines:
• Levels and elements of the WBS
• Organization elements
• Work packages
• Budget and cost information
• Allows reports to be consolidated at any level in the organization structure

WBS Coding
08/10/2014 Manajemen Industri Teknologi Informasi - Ganjil 2012 19

Process Breakdown Structure
08/10/2014 Manajemen Industri Teknologi Informasi - Ganjil 2012 20
Process-Oriented Projects
• Are driven by performance requirements in which the final outcome is the product of a series of steps of phases in which one phase affects the next phase
Process Breakdown Structure (PBS)
• Defines deliverables as outputs required to move to the next phase
• Checklists for managing PBS:
• Deliverables needed to exit one phase and begin the next
• Quality checkpoints for complete and accurate deliverables
• Sign-offs by responsible stakeholders to monitor progress

PBS for Software Project Development
08/10/2014 Manajemen Industri Teknologi Informasi - Ganjil 2012 21

Responsibility Matrices
08/10/2014 Manajemen Industri Teknologi Informasi - Ganjil 2012 22
Responsibility Matrix (RM)
• Also called a linear responsibility chart
• Summarizes the tasks to be accomplished and who is responsible for what on the project
• Lists project activities and participants
• Clarifies critical interfaces between units and individuals that need coordination
• Provide an means for all participants to view their responsibilities and agree on their assignments
• Clarifies the extent or type of authority that can be exercised by each participant

Responsibility Matrix for a Market Research Project
08/10/2014 Manajemen Industri Teknologi Informasi - Ganjil 2012 23
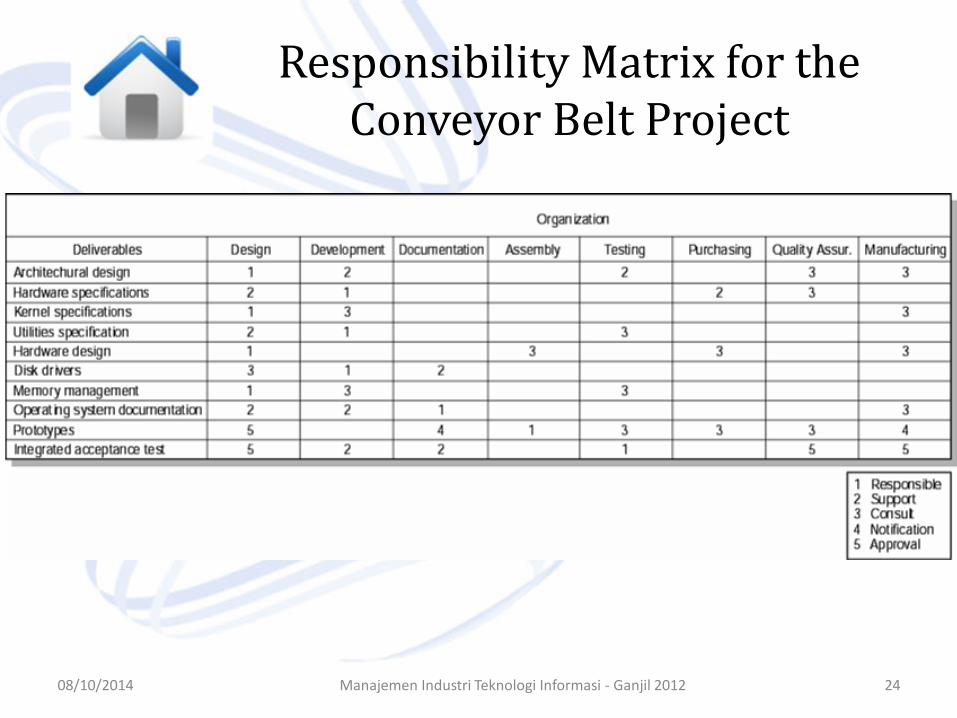
Responsibility Matrix for the Conveyor Belt Project
08/10/2014 Manajemen Industri Teknologi Informasi - Ganjil 2012 24

Project Communication Plan
08/10/2014 Manajemen Industri Teknologi Informasi - Ganjil 2012 25
What information needs to be collected and when?
Who will receive information?
What information methods will be used?
What are the access restrictions?
When will information be communicated?
How will information be communicated?

Information Needs
• Project status reports
• Deliverable issues
• Changes in scope
• Team status meetings
• Gating decisions
• Accepted request changes
• Action items
• Milestone reports
4–26

Developing a Communication Plan
1. Stakeholder analysis
2. Information needs
3. Sources of information
4. Dissemination modes
5. Responsibility and timing
4–27

Communication Plan:
08/10/2014 Manajemen Industri Teknologi Informasi - Ganjil 2012 28

ESTIMATING PROJECT TIMES AND COSTS

Where We Are Now
5–30

Estimating Projects
Estimating
• The process of forecasting or approximating the time and cost of completing project deliverables.
• The task of balancing expectations of stakeholders and need for control while the project is implemented.
Types of Estimates
• Top-down (macro) estimates: analogy, group consensus, or mathematical relationships
• Bottom-up (micro) estimates: estimates of elements of the work breakdown structure
5–31

Why Estimating Time and Cost Are Important
To support good decisions.
To schedule work.
To determine how long the project should take and its cost.
To determine whether the project is worth doing.
To develop cash flow needs.
To determine how well the project is progressing.
To develop time-phased budgets and establish the project baseline.

5–33
Factors Influencing the Quality of Estimates
Quality of Estimates
ProjectDuration
People
Project Structure and Organization
PaddingEstimates
OrganizationCulture
Other (Nonproject)
Factors
Planning Horizon

Estimating Guidelines for Times, Costs, and Resources
Have people familiar with the tasks make the estimate.
Use several people to make estimates.
Base estimates on normal conditions, efficient methods, and a normal level of resources.
Use consistent time units in estimating task times.
Treat each task as independent, don’t aggregate.
Don’t make allowances for contingencies.
Adding a risk assessment helps avoid surprises to stakeholders.
5–34

Top-Down versus Bottom-Up Estimating
Top-Down Estimates
• Are usually are derived from someone who uses experience and/or information to determine the project duration and total cost.
• Are made by top managers who have little knowledge of the processes used to complete the project.
Bottom-Up Approach
• Can serve as a check on cost elements in the WBS by rolling up the work packages and associated cost accounts to major deliverables at the work package level.
5–35
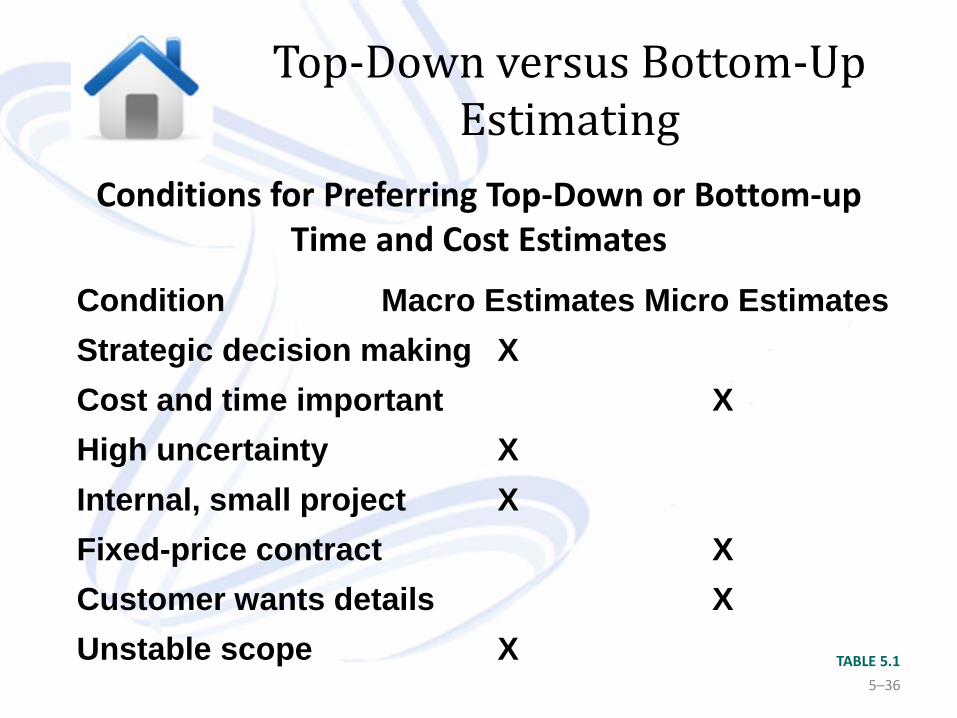
Top-Down versus Bottom-Up Estimating
5–36
TABLE 5.1
Conditions for Preferring Top-Down or Bottom-up Time and Cost Estimates
Condition Macro Estimates Micro Estimates
Strategic decision making X
Cost and time important X
High uncertainty X
Internal, small project X
Fixed-price contract X
Customer wants details X
Unstable scope X

Estimating Projects: Preferred Approach
Make rough top-down estimates.
Develop the WBS/OBS.
Make bottom-up estimates.
Develop schedules and budgets.
Reconcile differences between top-down and bottom-up estimates
5–37

Top-Down Approaches for Estimating Project Times and Costs
Consensus methods
Ratio methods
Apportion method
Function point methods for software and system projects
Learning curves
5–38
Project Estimate
Times
Costs

Apportion Method of Allocating Project Costs Using the Work Breakdown Structure

Simplified Basic Function Point Count Process for a Prospective Project or Deliverable
5–40
TABLE 5.2

5–41
Example: Function Point Count Method
TABLE 5.3
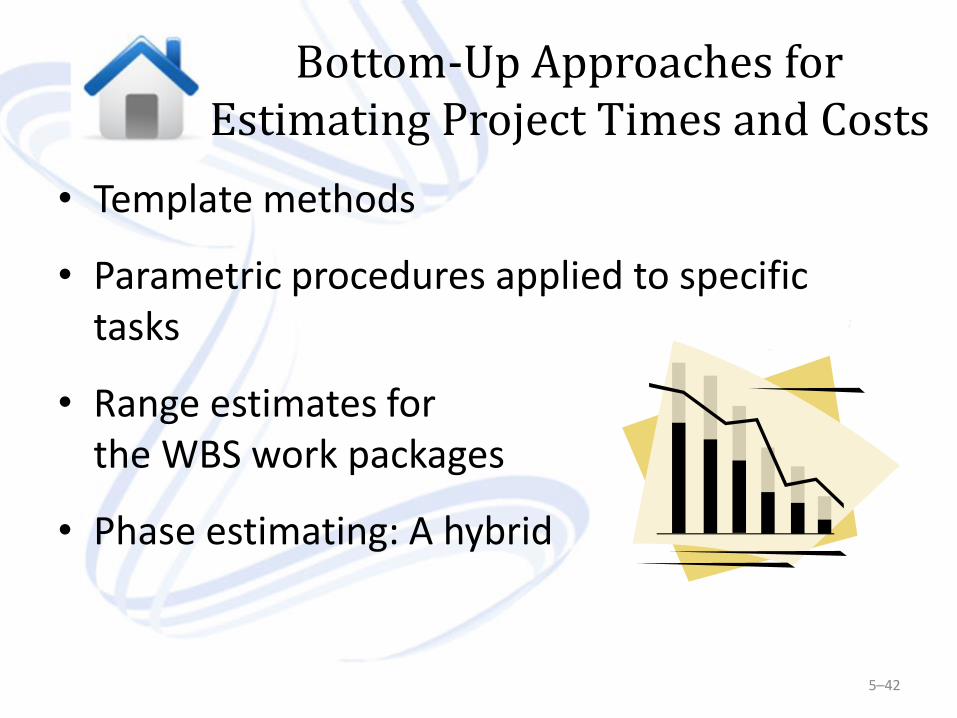
Bottom-Up Approaches for Estimating Project Times and Costs
• Template methods
• Parametric procedures applied to specific tasks
• Range estimates for the WBS work packages
• Phase estimating: A hybrid
5–42

5–43
Support Cost Estimate Worksheet

5–44
Phase Estimating over Product Life Cycle

5–45
Top-Down and Bottom-Up Estimates
FIGURE 5.4

5–46
Level of Detail
Level of detail is different for different levels of management.
Level of detail in the WBS varies with the complexity of the project.
Excessive detail is costly.
• Fosters a focus on departmental outcomes
• Creates unproductive paperwork
Insufficient detail is costly.
• Lack of focus on goals
• Wasted effort on nonessential activities

5–47
Types of Costs
Direct Costs
• Costs that are clearly chargeable to a specific work package.
• Labor, materials, equipment, and other
Direct (Project) Overhead Costs
• Costs incurred that are directly tied to an identifiable project deliverable or work package.
• Salary, rents, supplies, specialized machinery
General and Administrative Overhead Costs
• Organization costs indirectly linked to a specific package that are apportioned to the project

Contract Bid Summary Costs
5–48
Direct costs $80,000
Direct overhead $20,000
Total direct costs $100,000
G&A overhead (20%) $20,000
Total costs $120,000
Profit (20%) $24,000
Total bid $144,000

Three Views of Cost
5–49
FIGURE 5.6

5–50
Refining Estimates
Reasons for Adjusting Estimates
• Interaction costs are hidden in estimates.
• Normal conditions do not apply.
• Things go wrong on projects.
• Changes in project scope and plans.
Adjusting Estimates
• Time and cost estimates of specific activities are adjusted as the risks, resources, and situation particulars become more clearly defined.

5–51
Creating a Database for Estimating
FIGURE 5.7

WBS Figure
5–52
TABLE 5.4

Learning Curves Unit Values
5–53
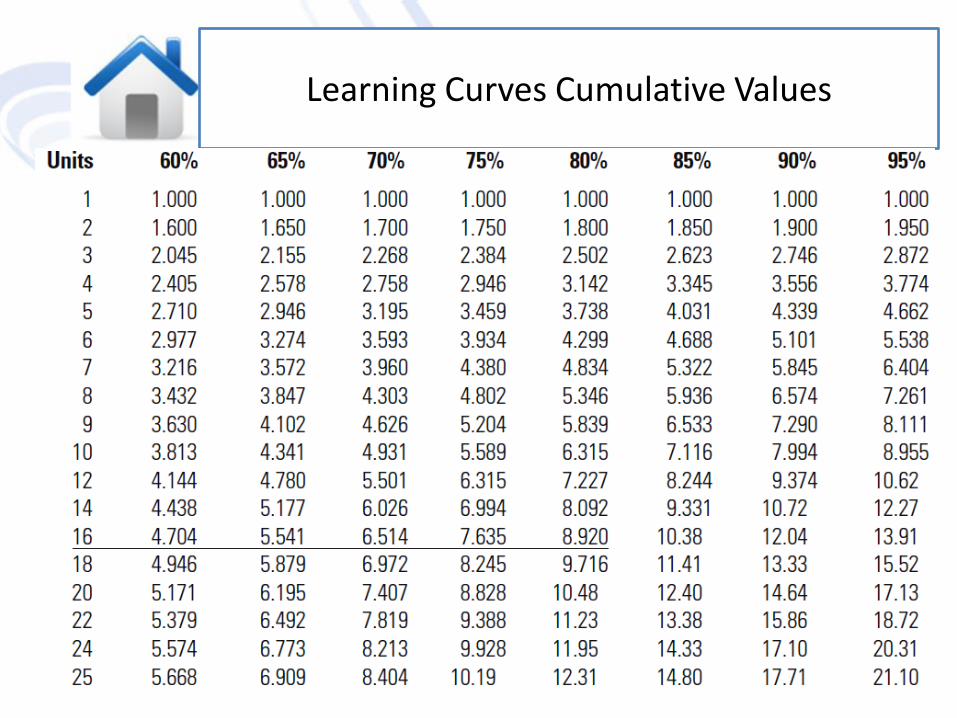
Learning Curves Cumulative Values
5–54


![[PROGRAM STUDI MAGISTER MANAJEMEN TEKNOLOGI] … 2009...MANAJEMEN LINGKUNGAN PERMUKIMAN DAN INDUSTRI ... 5 PM092342 Manajemen Sanitasi Lingkungan Industri ... TUJUAN PEMBELAJARAN](https://img.pdfslide.net/doc/110x75/5c902d7409d3f2907b8b78a2/program-studi-magister-manajemen-teknologi-2009manajemen-lingkungan-permukiman.jpg)