Embed Size (px)
Citation preview
THE REPUBLIC OF THE UNION OF MYANMAR
The 2014 Myanmar Population and Housing Census
Department of Population
Ministry of Labour, Immigration and Population
October 2017
MANDALAY REGION, MANDALAY DISTRICTAungmyetharzan Township Report

The 2014 Myanmar Population and Housing Census
Mandalay Region, Mandalay District
Aungmyetharzan Township Report
Department of Population
Ministry of Labour, Immigration and Population
Office No.48
Nay Pyi Taw
Tel: +95 67 431062
www.dop.gov.mm
October 2017

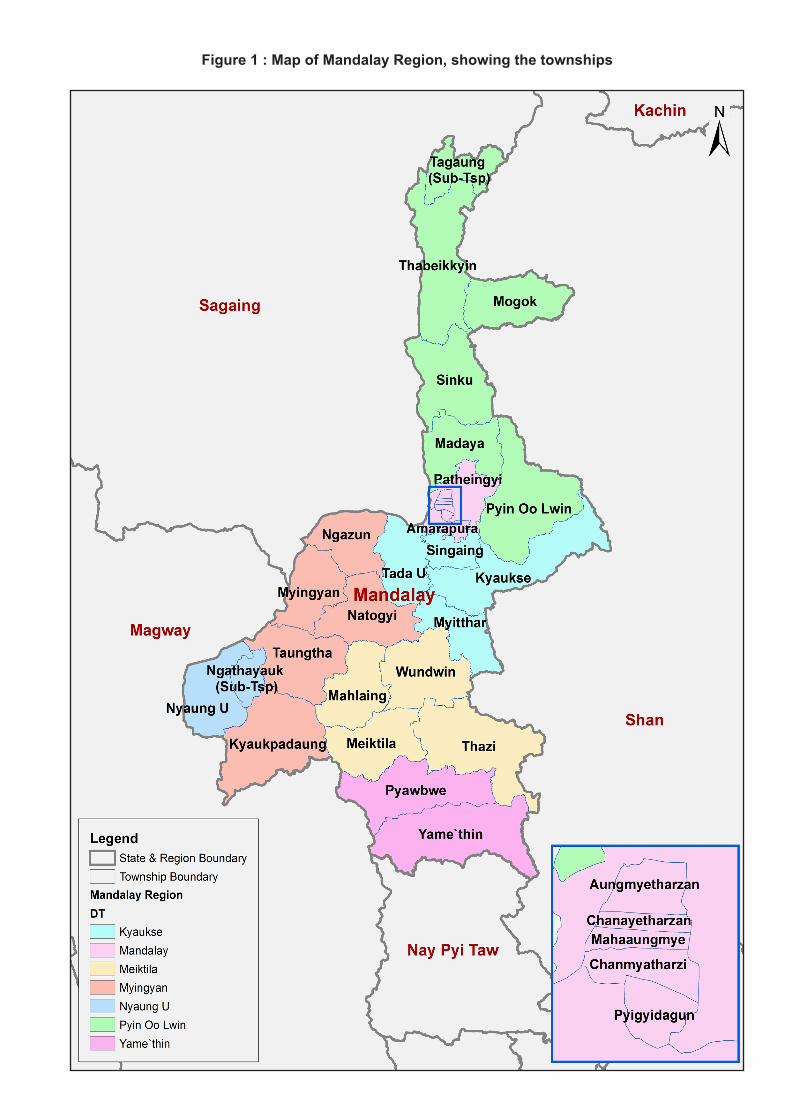
Figure 1 : Map of Mandalay Region, showing the townships

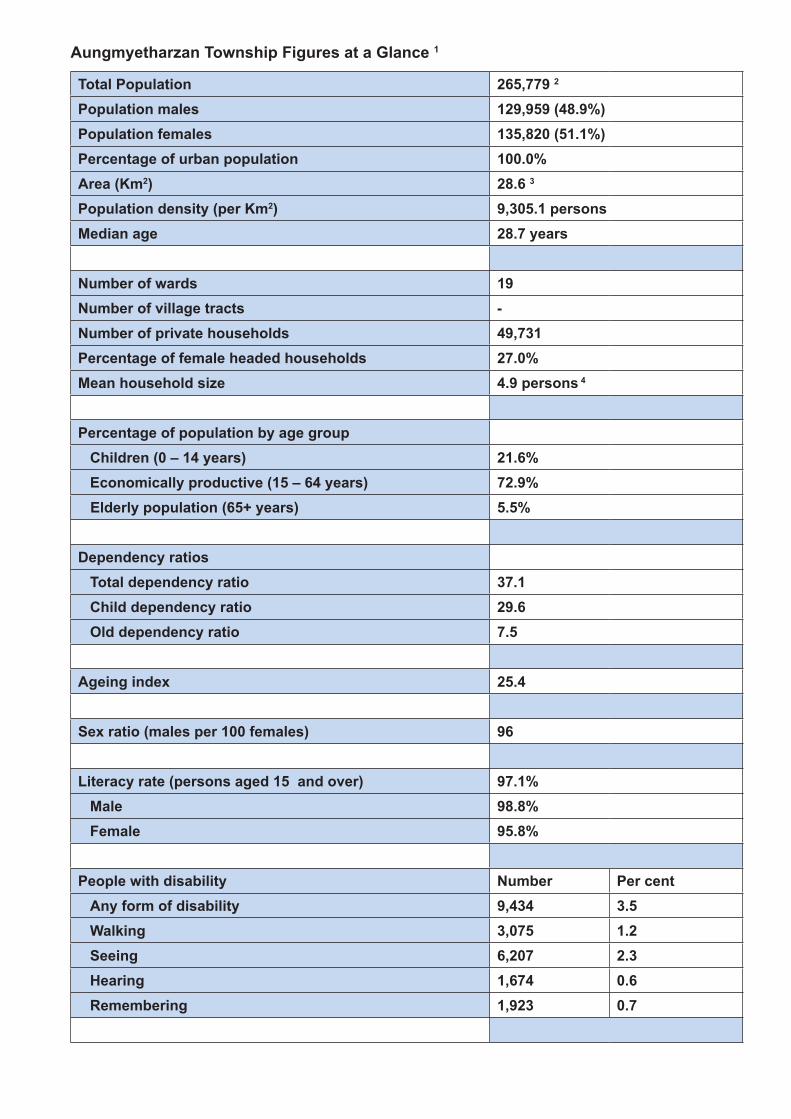
Aungmyetharzan Township Figures at a Glance 1
Total Population 265,779 2
Population males 129,959 (48.9%)Population females 135,820 (51.1%)Percentage of urban population 100.0%Area (Km2) 28.6 3
Population density (per Km2) 9,305.1 personsMedian age 28.7 years
Number of wards 19Number of village tracts -Number of private households 49,731Percentage of female headed households 27.0%Mean household size 4.9 persons 4
Percentage of population by age groupChildren (0 – 14 years) 21.6%Economically productive (15 – 64 years) 72.9%
Elderly population (65+ years) 5.5%
Dependency ratiosTotal dependency ratio 37.1Child dependency ratio 29.6Old dependency ratio 7.5
Ageing index 25.4
Sex ratio (males per 100 females) 96
Literacy rate (persons aged 15 and over) 97.1%Male 98.8%Female 95.8%
People with disability Number Per centAny form of disability 9,434 3.5 Walking 3,075 1.2 Seeing 6,207 2.3Hearing 1,674 0.6Remembering 1,923 0.7
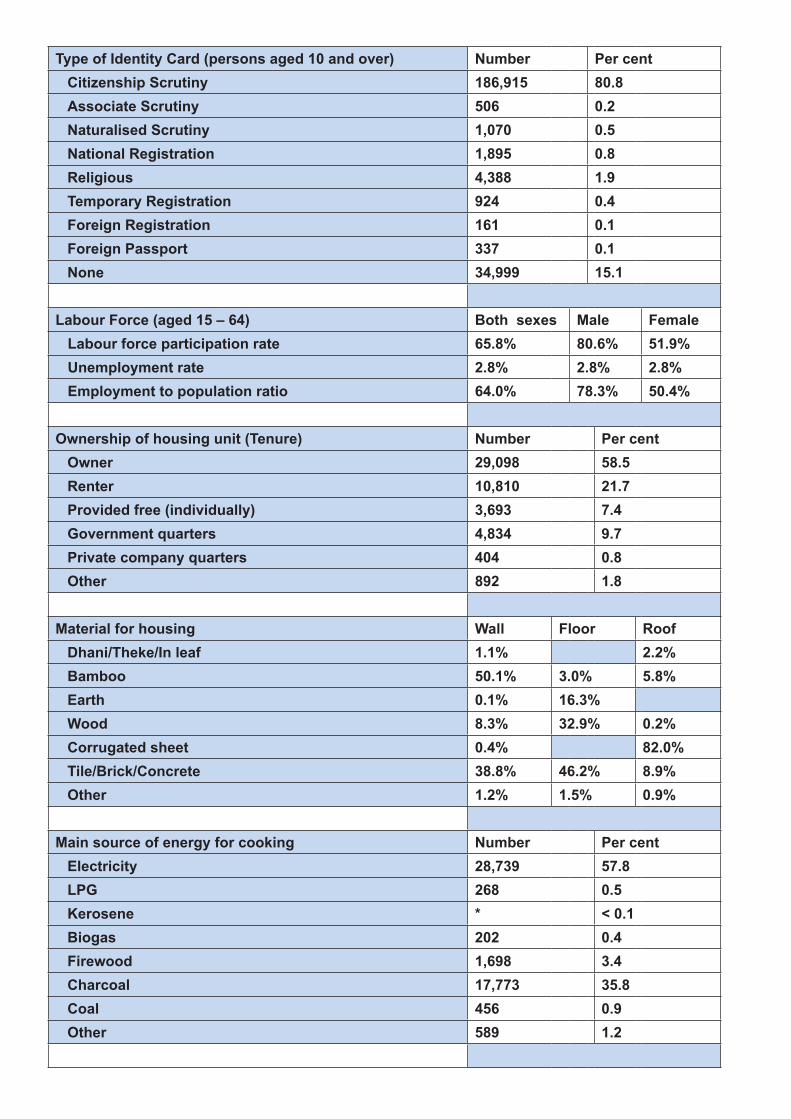
Type of Identity Card (persons aged 10 and over) Number Per centCitizenship Scrutiny 186,915 80.8Associate Scrutiny 506 0.2Naturalised Scrutiny 1,070 0.5National Registration 1,895 0.8Religious 4,388 1.9Temporary Registration 924 0.4Foreign Registration 161 0.1Foreign Passport 337 0.1None 34,999 15.1
Labour Force (aged 15 – 64) Both sexes Male Female Labour force participation rate 65.8% 80.6% 51.9% Unemployment rate 2.8% 2.8% 2.8% Employment to population ratio 64.0% 78.3% 50.4%
Ownership of housing unit (Tenure) Number Per centOwner 29,098 58.5Renter 10,810 21.7Provided free (individually) 3,693 7.4Government quarters 4,834 9.7Private company quarters 404 0.8Other 892 1.8
Material for housing Wall Floor RoofDhani/Theke/In leaf 1.1% 2.2%Bamboo 50.1% 3.0% 5.8%Earth 0.1% 16.3%Wood 8.3% 32.9% 0.2%Corrugated sheet 0.4% 82.0%Tile/Brick/Concrete 38.8% 46.2% 8.9%Other 1.2% 1.5% 0.9%
Main source of energy for cooking Number Per centElectricity 28,739 57.8LPG 268 0.5Kerosene * < 0.1Biogas 202 0.4Firewood 1,698 3.4Charcoal 17,773 35.8Coal 456 0.9Other 589 1.2
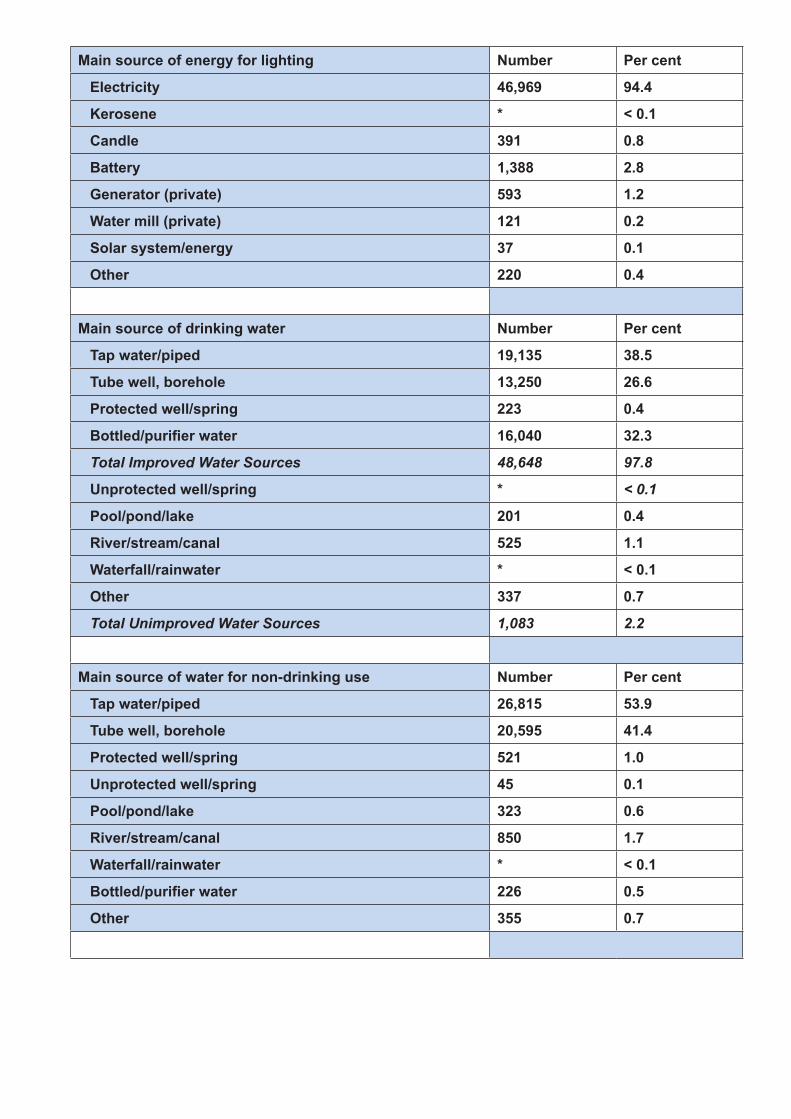
Main source of energy for lighting Number Per cent
Electricity 46,969 94.4
Kerosene * < 0.1
Candle 391 0.8
Battery 1,388 2.8
Generator (private) 593 1.2
Water mill (private) 121 0.2
Solar system/energy 37 0.1
Other 220 0.4
Main source of drinking water Number Per cent
Tap water/piped 19,135 38.5
Tube well, borehole 13,250 26.6
Protected well/spring 223 0.4
Bottled/purifier water 16,040 32.3
Total Improved Water Sources 48,648 97.8
Unprotected well/spring * < 0.1
Pool/pond/lake 201 0.4
River/stream/canal 525 1.1
Waterfall/rainwater * < 0.1
Other 337 0.7
Total Unimproved Water Sources 1,083 2.2
Main source of water for non-drinking use Number Per cent
Tap water/piped 26,815 53.9
Tube well, borehole 20,595 41.4
Protected well/spring 521 1.0
Unprotected well/spring 45 0.1
Pool/pond/lake 323 0.6
River/stream/canal 850 1.7
Waterfall/rainwater * < 0.1
Bottled/purifier water 226 0.5
Other 355 0.7
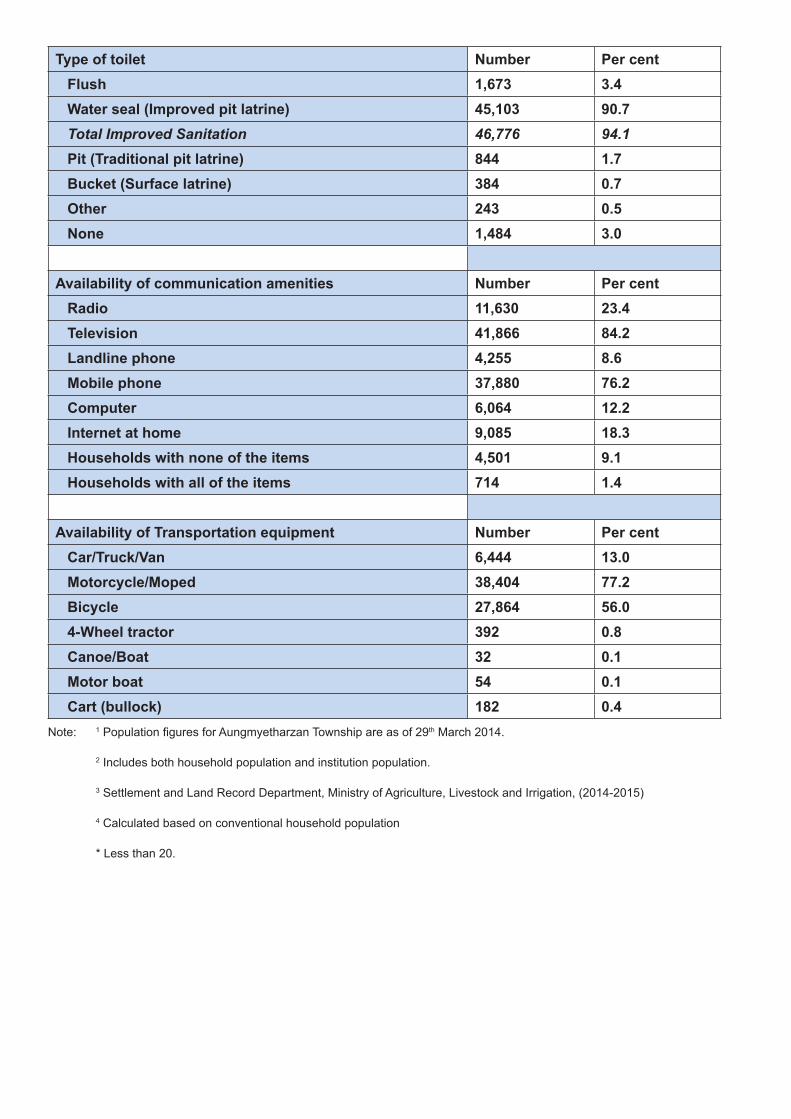
Type of toilet Number Per centFlush 1,673 3.4Water seal (Improved pit latrine) 45,103 90.7Total Improved Sanitation 46,776 94.1Pit (Traditional pit latrine) 844 1.7Bucket (Surface latrine) 384 0.7Other 243 0.5None 1,484 3.0
Availability of communication amenities Number Per centRadio 11,630 23.4Television 41,866 84.2Landline phone 4,255 8.6Mobile phone 37,880 76.2Computer 6,064 12.2Internet at home 9,085 18.3Households with none of the items 4,501 9.1Households with all of the items 714 1.4
Availability of Transportation equipment Number Per centCar/Truck/Van 6,444 13.0Motorcycle/Moped 38,404 77.2Bicycle 27,864 56.04-Wheel tractor 392 0.8Canoe/Boat 32 0.1Motor boat 54 0.1Cart (bullock) 182 0.4
Note: 1 Population figures for Aungmyetharzan Township are as of 29th March 2014.
2 Includes both household population and institution population.
3 Settlement and Land Record Department, Ministry of Agriculture, Livestock and Irrigation, (2014-2015)
4 Calculated based on conventional household population
* Less than 20.
1
Contents
Introduction ............................................................................................................................................... 3
Census information on Aungmyetharzan Township .................................................................................. 5
(A) Demographic Characteristics ........................................................................................................ 7
(B) Religion ........................................................................................................................................ 11
(C) Education .................................................................................................................................... 12
(D) Economic Characteristics ............................................................................................................ 16
(E) Identity Cards .............................................................................................................................. 22
(F) Disability ...................................................................................................................................... 23
(G) Housing Conditions and Household Amenities ........................................................................... 26
Type of housing unit .................................................................................................................... 26
Type of toilet ................................................................................................................................ 27
Source of drinking water ............................................................................................................. 29
Source of lighting ......................................................................................................................... 31
Type of cooking fuel .................................................................................................................... 33
Communication and related amenities ........................................................................................ 35
Transportation items .................................................................................................................... 37
(H) Fertility and Mortality ................................................................................................................... 38
Fertility ........................................................................................................................................ 38
Childhood Mortality and Maternal Mortality ................................................................................. 40
Definitions and Concepts ........................................................................................ ................................ 42
List of Contributors .................................................................................................................................. 46

3
Introduction
In April 2014, the Government of the Republic of the Union of Myanmar conducted its latest census, after three decades without a Population and Housing Census. In the post-independence period, comprehensive population and housing censuses were only successfully undertaken in 1973, 1983 and most recently in April 2014.
Censuses are an important source of benchmark information on the characteristics of the population and households in every country. One unique feature of a census is its ability to provide information down to the lowest administrative level. Such information is vital for planning and evidence based decision-making at every level. Additional data uses include allocation of national resources; the review of administrative boundaries; the positioning of social infrastructures, drawing national development plans, service provision and developing social infrastructure, and for humanitarian preparedness and response.
The results of the 2014 Census have been published so far in a number of volumes. The first was the Provisional Results released in August 2014. The Census Main Results were launched in May 2015. These included The Union Report, Highlights of the Main Results, and reports of each of the 15 States and Regions. The reports on Occupation and Industry and Religion were launched in March 2016 and July 2016, respectively. All the publications are available online at http://www.dop.gov.mm/ and http://myanmar. unfpa.org/node/15104.
The current set of the 2014 Census publications comprise township and sub-township reports. Their preparation involved collaborative efforts of the Department of Population and UNFPA. This report contains selected demographic and socio-economic characteristics of Aungmyetharzan Township in
Mandalay Region. The information included in this report is the situation of 2014 March 29, Census night. Township level information is very important. However, the level of confidence of township estimates is not the same as Union level information. Some of the townships have relatively small populations; the interpretation of these estimates should be made with caution. Some of the indicators, such as IMR/U5MR, were adopted only after careful analysis considering a number of factors to ensure consistency in the results. Estimates for townships with relatively small number of observations should not be taken as exact estimates of the mortality level, but rather they should be regarded as reasonable indicators for the scale of mortality risk they experience, an indication of which townships are better off and which are in a more vulnerable situation.

5
Census information on Aungmyetharzan Township

7
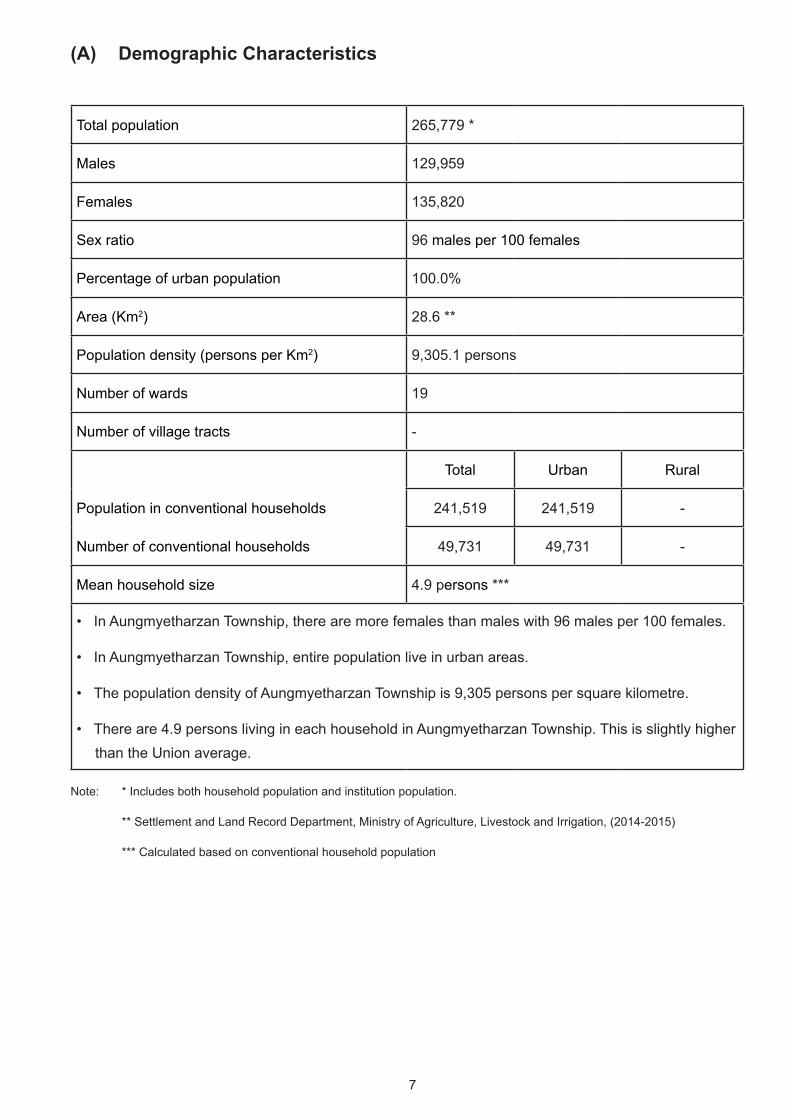
(A) Demographic Characteristics
Total population 265,779 *
Males 129,959
Females 135,820
Sex ratio 96 males per 100 females
Percentage of urban population 100.0%
Area (Km2) 28.6 **
Population density (persons per Km2) 9,305.1 persons
Number of wards 19
Number of village tracts -
Total Urban Rural
Population in conventional households 241,519 241,519 -
Number of conventional households 49,731 49,731 -
Mean household size 4.9 persons ***
• In Aungmyetharzan Township, there are more females than males with 96 males per 100 females.
• In Aungmyetharzan Township, entire population live in urban areas.
• The population density of Aungmyetharzan Township is 9,305 persons per square kilometre.
• There are 4.9 persons living in each household in Aungmyetharzan Township. This is slightly higher than the Union average.
Note: * Includes both household population and institution population.
** Settlement and Land Record Department, Ministry of Agriculture, Livestock and Irrigation, (2014-2015)
*** Calculated based on conventional household population
8
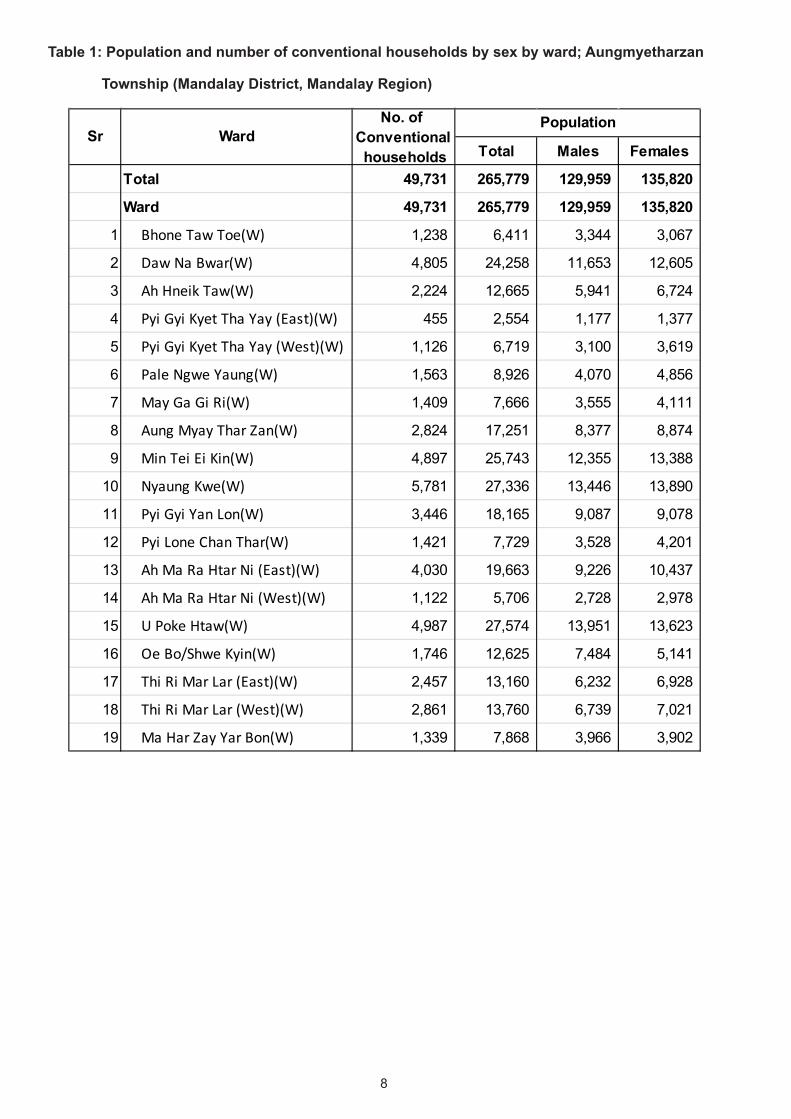
Table 1: Population and number of conventional households by sex by ward; Aungmyetharzan
Township (Mandalay District, Mandalay Region)
Total Males Females
Total 49,731 265,779 129,959 135,820
Ward 49,731 265,779 129,959 135,820
1 Bhone Taw Toe(W) 1,238 6,411 3,344 3,067
2 Daw Na Bwar(W) 4,805 24,258 11,653 12,605
3 Ah Hneik Taw(W) 2,224 12,665 5,941 6,724
4 Pyi Gyi Kyet Tha Yay (East)(W) 455 2,554 1,177 1,377
5 Pyi Gyi Kyet Tha Yay (West)(W) 1,126 6,719 3,100 3,619
6 Pale Ngwe Yaung(W) 1,563 8,926 4,070 4,856
7 May Ga Gi Ri(W) 1,409 7,666 3,555 4,111
8 Aung Myay Thar Zan(W) 2,824 17,251 8,377 8,874
9 Min Tei Ei Kin(W) 4,897 25,743 12,355 13,388
10 Nyaung Kwe(W) 5,781 27,336 13,446 13,890
11 Pyi Gyi Yan Lon(W) 3,446 18,165 9,087 9,078
12 Pyi Lone Chan Thar(W) 1,421 7,729 3,528 4,201
13 Ah Ma Ra Htar Ni (East)(W) 4,030 19,663 9,226 10,437
14 Ah Ma Ra Htar Ni (West)(W) 1,122 5,706 2,728 2,978
15 U Poke Htaw(W) 4,987 27,574 13,951 13,623
16 Oe Bo/Shwe Kyin(W) 1,746 12,625 7,484 5,141
17 Thi Ri Mar Lar (East)(W) 2,457 13,160 6,232 6,928
18 Thi Ri Mar Lar (West)(W) 2,861 13,760 6,739 7,021
19 Ma Har Zay Yar Bon(W) 1,339 7,868 3,966 3,902
Sr WardNo. of
Conventional households
Population
9
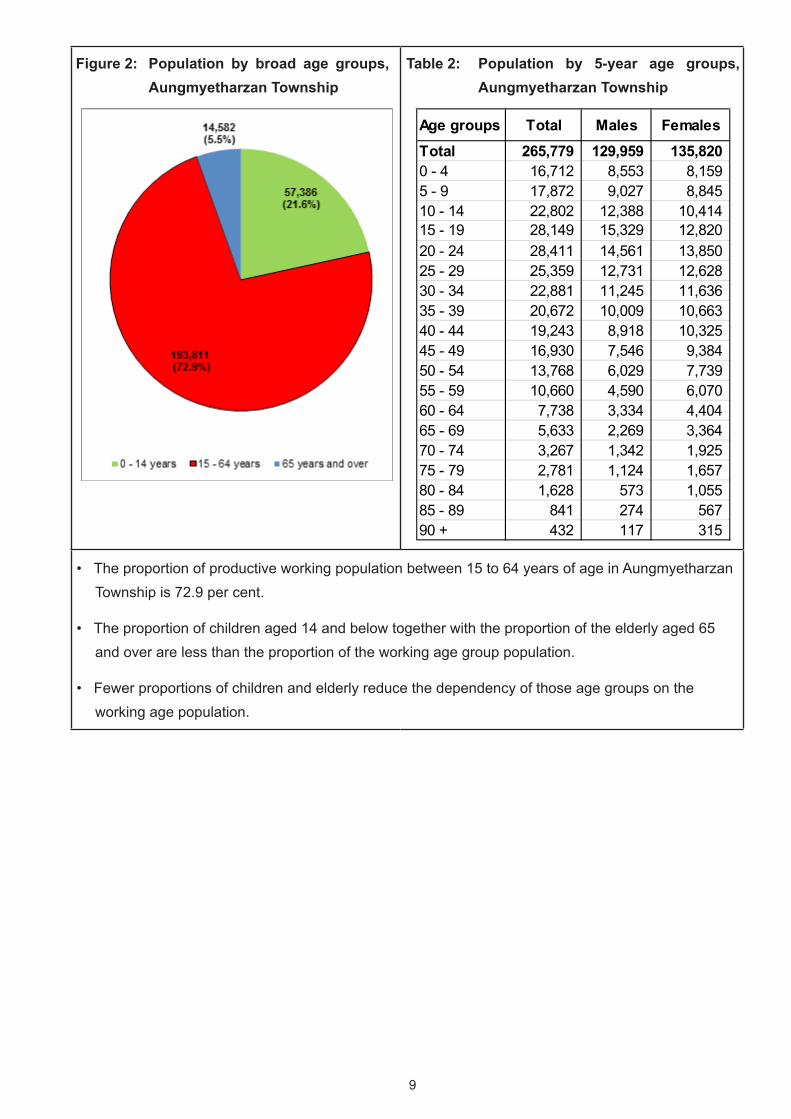
• The proportion of productive working population between 15 to 64 years of age in Aungmyetharzan Township is 72.9 per cent.
• The proportion of children aged 14 and below together with the proportion of the elderly aged 65 and over are less than the proportion of the working age group population.
• Fewer proportions of children and elderly reduce the dependency of those age groups on the working age population.
Figure 2: Population by broad age groups, Aungmyetharzan Township
Table 2: Population by 5-year age groups, Aungmyetharzan Township
Age groups Total Males FemalesTotal 265,779 129,959 135,820 0 - 4 16,712 8,553 8,159 5 - 9 17,872 9,027 8,845 10 - 14 22,802 12,388 10,414 15 - 19 28,149 15,329 12,820 20 - 24 28,411 14,561 13,850 25 - 29 25,359 12,731 12,628 30 - 34 22,881 11,245 11,636 35 - 39 20,672 10,009 10,663 40 - 44 19,243 8,918 10,325 45 - 49 16,930 7,546 9,384 50 - 54 13,768 6,029 7,739 55 - 59 10,660 4,590 6,070 60 - 64 7,738 3,334 4,404 65 - 69 5,633 2,269 3,364 70 - 74 3,267 1,342 1,925 75 - 79 2,781 1,124 1,657 80 - 84 1,628 573 1,055 85 - 89 841 274 567 90 + 432 117 315
10
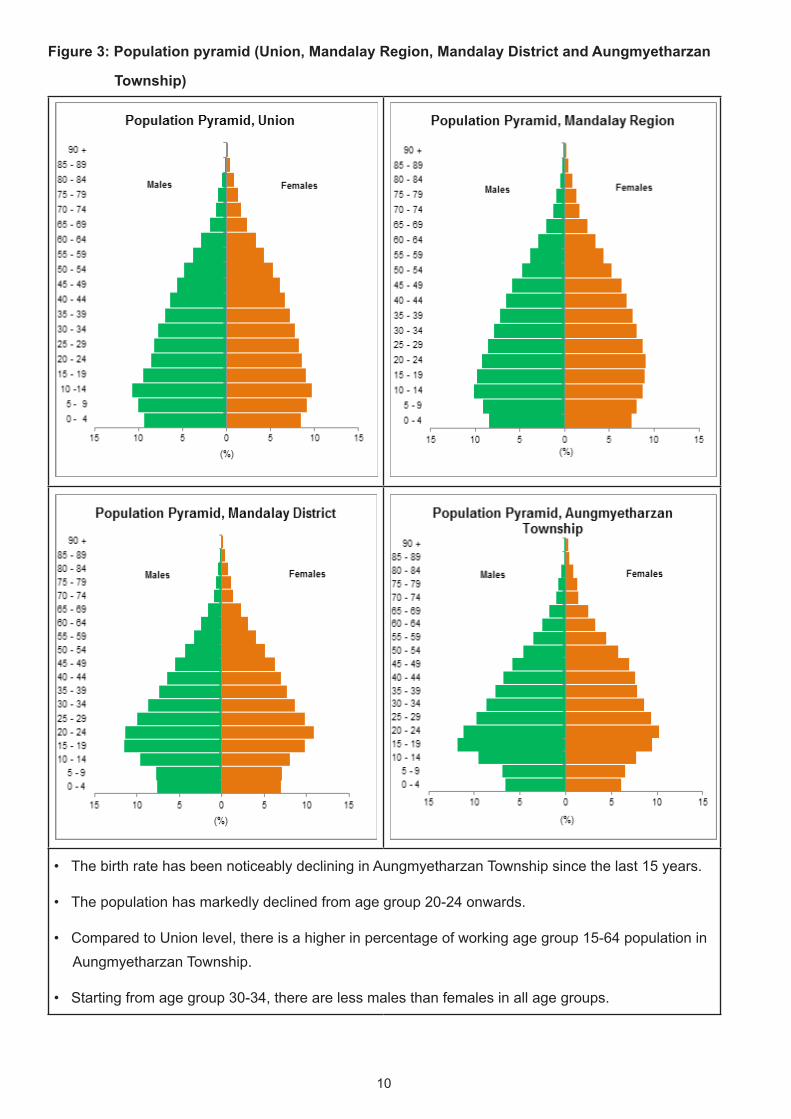
Figure 3: Population pyramid (Union, Mandalay Region, Mandalay District and Aungmyetharzan
Township)
• The birth rate has been noticeably declining in Aungmyetharzan Township since the last 15 years.
• The population has markedly declined from age group 20-24 onwards.
• Compared to Union level, there is a higher in percentage of working age group 15-64 population in Aungmyetharzan Township.
• Starting from age group 30-34, there are less males than females in all age groups.
11
(B) Religion
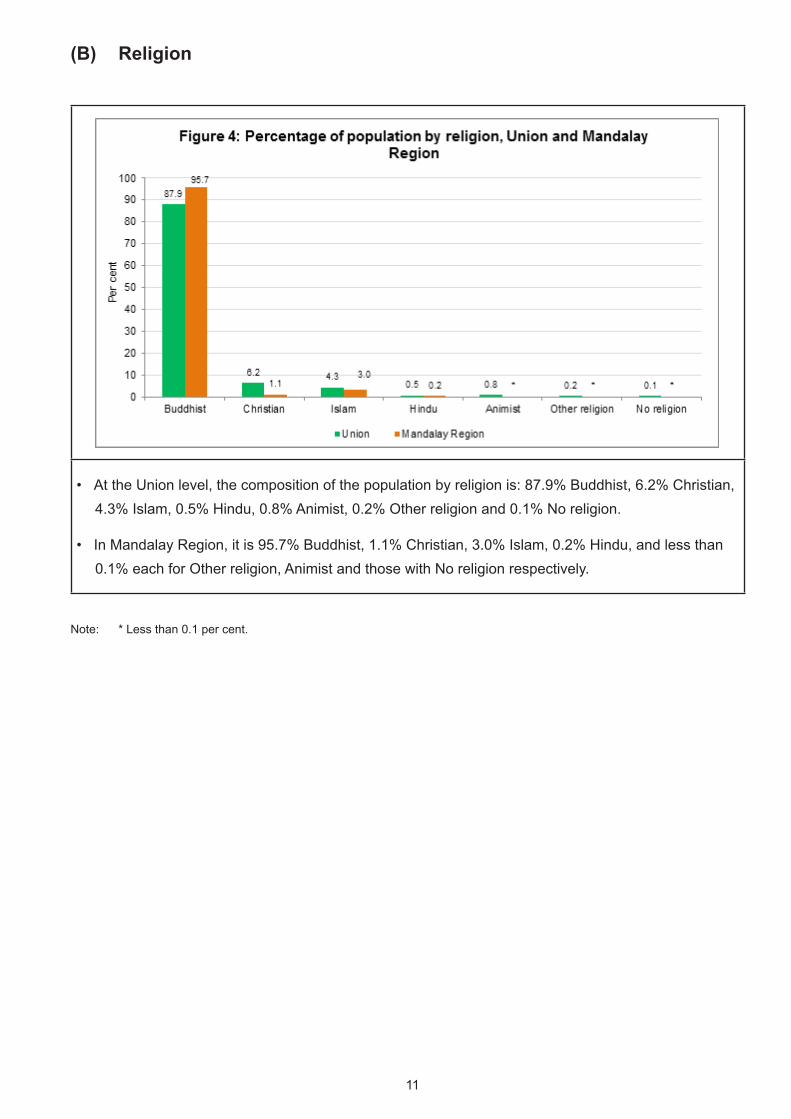
• At the Union level, the composition of the population by religion is: 87.9% Buddhist, 6.2% Christian, 4.3% Islam, 0.5% Hindu, 0.8% Animist, 0.2% Other religion and 0.1% No religion.
• In Mandalay Region, it is 95.7% Buddhist, 1.1% Christian, 3.0% Islam, 0.2% Hindu, and less than 0.1% each for Other religion, Animist and those with No religion respectively.
Note: * Less than 0.1 per cent.
12
(C) Education
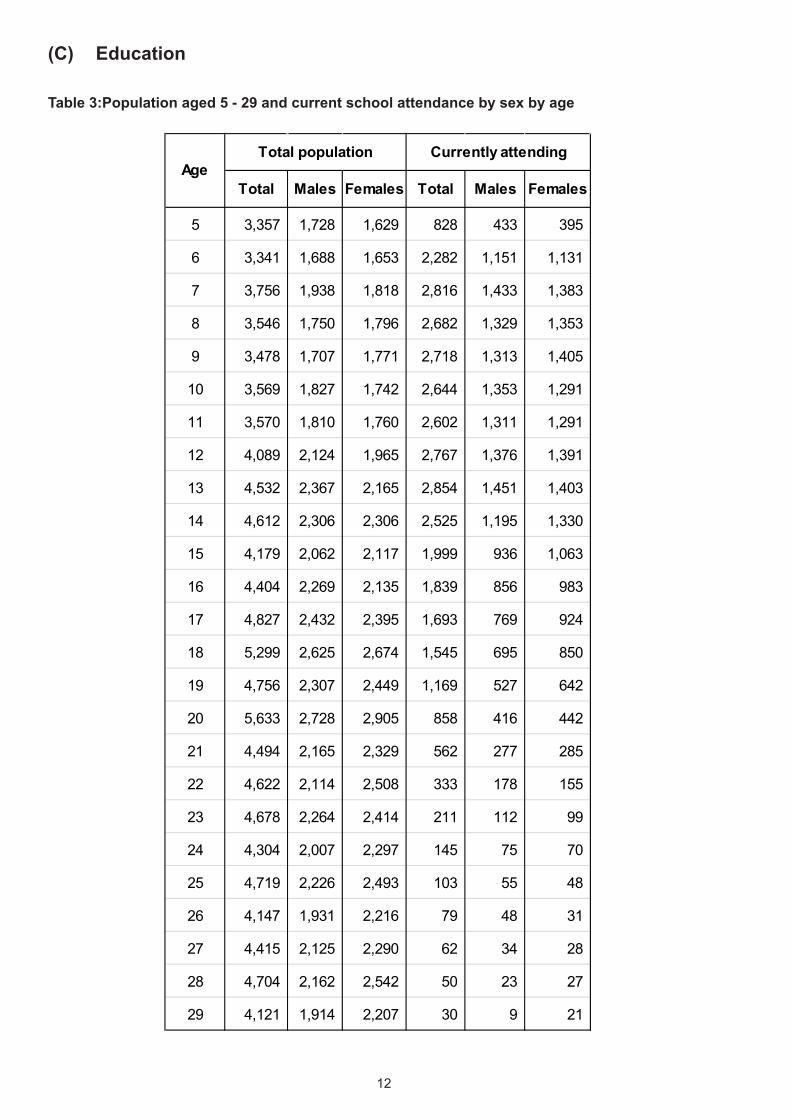
Table 3:Population aged 5 - 29 and current school attendance by sex by age
Total Males Females Total Males Females
5 3,357 1,728 1,629 828 433 395
6 3,341 1,688 1,653 2,282 1,151 1,131
7 3,756 1,938 1,818 2,816 1,433 1,383
8 3,546 1,750 1,796 2,682 1,329 1,353
9 3,478 1,707 1,771 2,718 1,313 1,405
10 3,569 1,827 1,742 2,644 1,353 1,291
11 3,570 1,810 1,760 2,602 1,311 1,291
12 4,089 2,124 1,965 2,767 1,376 1,391
13 4,532 2,367 2,165 2,854 1,451 1,403
14 4,612 2,306 2,306 2,525 1,195 1,330
15 4,179 2,062 2,117 1,999 936 1,063
16 4,404 2,269 2,135 1,839 856 983
17 4,827 2,432 2,395 1,693 769 924
18 5,299 2,625 2,674 1,545 695 850
19 4,756 2,307 2,449 1,169 527 642
20 5,633 2,728 2,905 858 416 442
21 4,494 2,165 2,329 562 277 285
22 4,622 2,114 2,508 333 178 155
23 4,678 2,264 2,414 211 112 99
24 4,304 2,007 2,297 145 75 70
25 4,719 2,226 2,493 103 55 48
26 4,147 1,931 2,216 79 48 31
27 4,415 2,125 2,290 62 34 28
28 4,704 2,162 2,542 50 23 27
29 4,121 1,914 2,207 30 9 21
Total population Currently attendingAge
13
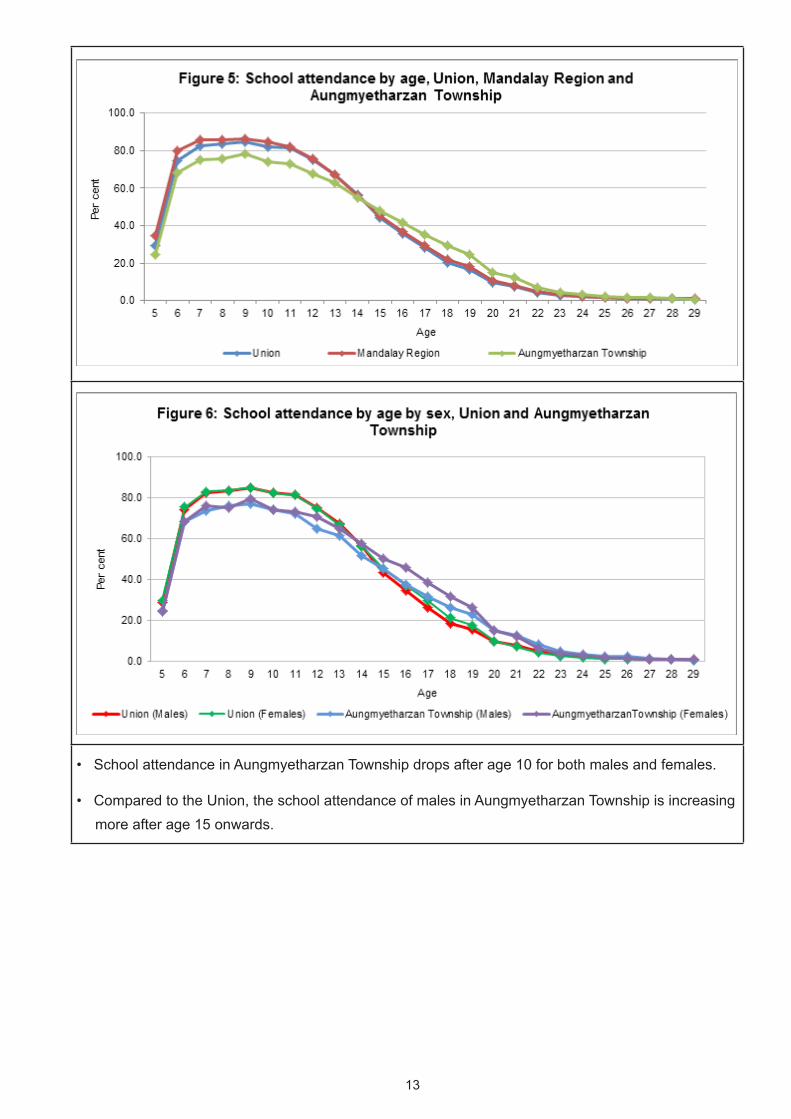
• School attendance in Aungmyetharzan Township drops after age 10 for both males and females.
• Compared to the Union, the school attendance of males in Aungmyetharzan Township is increasing more after age 15 onwards.
14
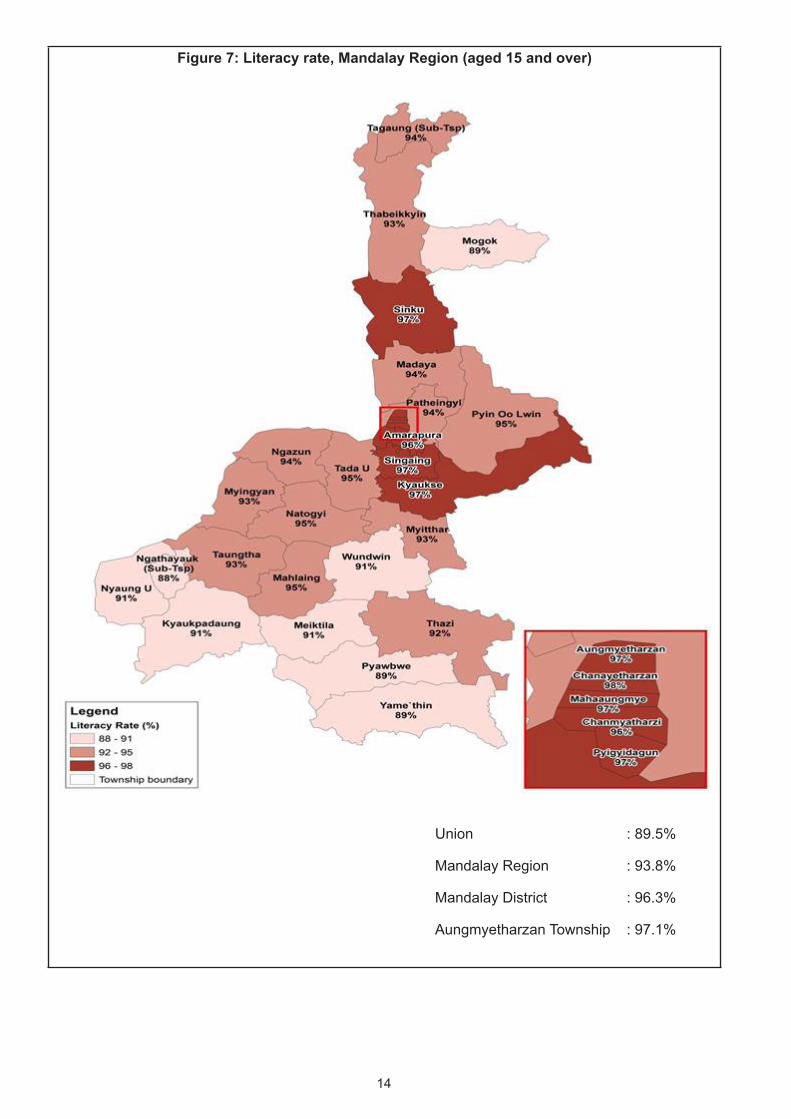
Figure 7: Literacy rate, Mandalay Region (aged 15 and over)
Union : 89.5%
Mandalay Region : 93.8%
Mandalay District : 96.3%
Aungmyetharzan Township : 97.1%
15
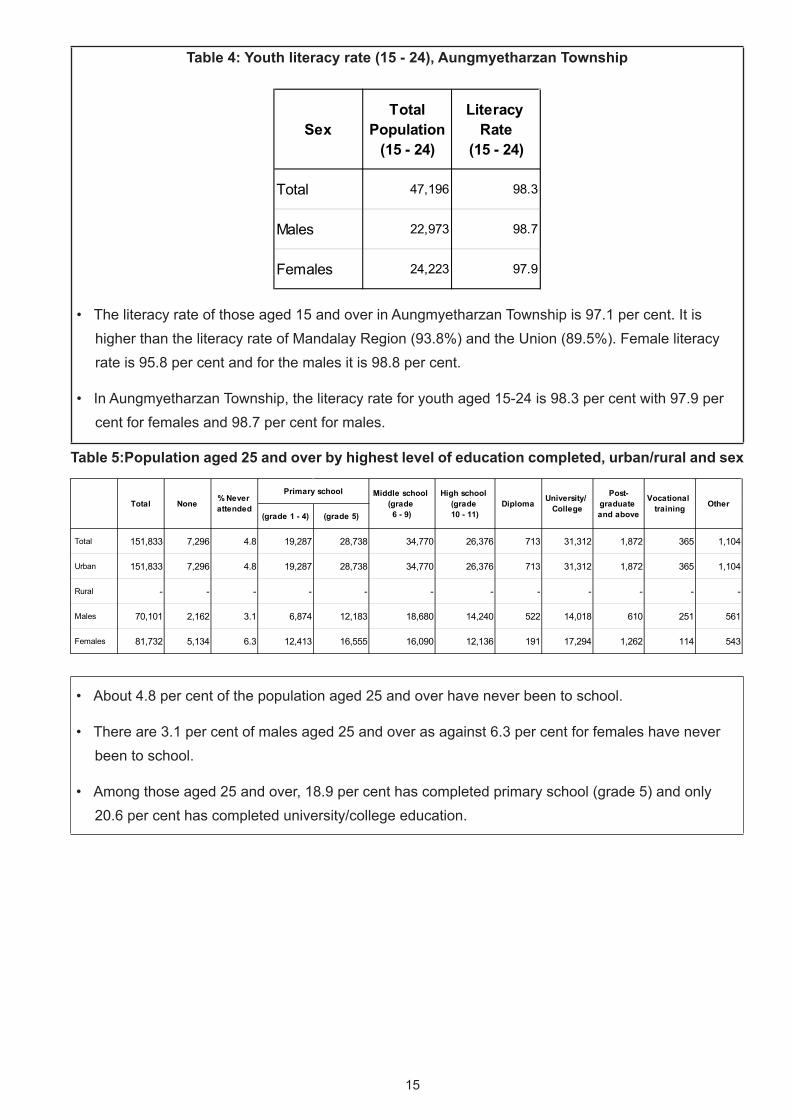
Table 4: Youth literacy rate (15 - 24), Aungmyetharzan Township
• The literacy rate of those aged 15 and over in Aungmyetharzan Township is 97.1 per cent. It is higher than the literacy rate of Mandalay Region (93.8%) and the Union (89.5%). Female literacy rate is 95.8 per cent and for the males it is 98.8 per cent.
• In Aungmyetharzan Township, the literacy rate for youth aged 15-24 is 98.3 per cent with 97.9 per cent for females and 98.7 per cent for males.
Table 5:Population aged 25 and over by highest level of education completed, urban/rural and sex
• About 4.8 per cent of the population aged 25 and over have never been to school.
• There are 3.1 per cent of males aged 25 and over as against 6.3 per cent for females have never been to school.
• Among those aged 25 and over, 18.9 per cent has completed primary school (grade 5) and only 20.6 per cent has completed university/college education.
SexTotal
Population(15 - 24)
Literacy Rate
(15 - 24)
Total 47,196 98.3
Males 22,973 98.7
Females 24,223 97.9
(grade 1 - 4) (grade 5)
Total 151,833 7,296 4.8 19,287 28,738 34,770 26,376 713 31,312 1,872 365 1,104
Urban 151,833 7,296 4.8 19,287 28,738 34,770 26,376 713 31,312 1,872 365 1,104
Rural - - - - - - - - - - - -
Males 70,101 2,162 3.1 6,874 12,183 18,680 14,240 522 14,018 610 251 561
Females 81,732 5,134 6.3 12,413 16,555 16,090 12,136 191 17,294 1,262 114 543
OtherTotal None % Never attended
Primary school Middle school (grade 6 - 9)
High school (grade 10 - 11)
Diploma University/ College
Post-graduate and above
Vocational training
16
(D) Economic Characteristics
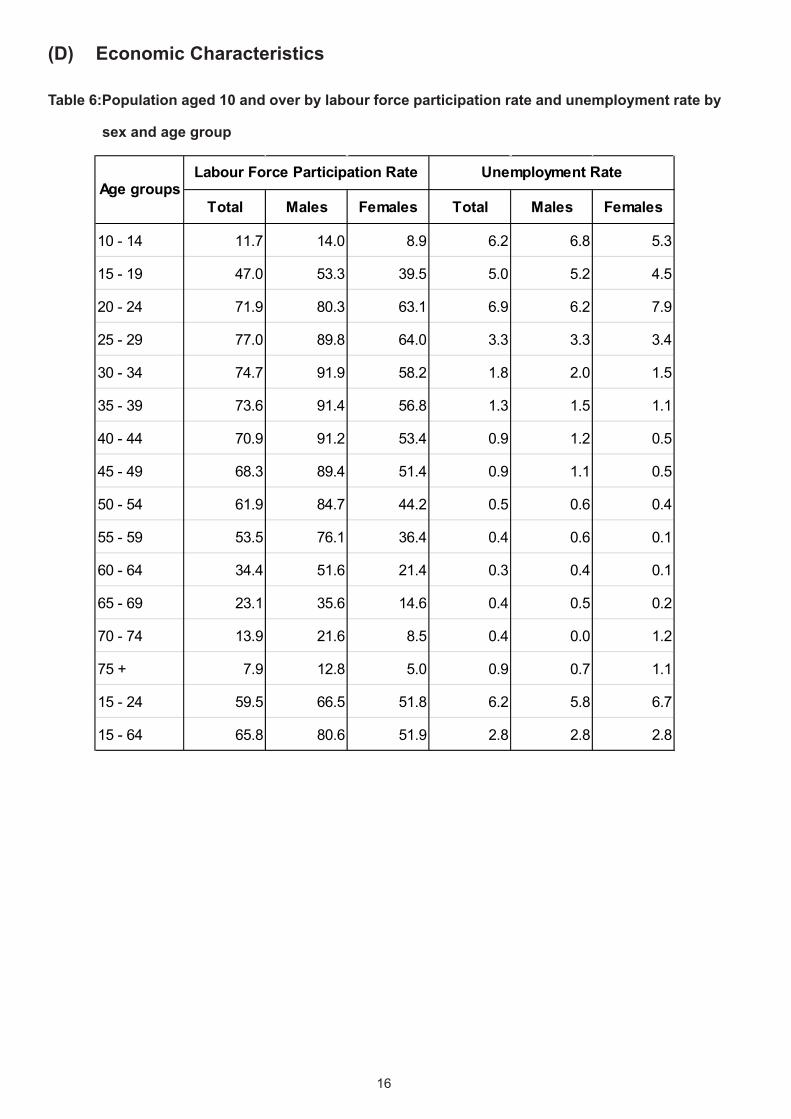
Table 6:Population aged 10 and over by labour force participation rate and unemployment rate by
sex and age group
Total Males Females Total Males Females
10 - 14 11.7 14.0 8.9 6.2 6.8 5.3
15 - 19 47.0 53.3 39.5 5.0 5.2 4.5
20 - 24 71.9 80.3 63.1 6.9 6.2 7.9
25 - 29 77.0 89.8 64.0 3.3 3.3 3.4
30 - 34 74.7 91.9 58.2 1.8 2.0 1.5
35 - 39 73.6 91.4 56.8 1.3 1.5 1.1
40 - 44 70.9 91.2 53.4 0.9 1.2 0.5
45 - 49 68.3 89.4 51.4 0.9 1.1 0.5
50 - 54 61.9 84.7 44.2 0.5 0.6 0.4
55 - 59 53.5 76.1 36.4 0.4 0.6 0.1
60 - 64 34.4 51.6 21.4 0.3 0.4 0.1
65 - 69 23.1 35.6 14.6 0.4 0.5 0.2
70 - 74 13.9 21.6 8.5 0.4 0.0 1.2
75 + 7.9 12.8 5.0 0.9 0.7 1.1
15 - 24 59.5 66.5 51.8 6.2 5.8 6.7
15 - 64 65.8 80.6 51.9 2.8 2.8 2.8
Age groupsLabour Force Participation Rate Unemployment Rate
17
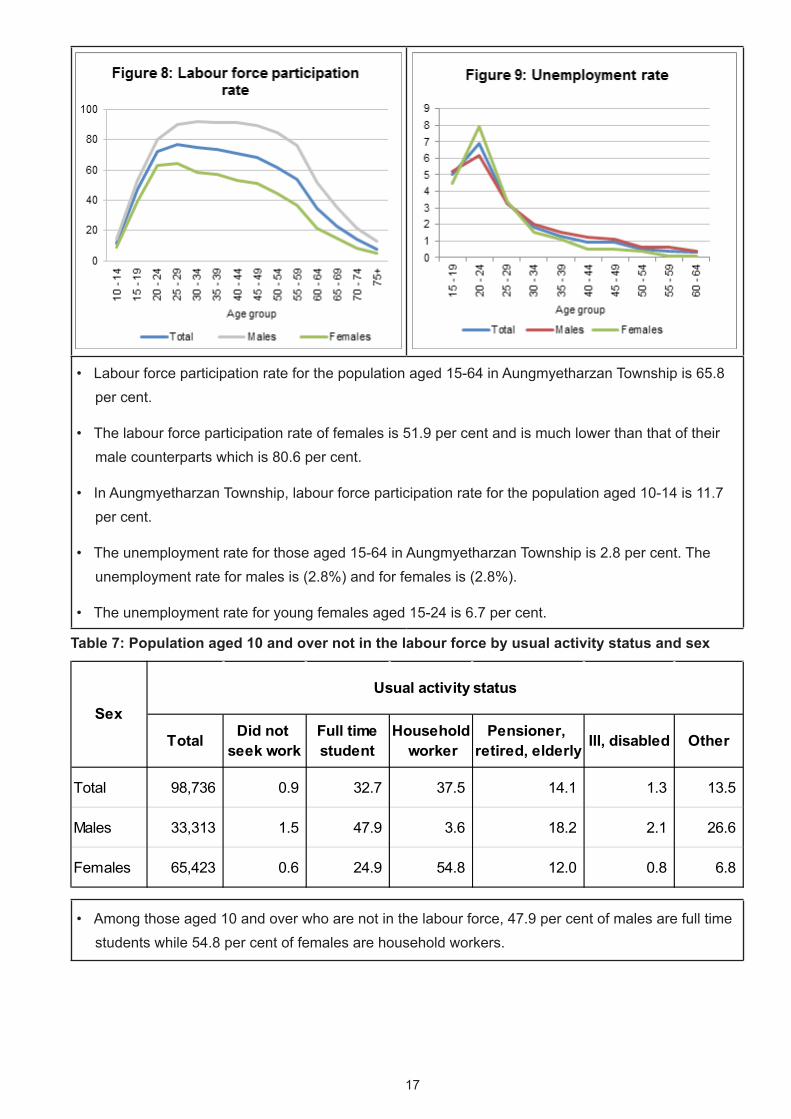
• Labour force participation rate for the population aged 15-64 in Aungmyetharzan Township is 65.8 per cent.
• The labour force participation rate of females is 51.9 per cent and is much lower than that of their male counterparts which is 80.6 per cent.
• In Aungmyetharzan Township, labour force participation rate for the population aged 10-14 is 11.7 per cent.
• The unemployment rate for those aged 15-64 in Aungmyetharzan Township is 2.8 per cent. The unemployment rate for males is (2.8%) and for females is (2.8%).
• The unemployment rate for young females aged 15-24 is 6.7 per cent.
Table 7: Population aged 10 and over not in the labour force by usual activity status and sex
• Among those aged 10 and over who are not in the labour force, 47.9 per cent of males are full time students while 54.8 per cent of females are household workers.
Total Did not seek work
Full timestudent
Household worker
Pensioner, retired, elderly Ill, disabled Other
Total 98,736 0.9 32.7 37.5 14.1 1.3 13.5
Males 33,313 1.5 47.9 3.6 18.2 2.1 26.6
Females 65,423 0.6 24.9 54.8 12.0 0.8 6.8
SexUsual activity status
18
Table 8: Employed persons aged 15 - 64 by occupation by sex
Total Males Females Total Males Females
Total 111,562 64,769 46,793 100.0 100.0 100.0
Managers 1,234 830 404 1.1 1.3 0.9
Professionals 4,984 1,515 3,469 4.5 2.3 7.4
Technicians and Associate Professionals 6,665 5,214 1,451 6.0 8.1 3.1
Clerical Support Workers 6,250 2,956 3,294 5.6 4.6 7.0
Services and Sales Workers 35,463 16,010 19,453 31.8 24.7 41.6
Skilled Agricultural, Forestry and Fishery Workers 1,109 752 357 1.0 1.2 0.8
Craft and Related Trades Workers 29,871 21,179 8,692 26.8 32.7 18.6
Plant and Machine Operators and Assemblers 7,398 6,636 762 6.6 10.2 1.6
Elementary Occupations 11,502 6,640 4,862 10.3 10.3 10.4
Others - - - - - -
Not stated 7,086 3,037 4,049 6.4 4.7 8.7
Employed persons Per centOccupation
19
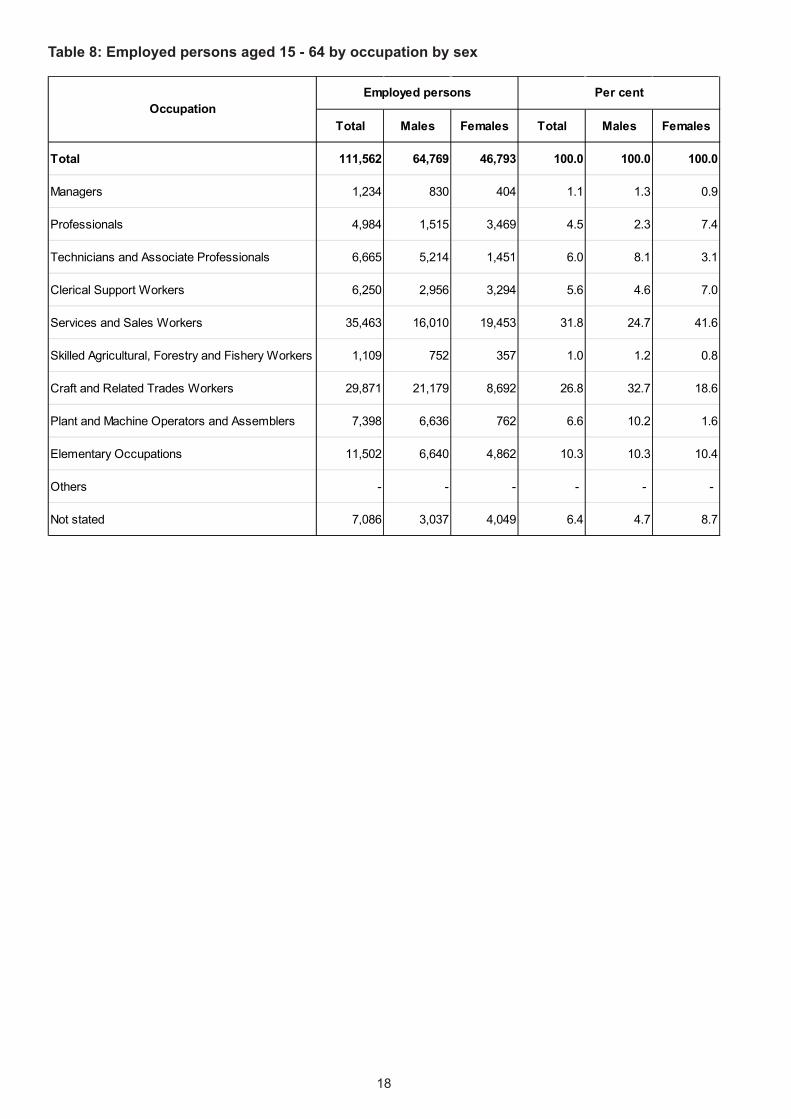
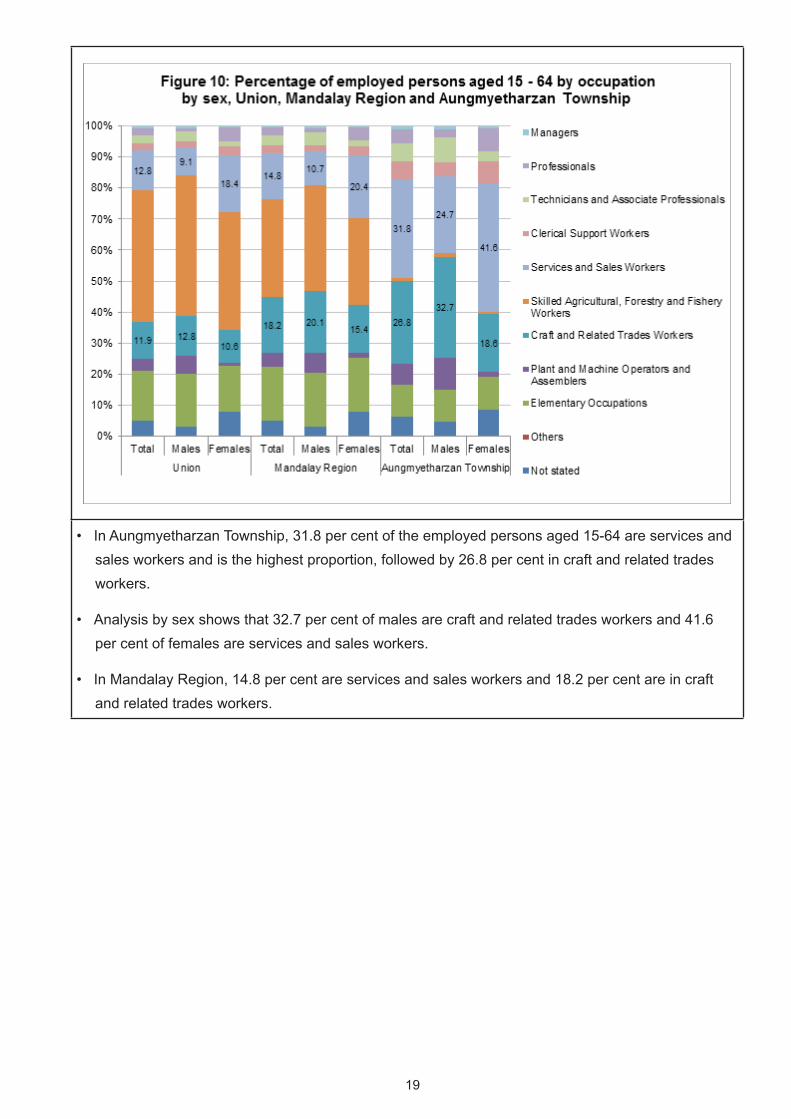
• In Aungmyetharzan Township, 31.8 per cent of the employed persons aged 15-64 are services and sales workers and is the highest proportion, followed by 26.8 per cent in craft and related trades workers.
• Analysis by sex shows that 32.7 per cent of males are craft and related trades workers and 41.6 per cent of females are services and sales workers.
• In Mandalay Region, 14.8 per cent are services and sales workers and 18.2 per cent are in craft and related trades workers.
20
Table 9: Employed persons aged 15 - 64 by industry by sex
Note: * Less than 0.1 per cent.
Total Males Females Total Males Females
Total 111,562 64,769 46,793 100.0 100.0 100.0
Agriculture, forestry and fishing 2,331 1,632 699 2.1 2.5 1.5
Mining and quarrying 173 144 29 0.2 0.2 0.1
Manufacturing 14,501 7,545 6,956 13.0 11.6 14.9
Electricity, gas, steam and air conditioning supply 1,021 963 58 0.9 1.5 0.1
Water supply; sewerage, waste management and remediation activities 310 259 51 0.3 0.4 0.1
Construction 8,130 6,629 1,501 7.3 10.2 3.2
Wholesale and retail trade; repair of motor vehicles and motorcycles 26,484 14,264 12,220 23.7 22.0 26.1
Transportation and storage 8,369 8,050 319 7.5 12.4 0.7
Accommodation and food service activities 14,982 6,372 8,610 13.4 9.8 18.4
Information and communication 783 498 285 0.7 0.8 0.6
Financial and insurance activities 1,000 415 585 0.9 0.6 1.3
Real estate activities 254 165 89 0.2 0.3 0.2
Professional, scientific and technical activities 605 403 202 0.5 0.6 0.4
Administrative and support service activities 2,763 1,473 1,290 2.5 2.3 2.8
Public administration including civil servants 6,236 4,418 1,818 5.6 6.8 3.9
Education 3,169 484 2,685 2.8 0.7 5.7
Human health and social work activities 1,483 611 872 1.3 0.9 1.9
Arts, entertainment and recreation 918 647 271 0.8 1.0 0.6
Other service activities 2,683 1,274 1,409 2.4 2.0 3.0
Activities of households as employers; undifferentiated goods- and services- producing activities of households for own use
1,605 430 1,175 1.4 0.7 2.5
Activities of extraterritorial organizations and bodies 16 7 9 * * *
Not stated 13,746 8,086 5,660 12.3 12.5 12.1
Employed persons Per centIndustry
21
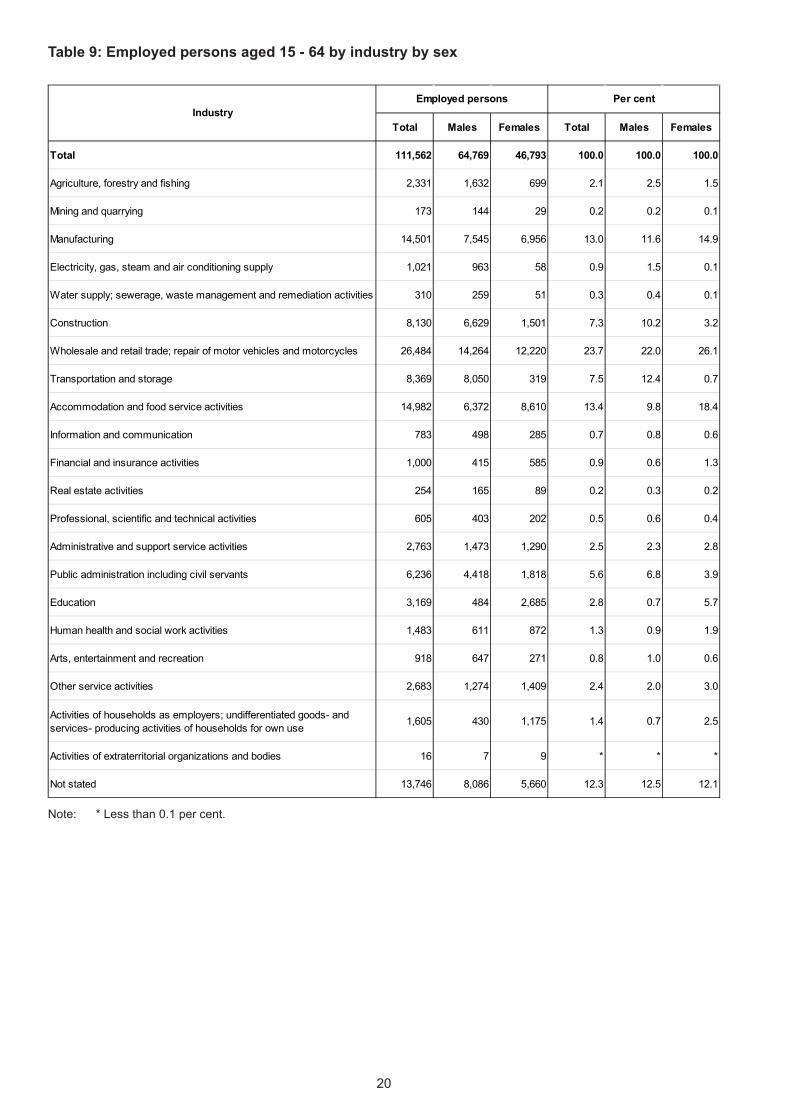
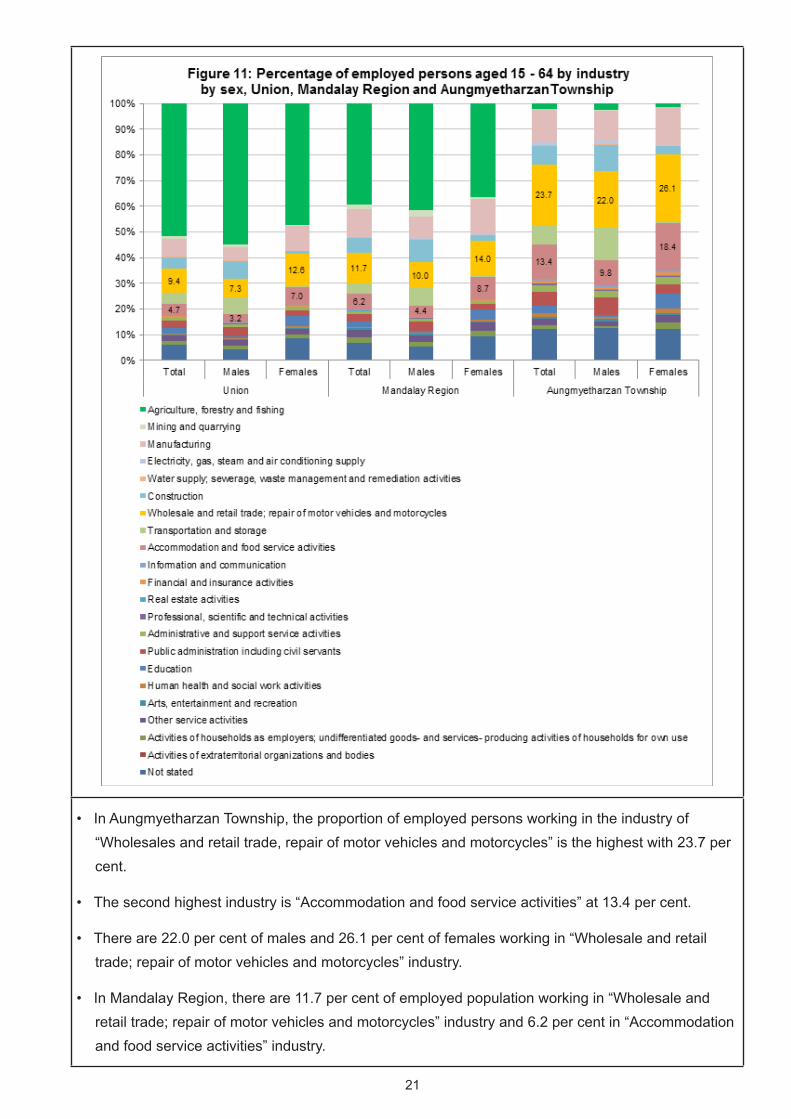
• In Aungmyetharzan Township, the proportion of employed persons working in the industry of “Wholesales and retail trade, repair of motor vehicles and motorcycles” is the highest with 23.7 per cent.
• The second highest industry is “Accommodation and food service activities” at 13.4 per cent.
• There are 22.0 per cent of males and 26.1 per cent of females working in “Wholesale and retail trade; repair of motor vehicles and motorcycles” industry.
• In Mandalay Region, there are 11.7 per cent of employed population working in “Wholesale and retail trade; repair of motor vehicles and motorcycles” industry and 6.2 per cent in “Accommodation and food service activities” industry.
22
(E) Identity Cards
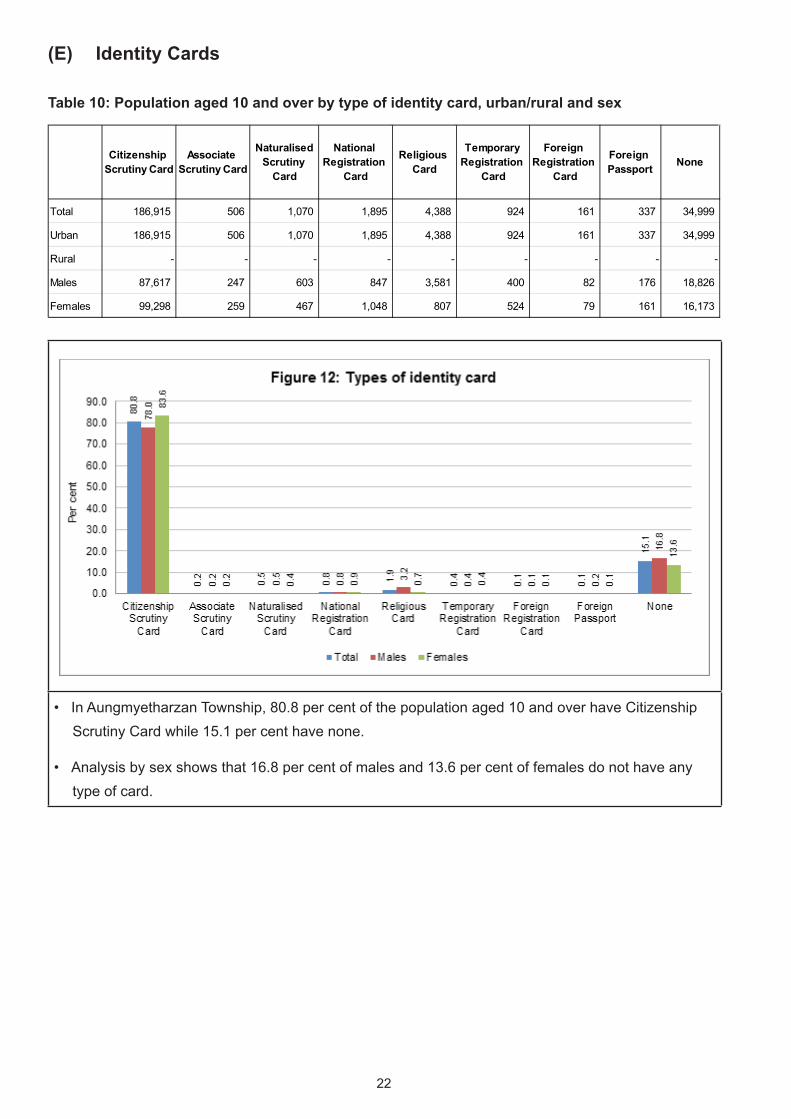
Table 10: Population aged 10 and over by type of identity card, urban/rural and sex
• In Aungmyetharzan Township, 80.8 per cent of the population aged 10 and over have Citizenship Scrutiny Card while 15.1 per cent have none.
• Analysis by sex shows that 16.8 per cent of males and 13.6 per cent of females do not have any type of card.
Citizenship Scrutiny Card
Associate Scrutiny Card
NaturalisedScrutiny
Card
National Registration
Card
Religious Card
Temporary Registration
Card
Foreign Registration
Card
Foreign Passport None
Total 186,915 506 1,070 1,895 4,388 924 161 337 34,999
Urban 186,915 506 1,070 1,895 4,388 924 161 337 34,999
Rural - - - - - - - - -
Males 87,617 247 603 847 3,581 400 82 176 18,826
Females 99,298 259 467 1,048 807 524 79 161 16,173
23
(F) Disability
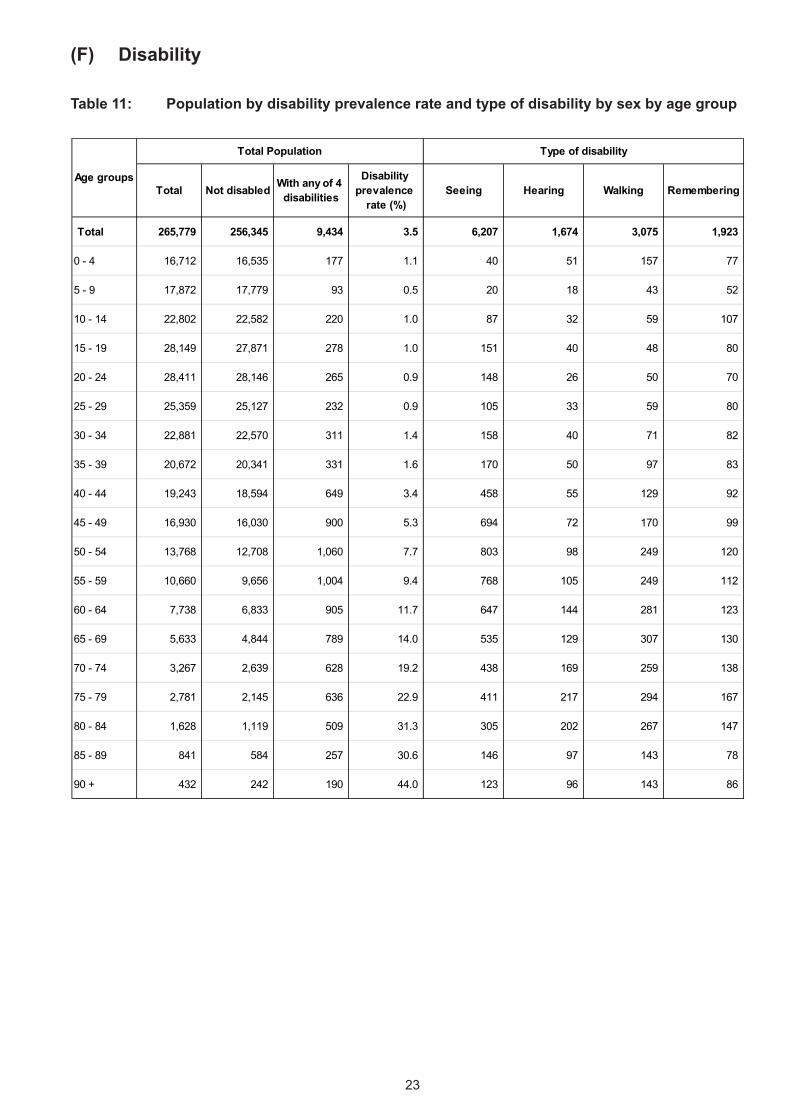
Table 11: Population by disability prevalence rate and type of disability by sex by age group
Total Not disabled With any of 4 disabilities
Disability prevalence
rate (%)Seeing Hearing Walking Remembering
Total 265,779 256,345 9,434 3.5 6,207 1,674 3,075 1,923
0 - 4 16,712 16,535 177 1.1 40 51 157 77
5 - 9 17,872 17,779 93 0.5 20 18 43 52
10 - 14 22,802 22,582 220 1.0 87 32 59 107
15 - 19 28,149 27,871 278 1.0 151 40 48 80
20 - 24 28,411 28,146 265 0.9 148 26 50 70
25 - 29 25,359 25,127 232 0.9 105 33 59 80
30 - 34 22,881 22,570 311 1.4 158 40 71 82
35 - 39 20,672 20,341 331 1.6 170 50 97 83
40 - 44 19,243 18,594 649 3.4 458 55 129 92
45 - 49 16,930 16,030 900 5.3 694 72 170 99
50 - 54 13,768 12,708 1,060 7.7 803 98 249 120
55 - 59 10,660 9,656 1,004 9.4 768 105 249 112
60 - 64 7,738 6,833 905 11.7 647 144 281 123
65 - 69 5,633 4,844 789 14.0 535 129 307 130
70 - 74 3,267 2,639 628 19.2 438 169 259 138
75 - 79 2,781 2,145 636 22.9 411 217 294 167
80 - 84 1,628 1,119 509 31.3 305 202 267 147
85 - 89 841 584 257 30.6 146 97 143 78
90 + 432 242 190 44.0 123 96 143 86
Age groups
Total Population Type of disability
24
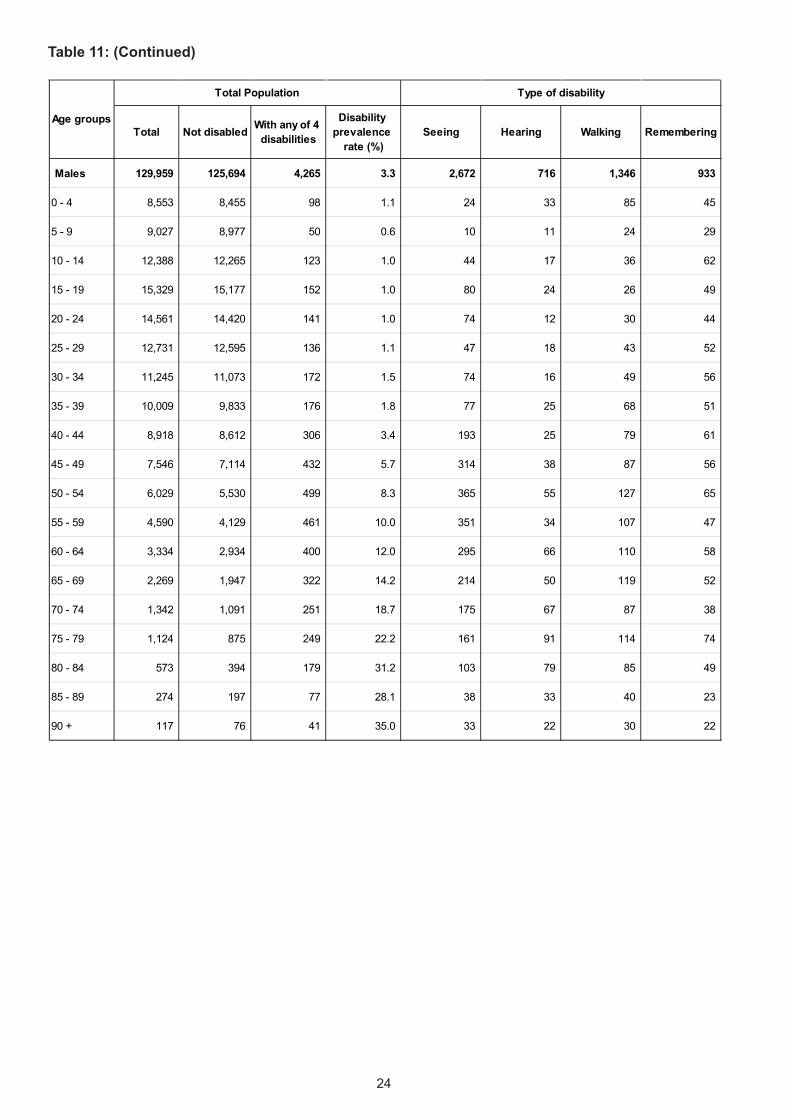
Table 11: (Continued)
Total Not disabled With any of 4 disabilities
Disability prevalence
rate (%)Seeing Hearing Walking Remembering
Males 129,959 125,694 4,265 3.3 2,672 716 1,346 933
0 - 4 8,553 8,455 98 1.1 24 33 85 45
5 - 9 9,027 8,977 50 0.6 10 11 24 29
10 - 14 12,388 12,265 123 1.0 44 17 36 62
15 - 19 15,329 15,177 152 1.0 80 24 26 49
20 - 24 14,561 14,420 141 1.0 74 12 30 44
25 - 29 12,731 12,595 136 1.1 47 18 43 52
30 - 34 11,245 11,073 172 1.5 74 16 49 56
35 - 39 10,009 9,833 176 1.8 77 25 68 51
40 - 44 8,918 8,612 306 3.4 193 25 79 61
45 - 49 7,546 7,114 432 5.7 314 38 87 56
50 - 54 6,029 5,530 499 8.3 365 55 127 65
55 - 59 4,590 4,129 461 10.0 351 34 107 47
60 - 64 3,334 2,934 400 12.0 295 66 110 58
65 - 69 2,269 1,947 322 14.2 214 50 119 52
70 - 74 1,342 1,091 251 18.7 175 67 87 38
75 - 79 1,124 875 249 22.2 161 91 114 74
80 - 84 573 394 179 31.2 103 79 85 49
85 - 89 274 197 77 28.1 38 33 40 23
90 + 117 76 41 35.0 33 22 30 22
Age groups
Total Population Type of disability
25
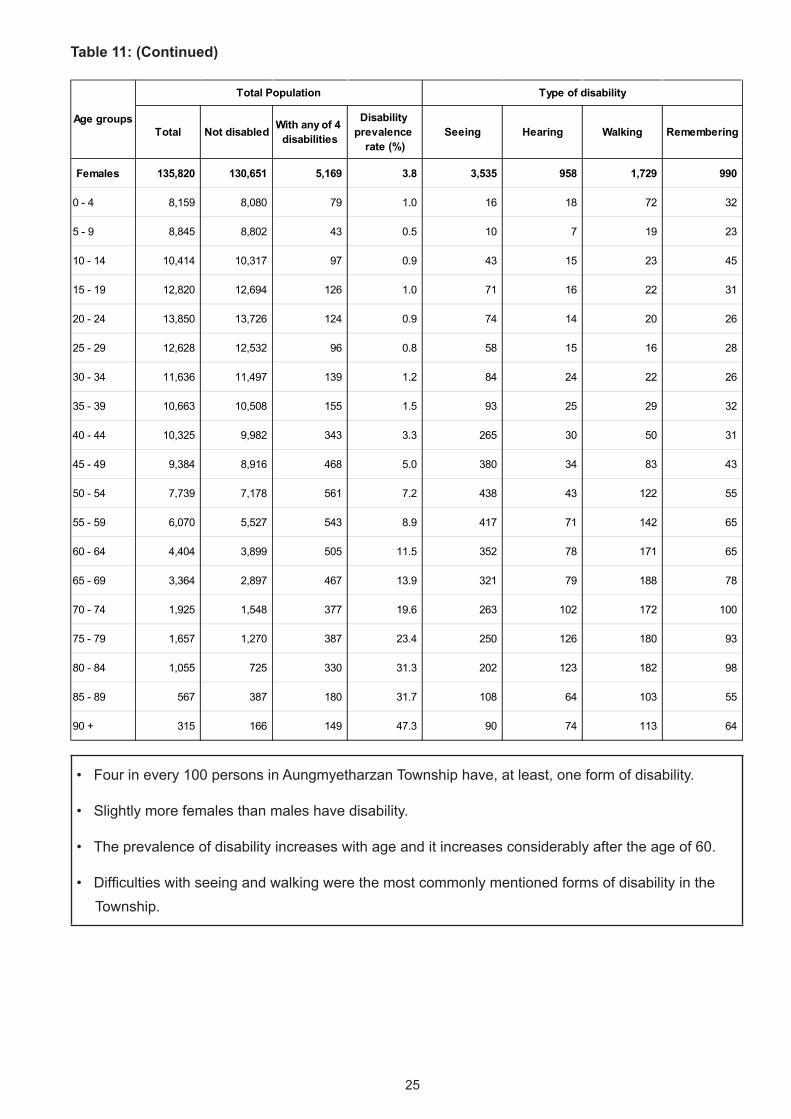
Table 11: (Continued)
• Four in every 100 persons in Aungmyetharzan Township have, at least, one form of disability.
• Slightly more females than males have disability.
• The prevalence of disability increases with age and it increases considerably after the age of 60.
• Difficulties with seeing and walking were the most commonly mentioned forms of disability in the Township.
Total Not disabled With any of 4 disabilities
Disability prevalence
rate (%)Seeing Hearing Walking Remembering
Females 135,820 130,651 5,169 3.8 3,535 958 1,729 990
0 - 4 8,159 8,080 79 1.0 16 18 72 32
5 - 9 8,845 8,802 43 0.5 10 7 19 23
10 - 14 10,414 10,317 97 0.9 43 15 23 45
15 - 19 12,820 12,694 126 1.0 71 16 22 31
20 - 24 13,850 13,726 124 0.9 74 14 20 26
25 - 29 12,628 12,532 96 0.8 58 15 16 28
30 - 34 11,636 11,497 139 1.2 84 24 22 26
35 - 39 10,663 10,508 155 1.5 93 25 29 32
40 - 44 10,325 9,982 343 3.3 265 30 50 31
45 - 49 9,384 8,916 468 5.0 380 34 83 43
50 - 54 7,739 7,178 561 7.2 438 43 122 55
55 - 59 6,070 5,527 543 8.9 417 71 142 65
60 - 64 4,404 3,899 505 11.5 352 78 171 65
65 - 69 3,364 2,897 467 13.9 321 79 188 78
70 - 74 1,925 1,548 377 19.6 263 102 172 100
75 - 79 1,657 1,270 387 23.4 250 126 180 93
80 - 84 1,055 725 330 31.3 202 123 182 98
85 - 89 567 387 180 31.7 108 64 103 55
90 + 315 166 149 47.3 90 74 113 64
Age groups
Total Population Type of disability
26
(G) Housing Conditions and Household Amenities
Type of housing unit
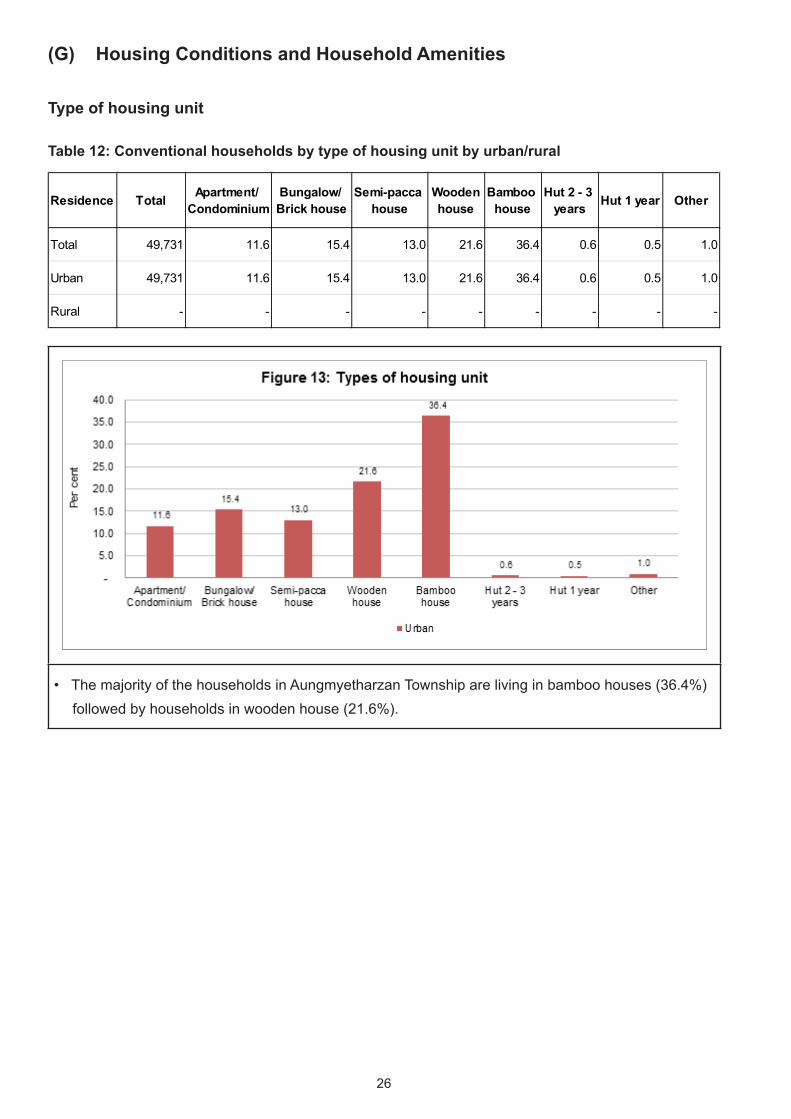
Table 12: Conventional households by type of housing unit by urban/rural
• The majority of the households in Aungmyetharzan Township are living in bamboo houses (36.4%) followed by households in wooden house (21.6%).
Residence Total Apartment/ Condominium
Bungalow/ Brick house
Semi-pacca house
Woodenhouse
Bamboo house
Hut 2 - 3 years Hut 1 year Other
Total 49,731 11.6 15.4 13.0 21.6 36.4 0.6 0.5 1.0
Urban 49,731 11.6 15.4 13.0 21.6 36.4 0.6 0.5 1.0
Rural - - - - - - - - -
27
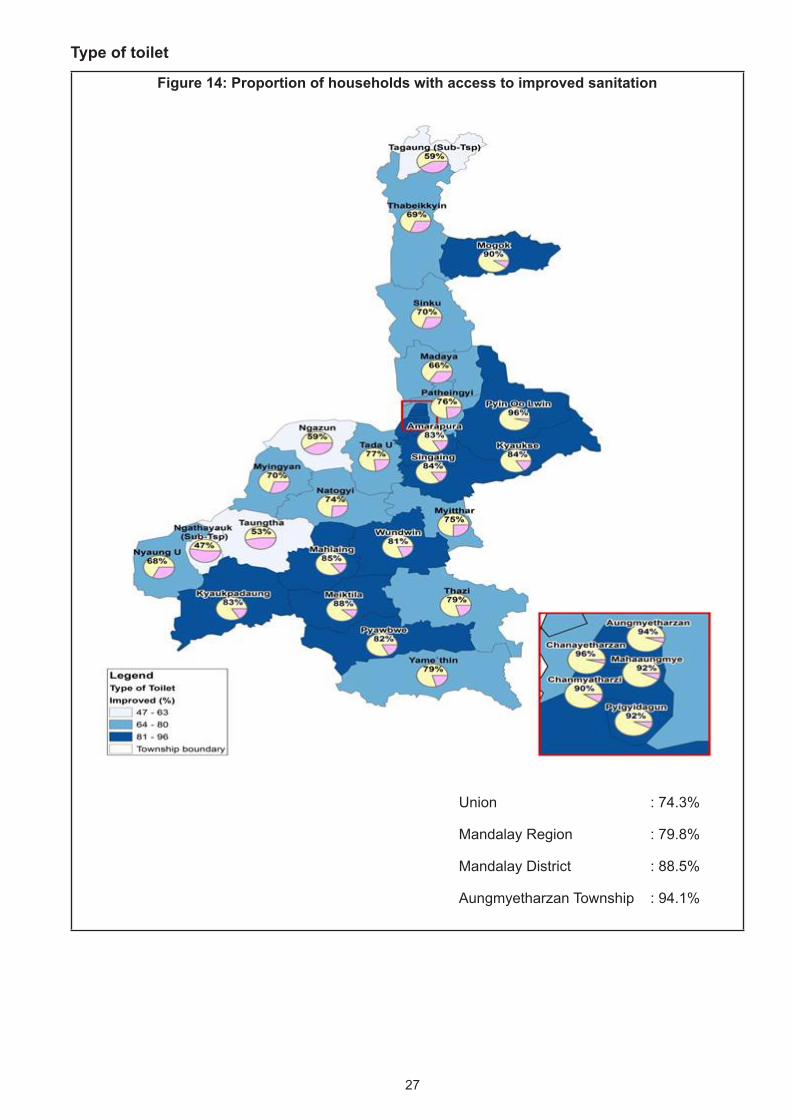
Type of toilet
Figure 14: Proportion of households with access to improved sanitation
Union : 74.3%
Mandalay Region : 79.8%
Mandalay District : 88.5%
Aungmyetharzan Township : 94.1%
28
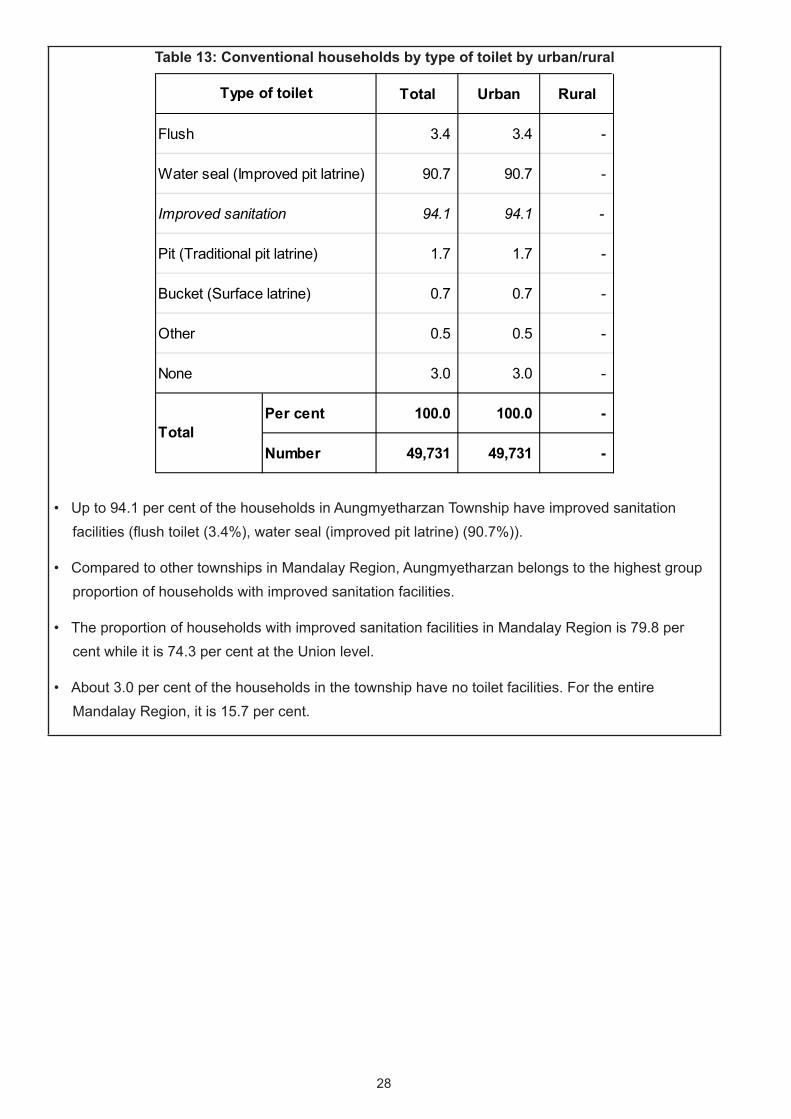
Table 13: Conventional households by type of toilet by urban/rural
• Up to 94.1 per cent of the households in Aungmyetharzan Township have improved sanitation facilities (flush toilet (3.4%), water seal (improved pit latrine) (90.7%)).
• Compared to other townships in Mandalay Region, Aungmyetharzan belongs to the highest group proportion of households with improved sanitation facilities.
• The proportion of households with improved sanitation facilities in Mandalay Region is 79.8 per cent while it is 74.3 per cent at the Union level.
• About 3.0 per cent of the households in the township have no toilet facilities. For the entire Mandalay Region, it is 15.7 per cent.
Total Urban Rural
3.4 3.4 -
90.7 90.7 -
94.1 94.1 -
1.7 1.7 -
0.7 0.7 -
0.5 0.5 -
3.0 3.0 -
Per cent 100.0 100.0 -
Number 49,731 49,731 -
Type of toilet
Total
Flush
Water seal (Improved pit latrine)
Improved sanitation
Pit (Traditional pit latrine)
Bucket (Surface latrine)
Other
None
29
Source of drinking water
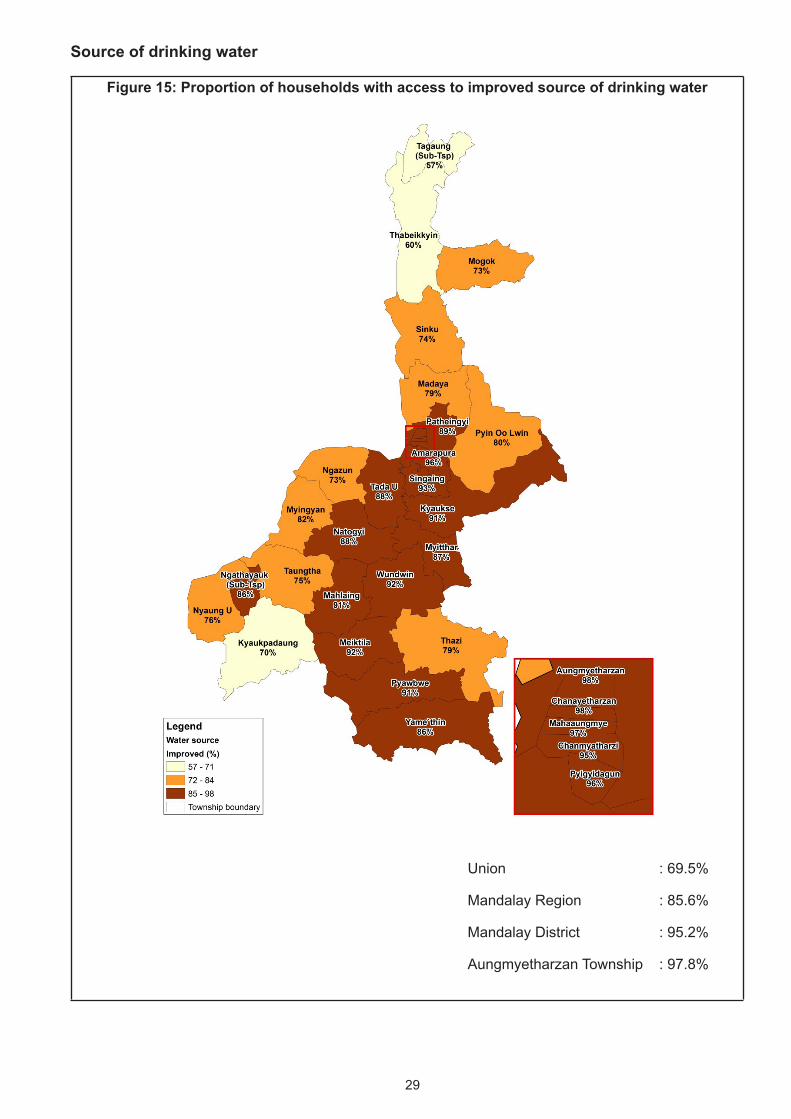
Figure 15: Proportion of households with access to improved source of drinking water
Union : 69.5%
Mandalay Region : 85.6%
Mandalay District : 95.2%
Aungmyetharzan Township : 97.8%
30
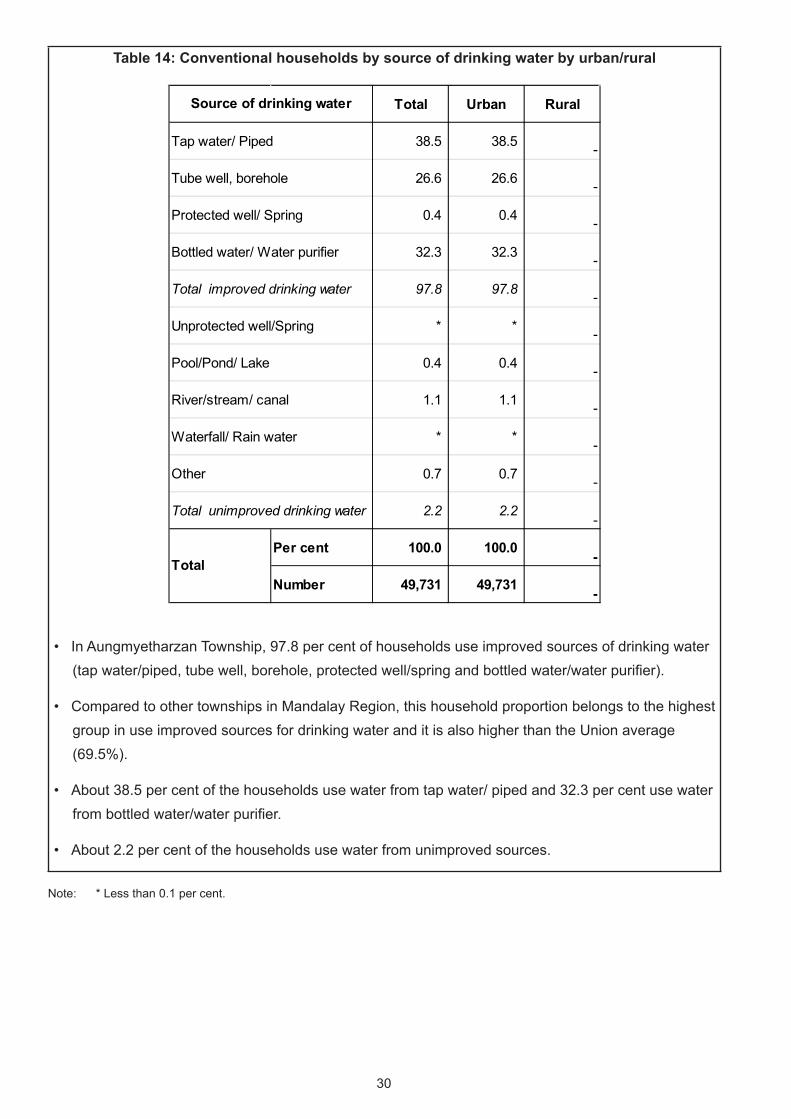
Table 14: Conventional households by source of drinking water by urban/rural
• In Aungmyetharzan Township, 97.8 per cent of households use improved sources of drinking water (tap water/piped, tube well, borehole, protected well/spring and bottled water/water purifier).
• Compared to other townships in Mandalay Region, this household proportion belongs to the highest group in use improved sources for drinking water and it is also higher than the Union average (69.5%).
• About 38.5 per cent of the households use water from tap water/ piped and 32.3 per cent use water from bottled water/water purifier.
• About 2.2 per cent of the households use water from unimproved sources.
Note: * Less than 0.1 per cent.
Total Urban Rural
38.5 38.5 -
26.6 26.6 -
0.4 0.4 -
32.3 32.3 -
97.8 97.8 -
* * -
0.4 0.4 -
1.1 1.1 -
* * -
0.7 0.7 -
2.2 2.2 -
Per cent 100.0 100.0 -
Number 49,731 49,731 -
Total
Unprotected well/Spring
Pool/Pond/ Lake
River/stream/ canal
Waterfall/ Rain water
Other
Total unimproved drinking water
Total improved drinking water
Source of drinking water
Tap water/ Piped
Tube well, borehole
Protected well/ Spring
Bottled water/ Water purifier
31
Source of lighting
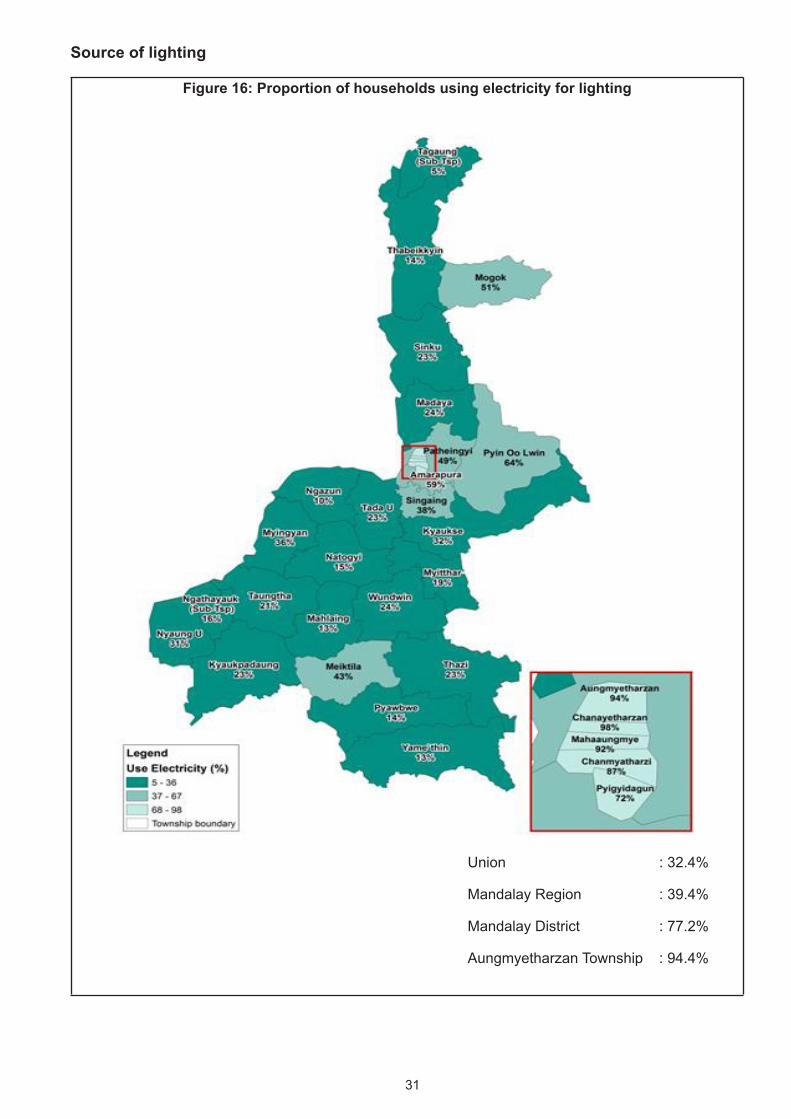
Figure 16: Proportion of households using electricity for lighting
Union : 32.4%
Mandalay Region : 39.4%
Mandalay District : 77.2%
Aungmyetharzan Township : 94.4%
32
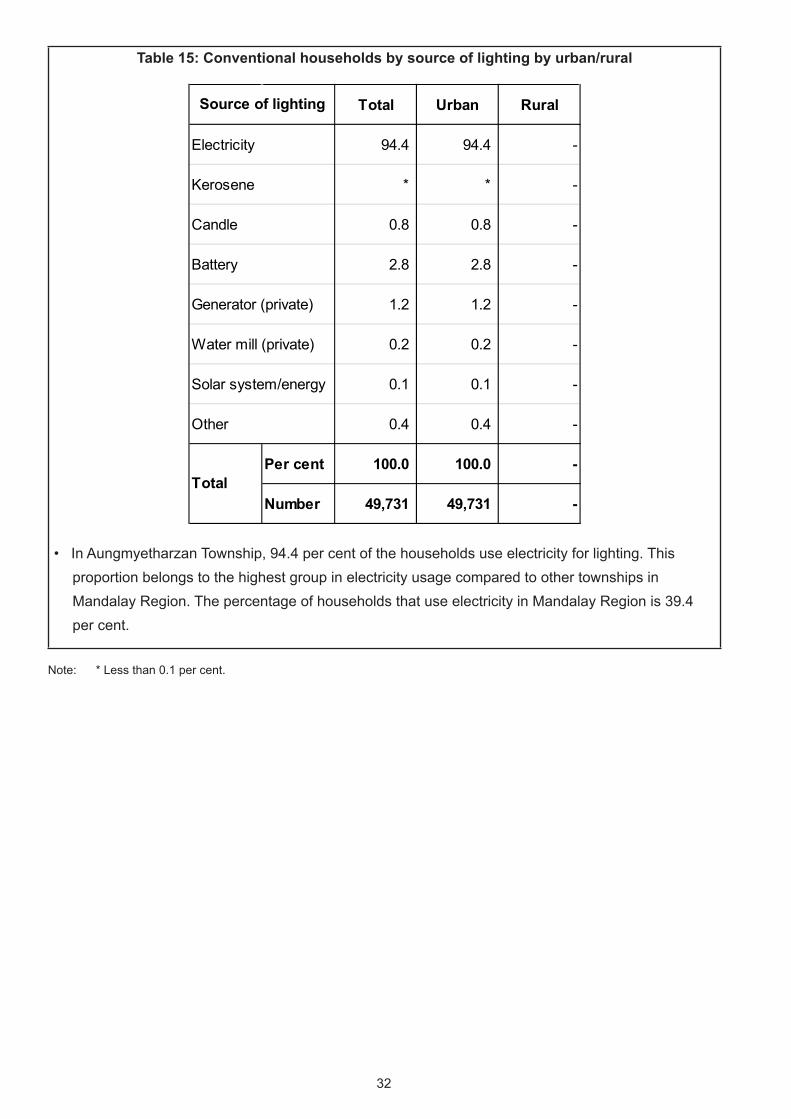
Table 15: Conventional households by source of lighting by urban/rural
• In Aungmyetharzan Township, 94.4 per cent of the households use electricity for lighting. This proportion belongs to the highest group in electricity usage compared to other townships in Mandalay Region. The percentage of households that use electricity in Mandalay Region is 39.4 per cent.
Note: * Less than 0.1 per cent.
Total Urban Rural
94.4 94.4 -
* * -
0.8 0.8 -
2.8 2.8 -
1.2 1.2 -
0.2 0.2 -
0.1 0.1 -
0.4 0.4 -
Per cent 100.0 100.0 -
Number 49,731 49,731 -
Water mill (private)
Solar system/energy
Other
Total
Source of lighting
Electricity
Kerosene
Candle
Battery
Generator (private)
33
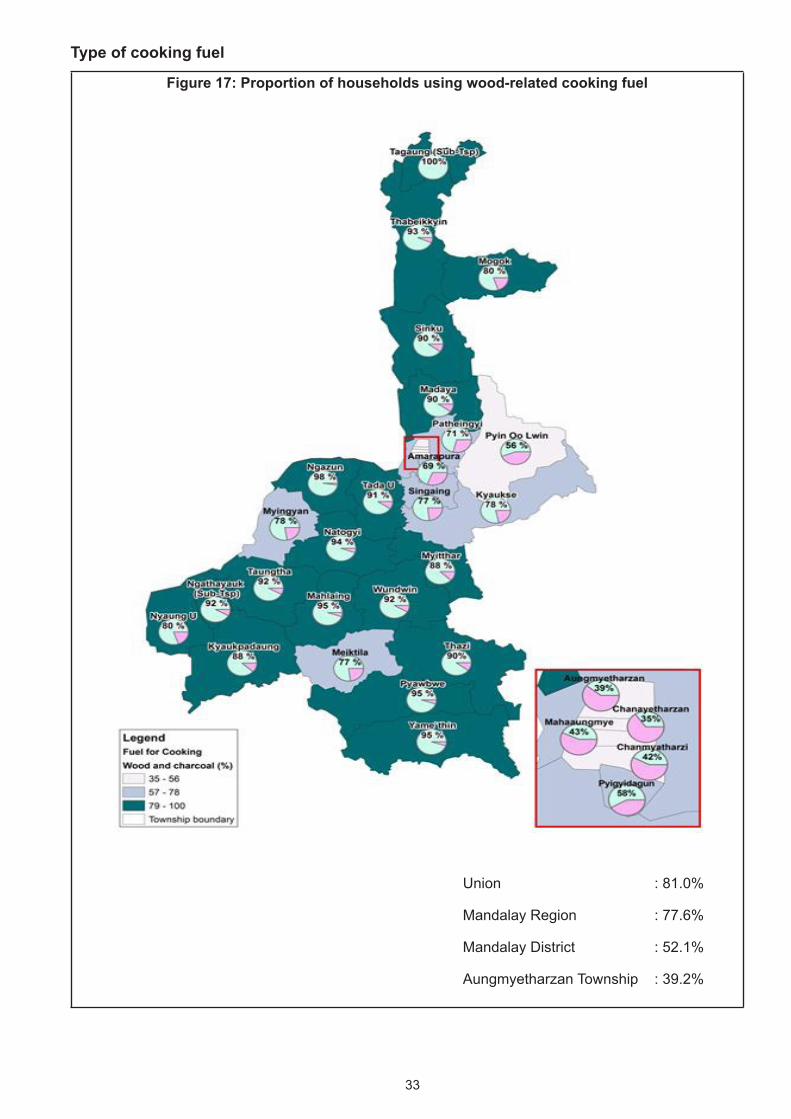
Type of cooking fuel
Figure 17: Proportion of households using wood-related cooking fuel
ပ
Union : 81.0%
Mandalay Region : 77.6%
Mandalay District : 52.1%
Aungmyetharzan Township : 39.2%
34
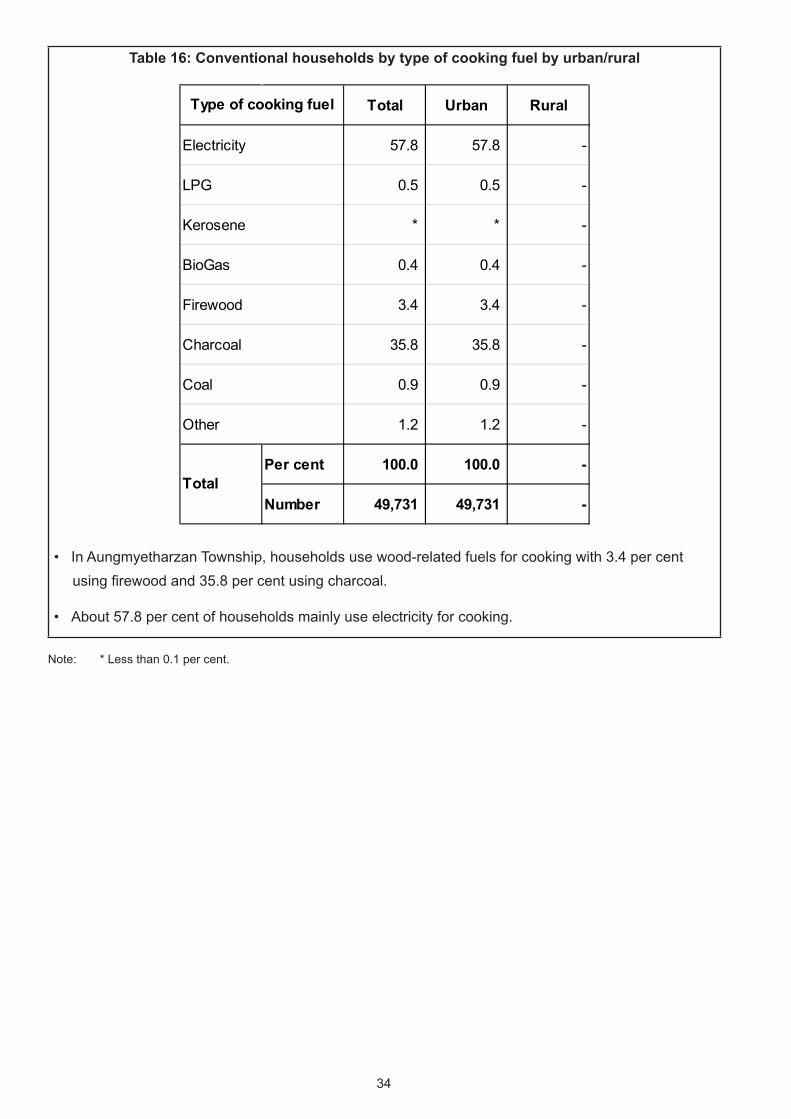
Table 16: Conventional households by type of cooking fuel by urban/rural
• In Aungmyetharzan Township, households use wood-related fuels for cooking with 3.4 per cent using firewood and 35.8 per cent using charcoal.
• About 57.8 per cent of households mainly use electricity for cooking.
Note: * Less than 0.1 per cent.
Total Urban Rural
57.8 57.8 -
0.5 0.5 -
* * -
0.4 0.4 -
3.4 3.4 -
35.8 35.8 -
0.9 0.9 -
1.2 1.2 -
Per cent 100.0 100.0 -
Number 49,731 49,731 -
Charcoal
Coal
Other
Total
Type of cooking fuel
Electricity
LPG
Kerosene
BioGas
Firewood
35
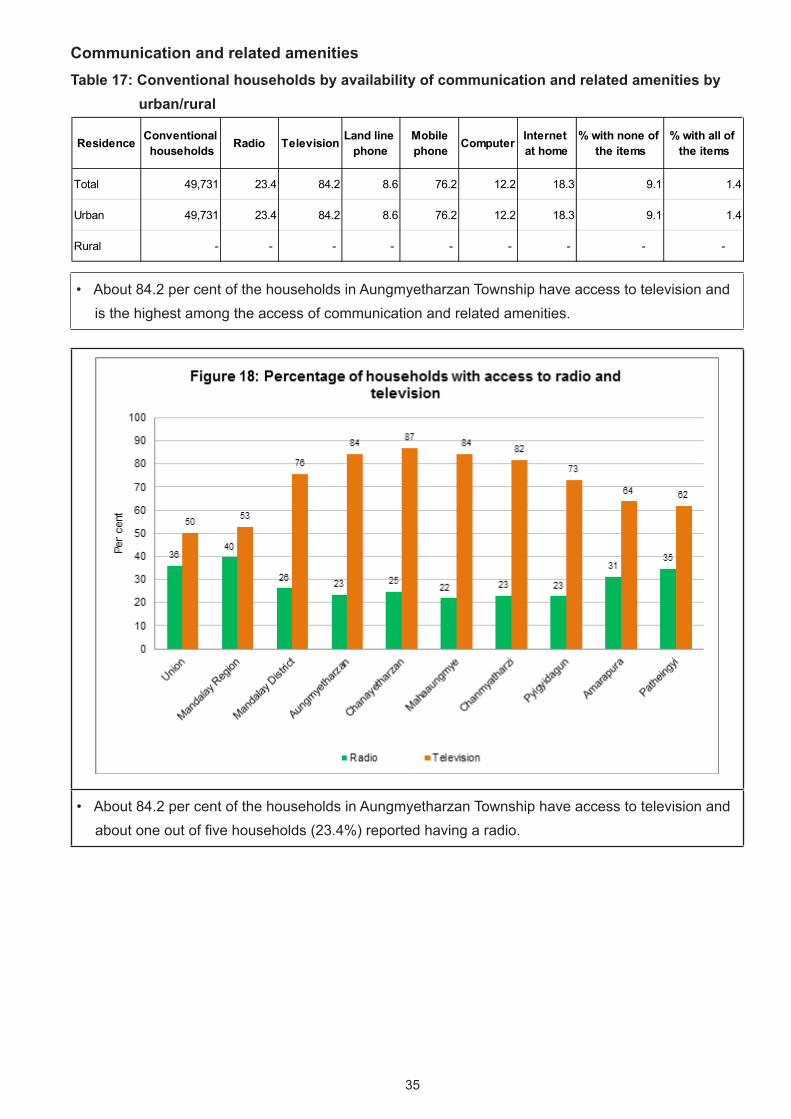
Communication and related amenitiesTable 17: Conventional households by availability of communication and related amenities by urban/rural
• About 84.2 per cent of the households in Aungmyetharzan Township have access to television and is the highest among the access of communication and related amenities.
• About 84.2 per cent of the households in Aungmyetharzan Township have access to television and about one out of five households (23.4%) reported having a radio.
Residence Conventional households Radio Television Land line
phoneMobile phone Computer Internet
at home% with none of
the items% with all of
the items
Total 49,731 23.4 84.2 8.6 76.2 12.2 18.3 9.1 1.4
Urban 49,731 23.4 84.2 8.6 76.2 12.2 18.3 9.1 1.4
Rural - - - - - - - - -
36
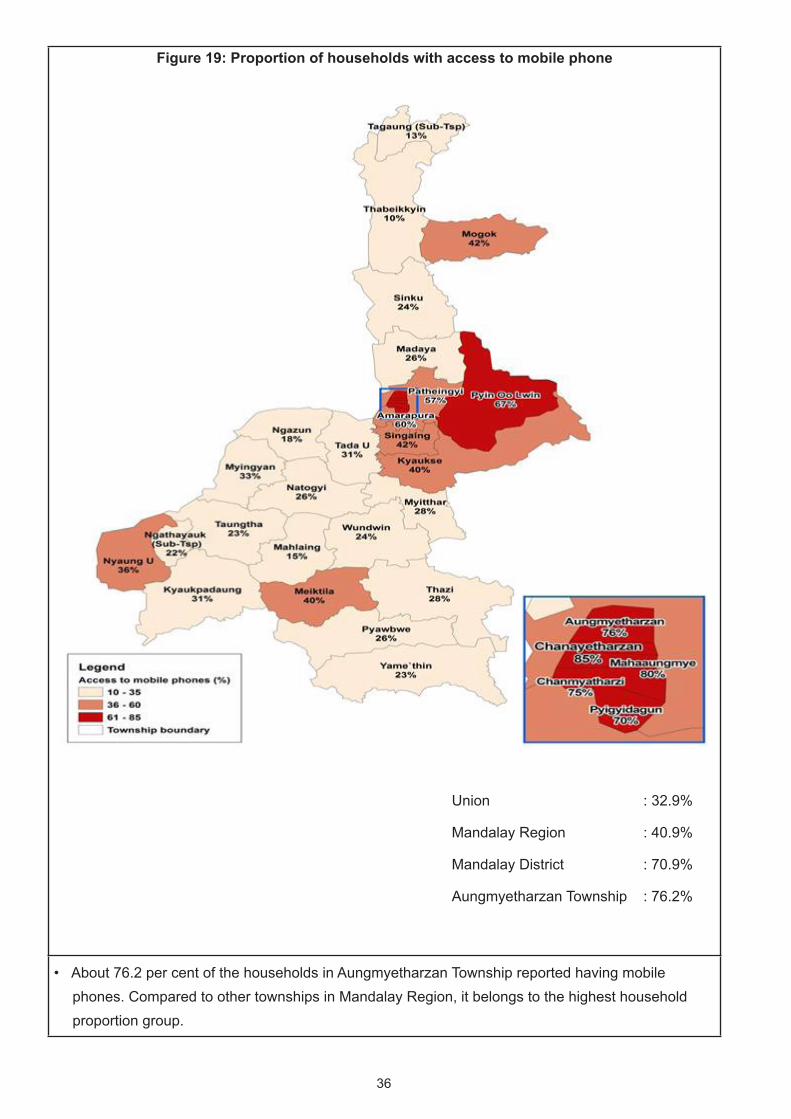
Figure 19: Proportion of households with access to mobile phone
• About 76.2 per cent of the households in Aungmyetharzan Township reported having mobile phones. Compared to other townships in Mandalay Region, it belongs to the highest household proportion group.
Union : 32.9%
Mandalay Region : 40.9%
Mandalay District : 70.9%
Aungmyetharzan Township : 76.2%
37
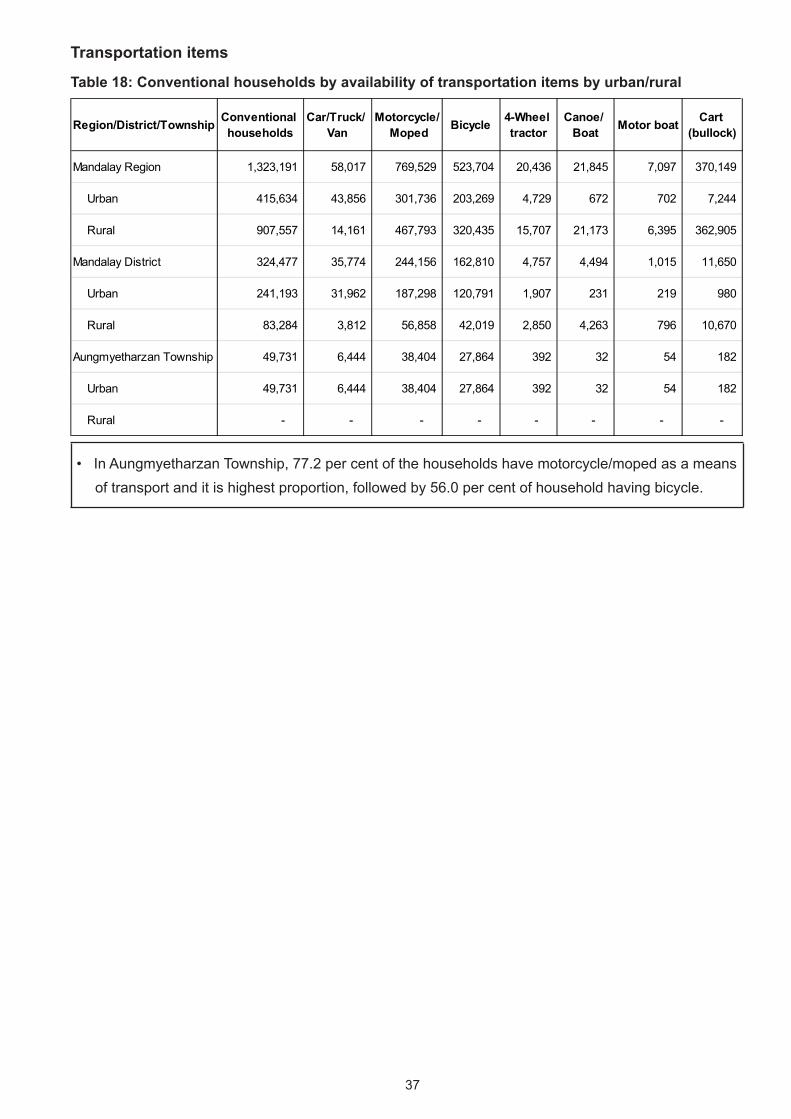
Transportation items
Table 18: Conventional households by availability of transportation items by urban/rural
• In Aungmyetharzan Township, 77.2 per cent of the households have motorcycle/moped as a means of transport and it is highest proportion, followed by 56.0 per cent of household having bicycle.
Region/District/Township Conventional households
Car/Truck/ Van
Motorcycle/ Moped Bicycle 4-Wheel
tractorCanoe/
Boat Motor boat Cart (bullock)
Mandalay Region 1,323,191 58,017 769,529 523,704 20,436 21,845 7,097 370,149
Urban 415,634 43,856 301,736 203,269 4,729 672 702 7,244
Rural 907,557 14,161 467,793 320,435 15,707 21,173 6,395 362,905
Mandalay District 324,477 35,774 244,156 162,810 4,757 4,494 1,015 11,650
Urban 241,193 31,962 187,298 120,791 1,907 231 219 980
Rural 83,284 3,812 56,858 42,019 2,850 4,263 796 10,670
Aungmyetharzan Township 49,731 6,444 38,404 27,864 392 32 54 182
Urban 49,731 6,444 38,404 27,864 392 32 54 182
Rural - - - - - - - -
38
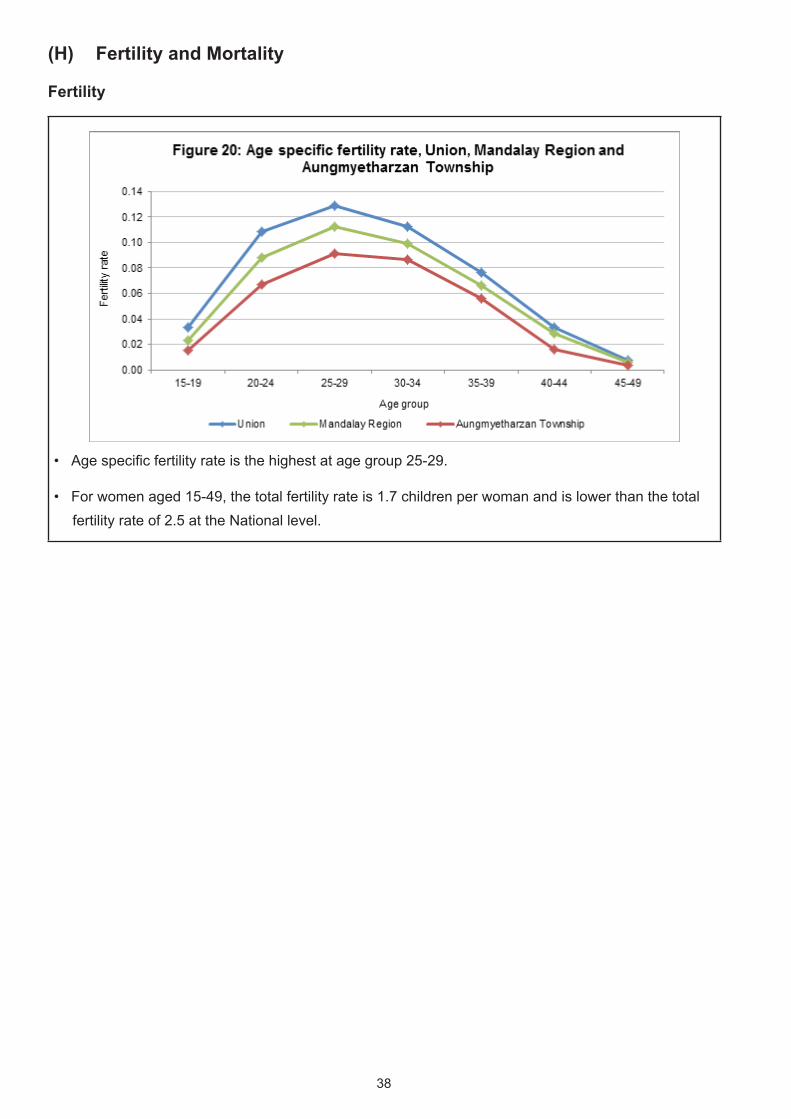
(H) Fertility and Mortality
Fertility
• Age specific fertility rate is the highest at age group 25-29.
• For women aged 15-49, the total fertility rate is 1.7 children per woman and is lower than the total fertility rate of 2.5 at the National level.
39
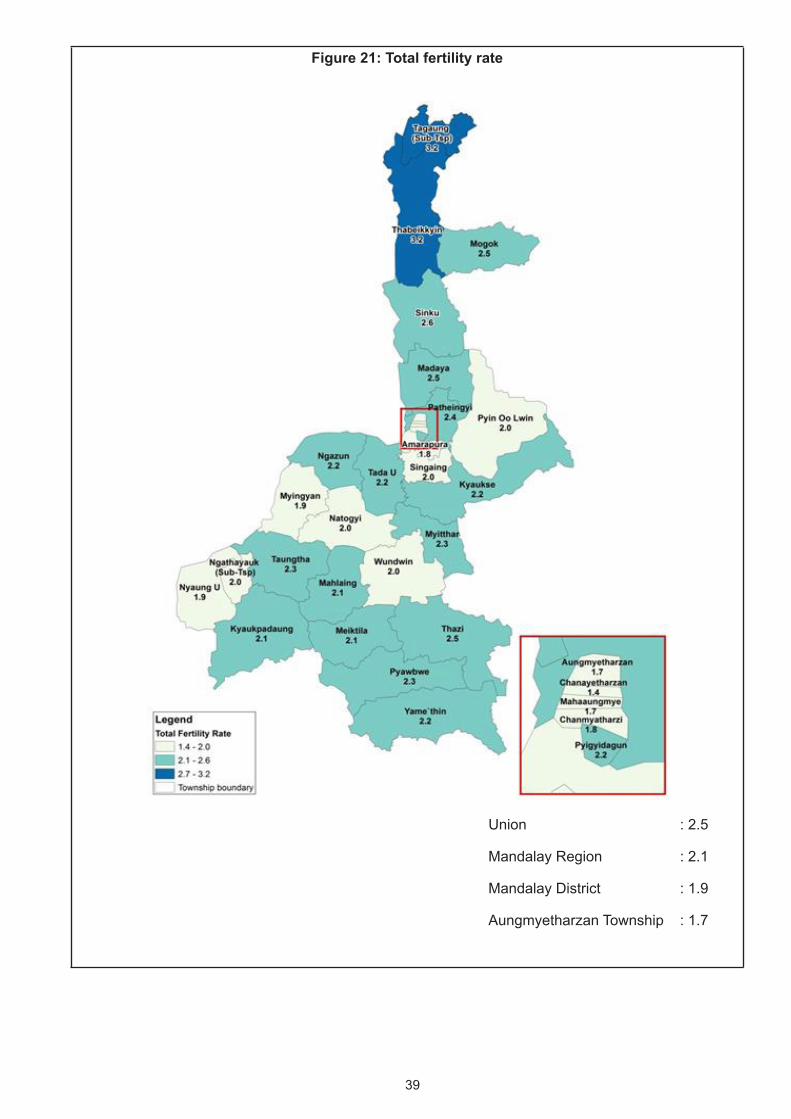
Figure 21: Total fertility rate
Union : 2.5
Mandalay Region : 2.1
Mandalay District : 1.9
Aungmyetharzan Township : 1.7
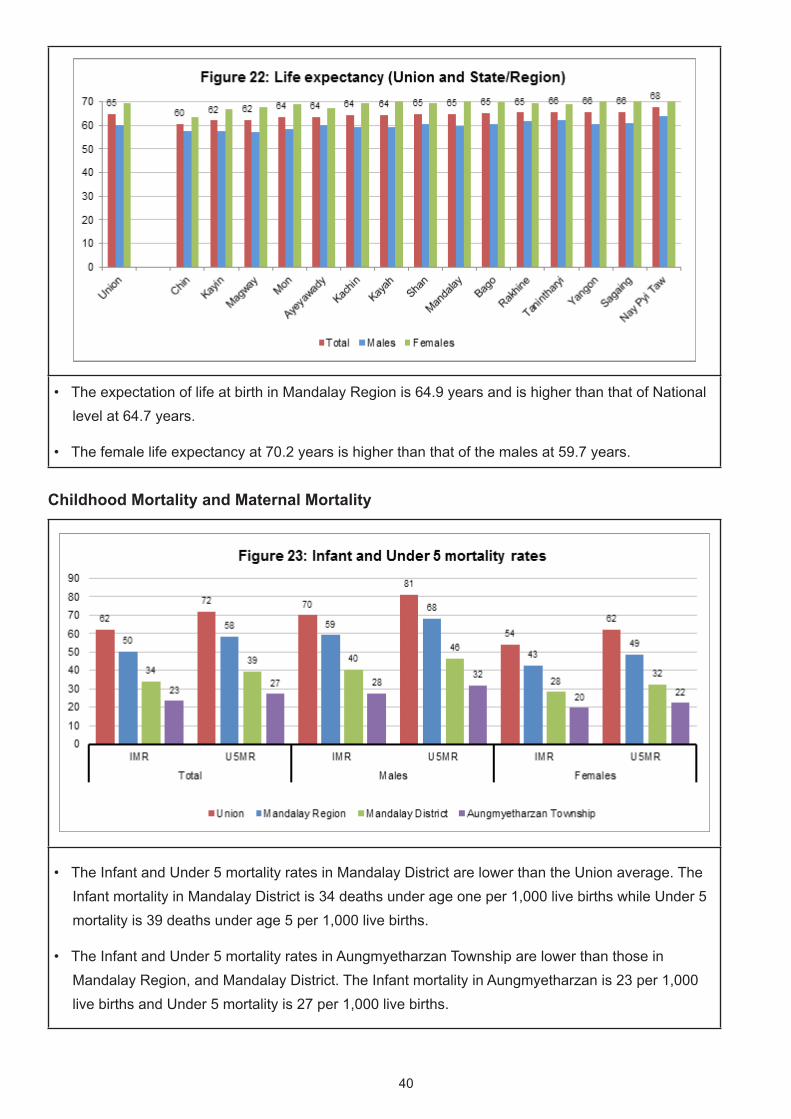
40
• The expectation of life at birth in Mandalay Region is 64.9 years and is higher than that of National level at 64.7 years.
• The female life expectancy at 70.2 years is higher than that of the males at 59.7 years.
Childhood Mortality and Maternal Mortality
• The Infant and Under 5 mortality rates in Mandalay District are lower than the Union average. The Infant mortality in Mandalay District is 34 deaths under age one per 1,000 live births while Under 5 mortality is 39 deaths under age 5 per 1,000 live births.
• The Infant and Under 5 mortality rates in Aungmyetharzan Township are lower than those in Mandalay Region, and Mandalay District. The Infant mortality in Aungmyetharzan is 23 per 1,000 live births and Under 5 mortality is 27 per 1,000 live births.
41
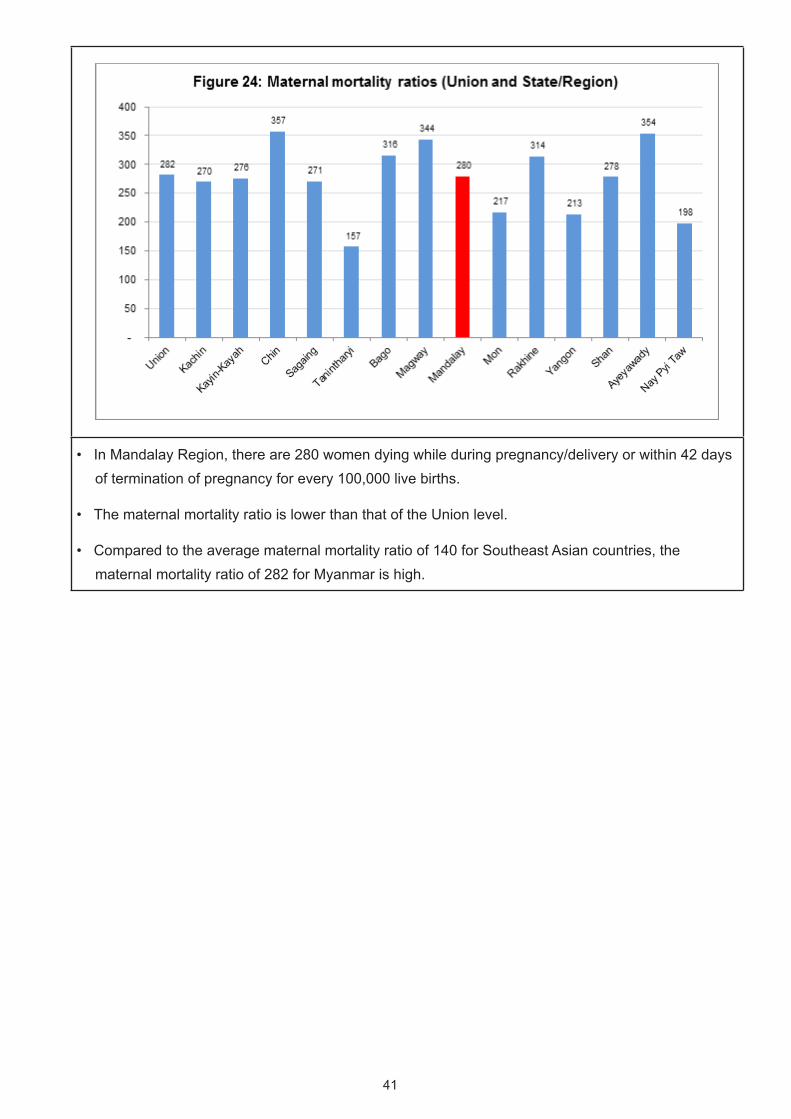
• In Mandalay Region, there are 280 women dying while during pregnancy/delivery or within 42 days of termination of pregnancy for every 100,000 live births.
• The maternal mortality ratio is lower than that of the Union level.
• Compared to the average maternal mortality ratio of 140 for Southeast Asian countries, the maternal mortality ratio of 282 for Myanmar is high.
42
Definitions and Concepts
Population: The population in this report corresponds to the de-facto population of Myanmar on Census Night (see below).
Census Night: The night between the 29th and the 30th March 2014. Every person in Myanmar was enumerated where they spent the Census Night.
Rural area: Areas classified by the Department of General Administration (GAD) as village tracts. Generally these are areas with low population density and a land use which is predominantly agricultural.
Urban area: Areas classified by the GAD as wards. Generally these areas have an increased density of building structures, population and better infrastructural development.
Population Density: The population density relates to the number of persons in a given administrative area to the surface of the area, expressed in square kilometres (Km2). Areas covered by water are excluded from the calculation.
Mean Household Size: The average number of persons per household (people living in households divided by number of conventional households).
Sex ratio: The number of males for every 100 females in a population.
Dependency ratio: The total dependency ratio is the ratio of dependents (people younger than 15 years and older than 64) to the population of working-age (age 15-64). Data are shown as the proportion of dependents per 100 working-age population. Three different measures can be calculated: total dependency ratio, child dependency ratio and old age dependency ratio.
Child Dependency Ratio: is the proportion of people younger than 15 years to the working age population (15-64).
Old Dependency Ratio: is the proportion of people older than 64 years to the working age population (15-64).
Ageing Index: The number of persons aged 65 years and over per 100 people under the age of 15 years.
Median Age: The age that divides a population into two numerically equal groups; that is, half the people are younger than this age and half are older.
Education: Education is the process by which people learn through instruction and teaching. The 2014 MPHC placed an emphasis on literacy skills, school attendance and educational attainment. The other categorisations used under education were:
(a) Literacy: The ability to read and write in any language with reasonable understanding.
(b) School attendance: The attendance at any regular educational institution or systematic instruction at any level of education during the last 12 months. This included schooling at pre-primary, primary, middle, high school and tertiary institutions of higher learning. The options were: (a) Currently attending; (b) Attended previously; (c) Never attended.
43
(c) Educational Attainment: The highest grade/standard/diploma/degree completed within the most advanced level attended in the education system of the country where the education was received. It covered both public and private institutions accredited by government.
Disability: Disability is a situation where a person is at a greater risk than the general population of experiencing restrictions in performing routine activities (including activities of daily living) or participating in roles (such as work) if no supportive measures are offered. The difficulties covered in the 2014 census included:
(a) Walking difficulty (wheel chairs, crutches, limping, problems climbing steps);
(b) Seeing difficulty (low vision, blind);
(c) Hearing difficulty (partially or completely deaf);
(d) Mental/Intellectual difficulty (slow learning development making it hard to compete with their counterparts at school, other mental conditions).
Identity card: An identity card is a document used to verify aspects of a person›s personal identity. There are several types of identity cards issued by the Government of Myanmar, and national passports in the case of foreigners.
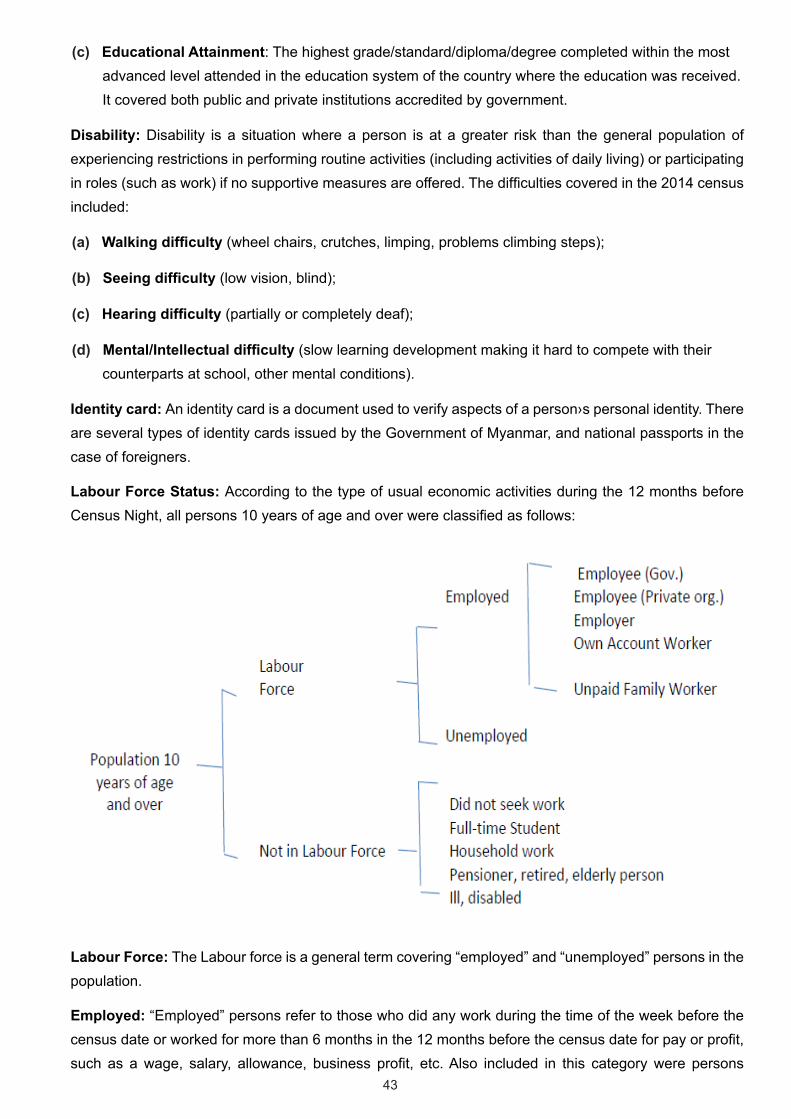
Labour Force Status: According to the type of usual economic activities during the 12 months before Census Night, all persons 10 years of age and over were classified as follows:
Labour Force: The Labour force is a general term covering “employed” and “unemployed” persons in the population.
Employed: “Employed” persons refer to those who did any work during the time of the week before the census date or worked for more than 6 months in the 12 months before the census date for pay or profit, such as a wage, salary, allowance, business profit, etc. Also included in this category were persons
44
working in family businesses, on a farm, in a store, in a private hospital etc., even though they were not paid any wages.
Unemployed: “Unemployed” persons refer to those who had no work but were able to work and actually seeking a job during the reference period, or at the time of the census enumeration.
Not in labour force: This category comprised persons who had no work and did not make any positive efforts to find a job during the 6 months before the census date or were unable to work. This included full time students, household work, elderly people, etc.
Employment Status: All employed persons were classified according to the economic activity status in the place where they worked during the last 12 months or if they worked in more than one place, where they worked most of the time. There were five employment categories:
(a) Employee (Government): those employed and working for government including in state organisation institutions.
(b) Employee (Private organisation): those employed and working for private employers or private organisations. All people in private companies, NGOs, international organisations, retail and wholesale enterprises fell under this category.
(c) Employer: persons who during the reference period worked in their own business, which also employed one or more other persons.
(d) Own account worker: self-employed persons who worked in their own business or worked in their own/family business for family gain and did not have any employees.
(e) Unpaid family worker: persons who worked in a business, farm, trade or professional enterprise operated by a member of the household/family and received no pay.
Labour force participation rate: The labour force participation rate is the ratio between the labour force and the overall size of the total population of the same age range. This is an important indicator as it portrays the proportion of the population that is economically active.
Labour force participation rate
=
Labour force (Employed + Unemployed) x 100
Total Population
Unemployment rate: The percentage of the total labour force that is unemployed but actively seeking employment and willing to work. These are people who are without work, looking for jobs and available for work.
Unemployment rate =Unemployed
x 100Labour force
(Employed + Unemployed)
45
Employment to population ratio: A statistical ratio that measures the proportion of the country’s working-age population (ages 15 to 64) that is employed. The International Labour Organization (ILO) states that a person is considered employed if they have worked at least 1 hour in “gainful” employment in the most recent week.
Employment to population ratio
=Employed
x 100Total Population
Occupation: Occupation refers to the kind of work an employed person did in the establishment during the 12 months (reference period) before the census date. Put differently, occupation is the kind of work done during the last 12 months by the person employed, regardless of the industry of the establishment. In the 2014 Myanmar Census, field data collectors were instructed to collect a detailed description of the work being done such as accounts clerk, data entry operator (clerk), legal secretary, domestic worker, fisherman, human resource manager, etc. If an employed person was engaged in two or more jobs, the kind of work was decided by the work in which he/she was mainly engaged in, that is in terms of time. The occupational classification is based on the ISCO 2008.
Industry: Industry refers to the main activity of the establishment where an employed person usually worked during the 12 months (reference period) before the census date. In the 2014 Myanmar Census, industry was explained to the enumerators as the type of economic activity carried out at the person’s place of work. It is defined in terms of the kind of goods produced or services supplied by the enterprise in which the person works and not necessarily the specific duties or functions of the person’s job. For example, a clerical officer working in stores within a factory that makes television sets. The industry should be recorded as manufacture of electrical goods. If an employed person worked in two or more establishments, “industry” was decided by the establishment where he/she worked most. The industrial classification is based on the ISIC Revision 4.
Live Birth: A live birth is one where the infant shows one or more of the following signs of life immediately after birth: crying or similar sounds, movement of the limbs or any other parts of the body and/or any other tangible signs of life. The census was concerned only with children born alive. Also collected was information on the last live birth of ever married female respondents.
Total fertility rate (TFR): The average number of children that a woman would give birth to if all women lived to the end of their childbearing years and bore children according to the current schedule of age-specific fertility rates.
Age specific fertility rate (ASFR): The age-specific fertility rate measures the annual number of births to women of a specified age or age group per 1,000 women in that age group. Unless otherwise specified, the reference period for the age-specific fertility rates is the calendar year.
46
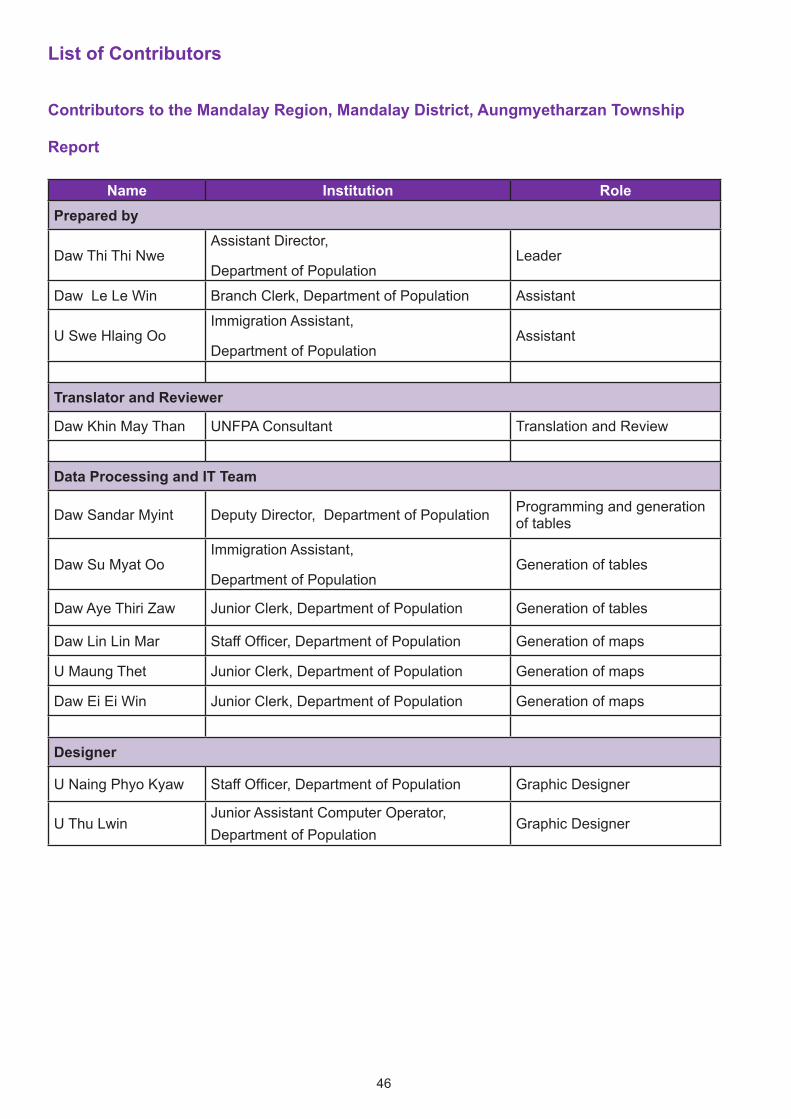
List of Contributors
Contributors to the Mandalay Region, Mandalay District, Aungmyetharzan Township
Report
Name Institution RolePrepared by
Daw Thi Thi NweAssistant Director,
Department of PopulationLeader
Daw Le Le Win Branch Clerk, Department of Population Assistant
U Swe Hlaing OoImmigration Assistant,
Department of PopulationAssistant
Translator and Reviewer
Daw Khin May Than UNFPA Consultant Translation and Review
Data Processing and IT Team
Daw Sandar Myint Deputy Director, Department of Population Programming and generation of tables
Daw Su Myat OoImmigration Assistant,
Department of PopulationGeneration of tables
Daw Aye Thiri Zaw Junior Clerk, Department of Population Generation of tables
Daw Lin Lin Mar Staff Officer, Department of Population Generation of maps
U Maung Thet Junior Clerk, Department of Population Generation of maps
Daw Ei Ei Win Junior Clerk, Department of Population Generation of maps
Designer
U Naing Phyo Kyaw Staff Officer, Department of Population Graphic Designer
U Thu LwinJunior Assistant Computer Operator, Department of Population
Graphic Designer

48
The Townships Reports
can be downloaded at :
www.dop.gov.mm
or
http://myanmar.unfpa.org/census