Embed Size (px)
Citation preview

8/2/2019 Manege Rial Economics
http://slidepdf.com/reader/full/manege-rial-economics 1/74
Hi
No warranty is made as to the accuracy of the information contained in these notes. They are notes
taken from a live class and collection from the internet and as such inaccuracies are possible. This
site, nor any parties mentioned, will not accept any responsibilities or liability for actions taken based
upon these notes. Please consult professional legal advisors when making any business or legal
decision.
Do subscribe my blog for more MBA
notes and study materials and
presentations, projects.
www.dudoism.blogspot.com
P.S: Request for more notes on my blog i will post it up as soon as
possible
Knowledge is worth sharing don’thesitate to share it with your
friends....
Good luck!!!!
8/2/2019 Manege Rial Economics
http://slidepdf.com/reader/full/manege-rial-economics 2/74
Topics covered: Managerial economics: As per order (note : the
topics are not numbered)
1. What is Managerial Economics?
2. How does economic theory contribute to managerial decision ?
3. Define and explain the Economics with the Views of different economists?
4. Views of the economist : Explanation
5. Major economic problems
6. Macro and micro economics
7. Scale of production
8. Advantage and disadvantage of large scale production
9. Joint Stock company
10.Difference between public limited company and private company
11.Utility
12.Marginal utility
13.Characteristics affecting consumer behaviour
8/2/2019 Manege Rial Economics
http://slidepdf.com/reader/full/manege-rial-economics 3/74
14.Law of diminishing marginal utility
15.Importance of law of Consumption
16.Factors of production
17.Problems in Organisation
18.Localisation of Industry
19.Demand forecasting objectives
20.Price Discrimination
21.isoquant curves
22. Multi product pricing
23.Profit constraint and revenue maximisation
24.Demand analysis
25. What is the basic objectives of a firm? Explain the role and responsibility on
Managerial Economics?
26. Profit business objective
27. Maximisation of Managerial Utility function
28. Short Run & Long Run
29. Nature Marginal analysis
30. What are the main techniques of demand estimation? What is their reliability?
31. Trend Projection
32. 10 principles of Economics
33. Explain Baumol’s theory of sales revenue maximization
34. Theory of capital and investment decision.
35. What do you understand by Opportunity cost ?
What is Managerial Economics?
8/2/2019 Manege Rial Economics
http://slidepdf.com/reader/full/manege-rial-economics 4/74
Economics is a social science, which studies human behavior in relation to optimizing
allocation of available resources to achieve the given ends.
The application of economic science is all pervasive. More specifically economic laws and
tools of economic analysis are applied a great deal in the progress of business decision
making. This has led to the emergence of a separate branch of study called Managerial
Economics.
“Managerial Economics is the study of economics theories, logic and tools of economic
analysis that are used in the process of business decision making. Economic theory and
technique of economic analysis are applied to analyse business problems, evaluate business
options and opportunities with a view to arriving at appropriate business decision. Managerial
economic is thus constituted as that part of economic knowledge, logic, theories and
analytical tools that are used for rational business decision making .
How does economic theory contribute to managerial decision ?
Economics through ,variously defined is essentially the study of logic, tools and techniques
of making optimum use of the available resources to achieve the given ends. Economics thus
provides analytical tool and technique that managers need to achieve the goals of the
organization they manage.
Baumaol has pointed out there main contributions of economic theory to business.
First one of the most important! Unexpected End of Formula things which the economic
theories can contribute to the management science is building analytical models which help
to recognize the structure of managerial problems, eliminate the minor details which might
obstruct decision making and help to concentrate on the main issue.
8/2/2019 Manege Rial Economics
http://slidepdf.com/reader/full/manege-rial-economics 5/74
Secondly, Economic theory contributes to the business analysis & set of analytical methods
which may not be applied directly to specific business problems, but they do entrance the
analytical capabilities of the business analyst.
Thirdly, Economic theories offer clarity to the various concepts used in business analysis,
which enables the the managers to avoid conceptual pitfalls.
The areas of business issues to which economics theories can be directly applied may be
broadly divided into two categories :-
1. Operational or internal issues and
2. Environmental or external issues
Operational problems are of internal nature. They include all those problems which arise
within the business organization and fall within the preview and control of the management.
Some of the basic internal issues are
1. choice of business and the nature of product i.e. what to produce;
2. choice of size of the firm i.e.. how much to produce
3. choice of technology i.e. choosing the factor contribution ;
4. choice of price i.e. how to price the common;
5. how to promote sales;
6. How to face price competition
7. How to decide on new investment;
8. How to manage profit and capital;
9. How to manage inventory i.e. stock of both finished goods and material.
The Microeconomic Theories which deals most of these questions include:-
8/2/2019 Manege Rial Economics
http://slidepdf.com/reader/full/manege-rial-economics 6/74
1. Theory of demand.
2. Theory of production and production decisions.
3. Analysis of market structure and pricing theory.
4. Profit analysis and profit management.
Define and explain the Economics with the Views of different
economists?
"A social science concerned with proper uses and allocation of resources for the achievementand maintenance of growth with stability"
Or
"It is an art of analyzing, recording, interpretation and communicating the results of economictransaction."
Or
"Economic is a social science concerned chiefly with way the societies chooses to employ itslimited recourses, which have alternative uses to produce goods and services for present antfuture consumption"
Or
"Economics is the study of how solidifies uses scare recourses to produce valuablecommodities and distribute them among different groups."
Views of Economists
According to Adam Smith: "Economic is science of wealth."
According to J.S.Smith: He supports the definition of Adam Smith.” Economic is the practical science of production and distribution of wealth."
According to J.E Cairnes: "Economics deal with phenomena of wealth."
Adven Canon: "The aim of political economy is explanations of general causes on which thematerial welfare of human being depend."
According to Marshall: "Economics is study of man’s action in ordinary business of life, it
Enquirer how he gets his income and how he spent it. Thus it is on the on the other and moreimportant side, a part of study of man."
8/2/2019 Manege Rial Economics
http://slidepdf.com/reader/full/manege-rial-economics 7/74
In this definition the expression “man’s’ action in ordinary business of life refers to the factsthat economic studies the activities of real, social and normal human beings.
While the expression” how he get income and how he spend it indicates the study of wealth.Marshall doesn’t indicate the nature of science. He maintained that economic is positive
science.
According to Robbins: "Economics is science which studies human behavior as a relationship b/w ends and scare means whish have alternative uses."
Explanation
The economists to explain the meaning of economics, which will be probably, proceed asfollows,
Economics studies only those activities, which are directly related to wealth:
Men have wants. Some wants are elemental and very pressing like the want of foodand water; other are less urgent, e.g., the want for a car or a beautiful bungalow. Allthese of different kinds as they are, have to be satisfied. Faced by this problem, menare driven to work in factories and fields, schools and offices, so that they may earnmoney by which they may purchase the article of their desire. All human activitiesrelated to wealth (mean to satisfy human wants directly) constitute the subject –matter of economics. That’s why they are called “ economic activities”.
It studies only human activities: Economics is concerned with the activities of human beings only, and not with those of other creatures. Other creatures either makeefforts themselves with a view to satisfy their wants but they are much below human
beings in mental power in intelligence and mental ability. Therefore their activitiesare not studied in economics. It studies the activities of only those Human beings whoare social, real and normal:
Economics is positive, Normative and Applied science: It should be rememberedthat Economics is science and science can be divided in three groups.
Positive science: This establishes relation b/w causes and effects.
Normative science: this setup idea.
Applied science: This prescribed rules for guide ness.
8/2/2019 Manege Rial Economics
http://slidepdf.com/reader/full/manege-rial-economics 8/74
Economics is science of all these three types.
It is positive science because it shows the connection b/w causes and effects of economic phenomena. It is normative science because it sets up ideas concerningwealth. It is applied science because it prescribed rules for achievement of material
prosperity.
Therefore the correct definition of economics is that in which above four points must bementioned.
“ It is positive, normative and applied science which studies those activities of social, real andnormal human beings, that are related to wealth“.
Major Economic Problems
Meaning of economic problem: In view of scarcity means at our disposal and multiplicity of ends we seek to achieve, the economic problem lies in making the best possible use of our recourses so as to get maximum satisfaction in the case of the customer and maximum outputor profit for the producer. Hence economic problem consist in making decision regarding theends to be perused and the goods to be produced and the means to be used for achievement of
certain ends.
• Fundamental Problem facing an economy
Following are the fundamental problem, which an economy has to tackle;
• What to produce: The first major decision relates to the quantity and the range of goods to be produced. Since recourses are limited, we must choose b/w differentalternative collection of goods and services that may be produced. It also implies the
allocation of recourses b/w the different types of goods, e.g. customer goods andcapital goods.
• How to produce: When you decide the quantity and types of goods to be produced.We must next decide the techniques of production to be used e.g. labour intensive or capital intensive.
8/2/2019 Manege Rial Economics
http://slidepdf.com/reader/full/manege-rial-economics 9/74
• For whom to produce: This means how the national product is distributed I- whoshould get how much. This is the problem of sharing of national product.
• Are the recourses economically used: This is the problem of economic efficiency or welfare maximization. There is to be no waste or misuse of recourses since they arelimited.
• Problem of full employment: Fullest possible use must be made of the availablerecourses. In other words, an economy must endeavor to achieve full employment notonly of labour but of all its recourses.
• Problem of growth: Another problem for an economy is to make sure that it keeps
expanding or developing so that it maintain conditions of stability. It is not to be staticits productive capacity must continue to increase. It is an under developed economy, itmust accelerate its process to growth.
Micro and Macro Economics
The study of economics is divided into two parts.
Micro Economics
Macro Economics
Micro economics: The word micro means a millionth part. Microeconomics is the study of the small part or component of the whole economy that we are analyzing. For example wemay be studying an individual firm or in any particular industry. In Microeconomics westudy of the price of the particular product or particular factor of the production.
The Micro Economics theory studies the behavior of individual decision-making units such
as consumers, recourse owners and business firms.
Importance of Micro & Macro Economics
It has both theoretical and practical importance, from the theoretical point of view, it explainsthe functioning of a free enterprise economy. It tells us how million of consumers and
producers in an economy take decision about the allocation of productive recourses andmillion of goods and services. As for the practical importance Micro economics in theformulation of economics policies calculate to promote efficiency in production and welfareof the masses.
8/2/2019 Manege Rial Economics
http://slidepdf.com/reader/full/manege-rial-economics 10/74
The role of Micro economics is both positive and normative; it not only tells how economyoperates but also how it should operate in to improve general welfare.
Macro Economics
Macro economics is the study of behavior of the economy as a whole. It examines the overalllevel of nations out put, employment, price and foreign trade.
Macroeconomics is concerned with aggregate and average of entire economy.
e.g. In Macro economics we study about forest not about tree.
In other words in macro economics study how these aggregates and averages of economy aswhole are determined and what causes fluctuation in them. For making of useful economic
policies for the nation macroeconomics is necessary.
We can summarize the objects of macroeconomics as follows.
1. A high and rising level of real output.
2. High employment and low unemployment, providing good jobs at high pay tothose
who want to work.
3. A stable or gently rising price level, with process and wages determined by free
Markets.
4. Foreign economic relations marked by stable foreign exchange rate and exportsmore
or less balancing imports.
Macro economics involves choice among alternative central objectives.
A nation can’t high consumption and rapid growth. To lower a high inflation rate requireseither a period of high unemployment and low output, or interfering with free marketsthrough wage-price policies. These difficult choices are among those that must be faced by
macroeconomic policy makes in any nation.
8/2/2019 Manege Rial Economics
http://slidepdf.com/reader/full/manege-rial-economics 11/74
MICRO ECONOMICS
• Micro economics is the study of small part of component of the whole economy.• Micro economics is called the price theory. It’s explained its composition, or
allocation of total production why more of something is produced than of others.• In Micro study about individual consumer behavior or individuals firm or what
happens in any particular industry.• If it be an analysis of price, we study about the price of a particular producer or of a
particular factor of production.• If it is demand we analysis demand of an individual or that of an industry.• Here we study the income of an individual.• It is both positive and normative science. It not only tells us how the economy
operates but also how it should be operated to promote general welfare.• It can not give an idea of the functioning of the economy as a whole example. An
individual industry may be flourishing whereas, the economy as a whole may belanguishing.
• It assumes full employment, which is rare phenomenon, at any state in the capitalistworld. It is therefore, an unrealistic assumption.
• Study of individual aspects of economy will lead us now here.
MACRO ECONOMICS
• Macro economics is the study and analysis of economic system as a whole• Macro economics is called income theory. It explains the level of total production and
why the level rises and fall.• In Macro we study how the aggregates and the averages of the economy as whole is
determined and what causes fluctuation in them.• In macro we study the general price level in country.• In macro we study the aggregate demand of the entire country.• Here we study the national income of the country.• It shows how an economy grows. It gives bird eye view of economic world.• Individual ignored altogether. It is individual welfare, which is the main aim of
economics. Increasing national saving at the expense of individual welfare is not awise policy.
• It over looks individual differences for instance, the general price level may be stable but the prices of food grains may have gone spelling ruin to the poor.
• The economy as a whole is more important for formulation of useful economic
policies for the nation.
SCALE OF PRODUCTION
The scale of production has important bearing on the cost of the production. It ismanufactures common experience that larger the scale of production, the lower generally theaverage cost of production. That is why the entrepreneur id tempted to average the scale of
production so that he may benefit from the resulting economics of scale. These economics are broadly speaking of two types:
1. Internal economics
2. External economics
8/2/2019 Manege Rial Economics
http://slidepdf.com/reader/full/manege-rial-economics 12/74
Internal economics:
Internal economics are those economics in production, those reductions in productioncost, which is accrue to the firm itself when it expands its output or enlarge it scale of
production. The internal economics arise within a firm as a result of its own
expansion independent of the size and expansion of the industry. The internaleconomics are simply due to the increase in the scale of the production. They arisefrom the use of methods which small firms don’t find it worthwhile to empty internaleconomics may be of the following types: large machine and he is a mechanicaladvantage in a use of large machine. Technical economics pertain not to the size of the firm but to a size of factory or establishment.
• Technical economics: They arise from the fact that it is easy to make the alarge machine, and there is a mechanical advantage in a the use of large machines.technical economics pertain not to size of the firm but to a size of a factory or establishment `• Managerial economics: Those economics arise from the certain of specialdepartments. They also result from the delegation of routine and details matter tosubordinates. The managerial expenses can be reduced by increasing the size of anestablishment under one management.• Commercial economics: They arise from the purchase of materials and scaleof goods. Large businesses have bargaining advantages and are accorded a
preferential treatment by the firms they deal with.• Financial economics: These economics arise from the fact that a big firm hasa better credit and can borrow on more favorable terms. Its share enjoys a wider market, which encourages a prospective investor.• Risk- bearing economics: A big firm can spread risks and can often eliminatethem. This it does by diversifying outputs.
External Economics:
External economics are those economics which accrue to each number firm as a resultof the expansion of the industry as a whole.
Various types of the external economics are given below:
• Economic of concentration: These economic are relate to advantages arisingfrom the availability of skilled workers, the provision o better transport an creditfacilities, stimulation of improvement , benefits from subsidiaries and so on.• Economics of information: These economics refer to the benefits which allfirms engaged in an industry derived from the publication of trade and technical
journals and from central research institution.• Economics of disintegration: When an industry grows, it becomes possibleto split up some of the processes which are taken over by specialist firms. For example, a number of con mills located in a particular locality may have the benefitof a separate calendaring plant.
8/2/2019 Manege Rial Economics
http://slidepdf.com/reader/full/manege-rial-economics 13/74
ADVANTAGE OF LARGE SCALE PRODUCTION
Efficient use of capital equipment: There is large scope for use of machinery, whichresults in lower costs. A Large producer can install an up-to- date and expensive machinery.He can also have own repairing unit. Specialized in machinery can be employed for each job.
The result is that production is very economical. Small producer with a small markets cantkeep the machinery continuous working. Keeping it idle is uneconomical.. A large Producer can work it continuously and reap resulting economies.
Using of specialized labour: Specialized labour produce a large output and of better quality. It is only in a large business organization that every person can be put on the job thathe can best perform.
Better utilization of special in management: The use of capable manager’s time inan enlarged scale production. His assistance and specialized may be used in a large-scale
production where his ability is more fruitful.
Economies of buying and selling: While purchasing raw material and other accessories , a big business can secure specially favorable term an account of its largecustom. He can attract customer by offering a greater variety and by ensuring prompt
execution of the orders, placed with it when he selling a product.
Economy in rent: A large-scale producer makes a saving in rent too. If the samefactory made to produce a large Quantity of goods, the same amount of rent is divided over alarge output. This means a smaller addition to the cost per unit in the form of rent.
Experiment and research: A large concern can afford to spend liberally on research
and experiments. Successfully research may lead to the discovery of cheaper process.
Advertisement and salesman ship: A big concern can afford to spent large amountof money on advertisement and salesmanship. Amount of money spent on advertisement per unit comes to a low figure when production is on large scale. Salesman can make a carefulstudy of individual markets and thus acquire a hold on new market or strengthen it on oldones.
8/2/2019 Manege Rial Economics
http://slidepdf.com/reader/full/manege-rial-economics 14/74
Utilization of by-products: A big producer will not have to throw away any of its by products or waste products. It will be able to make an economical use of them.
Meeting adversity: A big business can show better resistance in times of adversity.
It has much better recourses. Losses can easily bear.
Cheap credit: A large business can secure credit facilities at cheap rate. Its credit inthe money market is high and banks are only two willing to give advance. Low cost of creditreduces cost of production.
DISADVANTAGE OF LARGE SCALE PRODUCTION
Large –scale production is not without is disadvantages. Some of these disadvantages are:
Over-worked management: A large-scale producer cannot pay off that you canthink of full attention to every detail. costs often raise on account of the employees or wasteof material by them. This is due to the lack of supervision. Owing to laxity of control costs of
production go up. The management is overworked
Individual tastes ignored: Large-scale production is a mass production or standardized production. Goods of uniform quality are turned out irrespective of the
preferences of individual customers. Individual tastes are not therefore, satisfied. This resultsin a loss of custom.
Personal element: Paid employees generally manage a large-scale business. Theowner is usually absent. The sympathy and personal touch, which ought to exit between the
master and the men, are missing frequent misunderstandings lead to strikes and lack outs.This is positively harmful to the business.
Possibility of depression: large-scale production may result overhead production.Production may exceed demand and cause depression unemployment. It is not always easy or
profitable to dispose of a large output.
8/2/2019 Manege Rial Economics
http://slidepdf.com/reader/full/manege-rial-economics 15/74
Dependence on foreign market: A large-scale producer has generally to depend onforeign markets. The foreign markets may be cut of by war or some other political upheavalthis makes the business risky.
Cut throat competition: Large-scale producers must fight for the markets. These arewasteful competition, which does not to society. Many promising businesses are ruined bysenses competition. There is also competition and biddings for resorts and inputs.
International complications and war: When the large-scale producer operates on aninternational scale, their interest clash either on the score of markets or of materials. Thesecomplications sometimes lead to armed conflicts. Many a modem war a rose on account of scramble for materials & markets.
Lack of adaptability: A large scale producing units find its very difficult to switchon from one business to another, in a depression small firms are able to move away fromdeclining trades to flourishing ones easily. In this way they are able to avoid losses. Thisadaptability is lacking in a big business.
JOINT STOCK COMPANY
Association consisting of more than ten person formed for carrying on a banking businessand any association consisting of more than 20 person formed for the purpose of carrying onany business, is to be known as joint stock company
FEATURES
1. Share holders are limited to their shares.
2. More capital
3. Easily transferable share from person to person.
4. Board of directors runs the administration.
5. In public limited company the maximum member’s should be seven and there is no limitfor maximum number.
6. In private limited company the minimum numbers should be two and maximum is fifty.
7. Shares of profit are distributed according to their share valve. Some profit is kept reservefor future use
8/2/2019 Manege Rial Economics
http://slidepdf.com/reader/full/manege-rial-economics 16/74
8. Company does not discontinue due to expel of any member due to death, madness etc
9. Change of business is difficult because there are more legal restrictions
10. Every shareholder does not participate directly in the business
11. Company can sell its assets by its name.
Merits of Joint Stock Company
• Large mount of capital• Limited liability• Transfer of shares• Better management• Large scale business• Long life• Encouragement of investment• Services of experts• Auditing of accounts• Experiment and research• Democratic style
Demerits of Joint Stock Company
• Unsatisfactory management• Difference of opinions• Heavy expenses of formation• Lack of secrecy• Difference of interest• Heavy taxes: Tax paid by the company at the time of dividend distribution• Danger of fraud: From directors• Nepotism• Relation b/w employer and labors are sometime tense.• Individual choice is not concerned.
DIFFERENCE B/W PRIVATE LIMITED COMPANY AND PUBLIC LIMITED
COMPANY
Private limited company
8/2/2019 Manege Rial Economics
http://slidepdf.com/reader/full/manege-rial-economics 17/74
• Minimum No: are 7 and maximum have no restriction• The company can not start business after registration unless and until it get
registration certificate from Registrar office.• This company has to publish their prospectus for public or share holders and
debentures holder.
• The share holders can transfer their share easily.• This company has to submit prospectus to registrar office.• For administrative purpose this company must have 7 directors.• This company has to submit their accounts in registrar office.• For starting business this company should called a meeting after 3 and 6 months in
which a report is presented to shareholders.• The directors of this company should have to submit their detail of responsibility to
the Registrar.• The presennce of at least 7 promoters are necessary to start the business.
Public limited company
• Minimum no: are 2 and maximum are 50• This company can start business after getting registered.• This company is not title to publish any prospectus and can not sell its share for
common people.• The members can not transfer their shares.• This company has not to submit any prospectus to registrar office.• For administrative purpose this company must have 2 directors.• This company has no any restriction of this kind.• No need of calling any meeting before commencement of business• No need of submitting details of responsibility to registrar.• The presence of at least 7 promoters are necessary to start the business
UTILITY
Utility is the capacity of commodity to satisfy human wants.
Measure of utility
It is the fact of common experience that the utility of all commodities is not the same,some commodity have greater utility than others.
Utility cannot be directly measured
Economist doesn’t posses any accurate means or apparatus for measuring utility.
Money measure of utility
Economists have, however, is devised indirect method of measuring utility. The amount of that a person is prepared to pay for a commodity rather than go without it, is a measure of itsutility. Suppose you have a need of a pen for exams so badly that you are prepared to payeven 100 rupees for it, and then the utility of fountain pen is Rs.100.
8/2/2019 Manege Rial Economics
http://slidepdf.com/reader/full/manege-rial-economics 18/74
10.4 Want, utility and satisfaction are different Want creates utility, Utility is a measure of satisfaction and satisfaction is the object of utility and negotiation of want.
MARGINAL UTILITY
It is defined as the change in the total utility resulting form a one unit change in theconsumption of commodity per unit of time.
When man is purchasing a commodity, he is consciously or weighting in h9is mind the pricehe has to pay and the utility of each unit that he buys.
He will continue purchasing till the marginal utility equals the price. Here is a fundamental proposition of the theory of customer demand. A consumer will exchange money for units of any commodity A, up to the point where the last (marginal) unit of A which he buys has for him a marginal significance in terms of money just equal to its money price.
BASIC ASSUMPTION OF MARGINAL UTILITY
Cardinal Measurement of utility
Marginal utility analysis assumes in the first place that utility can be measured byassigning definite numbers such as 1,2,3,4, e.t.c. That is it is assumed that utility is thequantifiable entity. This means that a person can express the satisfaction derived from hisconsumption of commodity is quantitative terms. He can say, for instance, that for him thefirst unit of the commodity has utility equal to 10, the second unit 8, and so on, In this way, itis possible for a consumer to compare the utilities of different goods. Utility is usually
measured in imaginary units.
Utilities are independent
Marginal utility analysis assumes that the utilities are different commodities areindependent of one another. That is the utility of one commodity does not in any way affectthat of another. Thus according to this assumption, the utilities of various goods are additiveor separate utilities of various goods can be added to obtain the total sum of the utilities of allgoods consumed.
Constant marginal utility of money
Another important assumption of marginal utility analysis is that marginal utility of money remain constant can even though the quantity of money with the consumer isdiminished by the successive purchase made by him. It is assumed that while marginal utilityof a commodity varies with quantity of the commodity purchases their marginal utility of money remains throughout the same as the quantity of the goods purchase varies.
8/2/2019 Manege Rial Economics
http://slidepdf.com/reader/full/manege-rial-economics 19/74
Introspection
The marginal utility analysis also assumes that from ones own experience (judgingwhat happens in ones own mind), it is possible to draw inference about another person. Thisis self-observation applied to another person.
CHARACTERISTICS AFFECTING CONSUMER BEHAVIOUR
Culture
The set of basic values, perceptions, wants, and behavior learned by a member of society from family and other important institution.
Subculture
A group of people with shared value systems based on common life experiences andsituation.
Social classes
Relatively permanent and ordered divisions in the society whose members share similar values, interest and behaviors.
Reference group
Two or more people who interact to accomplish individual or mutual goals.
Family buying decision: Depending on the production and situation, individual familymembers exert different amount of influence.
Role of status: A person belongs to many groups-families, clubs, organization. The person position in each group can be defined in terms of both role and status.
Age and life cycle stage: People change the goods and services they buy over their life times.
Occupation: A person’s occupation affects the goods and services bought.
Economics situation: A person’s economic situation will affect product choice.
Life style: People coming from the same subculture, social class, and occupation may herequite different lifestyle. Life style is the person’s pattern of living as expressed in his or her
psycho graphics.
Personality and self-concepts: A person’s distinguishing psychological characteristics thatlead to relatively consistent and lasting responses to his or her own environmental.
Motivation: Motivators researchers collect in depth information from small samples of
consumers to uncover the deeper motives for their product choice.
8/2/2019 Manege Rial Economics
http://slidepdf.com/reader/full/manege-rial-economics 20/74
Perception: The process by which people select, organize, interpret information to form ameaningful picture of the world.
Learning: Changes in individual behavior arising from experience.
Belief : A descriptive thought that a person holds about something.
Attitude: A person consistently favorable or unfavorable evaluations, feelings and tendenciestoward an object or idea.
LAW OF DIMINISHING MARGINAL UTILITY
Satisfactions of human wants follow some very important laws and one of them in thelaw of diminishing marginal utility. The law refers to the common experience of everyconsumer. Suppose a person start-eating piece of bread one after another. The first toast giveshim great pleasure. By the time he start taking second, the edge of his appetite has been
blunted, and the second toast, meeting with a less urgent want, yield less satisfaction, thesatisfaction of third less than of the second, and soon. The additional satisfaction goes ondecreasing with every successive toast till it drops down to zero. If the customer is forced totake more the satisfaction may become negative or the utility may change in disutility.
Therefore, Law of diminishing utility may be stated as follow.
“Each unit of commodity gives, other things remaining the same, less utility tothe consumer than the foregoing unit.”
Marginal and total utility
The last unit of commodity consumed at any particular time is known as final or marginal utility. Example: If a man takes two oranges at the time, yielding 10 and 9 units of utility respectively, the second unit is marginal unit and its utility namely 9, is the marginalutility of oranges.
Essential conditions: Marginal utility is based upon two essential conditions:
Consumption should take place at any particular time or the act o consumption should beregular and unbroken.
The utility in question should be the utility of the marginal or final unit that is consumed.
Illustration: Suppose a big family consumes several kg of wheat at a time. If it purchases onlyone kg of wheat, then it would be the marginal unit, and its utility.
8/2/2019 Manege Rial Economics
http://slidepdf.com/reader/full/manege-rial-economics 21/74
Suppose it is 100, could be the marginal utility. If it is purchase another kg of wheat thensecond kg becomes the marginal unit, and its utility becomes the marginal utility. If thisfamily purchases 5 kg of wheat the marginal utility declines.
Total utility:
Definition: The sum of the utilities of all the commodities consumed at a particular time isknown as total utility.
Example: If you eat five oranges at the time the sum of the utilities of all the five orangeswill be the total utility.
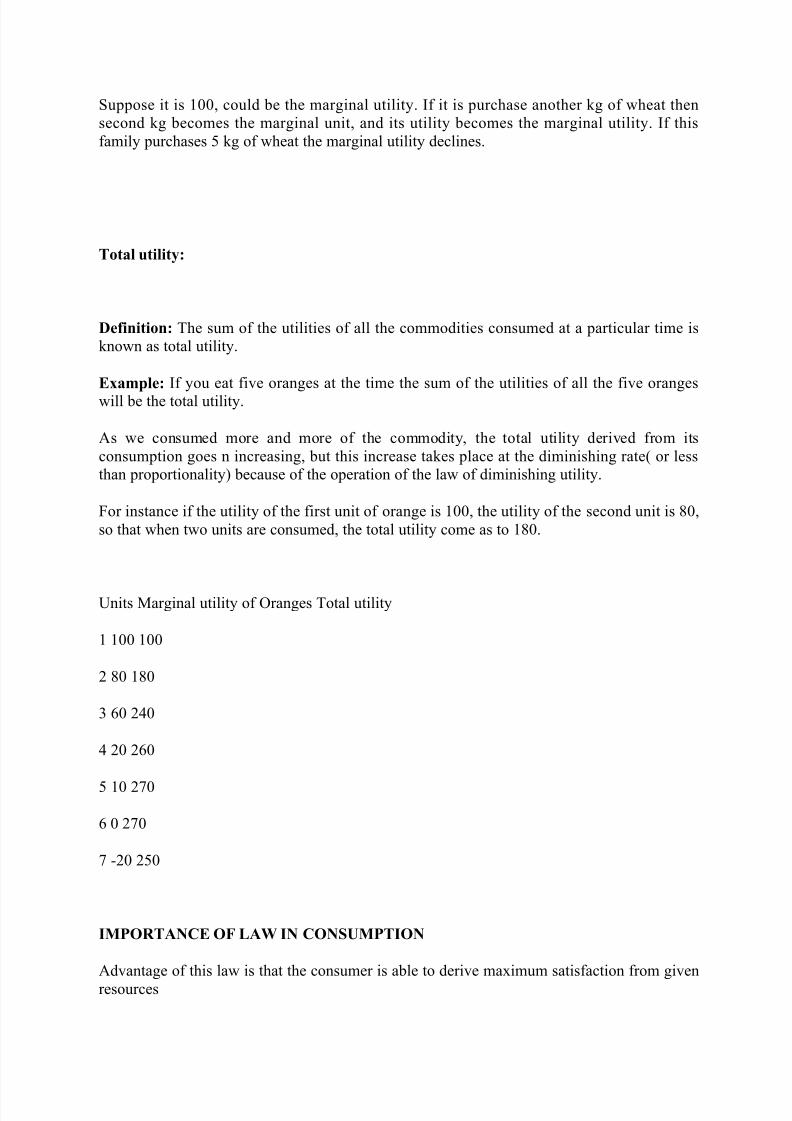
As we consumed more and more of the commodity, the total utility derived from itsconsumption goes n increasing, but this increase takes place at the diminishing rate( or lessthan proportionality) because of the operation of the law of diminishing utility.
For instance if the utility of the first unit of orange is 100, the utility of the second unit is 80,so that when two units are consumed, the total utility come as to 180.
Units Marginal utility of Oranges Total utility
1 100 100
2 80 180
3 60 240
4 20 260
5 10 270
6 0 270
7 -20 250
IMPORTANCE OF LAW IN CONSUMPTION
Advantage of this law is that the consumer is able to derive maximum satisfaction from givenresources
8/2/2019 Manege Rial Economics
http://slidepdf.com/reader/full/manege-rial-economics 22/74
The consumer can apply this law in
• Spending money• Making use of commodity• Apportioning money income over present and future events.
• Allocating a commodity over present and future uses.•
Spending money: As we know that a person can obtain maximum satisfaction out of themoney that he spends by following this law.
He has only to take care that the derived from the last unit of money spent on each head isnearly the same.
Making use of commodity: This law can be made to apply to a commodity which hasseveral uses for instance, if we have 20 m of cloth, we can use for the preparation of shirts,kurtas or caps etc. The wire course will be to distribute cloth on these various use in such amanner as to derive, more or less, the same utility from the last meter of cloth devoted to each
purpose.
Present and future use of money: According to the law of equi-Marginal utility, one shouldapportion one’s income over saving and spending in such a way that the satisfaction yielded
by the last rupee in each case is, more or less, the same.
This would enable one to earn maximum satisfaction.
Present and future use of commodity: Sometimes a person uses only one part of acommodity, and sets aside another part for being used in future. Here, again he should actaccording to the law of Equi- Marginal utility. He should distribute the whole volume of thecommodity over present and future uses in such a manner that the satisfaction yielded bymarginal unit in each case is, more or less the same.
• It is equally important in the field of production where the producer is advised tosubstitute a cheaper factor of production for a dearer one.
• In exchange purchaser purchases the articles which gives them greater satisfaction for the same price and thus try to follow this law.
• In the sphere of the distribution, the law has an important bearing. The theory of equaldistribution of wealth, which is the basis of socialistic movements.
• In the public finance it is the guiding principle in the matter of revenue andexpenditure.
LAW OF EQUIMARGINAL UTILITY
8/2/2019 Manege Rial Economics
http://slidepdf.com/reader/full/manege-rial-economics 23/74
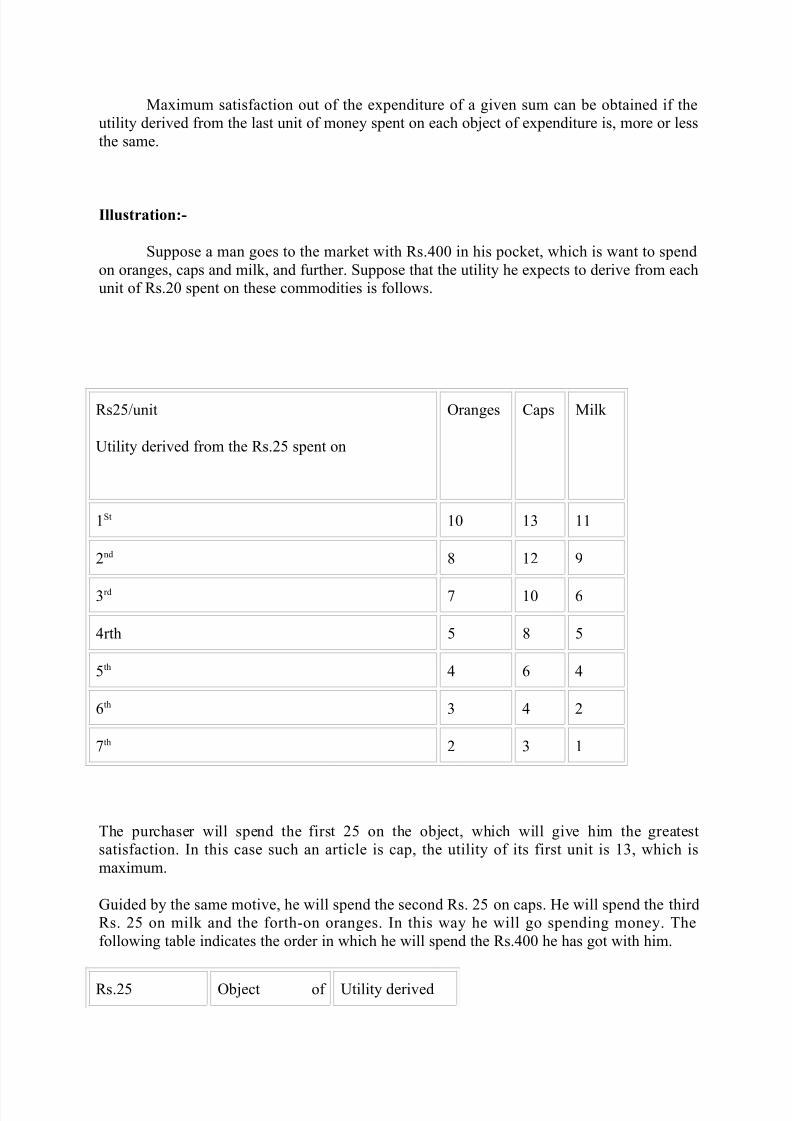
Maximum satisfaction out of the expenditure of a given sum can be obtained if theutility derived from the last unit of money spent on each object of expenditure is, more or lessthe same.
Illustration:-
Suppose a man goes to the market with Rs.400 in his pocket, which is want to spendon oranges, caps and milk, and further. Suppose that the utility he expects to derive from eachunit of Rs.20 spent on these commodities is follows.
Rs25/unit
Utility derived from the Rs.25 spent on
Oranges Caps Milk
1St 10 13 11
2nd 8 12 9
3rd 7 10 6
4rth 5 8 5
5th 4 6 4
6th 3 4 2
7th 2 3 1
The purchaser will spend the first 25 on the object, which will give him the greatestsatisfaction. In this case such an article is cap, the utility of its first unit is 13, which ismaximum.
Guided by the same motive, he will spend the second Rs. 25 on caps. He will spend the thirdRs. 25 on milk and the forth-on oranges. In this way he will go spending money. Thefollowing table indicates the order in which he will spend the Rs.400 he has got with him.
Rs.25 Object of Utility derived
8/2/2019 Manege Rial Economics
http://slidepdf.com/reader/full/manege-rial-economics 24/74
expenditure
1St Cap 13
2nd
Cap 12
3rd Milk 11
4rth Orange 10
5th Cap 10
6th Milk 9
7th Orange 3
8th Cap 8
9th Orange 7
10th Cap 6
11th Milk 6
12th Orange 5
13th Milk 5
14th Orange 4
15th Cap 4
16th Milk 4
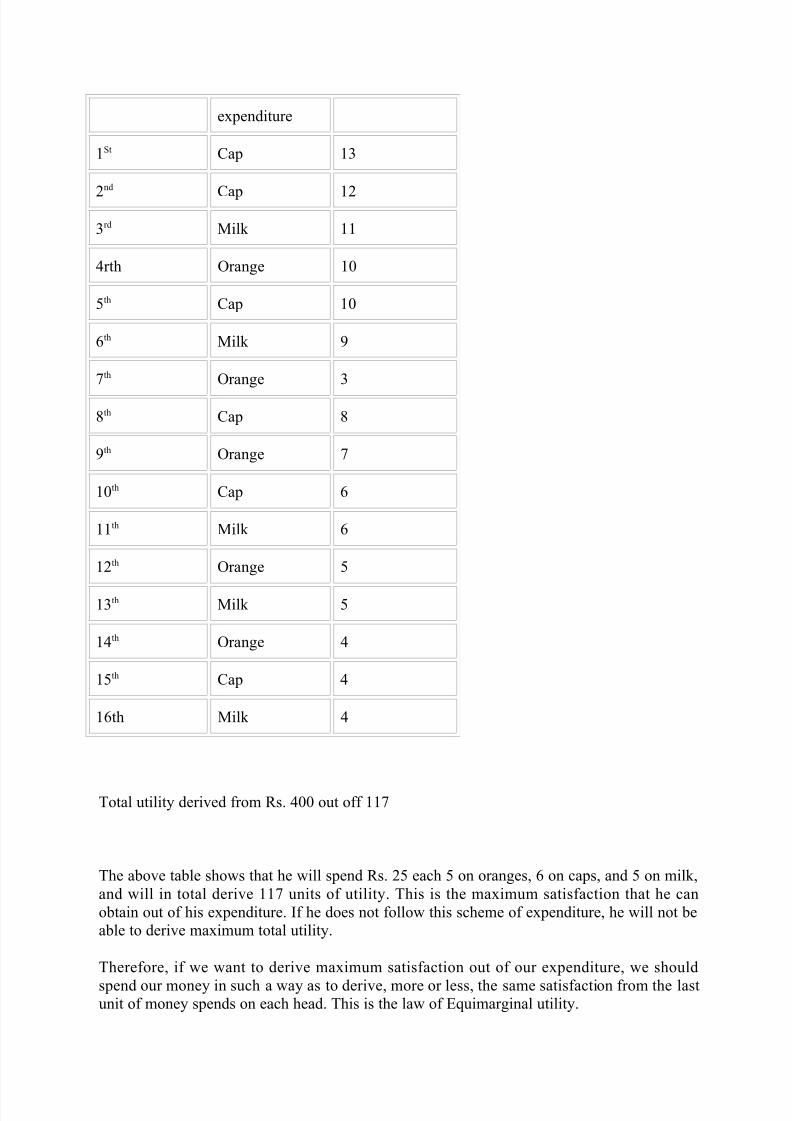
Total utility derived from Rs. 400 out off 117
The above table shows that he will spend Rs. 25 each 5 on oranges, 6 on caps, and 5 on milk,and will in total derive 117 units of utility. This is the maximum satisfaction that he canobtain out of his expenditure. If he does not follow this scheme of expenditure, he will not beable to derive maximum total utility.
Therefore, if we want to derive maximum satisfaction out of our expenditure, we should
spend our money in such a way as to derive, more or less, the same satisfaction from the lastunit of money spends on each head. This is the law of Equimarginal utility.
8/2/2019 Manege Rial Economics
http://slidepdf.com/reader/full/manege-rial-economics 25/74
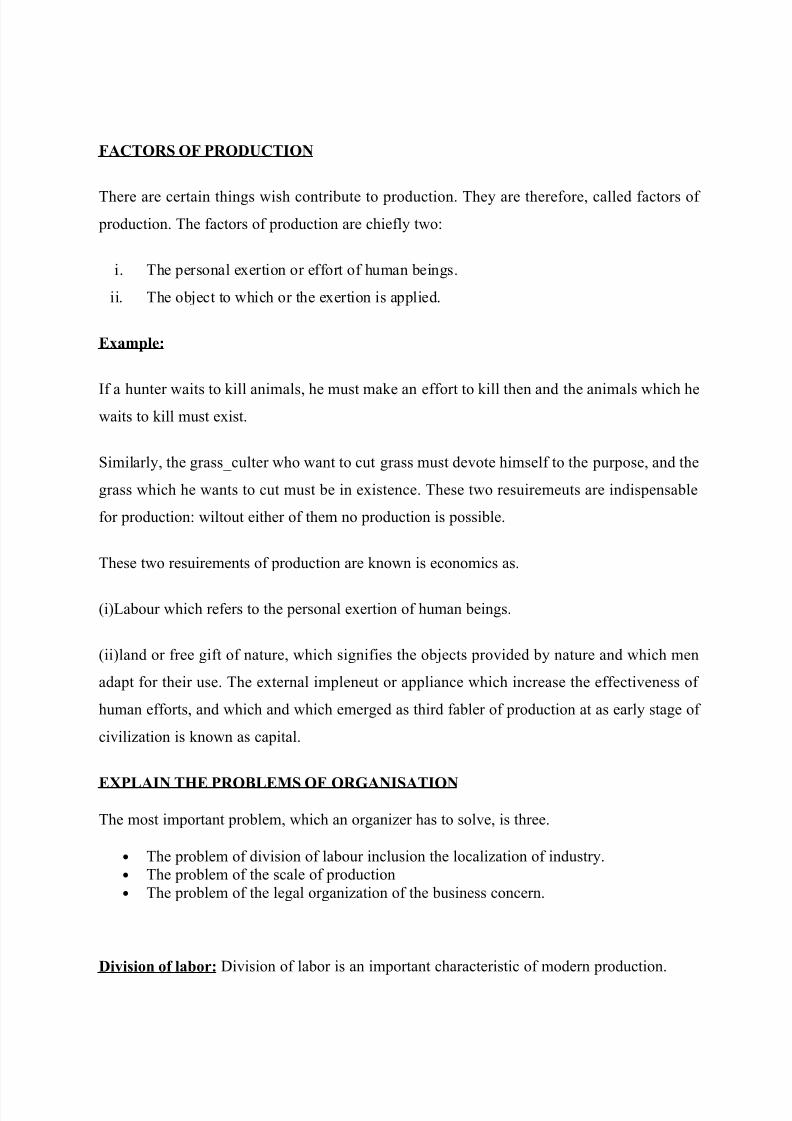
FACTORS OF PRODUCTION
There are certain things wish contribute to production. They are therefore, called factors of
production. The factors of production are chiefly two:
i. The personal exertion or effort of human beings.
ii. The object to which or the exertion is applied.
Example:
If a hunter waits to kill animals, he must make an effort to kill then and the animals which hewaits to kill must exist.
Similarly, the grass_culter who want to cut grass must devote himself to the purpose, and the
grass which he wants to cut must be in existence. These two resuiremeuts are indispensable
for production: wiltout either of them no production is possible.
These two resuirements of production are known is economics as.
(i)Labour which refers to the personal exertion of human beings.
(ii)land or free gift of nature, which signifies the objects provided by nature and which men
adapt for their use. The external impleneut or appliance which increase the effectiveness of
human efforts, and which and which emerged as third fabler of production at as early stage of
civilization is known as capital.
EXPLAIN THE PROBLEMS OF ORGANISATION
The most important problem, which an organizer has to solve, is three.
• The problem of division of labour inclusion the localization of industry.• The problem of the scale of production• The problem of the legal organization of the business concern.
Division of labor: Division of labor is an important characteristic of modern production.
8/2/2019 Manege Rial Economics
http://slidepdf.com/reader/full/manege-rial-economics 26/74
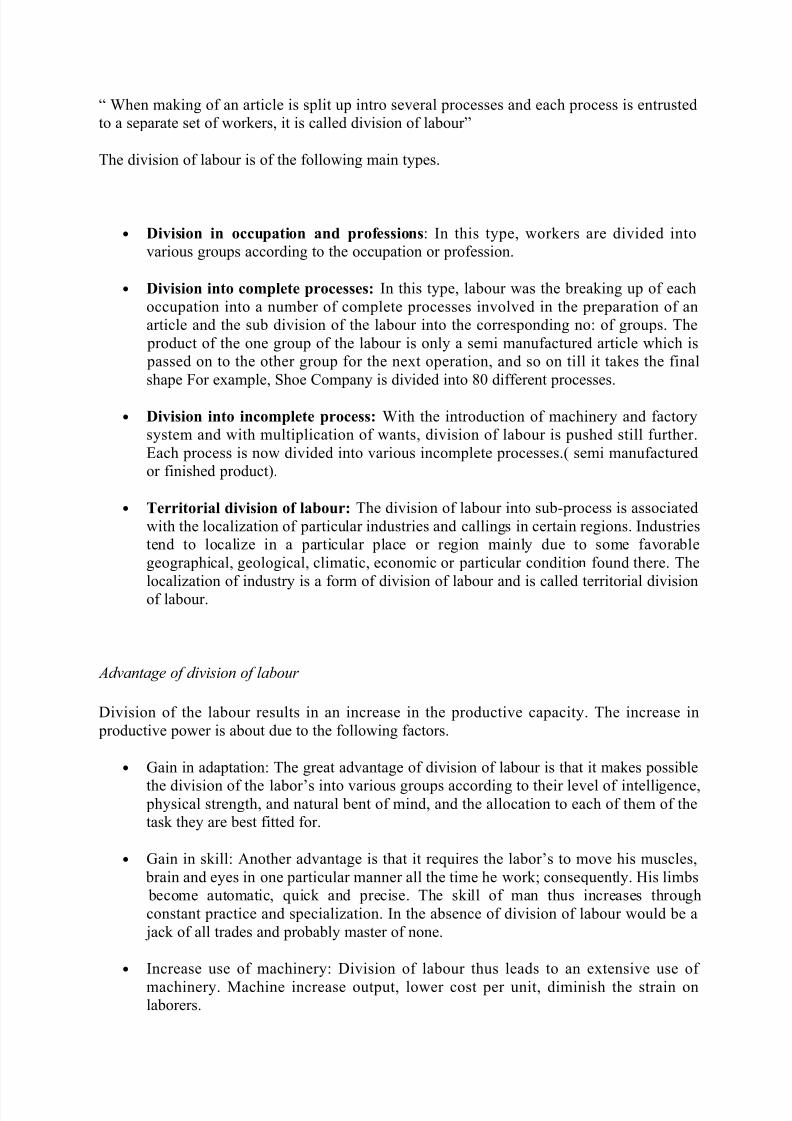
“ When making of an article is split up intro several processes and each process is entrustedto a separate set of workers, it is called division of labour”
The division of labour is of the following main types.
• Division in occupation and professions: In this type, workers are divided intovarious groups according to the occupation or profession.
• Division into complete processes: In this type, labour was the breaking up of eachoccupation into a number of complete processes involved in the preparation of anarticle and the sub division of the labour into the corresponding no: of groups. The
product of the one group of the labour is only a semi manufactured article which is passed on to the other group for the next operation, and so on till it takes the finalshape For example, Shoe Company is divided into 80 different processes.
• Division into incomplete process: With the introduction of machinery and factorysystem and with multiplication of wants, division of labour is pushed still further.Each process is now divided into various incomplete processes.( semi manufacturedor finished product).
• Territorial division of labour: The division of labour into sub-process is associatedwith the localization of particular industries and callings in certain regions. Industriestend to localize in a particular place or region mainly due to some favorablegeographical, geological, climatic, economic or particular condition found there. The
localization of industry is a form of division of labour and is called territorial divisionof labour.
Advantage of division of labour
Division of the labour results in an increase in the productive capacity. The increase in productive power is about due to the following factors.
• Gain in adaptation: The great advantage of division of labour is that it makes possible
the division of the labor’s into various groups according to their level of intelligence, physical strength, and natural bent of mind, and the allocation to each of them of thetask they are best fitted for.
• Gain in skill: Another advantage is that it requires the labor’s to move his muscles, brain and eyes in one particular manner all the time he work; consequently. His limbs become automatic, quick and precise. The skill of man thus increases throughconstant practice and specialization. In the absence of division of labour would be a
jack of all trades and probably master of none.
• Increase use of machinery: Division of labour thus leads to an extensive use of
machinery. Machine increase output, lower cost per unit, diminish the strain onlaborers.
8/2/2019 Manege Rial Economics
http://slidepdf.com/reader/full/manege-rial-economics 27/74
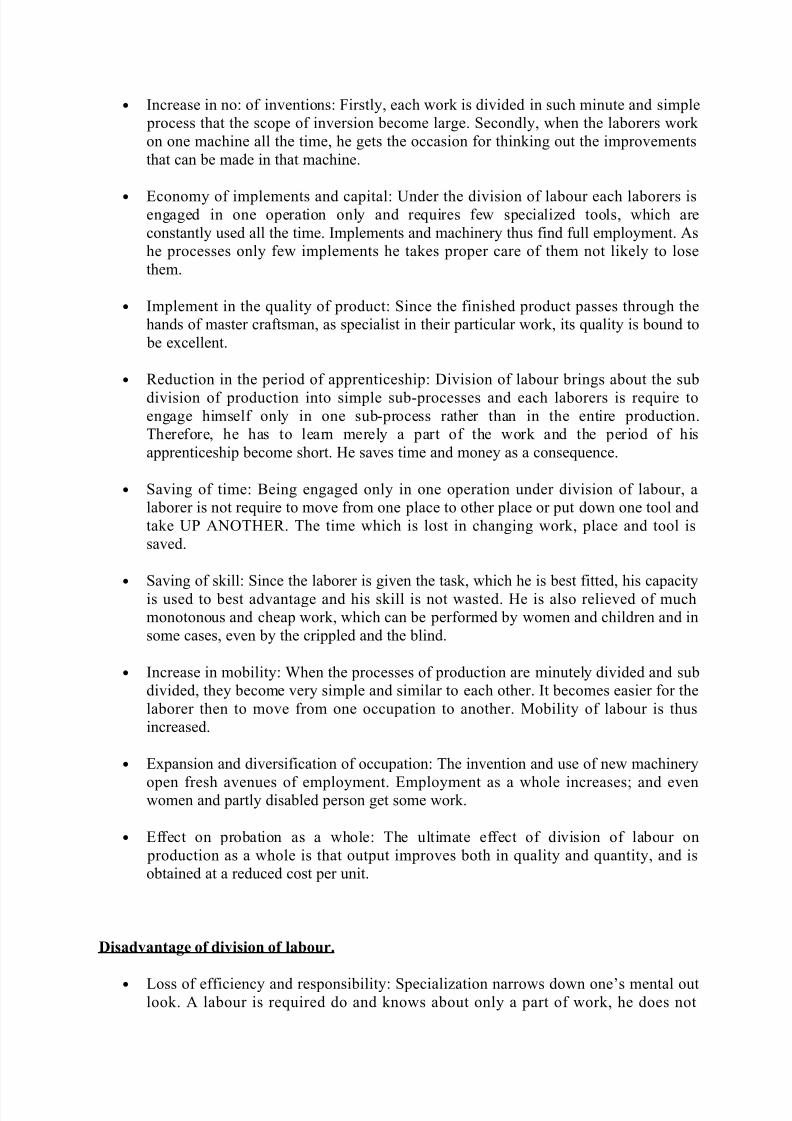
• Increase in no: of inventions: Firstly, each work is divided in such minute and simple process that the scope of inversion become large. Secondly, when the laborers work on one machine all the time, he gets the occasion for thinking out the improvementsthat can be made in that machine.
• Economy of implements and capital: Under the division of labour each laborers isengaged in one operation only and requires few specialized tools, which areconstantly used all the time. Implements and machinery thus find full employment. Ashe processes only few implements he takes proper care of them not likely to losethem.
• Implement in the quality of product: Since the finished product passes through thehands of master craftsman, as specialist in their particular work, its quality is bound to
be excellent.
• Reduction in the period of apprenticeship: Division of labour brings about the sub
division of production into simple sub-processes and each laborers is require toengage himself only in one sub-process rather than in the entire production.Therefore, he has to learn merely a part of the work and the period of hisapprenticeship become short. He saves time and money as a consequence.
• Saving of time: Being engaged only in one operation under division of labour, alaborer is not require to move from one place to other place or put down one tool andtake UP ANOTHER. The time which is lost in changing work, place and tool issaved.
• Saving of skill: Since the laborer is given the task, which he is best fitted, his capacityis used to best advantage and his skill is not wasted. He is also relieved of muchmonotonous and cheap work, which can be performed by women and children and insome cases, even by the crippled and the blind.
• Increase in mobility: When the processes of production are minutely divided and subdivided, they become very simple and similar to each other. It becomes easier for thelaborer then to move from one occupation to another. Mobility of labour is thusincreased.
• Expansion and diversification of occupation: The invention and use of new machinery
open fresh avenues of employment. Employment as a whole increases; and evenwomen and partly disabled person get some work.
• Effect on probation as a whole: The ultimate effect of division of labour on production as a whole is that output improves both in quality and quantity, and isobtained at a reduced cost per unit.
Disadvantage of division of labour.
• Loss of efficiency and responsibility: Specialization narrows down one’s mental outlook. A labour is required do and knows about only a part of work, he does not
8/2/2019 Manege Rial Economics
http://slidepdf.com/reader/full/manege-rial-economics 28/74
usually know more than that. The range of his usefulness is also reduced. Since theraw material passes through several hands before it is finally finished, no laborer can
be made responsible for the excellence of article as whole.
• Loss of interest: When a man manufactures one whole article, he takes pleasure and
interest in preparing it. The beauty of article please its maker, being credit to him andgives him satisfaction that his work has brought joy and satisfaction to others. Butwhen he made to work in a factory, in a scheme of mass production where hiscontribution cannot be located, he losses interest in the job.
• Monotony: A labor that performs the same task all the time he works, begin to feelmonotonous. Monotony gives raise to industrial fatigue, mixed wondering and daydreaming which reduce the efficiency of laborer his output.
• Employment of women and children: Division of labor creates the employment for women and children, but very often the task is too arduous and laborious for them and
seriously injures their health and hinders their growth. This is a matter of greatnational concern, weak mothers gives birth to weak children, and weak children turnout to be weak men of tomorrow.
• Loss of mobility: If a work is engaged in doing only one kind of work for some time,he might become unfit for another occupation. The mobility of labour may thus beseriously curtailed.
LOCALIZATION OF INDUSTRY
When a factory is newly started, the organizer has to determine its locality. To arrive at theright decision, he should obtain full knowledge of the places where that industry is localized.After a careful consideration of the relative advantages of the various places where the pointof view of availability of raw materials, skilled labour, Good markets, means of communication and transport and so forth he should locate the industry at the most favorablesite. The correctness of this decision is very important and determines, to a large extent.
Causes of localization: It is interesting to investigate into the causes, which attracts organizer to the same place. The most important of such causes are mentioned below:
• Availability of power: The most important cause of the localization of industry is theavailability of power. Industry should establish in those areas where power for that
production may available.
• Availability of raw material: Raw materials are important ingredients of manufacturing. The regions where raw materials are available mostly become thecenters of industries. For example; lumbering industry must be localized where forestare to be found.
• Climate: Climates help in the growth of industries in as much as it determines the
conditions of work. Extremes of the temperature are not suited top hard work. Theregions with temperature climate are therefore, important for localization of
8/2/2019 Manege Rial Economics
http://slidepdf.com/reader/full/manege-rial-economics 29/74
industries. In certain cases, the climate requires as special importance as in the case of cotton textile industry. The industry require moist climate so that fine thread could bespun out of cotton. If climate is dry, the thread soon become dry and breaks.
• Availability of skilled labour: The origin and persistence of localization is
sometimes the result of availability of skilled labour. The glass bangles manufacturingindustry of Pakistan is localized at Hyderabad not because it is near to sources of rawmaterial but simply because skilled labour is available here.
• The movement of an early start: Sometimes a place where an industry get an earlystart begins to enjoy so many advantage s with respect to industry that ultimately itsget localized there. New entrants into business find it economical and profitable to setup a factory at the old place rather at anew place.
• Nearness to market: Product have to be transported to the market for sale, thenearness of the market saves the cost of transport.
• Availability of means of transport and communication: The disadvantage of distant market is reduced if cheap, quick and easy means of transport andcommunication are available.
• Accessibility of market: Markets should not only exits in the geographical sense butshould also be available in the economic sense. The accessibility of markets impliesthat the purchases in those markets should have the demand for goods. Thecompetition therein should not be prohibitive, there should not exist very high importand export or duties, which check the movements of goods.
• Miscellaneous causes: There are various miscellaneous considerations, which favour the localisation of industries, are water for factory use and cheap land.
Advantage of localisation:
• Growth of skill: When in industry is localized in a particular place, the laborer of that place acquires special skills in that industry. The skill once acquired becomeshereditary and is passed on from father to son.
• Growth of local market for skill: Localisation gives rise to local market for the particular kind ok skilled labor, An organizer of a few factory in that line can findskilled labor in that market, while the labors skilled in that line can hope to findemployment there. Not only does labor become specialized but specialized machineryalso makes its appearance.
• Reputation or good will: When a industry is localized in a particular place, the product of that place earn a reputation or good will for themselves, so that the articlemanufactured there find a ready market.
• Growth or subsidiary industries: Near 6he industry center many subsidiary industriestend to grow. Thus the iron and steel industry generally leads to establishment of
8/2/2019 Manege Rial Economics
http://slidepdf.com/reader/full/manege-rial-economics 30/74
cement industry b/c the slag, which is the waste product of the iron and steel factory,happens to be raw material of the cement industry.
• Growth of supplementary industries: Localization of industries also lead to thedevelopment of supplementary industries which provide to the women and thechildren.
• Growth of machinery of commerce: An industry center becomes a bee-hire of commerce. Huge quantities of the products are sent out regularly. Therefore its needsmeans of communication and transport, banking, organization and capital market.
OBJECTIVES OF DEMAND FORCASTING
Demand estimation is predicting future demand form a product. The information regardingfuture demand is essential for planning and scheduling production, purchase of raw materials,acquision of finance and advertising.
The various techniques of demand estimation: -
• Survey Method• Statistical Method
Survey Method
Survey method is generally used where the purpose is to make short run forecast of demand.
Under this method, customer surveys are conducted to collect information about their
intentions and future purchase plan. This method includes
1. Consumer survey method
2. Opinion Poll method
Consumer survey method
1. Consumer enumeration: - In this method, almost all the potential users of the product are contacted and are asked about the future plan of purchasing the product inquestion. The quantities indicated by the consumers are added together to obtain the
probable demand for the product.
8/2/2019 Manege Rial Economics
http://slidepdf.com/reader/full/manege-rial-economics 31/74
2. Sample survey method: - Under this method only a few potential consumers selectedfrom relevant market through a sampling method are surveyed, on the basis of theinformation obtained, the probable demand may be estimated through the following
formula.
D = HR (H.AD)
Hs
Where D = probable demand forecast
H = Census number of households from the relevant market.
Hs = number of households reporting demand for the product.
HR = number of households reporting demand for the product.
AD = average expected consumption by the reporting households.
3. End User Method: - The end user method of demand forecasting is used for
estimating demand for inputs. Making forecast by this method requires building up aschedule of probable aggregate future demand for inputs by consuming industries andvarious other sectors.
OPINION POLL METHOD
The opinion poll methods aim at collecting opinion of those who are supposed to possess
knowledge of the market e.g. sales representative, professional marketing experts and
consultants. The opinion poll method includes
1. Expert opinion method: - Firms having a good network of sales representative can put them to work of assessing the demand for the product in the areas that theyrepresent. Sales representative, beings in close touch with the consumers are supposedto know the future purchase plans of their customer, their reaction to the marketchanges, their response to the introduction of new products and the demand for competing products. They are, therefore, in a position to provide an estimate of likelydemand for their firm’s product in the area. The estimates of demand thus obtainedfrom different regions are added up to get the overall probable demand for a product.
2. Delphi Method: - Delphi method is used to consolidate the divergent expert opinionsand arrived at a compromise estimate of future demand.
8/2/2019 Manege Rial Economics
http://slidepdf.com/reader/full/manege-rial-economics 32/74
Under Delphi method the expert are provided information on estimates of forecast of other experts along with the underlying assumptions. The experts may revise their own estimates in the light of forecast made by other experts. The consensus of expertsabout the forecasts constitutes the final forecast.
Although this method is simple and inexpensive, it has its own limitations. Firstestimates provided by sales representations and professional experts are reliable onlyto extend depending upon their skill to analysis the market and their experience.Second, demand estimates way involve the subjective judgement of the which maylead to over or under estimation, finally, the assessment of market demand is usually
based on inadequate information’s, such as changes in GNP, available of credit, future prospects of the industry etc, fall outside their purview.
3. Market studies and Experiments:- It is a method of collecting necessaryinformation regarding demand is to carry out market studies and experiments on
consumer’s behavior under actual through controlled market conditions. This methodis known in common parlance market conditions. This methods is known in common
parlance as market experiment method under this method, firms first select someareas of the representative markets – three or four cities having similar features viz.Population, income levels, cultural and social background, occupational distribution,choices and preferences of consumers. Then, they carry out market experiments bychanging prices, advt. Expenditure and other controllable variable in the demandfunction under the assumption that other thing remains same. The controlled variablemay by changed over time either simultaneously in all the markets or in all themarkets or in the selected markets. After such changes are introduced in the market,the consequent changes in the demand over a period of time (a week, a fortnight or
month) are recorded. On the basis of data collected elasticity coefficient arecomputed. These coefficients are then used along with the variables of the demandfunction to assess the demand for product.
The market experiments methods have certain serious limitations. First, this method is very
expensive and hence cannot be afforded by small forms. Second, being a costly affair,
experiments are usually carried out on a scale too small to permit generalization with a high
degree of reliability.
Third experimental methods are based on short – term and controlled conditions that may
exist in an uncontrolled market. Hence, the results may not be applicable to the uncontrolled
long-term conditions of the market.
Statistical method of demand projection include the following techniques
1. Trends Projection Method2. Barometric Method and3. Economic Method
8/2/2019 Manege Rial Economics
http://slidepdf.com/reader/full/manege-rial-economics 33/74
Trends Projection Method
Trend projection method is a classical method of business forecasting. This method is
essentially concerned with the study of movement of variable through time. The use of thismethod requires a long and reliable time series data. The trend projection method is usedunder the assumption that the factors responsible for the past trends in variables to be
projected (e.g. sales and demand) will continue to play their part in future in the same manner and to the same extend as they did in the past in determining the magnitude and direction of the variable.
There are three (3) techniques of trend projection based on time – series data.
1. Graphical Method: - under this method, annual sales data is plotted on a graph paper and a line is drawn through the plotted points. Then a free hand line is so drawn thatthe total distance between the line and the point is minimum. Although this method isvery simple and least expensive, the projections made through this method are notvery reliable. The reason is that the extension of the trend line involves subjectivity
and personal bias of the analysis.
Sale
8/2/2019 Manege Rial Economics
http://slidepdf.com/reader/full/manege-rial-economics 34/74
Years /Trend Projection
2. Fitting Trend Equation: Least square method: - Fitting trend equation is a formaltechnique of projecting the trend in demand. Under this method, a trend line (or curve) is fitted to the time – series data with the aid of statistical techniques. The formof the trend equation that can be fitted to the time series data is determined either by
plotting the sales data or by trying different forms of trend equations for the best fit.o When plotted, a time series date may show various trends. The most common
types of trend equation are
1) liner and
2) exponential trends
• Linear Trend: - When a time series data reveals a rising trend in sales than a straight-line trend equation of the following form is fitted. (S = A + BT ; Where S = annualsales , T = Time (in year) , A & B are constant. The parameter b given the measure of annual increase in sales)
• Exponential trend:- When sales ( or any dependent variable) have increased over the
past years at an increasing rate or at a constant percentage rate, than the appropriatetrend equation to be used is an exponential trend equation of any of the following type( Y = aebt , Or its semi – logarithmic form -> Log y = = log a + bt; This form of trendequation is used when growth rate is constant.)
3. Double log trend equation of equation
• Y = aTB• Or it’s double logarithmic form• Log y = log a + b log t• This form of trend equation is used when growth rate is increasing.
Limitation
The first limitations of this method arise out of the assumption that the past rate of change in
the dependent variable will persist in the future too. Therefore, the forecast based on thismethod may be considered to be reliable only for the period during which this assumption
8/2/2019 Manege Rial Economics
http://slidepdf.com/reader/full/manege-rial-economics 35/74
holds.
Second, this method cannot be used for short-term estimates. Also it cannot be used where
trend is cyclical with sharp turning points of trough and perks.
Box – Jenkins Method: - This method of forecasting is used only for short – term
predictions. Besides, this method is suitable for forecasting demand with only stationary time
series sales data. Stationary time series data is one, which does not reveal long term trend. In
other words, Box-Jenkins technique can be used only on those cases in which time-series
analysis depicts monthly or seasonal variation recurring with some degree of regularity.
BIOMETRIC METHOD
Many economists use economic indicators as barometer to forecast trends in business
activities.
The basic approach of barometer technique is to construct an index of relevant economicindicators and to forecast future trends on the basis of movements in the index of economicindicators. The indicators used in this method are classified as
1. Leading indicators: - consists of indicators which move up and down ahead of someother series e.g. new order of durable goods, new building permits etc.
2. Coincidental indicators: - are the ones that move up and down simultaneously withthe level of economic activity. E.g. number of employees in the non-agriculturalsector, rate of unemployment, sales recorded by the manufacturing, trading and theretail sectors etc.
3. Lagging indicators consists of those indicators, which follow a change after sometime lag. E.g. lending rate for short-term loans etc.
Development and allotment of land by Delhi Development Authority to Group Housing
Societies (a lead indicator) indicates higher demand prospects for cement, steel and other
construction material (coincidental indicators) and increase in housing loan distribution
(lagging indicators).
ECONOMETRIC METHOD
The econometric methods combine statistical tools with economic theories to estimate
economic variables and to forecast the intended economic variables. An econometric modelmay be single equation regression model or it may consist of a system of simultaneous
8/2/2019 Manege Rial Economics
http://slidepdf.com/reader/full/manege-rial-economics 36/74
equations.
Regression method
Regression analysis is the most popular method of demand estimation. This method combineseconomic theory and statistical techniques of estimation. Economic theory is employed to
specify the determinants of demand and to determine the nature of the relationship between
the demand for a product and its determinants. Economics theory thus helps in determining
the general form of demand function. Statistical techniques are employed to estimate the
values of parameters in the estimation equation.
Simultaneous Equation Method
It involves estimating several behavioral equations. These equations are generally behavioral
equations, Mathematical equations and Market – clearing equations. The first step in this
technician is to develop a complete model and specify the behavioral assumption regarding
the variables included in the model. The variables that are included in the model are
1. Endogenous variables2. Exogenous variables
Endogenous variables – the variables that are determined within the model are called
endogenous variables. Endogenous variables are included in the model as depended variablesthat are the variables that are to be explained by the model. These are also called controlled
variables. The number of equations included in the model must be equal to number of
endogenous variables.
Exogenous variables – are those that are determined outside the model. Exogenous variables
are inputs of the model whether a variable is treated endogenous variables or exogenous
variables depend on the purpose of the model. The examples of exogenous variables are “
Money Supply”, tax rates, govt. spending etc. The exogenous variables are also known as
uncontrolled variables.
WHAT IS PRICE DISCRININATION
A special feature of a monopoly is Price Discrimination i.e.charging different prices fromdifferent customers for the same or substantially the same commodity at the same time. Themonopolist may charge different prices from different groups of consumers if by this methodhe can increase his total profit.
Monopoly can be justified ( including price discrimination ) if it is not run for profit but toincrease economic welfare of the community e.g.. Indian Railways charge different price
8/2/2019 Manege Rial Economics
http://slidepdf.com/reader/full/manege-rial-economics 37/74
from students on academic tour and normal rate from general public. Similarly, electricity boards (i.e.. state ) charge higher tariff from industry and lower tariff from fairness. Pricediscriminator means selling the same product to different sections of customers at different
prices.
Customers are discriminated on the basis of their income or purchasing power geographicallocation, age, sex, color, marital status, quality purchased,time of purchase etc. Whencustomer are discriminated of the basis of these factors in regard to price charged from them ,it is called Price Discrimination.
There is another kind of Price discrimination. The same price is charged from the consumersof different areas while cost of production in two different plants located differently is not thesame. Some common examples of price discrimination :-
1. Different rates in domestic and foreign markets2. Lower rates for the first few telephone calls, lower rates for the evening and night
trunk calls;3. higher electricity rates for commercial use and lower for domestic consumption etc.
Necessary conditions for Price discrimination
1. Different markets must be separable for a seller to be able to practice discriminatory pricing. The market for different classes of consumer must be so separated that buyersform one market are not in position to resell the commodity in the other. Markets areseparated by :-
• Geographical distance involving high cost of transportation i.e.. domesticversus foreign markets.• Exclusive use of the commodity e.g.. doctor service• Lack of distribution channels e.g.. transfer of electricity from domestic use(lower rate) to industrial use (higher rate)
2. The electricity of demand must be different in different markets. The purpose of pricediscrimination is to maximize the profit by exploiting the market with different priceelasticities. It is the difference in the elasticity which provides an opportunity for pricediscrimination. If price elasticities of demand in different markets are the same , pricediscrimination would reduce the profit by reducing the demand in the high pricemarkets.
8/2/2019 Manege Rial Economics
http://slidepdf.com/reader/full/manege-rial-economics 38/74
3. There must be imperfect competition in the market. The firm must have monopolyover the supply of the product to be able to discrimination between different class of consumers, and change different prices.
4. Profit maximizing output is much larger than the quantity demand in a single marketor section of consumers.
Price discrimination can be justified if it is practiced by government for the purpose of
bringing social equality or to promote specific activities in the society e.g.. railways,
controlled by government, charge lower fare from children and student on their academic
tower etc. But if price discrimination is practised by private sector to exploit consumers and
increase their own profit margin, then government should device legislative measure to
control such activities .
Types and characteristics of isoquant curves
The term “isoquant ” has been derived from the Greek word “iso” meaning equal and Latinword “quantus” meaning “quantity”.
The “isoquant curve” is ,therefore, also known as “ Equal product curve” or “ Production Intelligence Curve”.
An isoquant curve is locus of point representing various combinations of two inputs – capital
and labor – yielding the same output .
Isoquant curves are drawn on the basis of the following assumptions :-
(i) There are only two inputs , v12 , labor ( L ) and capital (K) tom produce a commodity X .
(ii) The two inputs – L and K – can substitute each other but at diminishing rate .
(iii) The technology of production is given .
Given these assumptions , it is always possible to produce given quantity of commodity X
with various combination of labor and capital . The factor combinations are so formed that
the substitution of one factor for the other leaves the output unaffected .The technology is
presented through are isoquant curve ( IQ1 = 100 ) . The curve IQ1 all along its length
represents a fixed quantity , 100 units of product X . This quantity of output can be produced
with a number of labor-capital combination .
For example:-
8/2/2019 Manege Rial Economics
http://slidepdf.com/reader/full/manege-rial-economics 39/74
Points A , B , C and D on the isoquant curve IQ1 shows four different combinations of inputs
, K and L , all yielding the same output – 100 units . The movement from A to B indicates
decreasing Quantity Of K and increasing number of L .This implies substi- -tution Of labor
for capital such that all the input combinations yield the same quantity of commodity X i.e..
IQ1 = 100 .
CHARECTERISTICS OF ISOQUENT CURVES
a) Isoquant have a negative slope :-
An isoquant has a negative slope in the economic region or in the relevant range. The
negative slope of the isoquant implies substitutability between the inputs. It means if one of
the inputs is reduced, the other input has to be increased such that the total output remains
unaffected.
b) Isoquant are convex to the origin :- Convexity of isoquant implies to :-
i. substitution between the inputsii. diminishing marginal rate of technical substitution (MRTS) between the inputs in
economic region .
The MRTS defined as :-
MRTS = -∆K / ∆K = slope of the isoquant
i.e.. MRTS is the rate at which a marginal unit of labor can substitute a marginal unit of
capital ( moving downward on the isoquant ) without actually affecting the total output .
This rate is indicated by the slope of the isoquant . The MRTS decreases for two reasons :-
i. No factor is perfect substitute for another and Inputs are subject to diminishingmarginal return .
ii. Therefore more and more units of an input are needed to replace each successive unitof the output .
c) Isoquant cannot intersect or be tangent to each other :-
The intersection or tangency between any two isoquant implies that a given quantity of a
commodity can be produced with smaller as well as larger input-combination. This is
untenable as long as marginal productivity of inputs is greater than zero.
d) Upper isoquant represent higher level of output :-
8/2/2019 Manege Rial Economics
http://slidepdf.com/reader/full/manege-rial-economics 40/74
Between any two isoquant , the upper one represents a higher level of output then the lower
one. The reasons an upper isoquant implies a larger input combination , which in general ,
produces a larger output. Therefore, upper isoquant indicate a higher level of output.
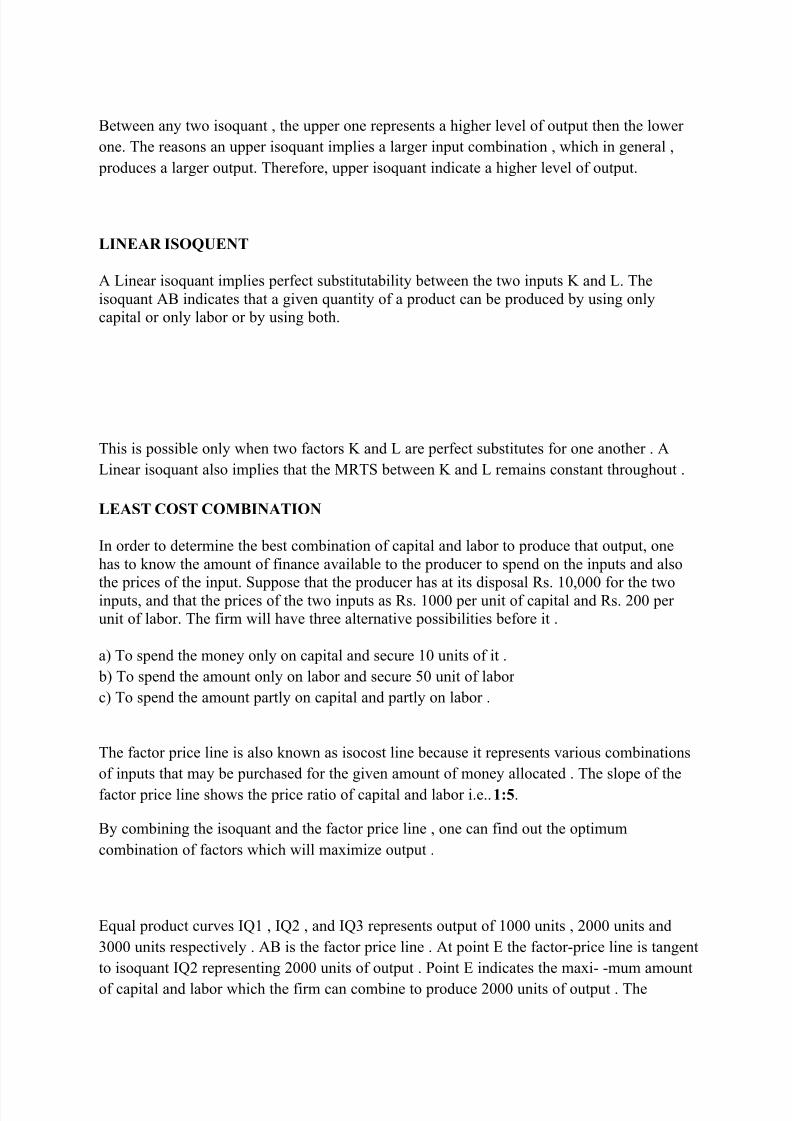
LINEAR ISOQUENT
A Linear isoquant implies perfect substitutability between the two inputs K and L. Theisoquant AB indicates that a given quantity of a product can be produced by using onlycapital or only labor or by using both.
This is possible only when two factors K and L are perfect substitutes for one another . A
Linear isoquant also implies that the MRTS between K and L remains constant throughout .
LEAST COST COMBINATION
In order to determine the best combination of capital and labor to produce that output, onehas to know the amount of finance available to the producer to spend on the inputs and also
the prices of the input. Suppose that the producer has at its disposal Rs. 10,000 for the twoinputs, and that the prices of the two inputs as Rs. 1000 per unit of capital and Rs. 200 per unit of labor. The firm will have three alternative possibilities before it .
a) To spend the money only on capital and secure 10 units of it .
b) To spend the amount only on labor and secure 50 unit of labor
c) To spend the amount partly on capital and partly on labor .
The factor price line is also known as isocost line because it represents various combinations
of inputs that may be purchased for the given amount of money allocated . The slope of the
factor price line shows the price ratio of capital and labor i.e.. 1:5.
By combining the isoquant and the factor price line , one can find out the optimum
combination of factors which will maximize output .
Equal product curves IQ1 , IQ2 , and IQ3 represents output of 1000 units , 2000 units and
3000 units respectively . AB is the factor price line . At point E the factor-price line is tangent
to isoquant IQ2 representing 2000 units of output . Point E indicates the maxi- -mum amount
of capital and labor which the firm can combine to produce 2000 units of output . The
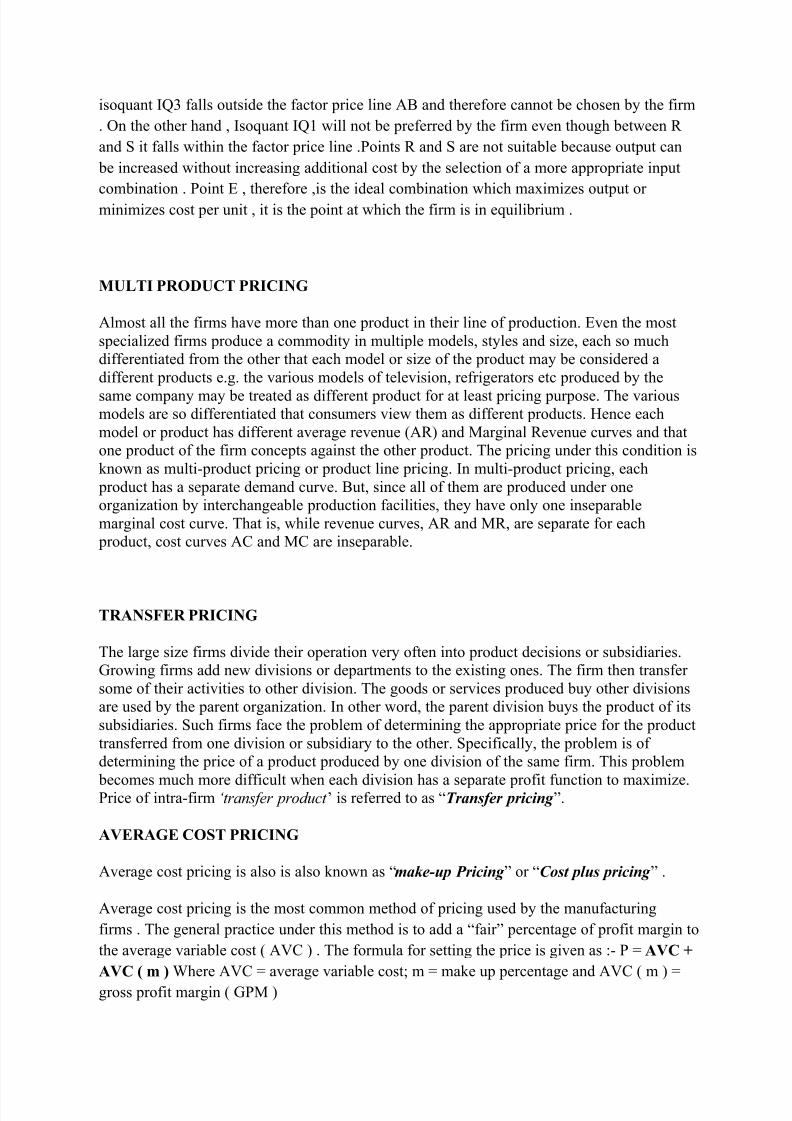
8/2/2019 Manege Rial Economics
http://slidepdf.com/reader/full/manege-rial-economics 41/74
isoquant IQ3 falls outside the factor price line AB and therefore cannot be chosen by the firm
. On the other hand , Isoquant IQ1 will not be preferred by the firm even though between R
and S it falls within the factor price line .Points R and S are not suitable because output can
be increased without increasing additional cost by the selection of a more appropriate input
combination . Point E , therefore ,is the ideal combination which maximizes output or minimizes cost per unit , it is the point at which the firm is in equilibrium .
MULTI PRODUCT PRICING
Almost all the firms have more than one product in their line of production. Even the mostspecialized firms produce a commodity in multiple models, styles and size, each so muchdifferentiated from the other that each model or size of the product may be considered adifferent products e.g. the various models of television, refrigerators etc produced by the
same company may be treated as different product for at least pricing purpose. The variousmodels are so differentiated that consumers view them as different products. Hence eachmodel or product has different average revenue (AR) and Marginal Revenue curves and thatone product of the firm concepts against the other product. The pricing under this condition isknown as multi-product pricing or product line pricing. In multi-product pricing, each
product has a separate demand curve. But, since all of them are produced under oneorganization by interchangeable production facilities, they have only one inseparablemarginal cost curve. That is, while revenue curves, AR and MR, are separate for each
product, cost curves AC and MC are inseparable.
TRANSFER PRICING
The large size firms divide their operation very often into product decisions or subsidiaries.Growing firms add new divisions or departments to the existing ones. The firm then transfer some of their activities to other division. The goods or services produced buy other divisionsare used by the parent organization. In other word, the parent division buys the product of itssubsidiaries. Such firms face the problem of determining the appropriate price for the producttransferred from one division or subsidiary to the other. Specifically, the problem is of determining the price of a product produced by one division of the same firm. This problem
becomes much more difficult when each division has a separate profit function to maximize.Price of intra-firm ‘transfer product ’ is referred to as “Transfer pricing ”.
AVERAGE COST PRICING
Average cost pricing is also is also known as “make-up Pricing ” or “Cost plus pricing ” .
Average cost pricing is the most common method of pricing used by the manufacturing
firms . The general practice under this method is to add a “fair” percentage of profit margin to
the average variable cost ( AVC ) . The formula for setting the price is given as :- P = AVC +
AVC ( m ) Where AVC = average variable cost; m = make up percentage and AVC ( m ) =
gross profit margin ( GPM )
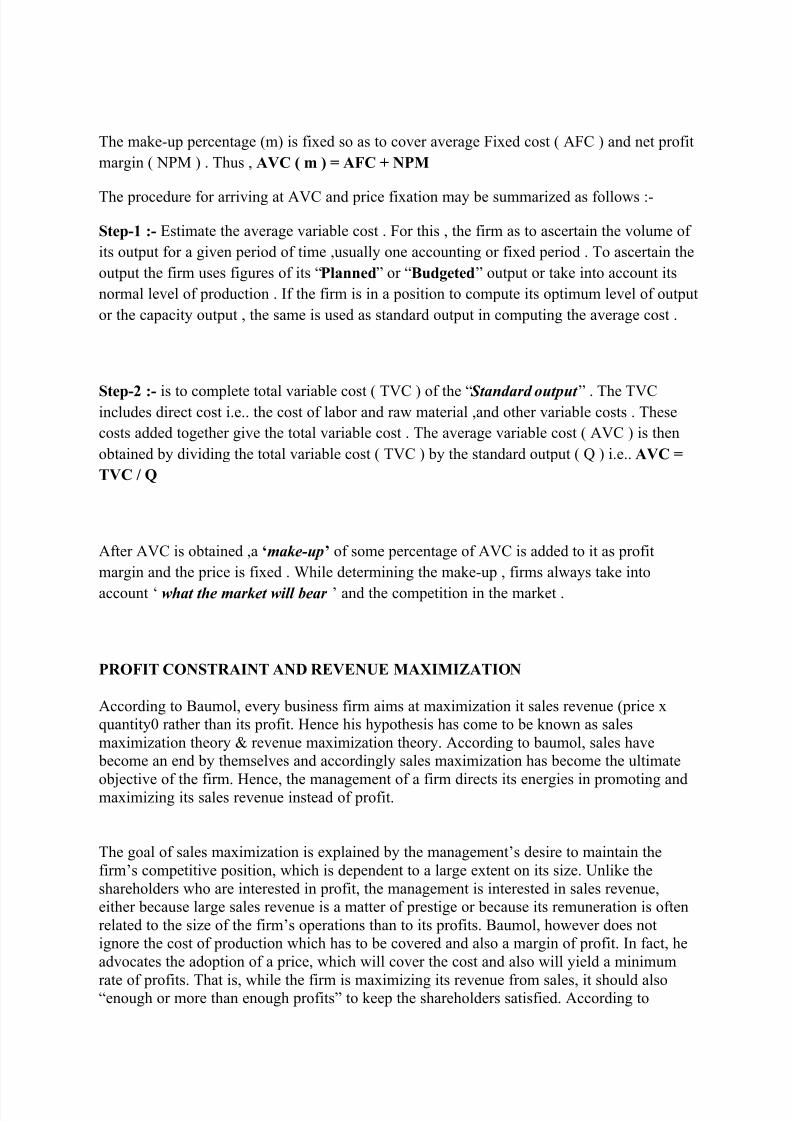
8/2/2019 Manege Rial Economics
http://slidepdf.com/reader/full/manege-rial-economics 42/74
The make-up percentage (m) is fixed so as to cover average Fixed cost ( AFC ) and net profit
margin ( NPM ) . Thus , AVC ( m ) = AFC + NPM
The procedure for arriving at AVC and price fixation may be summarized as follows :-
Step-1 :- Estimate the average variable cost . For this , the firm as to ascertain the volume of
its output for a given period of time ,usually one accounting or fixed period . To ascertain the
output the firm uses figures of its “Planned” or “Budgeted” output or take into account its
normal level of production . If the firm is in a position to compute its optimum level of output
or the capacity output , the same is used as standard output in computing the average cost .
Step-2 :- is to complete total variable cost ( TVC ) of the “ Standard output ” . The TVCincludes direct cost i.e.. the cost of labor and raw material ,and other variable costs . These
costs added together give the total variable cost . The average variable cost ( AVC ) is then
obtained by dividing the total variable cost ( TVC ) by the standard output ( Q ) i.e.. AVC =
TVC / Q
After AVC is obtained ,a ‘make-up’ of some percentage of AVC is added to it as profit
margin and the price is fixed . While determining the make-up , firms always take into
account ‘ what the market will bear ’ and the competition in the market .
PROFIT CONSTRAINT AND REVENUE MAXIMIZATION
According to Baumol, every business firm aims at maximization it sales revenue (price xquantity0 rather than its profit. Hence his hypothesis has come to be known as salesmaximization theory & revenue maximization theory. According to baumol, sales have
become an end by themselves and accordingly sales maximization has become the ultimate
objective of the firm. Hence, the management of a firm directs its energies in promoting andmaximizing its sales revenue instead of profit.
The goal of sales maximization is explained by the management’s desire to maintain thefirm’s competitive position, which is dependent to a large extent on its size. Unlike theshareholders who are interested in profit, the management is interested in sales revenue,either because large sales revenue is a matter of prestige or because its remuneration is oftenrelated to the size of the firm’s operations than to its profits. Baumol, however does notignore the cost of production which has to be covered and also a margin of profit. In fact, headvocates the adoption of a price, which will cover the cost and also will yield a minimum
rate of profits. That is, while the firm is maximizing its revenue from sales, it should also“enough or more than enough profits” to keep the shareholders satisfied. According to
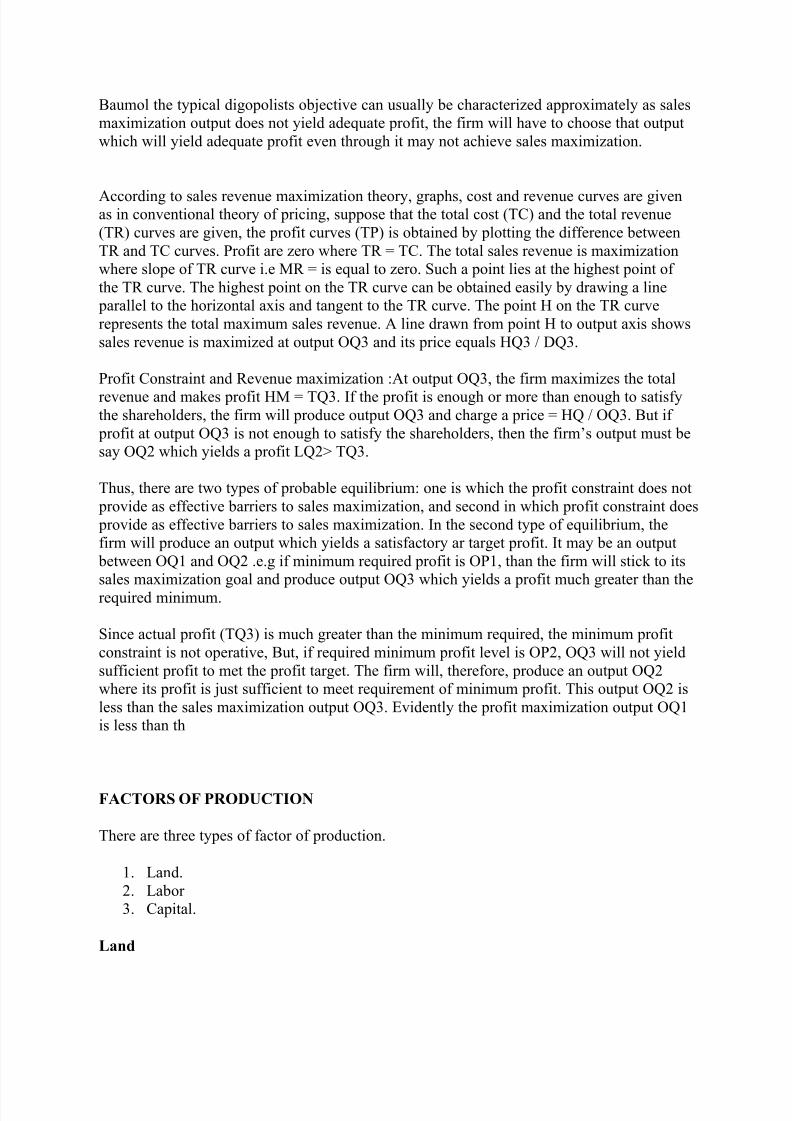
8/2/2019 Manege Rial Economics
http://slidepdf.com/reader/full/manege-rial-economics 43/74
Baumol the typical digopolists objective can usually be characterized approximately as salesmaximization output does not yield adequate profit, the firm will have to choose that outputwhich will yield adequate profit even through it may not achieve sales maximization.
According to sales revenue maximization theory, graphs, cost and revenue curves are givenas in conventional theory of pricing, suppose that the total cost (TC) and the total revenue(TR) curves are given, the profit curves (TP) is obtained by plotting the difference betweenTR and TC curves. Profit are zero where TR = TC. The total sales revenue is maximizationwhere slope of TR curve i.e MR = is equal to zero. Such a point lies at the highest point of the TR curve. The highest point on the TR curve can be obtained easily by drawing a line
parallel to the horizontal axis and tangent to the TR curve. The point H on the TR curverepresents the total maximum sales revenue. A line drawn from point H to output axis showssales revenue is maximized at output OQ3 and its price equals HQ3 / DQ3.
Profit Constraint and Revenue maximization :At output OQ3, the firm maximizes the total
revenue and makes profit HM = TQ3. If the profit is enough or more than enough to satisfythe shareholders, the firm will produce output OQ3 and charge a price = HQ / OQ3. But if
profit at output OQ3 is not enough to satisfy the shareholders, then the firm’s output must besay OQ2 which yields a profit LQ2> TQ3.
Thus, there are two types of probable equilibrium: one is which the profit constraint does not provide as effective barriers to sales maximization, and second in which profit constraint does provide as effective barriers to sales maximization. In the second type of equilibrium, thefirm will produce an output which yields a satisfactory ar target profit. It may be an output
between OQ1 and OQ2 .e.g if minimum required profit is OP1, than the firm will stick to itssales maximization goal and produce output OQ3 which yields a profit much greater than therequired minimum.
Since actual profit (TQ3) is much greater than the minimum required, the minimum profitconstraint is not operative, But, if required minimum profit level is OP2, OQ3 will not yieldsufficient profit to met the profit target. The firm will, therefore, produce an output OQ2where its profit is just sufficient to meet requirement of minimum profit. This output OQ2 isless than the sales maximization output OQ3. Evidently the profit maximization output OQ1is less than th
FACTORS OF PRODUCTION
There are three types of factor of production.
1. Land.2. Labor 3. Capital.
Land
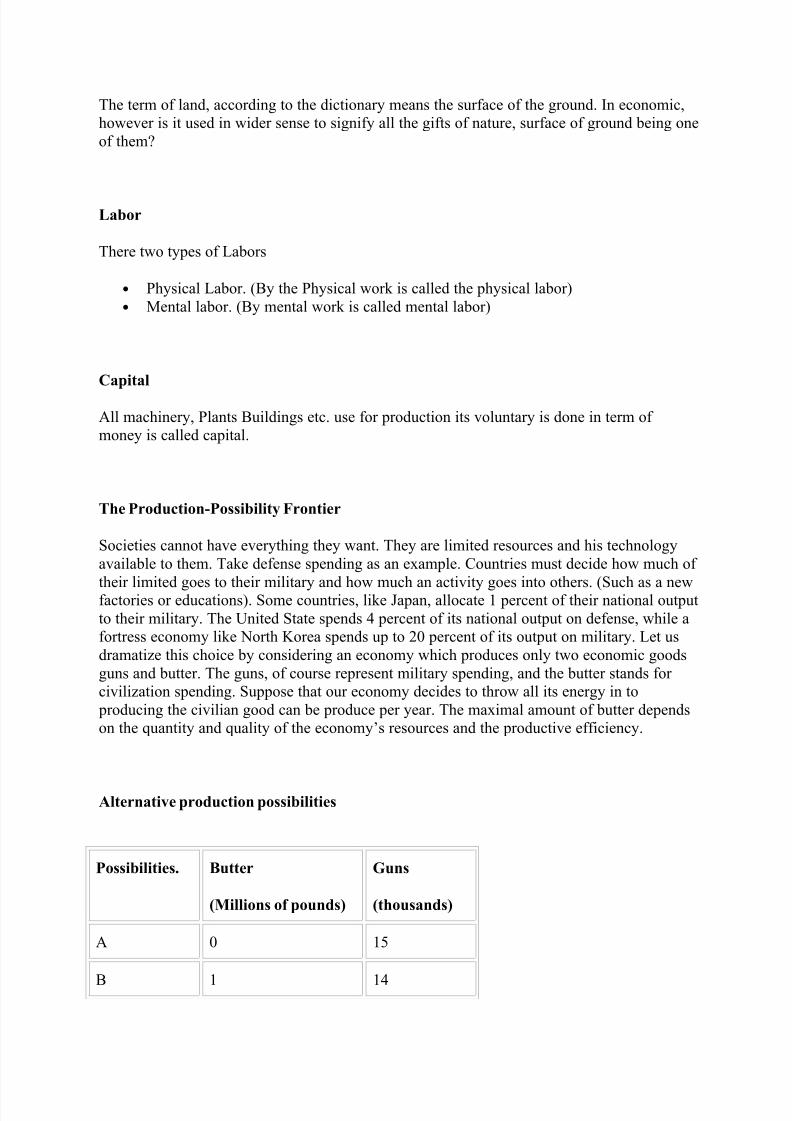
8/2/2019 Manege Rial Economics
http://slidepdf.com/reader/full/manege-rial-economics 44/74
The term of land, according to the dictionary means the surface of the ground. In economic,however is it used in wider sense to signify all the gifts of nature, surface of ground being oneof them?
Labor
There two types of Labors
• Physical Labor. (By the Physical work is called the physical labor)• Mental labor. (By mental work is called mental labor)
Capital
All machinery, Plants Buildings etc. use for production its voluntary is done in term of money is called capital.
The Production-Possibility Frontier
Societies cannot have everything they want. They are limited resources and his technologyavailable to them. Take defense spending as an example. Countries must decide how much of
their limited goes to their military and how much an activity goes into others. (Such as a newfactories or educations). Some countries, like Japan, allocate 1 percent of their national outputto their military. The United State spends 4 percent of its national output on defense, while afortress economy like North Korea spends up to 20 percent of its output on military. Let usdramatize this choice by considering an economy which produces only two economic goodsguns and butter. The guns, of course represent military spending, and the butter stands for civilization spending. Suppose that our economy decides to throw all its energy in to
producing the civilian good can be produce per year. The maximal amount of butter dependson the quantity and quality of the economy’s resources and the productive efficiency.
Alternative production possibilities
Possibilities. Butter
(Millions of pounds)
Guns
(thousands)
A 0 15
B 1 14
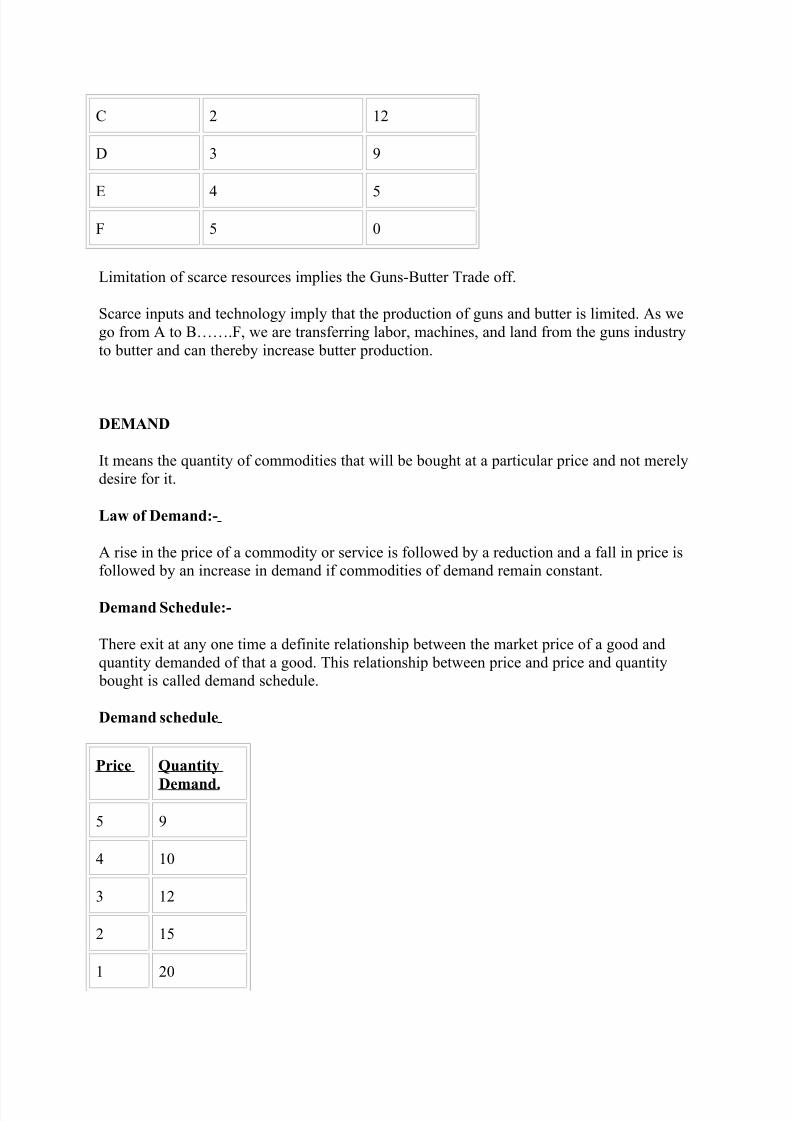
8/2/2019 Manege Rial Economics
http://slidepdf.com/reader/full/manege-rial-economics 45/74
C 2 12
D 3 9
E 4 5
F 5 0
Limitation of scarce resources implies the Guns-Butter Trade off.
Scarce inputs and technology imply that the production of guns and butter is limited. As wego from A to B…….F, we are transferring labor, machines, and land from the guns industryto butter and can thereby increase butter production.
DEMAND
It means the quantity of commodities that will be bought at a particular price and not merelydesire for it.
Law of Demand:-
A rise in the price of a commodity or service is followed by a reduction and a fall in price isfollowed by an increase in demand if commodities of demand remain constant.
Demand Schedule:-
There exit at any one time a definite relationship between the market price of a good andquantity demanded of that a good. This relationship between price and price and quantity
bought is called demand schedule.
Demand schedule
Price Quantity
Demand.
5 9
4 10
3 12
2 15
1 20
8/2/2019 Manege Rial Economics
http://slidepdf.com/reader/full/manege-rial-economics 46/74
Factors Affecting Demand Curve
1. Average Income. (As income rise , people increase )
2. Population (A growth in population increases)3. Price Of Related Goods.(Lower Gasoline price raise the demand)4. Tastes (Having a new commodities becomes a status symbol)5. Special Influences (Special Influences include availability of alternative forms of
transportation safety)
Limitation of the Law
1. Change in taste or Fashion.
2. Change in income.3. Change in Price.4. Discovery of substituted.5. Anticipatory Change in price.6. Commodities used comfort distinction.
The substitution and income effects of a price change
Although a consumer’s demand curve for any good x is likely to be downward sloping wecannot be certain of this because of the presence of the income effect of a price change.Whenever a price changes, that change will affect the demand for the good in two ways:
• The price of this good, relative to others, has changed. This induces a substitutioneffect. The change in relative prices will lead to a re-allocation of spending betweengoods. Fewer of the good which has become relatively more expensive will be
purchased and more of the good which has become relatively less expensive will be bought. The substitution effect will always be negative: a change in the price of agood will lead to a change in the opposite direction in the quantity demanded of it
• A price change (with a fixed level of money income) will change the consumer’s real
income (the purchasing power of the money income). As the consumer’s real incomeis changed, there will be a change in the amount of this good (and others) purchased.However, the direction of this change is uncertain. If the good in question is a normalgood, higher real income will increase the quantity demanded. Conversely, if the goodis an inferior good, higher real income will decrease the quantity demanded.
The demand curve for a good describes the overall relationship between price and quantity
demanded, and so incorporates both the substitution effect and the real income effect of a price change.
8/2/2019 Manege Rial Economics
http://slidepdf.com/reader/full/manege-rial-economics 47/74
We can obtain a graphical representation of the decomposition of a price change intosubstitution and income effects in the following way. First, the substitution effect of the pricechange is identified. The income effect is then obtained as the difference between the total
effect and the substitution effect of the price change.
The substitution effect can be identified by asking how much demand for the good wouldchange if
1. its price changes, and
2. the consumer is compensated for a price increase (or financially penalised for a pricefall) by just the amount required to prevent the consumer from gaining more utilitythan he or she had prior to the price change.
Suppose the consumer initially allocates his or her money income of m by purchasing y1 unitsof good y (at the price Py1 ) and x1 units of good x (at the price Px1). This is a utilitymaximising expenditure pattern obtains utility level U1 . We next suppose that the price of good x falls, with money income and the price of good y remaining constant. This causes theindividual’s budget constraint to rotate anti-clockwise. The consumer now switchesexpenditure to the allocation shown by point b, at which utility is maximised at the higher level, U2.
The consumption of x increases from x1 to x3. This is the total effect of the price change. Letus now conduct the following hypothetical experiment. Starting from the new (post pricechange) budget constraint, we take away from the consumer the maximum amount of incomethat is just compatible with him or her being able to get the original utility level U1 at thenew set of prices. This results in the consumer’s budget constraint moving to the line de.With this budget constraint (and at the new set of prices, Py1 and Px2 ), the highest level of
utility level attainable is U1, its original level. This is achieved by purchasing x3 units of x andy3 units of y.
This has removed the income effect of the price change. Any change in the demand for goodx can, therefore, be attributed to the substitution effect alone. For good x, the substitutioneffect (SE) of the price fall consists of the change from x1 to x3. The income effect (IE) of the
price change consists of the change in quantity from x3 to x2. To see why this is so, note thatif we were to begin at the point c and, without changing relative prices, return to theconsumer the money income previously taken away, the individual would move from c to b,
thereby raising consumption of x from x3 to x2.
8/2/2019 Manege Rial Economics
http://slidepdf.com/reader/full/manege-rial-economics 48/74
The following can be said by way of conclusion.
Total effect of a price change = substitution effect + income effect
(x1 to x2) (x1 to x3) (x3 to x2)
It can be deduced from this that x is a normal good, as an increase in real income has resultedin an increase in the quantity demanded of the good.
But as some goods are inferior, there are other possibilities. In these two cases, x is aninferior good, and so the income effect of a price change works in the reverse direction to thesubstitution effect, thereby reducing the size of the overall effect. Overall, a price fall of good x results in a greater quantity being demanded, even though the size of the overallchange has been reduced by the income effect.
The extent of the income effect is so great that it not only reduces the overall effect, itactually reverses it. Here, a fall in the price of good x results in a fall in the quantitydemanded of that good. The demand curve has a positive slope!
Empirical evidence shows that there are few, if any, Giffen goods in practice. Theory alsosuggests the probability of Giffen goods is extremely small. Most goods are normal goods.But even where a good is inferior, the income effect is likely to be small in magnitude incomparison with the substitution effect. Unless a very large proportion of income is spent onone good, the income effect will be small for moderate sized price changes. Only in veryexceptional circumstances would an income effect dominate the substitution effect in the wayrequired for Giffen goods.
From individual demands to the market demand for a good
To this point in this chapter, our focus has rested entirely on the individual consumer. For economic and business analysis, though, it is market demand that matters. How does marketdemand relate to the demands of individual consumers? The answer is very simple. Themarket demand for a good is simply the sum of all individual consumer demands for thatgood. To obtain this sum, take one price and find the quantity demanded by each individual atthat price. Then sum these quantities to find the market demand at that price. Repeating thisanalysis for all possible prices, we obtain the market demand schedule.
8/2/2019 Manege Rial Economics
http://slidepdf.com/reader/full/manege-rial-economics 49/74
Demand analysis: an example
To illustrate the effects of a price change, we investigate some consequences of a crude oil
price change. During the mid and late 1970s, the price increased substantially in two large
steps. The first episode was triggered by the decision of OPEC (The Organisation of
Petroleum Exporting Countries) to use an embargo on oil exports to America and Europe as
an economic weapon in the attack on Israel by Egypt and Syria in late 1973. Cutbacks in
production led to the price more than quadrupling, from $2.59 to $11.65 per barrel. The
importance of this step is evident when one realises that this increased the revenue deriving
from one year’s oil output from ½% to 2½ % of the world’s GDP (gross domestic product).
In so doing, it had a major impact on the distribution of income and wealth between
countries. The price increase diverted about 2% of all the world’s income away from the
purchasing power of net oil importing states into the pockets of the oil exporters.
After a period in which the real price of oil slowly declined, the revolution in Iran paralysed
oil production, and initiated a second episode of sharp price rises. The official OPEC price
rose to $34 a barrel, with the spot market price reaching as high as $40.
These oil price changes had major short term and long term effects on demand (and
subsequently supply) for a wide variety of goods throughout the world economy. The income
and substitution effects of the oil price changes were particularly large for three reasons:
1.
The price increases were large in proportionate terms.
2.
The price increases were nearly instantaneous and largely unanticipated.
8/2/2019 Manege Rial Economics
http://slidepdf.com/reader/full/manege-rial-economics 50/74
3.
The good whose price had risen -crude oil - accounted, directly or indirectly, for a large
proportion of consumer budgets.
Consider some of the substitution effects. Crude oil price increases led to a rise in the cost of
production of many goods and services that used energy inputs. These cost increases were
particularly important in the case of petroleum refining, electricity production, transport and
distribution, and the industrial materials and chemicals sectors. Cost increases in these sectors
led to subsequent price increases, as producers attempted to pass on costs to purchasers.
Secondly, many consumer goods are complements to goods whose price had risen because of
the crude oil price increases. For example, cars are complements to petroleum, a derivative of crude oil. So oil price rises led to an increase in the cost of car transport.
To some extent, the substitution effect operated by reducing the demand for car transport as a
whole. Car sales dropped, fewer miles were driven and the average speed of traffic fell,
increasing the mileage driven per unit of petrol. Within car transport itself, other substitutions
took place. Large engined, fuel-inefficient cars became relatively more expensive to operate
in comparison with smaller vehicles. Consumers chose to buy smaller, more fuel-efficient
cars. These substitution effects were greater in the long term than in the short term.
Price increases also had major impacts on real incomes. In the oil importing countries,
reduced real incomes reduced the demand for oil and for a wide range of other goods.
Although real incomes rose in oil exporting states, much of the export revenue was used to
acquire financial assets, and so did not generate additional demand for manufactured goodsexports that would have compensated oil importing economies. As a large proportion of oil
export revenue was saved, the price increases precipitated a depression in the level of world
demand at the same time as price-inflation accelerated. The conjunction of price-inflation and
demand-stagnation became known as “stagflation”.
Oil price increases had important supply side effects too. The incentive to search for new
sources of oil increased rapidly, and higher prices meant that high-cost oil fields (such as
8/2/2019 Manege Rial Economics
http://slidepdf.com/reader/full/manege-rial-economics 51/74
those in deep offshore waters) became profitable to exploit. It is one of the ironies of this
whole process that the adjustments set into motion by the oil price rises - increased supply
from new sources and decreased demand from users - were so great that OPEC lost its
dominance of the oil industry. Just prior to the Iraq invasion of Kuwait, the real price of oil
(the price in purchasing power terms) had fallen to its 1973 level.
What is the basic objectives of a firm? Explain the role and responsibility
on Managerial Economics?
Conventional theory of firm assumes profit maximization is the sole objective of business
firms. But recent researches on this issue reveal that the objectives the firms pursue are more
than one. Some important objectives, other than profit maximization are:
(a) Maximization of the sales revenue
(b) Maximization of firm’s growth rate
(c) Maximization of Managers utility function
(d) Making satisfactory rate of Profit
(e) Long run Survival of the firm
(f) Entry-prevention and risk-avoidance
Profit Business Objectives:
Profit means different things to different people. To an accountant “Profit” means the excess
of revenue over all paid out costs including both manufacturing and overhead expenses. For
all practical purpose, profit or business income means profit in accounting sense plus non-
allowable expenses.
8/2/2019 Manege Rial Economics
http://slidepdf.com/reader/full/manege-rial-economics 52/74
Economist’s concept of profit is of “Pure Profit” called ‘economic profit’ or “Just profit”.
Pure profit is a return over and above opportunity cost, i. e. the income that a businessman
might expect from the second best alternatives use of his resources.
Sales Revenue Maximisation: The reason behind sales revenue maximisation objectives is the
Dichotomy between ownership & management in large business corporations. This
Dichotomy gives managers an opportunity to set their goal other than profits maximisation
goal, which most-owner businessman pursue. Given the opportunity, managers choose to
maximize their own utility function. The most plausible factor in manager’s utility functions
is maximisation of the sales revenue.
The factors, which explain the pursuance of this goal by the managers are following:.
* First: Salary and others earnings of managers are more closely related to sales revenue
than to profits
* Second: Banks and financial corporations look at sales revenue while financing the
corporation.
* Third: Trend in sales revenue is a readily available indicator of the performance of the
firm.
Maximisation of Firms Growth rate: Managers maximize firm’s balance growth rate subject
to managerial & financial constrains balance growth rate defined as:
G = GD – GC
Where GD = Growth rate of demand of firm’s product & GC= growth rate of capital supply
of capital to the firm.
In simple words, A firm growth rate is balanced when demand for its product & supply of
capital to the firm increase at the same time.
8/2/2019 Manege Rial Economics
http://slidepdf.com/reader/full/manege-rial-economics 53/74
Maximisation of Managerial Utility function:
The manager seek to maximize their own utility function subject to the minimum level of
profit. Managers utility function is express as:
U= f(S, M, ID)
Where S = additional expenditure of the staff
M= Managerial emoluments
ID = Discretionary Investments
The utility functions which manager seek to maximize include both quantifiable variables
like salary and slack earnings; non- quantifiable variables such as prestige, power, status, Job
security professional excellence etc.
Long run survival & market share: according to some economist, the primary goal of the firm
is long run survival. Some other economists have suggested that attainment & retention of
constant market share is an additional objective of the firm’s. the firm may seek to maximize
their profit in the long run through it is not certain.
Entry-prevention and risk-avoidance, yet another alternative objectives of the firms suggested by some economists is to prevent entry-prevention can be:
1.
Profit maximisation in the long run
2.
8/2/2019 Manege Rial Economics
http://slidepdf.com/reader/full/manege-rial-economics 54/74
Securing a constant market share
3.
Avoidance of risk caused by the unpredictable behavior of the new firms
Micro economist has a vital role to play in running of any business. Micro economists are
concern with all the operational problems, which arise with in the business organization and
fall in with in the preview and control of the management. Some basic internal issues with
which micro-economist are concerns:
1.
Choice of business and nature of product i.e. what to produce
2.
Choice of size of the firm i. e how much to produce
3.
Choice of technology i.e. choosing the factor-combination
4.
Choose of price i.e. how to price the commodity
8/2/2019 Manege Rial Economics
http://slidepdf.com/reader/full/manege-rial-economics 55/74
5.
How to promote sales
6.
How to face price competition
7.
How to decide on new investments
8.
How to manage profit and capital
9.
How to manage inventory i.e. stock to both finished & raw material
These problems may also figure in forward planning. Micro economist deals with these
questions and like confronted by managers of the enterprises
Short Run & Long Run
The concept of short run and long run is used in economic theories like production theory,
cost theory etc.
In production, theory short run refers to a period of time in which supply of certain inputs
such as plant, building, machinery etc is fixed or is inelastic. In the short run therefore,
8/2/2019 Manege Rial Economics
http://slidepdf.com/reader/full/manege-rial-economics 56/74
increasing the use of only one variable input as labour and raw material can increase
production of a commodity.
The long run refers to a period of time in which the supply of all the inputs is elastic, but not
enough to permit a change in technology. That is, in the long run, all the inputs are variable.
Therefore, in the end, production of or commodity can be increased by employing more of
both variable and fixed inputs.
Short run costs are the costs that vary with the variation in input, the size of the firmremaining the same. In the other words, short run costs are the same as variable costs. Long
run costs, on the other hand are the costs, which are incurred on the fixed assets like plant,
building, machinery etc.
Nature Marginal analysis
The concept of marginal value is widely used in economic analysis, for example marginal
utility, marginal cost and marginal revenue. Marginality concept assumes special significance
where maximisation or maximization problem is involved e.g. maximization of consumer’s
utility, maximisation of firm’s profit, minimization of cost etc. The terun “marginal” refers to
the change (increase or decrease) in the total of any quantity due to one unit change in its
determinant e.g. the total cost of production of a commodity depends on the number of units
produced. In this case “marginal cost” or (MC) can be defined as the change in total cost as
result of producing one unit less of a commodity thus,
Marginal Cost (MC) = TCn – TCn – 1
Where TCn = total cost of producing n units
TCn-1 = total cost of producing n – 1 units.
8/2/2019 Manege Rial Economics
http://slidepdf.com/reader/full/manege-rial-economics 57/74
Sunday, 24 May, 2009
What are the main techniques of demand estimation? What is their reliability?
Demand estimation is predicting future demand form a product. The information regarding
future demand is essential for planning and scheduling production, purchase of raw materials,
acquision of finance and advertising.
The various techniques of demand estimation: -
1.
Survey Method
2.
Statistical Method
Survey method is generally used where the purpose is to make short run forecast of demand.
Under this method, customer surveys are conducted to collect information about their intentions and future purchase plan.
Demand Estimation: The Consumer survey method
1.
8/2/2019 Manege Rial Economics
http://slidepdf.com/reader/full/manege-rial-economics 58/74
Consumer enumeration: - In this method, almost all the potential users of the product are
contacted and are asked about the future plan of purchasing the product in question. The
quantities indicated by the consumers are added together to obtain the probable demand for
the product.
2.
Sample survey method: - Under this method only a few potential consumers selected
from relevant market through a sampling method are surveyed, on the basis of the
information obtained, the probable demand may be estimated through the following formula.
D = HR (H.AD)
Hs
Where D = probable demand forecast
H = Census number of households from the relevant market.
Hs = number of households reporting demand for the product.
HR = number of households reporting demand for the product.
AD = average expected consumption by the reporting households.
3.
8/2/2019 Manege Rial Economics
http://slidepdf.com/reader/full/manege-rial-economics 59/74
End User Method: - The end user method of demand forecasting is used for estimating
demand for inputs. Making forecast by this method requires building up a schedule of
probable aggregate future demand for inputs by consuming industries and various other
sectors.
Demand Estimation: The Opinion poll Method
The opinion poll methods aim at collecting opinion of those who are supposed to possess
knowledge of the market e.g. sales representative, professional marketing experts and
consultants. The opinion poll method include
1. Expert opinion method: - Firms having a good network of sales representative can put
them to work of assessing the demand for the product in the areas that they represent. Sales
representative, beings in close touch with the consumers are supposed to know the future
purchase plans of their customer, their reaction to the market changes, their response to the
introduction of new products and the demand for competing products. They are, therefore, in
a position to provide an estimate of likely demand for their firm’s product in the area. The
estimates of demand thus obtained from different regions are added up to get the overall
probable demand for a product.
2. Delphi Method: - Delphi method is used to consolidate the divergent expert opinions
and arrived at a compromise estimate of future demand.
Under Delphi method the expert are provided information on estimates of forecast of other
experts along with the underlying assumptions. The experts may revise their own estimates in
the light of forecast made by other experts. The consensus of experts about the forecasts
constitutes the final forecast.
8/2/2019 Manege Rial Economics
http://slidepdf.com/reader/full/manege-rial-economics 60/74
Although this method is simple and inexpensive, it has its own limitations. First estimates
provided by sales representations and professional experts are reliable only to extenddepending upon their skill to analysis the market and their experience. Second, demand
estimates way involve the subjective judgement of the which may lead to over or under
estimation, finally, the assessment of market demand is usually based on inadequate
information’s, such as changes in GNP, available of credit, future prospects of the industry
etc, fall outside their purview.
3. Market studies and Experiments:- It is a method of collecting necessary information
regarding demand is to carry out market studies and experiments on consumer’s behavior
under actual through controlled market conditions. This method is known in common
parlance market conditions. This methods is known in common parlance as market
experiment method under this method, firms first select some areas of the representative
markets – three or four cities having similar features viz. Population, income levels, cultural
and social background, occupational distribution, choices and preferences of consumers.
Then, they carry out market experiments by changing prices, advt. Expenditure and other
controllable variable in the demand function under the assumption that other thing remains
same. The controlled variable may by changed over time either simultaneously in all themarkets or in all the markets or in the selected markets. After such changes are introduced in
the market, the consequent changes in the demand over a period of time (a week, a fortnight
or month) are recorded. On the basis of data collected elasticity coefficient are computed.
These coefficients are then used along with the variables of the demand function to assess the
demand for product
The market experiments methods have certain serious limitations. First, this method is very
expensive and hence cannot be afforded by small forms. Second, being a costly affair,
experiments are usually carried out on a scale too small to permit generalization with a high
degree of reliability.
Third experimental methods are based on short – term and controlled conditions that may
exist in an uncontrolled market. Hence, the results may not be applicable to the uncontrolled
long-term conditions of the market.
8/2/2019 Manege Rial Economics
http://slidepdf.com/reader/full/manege-rial-economics 61/74
Statistical method of demand projection include the following techniques
1.
Trends Projection Method
2.
Barometric Method and
3.
Economic Method
Demand Estimation: The Trends Projection Method
Trend projection method is a classical method of business forecasting. This method is
essentially concerned with the study of movement of variable through time. The use of this
method requires a long and reliable time series data. The trend projection method is used
under the assumption that the factors responsible for the past trends in variables to be projected (e.g. sales and demand) will continue to play their part in future in the same manner
and to the same extend as they did in the past in determining the magnitude and direction of
the variable.
There are three (3) techniques of trend projection based on time – series data.

8/2/2019 Manege Rial Economics
http://slidepdf.com/reader/full/manege-rial-economics 62/74
1.
Graphical Method: - under this method, annual sales data is plotted on a graph paper and
a line is drawn through the plotted points. Then a free hand line is so drawn that the totaldistance between the line and the point is minimum.
Sale
Years
Trend Projection
8/2/2019 Manege Rial Economics
http://slidepdf.com/reader/full/manege-rial-economics 63/74
Although this method is very simple and least expensive, the projections made through this
method are not very reliable. The reason is that the extension of the trend line involves
subjectivity and personal bias of the analysis.
2. Fitting Trend Equation: Least square method: - Fitting trend equation is a formal
technique of projecting the trend in demand. Under this method, a trend line (or curve) is
fitted to the time – series data with the aid of statistical techniques. The form of the trend
equation that can be fitted to the time series data is determined either by plotting the sales
data or by trying different forms of trend equations for the best fit.
When plotted, a time series date may show various trends. The most common types of trend
equation are 1) liner and 2) exponential trends
Linear Trend: - When a time series data reveals a rising trend in sales than a straight-line
trend equation of the following form is fitted
S = A + BT
Where S = annual sales
T = Time (in year)
A & B are constant. The parameter b given the measure of annual increase in sales
Exponential trend:- When sales ( or any dependent variable) have increased over the past
years at an increasing rate or at a constant percentage rate, than the appropriate trend equation
to be used is an exponential trend equation of any of the following type
1.
8/2/2019 Manege Rial Economics
http://slidepdf.com/reader/full/manege-rial-economics 64/74
Y = aebt
Or its semi – logarithmic for
Log y = = log a + bt
This form of trend equation is used when growth rate is constant.
2.
Double log trend equation of equation
Y = aTB
Or it’s double logarithmic form
Log y = log a + b log t
This form of trend equation is used when growth rate is increasing.
Limitation
The first limitations of this method arise out of the assumption that the past rate of change in
the dependent variable will persist in the future too. Therefore, the forecast based on this
method may be considered to be reliable only for the period during which this assumption
holds.
8/2/2019 Manege Rial Economics
http://slidepdf.com/reader/full/manege-rial-economics 65/74
Second, this method cannot be used for short-term estimates. Also it cannot be used where
trend is cyclical with sharp turning points of trough and perks.
3.
Box – Jenkins Method: - This method of forecasting is used only for short – term
predictions. Besides, this method is suitable for forecasting demand with only stationary time
series sales data. Stationary time series data is one, which does not reveal long term trend. In
other words, Box-Jenkins technique can be used only on those cases in which time-series
analysis depicts monthly or seasonal variation recurring with some degree of regularity.
Demand Estimation: The Barometric Method
Many economists use economic indicators as barometer to forecast trends in business
activities.
The basic approach of barometer technique is to construct an index of relevant economic
indicators and to forecast future trends on the basis of movements in the index of economic
indicators. The indicators used in this method are classified as
1.
Leading indicators: - consists of indicators which move up and down ahead of some other
series e.g. new order of durable goods, new building permits etc.
2.
8/2/2019 Manege Rial Economics
http://slidepdf.com/reader/full/manege-rial-economics 66/74
Coincidental indicators: - are the ones that move up and down simultaneously with the
level of economic activity. E.g. number of employees in the non-agricultural sector, rate of
unemployment, sales recorded by the manufacturing, trading and the retail sectors etc.
3.
Lagging indicators consists of those indicators, which follow a change after some time
lag. E.g. lending rate for short-term loans etc.
Development and allotment of land by Delhi Development Authority to Group Housing
Societies (a lead indicator) indicates higher demand prospects for cement, steel and other construction material (coincidental indicators) and increase in housing loan distribution
(lagging indicators).
Demand Estimation: The Econometric Method
The econometric methods combine statistical tools with economic theories to estimate
economic variables and to forecast the intended economic variables. An econometric model
may be single equation regression model or it may consist of a system of simultaneous
equations.
Regression method
Regression analysis is the most popular method of demand estimation. This method combines
economic theory and statistical techniques of estimation. Economic theory is employed to
specify the determinants of demand and to determine the nature of the relationship betweenthe demand for a product and its determinants. Economics theory thus helps in determining
8/2/2019 Manege Rial Economics
http://slidepdf.com/reader/full/manege-rial-economics 67/74
the general form of demand function. Statistical techniques are employed to estimate the
values of parameters in the estimation equation.
Simultaneous Equation Method
It involves estimating several behavioral equations. These equations are generally behavioral
equations, Mathematical equations and Market – clearing equations. The first step in this
technician is to develop a complete model and specify the behavioral assumption regarding
the variables included in the model. The variables that are included in the model are
1. Endogenous variables
2. Exogenous variables
Endogenous variables – the variables that are determined within the model are called
endogenous variables. Endogenous variables are included in the model as depended variablesthat are the variables that are to be explained by the model. These are also called controlled
variables. The number of equations included in the model must be equal to number of
endogenous variables.
Exogenous variables – are those that are determined outside the model. Exogenous variables
are inputs of the model whether a variable is treated endogenous variables or exogenous
variables depend on the purpose of the model. The examples of exogenous variables are “
Money Supply”, tax rates, govt. spending etc. The exogenous variables are also known as
uncontrolled variables.
10 Principles of Economics
Scarcity is taking over the world. “There just isn’t enough of anything” states the presenter;
there is not sufficient money and time. Due to this we have to decide how to distribute these
8/2/2019 Manege Rial Economics
http://slidepdf.com/reader/full/manege-rial-economics 68/74
scarcities. “Decision making is the essence of economics” states Gregory Mankiw, everyday
we make decisions and choices that help us allocate our scarcities. “Economics is the study of
mankind, in the ordinary business of life” was said almost a century old by Alfred Marshall.
Gregory Mankiw says that quote “captures economics perfectly” and it does, it studies the
decisions we make in order to deal with this scarcities, we make decisions and choiceseveryday, when we go shopping and choose what to buy, since there is an scarcity of money,
when we go to work and choose how many hours to work because there is an scarcity of life
and etc. We impact and shape our economy with every decision we make.
1. Tradeoffs
As we make decisions we make tradeoffs, which mean we choose something over something
else, or we have to give up something in order to have something else. Decisions such as
having a child involve a tradeoff between money for yourself, and money to buy the child hisnecessities; it also involves trading off time, since you are giving up your personal or free
time, for the time to give to the baby. In the movie a very good example of tradeoff is shown.
It shows a college student that wants to move to Washington when he finishes college, and
gives up some of the time he uses to study for tests or exams, for time to look for jobs in
Washington. Choosing his priorities over other ones makes him face a tradeoff. Society as a
whole also involves tradeoffs; the government has to choose how much money to use in
certain aspects of the country. Something that I personally liked and made me think was
when the movie shows how we face tradeoffs even in the environment, “We all want cleaner
air but the tradeoff can mean loss of income or even the loss of jobs for some Americans”says the presenter. I didn’t understand the relationship of this two until they talk about a coal
company in Ohio that had to be shut down because it was being harmful to the environment,
the consequences? More than a thousand persons lost their jobs, the community decided to
have a cleaner environment, but the tradeoff was the losing of the jobs of all those people.
2. Opportunity Cost
What you sacrifice in order to get something is its cost. The presenter and Gregory Mankiw
explain this principle with a college student. By choosing to go four years to college the
student’s costs are many. There is the cost of the money she is spending in books and tuition,
and also the “opportunity costs” as said by Mr. Mankiw because since she decided to go to
college she is giving up the opportunity of getting a job and the wages of the job she
would’ve taken. “Nothing comes for free, our time is worth something” says Todd Buchholz
an economists that makes you realize that a cost of something is not always involved with
money; the cost of something you do can be as simple as spending time with loved ones. This
segment of the movie contrasts to situations in where the opportunity cost varies, an example
shown is how the opportunity cost of a college student is reasonably low, since the student is
giving up low paying jobs, but the opportunity cost for a very talented high school athlete
8/2/2019 Manege Rial Economics
http://slidepdf.com/reader/full/manege-rial-economics 69/74
offered to go straight to professional is very high, because if he decides to go to college he is
giving up the millions of dollars he would earn being a professional athlete.
3. Marginal Thinking
A rational person like the college student shown in the movie thinks at the margin, when
given too much college work instead of quitting the job that earns her money for her personal
spending, she simply cuts back a little on the work hours. She is not radical; she is adjusting
instead of finishing, she is thinking at the margin. Another good example is that of a
Broadway that sometimes faces empty seats. So thinking at the margin they decide to bargain
with the public and sell them the seats at half the price some hours before the show instead of
having empty seats in the show. Adjusting the ticket’s price actually gains the theater more
revenues because even if it’s earning them 50% of the original cost, that’s more than zero, if
the seats would’ve stayed empty. By being rational and thinking at the margin better decisions and choices can be made.
4. Incentives
When the cost and the advantages of something vary or change, our decisions change too. “If
I want my son to wash my car I’ll say if you was my car you can use it tonight, that’s an
incentive” says Robert Sobel from Hofstra University and for me is the best explanation for
incentives. The incentive is that he can use the car that night, in other words he benefits fromsaying yes, but if they weren’t any incentives, he’ll probably doubt it. A very good example
they give on how we respond to incentives, and applies to today’s situation, is that of how we
response to the prices of gasoline. In Europe the price of gasoline is very high, this incentive
makes people buy smaller and more economic cars, in contrast to America where the price is
still relatively low, and people buy vans and big cars. Didn’t you notice that the stores and
streets were packed the “Tax Free Week” here in Florida? That is because people are
responding to incentives, incentives that benefit them; obviously you’ll do more shopping if
you are not going to be taxed. When President Clinton was in office, he asked for the
cigarettes prices to go up by a dollar and a half, because it was demonstrated that young
people would not buy cigarettes and smoke. This is a perfect example of a disincentive since
this discourages the youth from smoking. Another point explained is the behavior some
people take with incentives. Nowadays safety belts are required because is proven to save
lives but in the other hand “there is evidence that behavior does change in response to these
safety belts” states Mr. Gregory, since some people exceed speed limits because they feel
more secure.
5. Trade
8/2/2019 Manege Rial Economics
http://slidepdf.com/reader/full/manege-rial-economics 70/74
Since we are not self-sufficient we trade. “People specialize; people do particular tasks and
rely on other people to do other tasks for them” says Mr. Gregory. A hairstylist for example
trades her service (that is cutting hair) for money, and the other person relies on her the
hairstylist to get her hair cut. “The idea of: I have something and you have something and if
we exchange it we are both going to be better off, is fundamentally what economics is allabout” states Caroline Hoxby. We as humans and to be able to survive we trade, we
exchange, we rely. This is explained in another example shown in the movie. We rely in a
group of specialized farmers to grow the food for us, we both benefit since we get the food
and they are paid for producing the food. Countries also trade between them when they sell
each other products that they are good at making cheaper. We trade every day in order to
survive.
6. Markets
In markets agreements are made, and prices are settled, which then are communicated to the
world. In the food market farmers sell their goods, and supermarket owners buy them to then
sell it. Another type of market is the Stamp Market. Mark Easter a stamp dealer explains that
it is like the stock market where the dealers go for the highest price offered. The first person
who explained how a market system works was Adam Smith the grandfather of economics
published the first book about economics called “The Wealth of Nations” in 1776. How can
buyers and sellers interact to each other and not create chaos? Adam Smith said “that markets
are guided as if by an invisible hand at least to a desirable allocation of resources.” We all
have interests, and if we all try to achieve them, we are all going to be happy. The invisiblehand is explained in the movie with a simple example from Mr. Sobel he says, “If I have a
$25 dollars and you have a good and you want to sell it to me, we both win, you wanted the
$25 dollars more than the good, and I wanted the good more than $25 dollars.” The key of the
invisible hand are prices, the sellers and consumers depend on them. When communism fell
in Russia and Eastern Europe it showed that free market is the best way to operate, since
people know what they want, how the want it, at how much they want to buy it and etc.
7. Government
Sometimes the government gets involved in developing better outcomes. This happens when
any of two situations happens. First if the market outcome is not efficient, and second if it
fails to distribute the income efficiently. In many cases, externality is the cause of failure.
“Externality is when a company or an individual creates something that has an impact beyond
the immediate buyers and sellers of that product. Electricity plants are obviously benefiting
the users and buyers of electricity but it also has an externality since the smoke produced by
them can harm the health of a person. Market power can also lead to market failures, since a
certain firm or person’s services is outsized and can control and influence prices. When the
market is not being fair the government also intervenes. Some people get paid for their services more than other; this is something that cannot be controlled by the invisible hand.
8/2/2019 Manege Rial Economics
http://slidepdf.com/reader/full/manege-rial-economics 71/74
When the government gets involved is because the situation is very complicated, the more
complicated it gets, the harder it gets for the government to fix it.
8. Productivity
Statistics show that in 1998 the average American had a yearly income of $31,500, the
average Mexican of $8,300 and the average Indian of $1700. You can notice that their quality
of life is not the same for example Americans live better than Indians. Productivity explains it
all; a rich country produces more than a poor one. And productivity depends on skills, capital
and etc. If a country has a well educated work force, productivity will rise. Economic
freedom and liberty means more productivity. An ideal example is the US and Hong Kong,
where people are free to use their brains to create goods, services, or ideas that can be taken
to the market where consumers take advantage of them.
9. Inflation
This basically means inflation which means that prices rise in order to mirror all the money
that is being print out. The printing of money is something that needs to be controlled
because even though it might “temporarily make the people feel wealthier” as said by Todd
Buchholz, at some point prices will start going up, and inflation will come in play, and it will
be very hard to take back under control. Stability between goods and money is the best way
to keep inflation away.
10. The Phillips Curve
The Federal Reserve Chairman is supposed to maintain unemployment low, and inflation
under control. Mr. Mankiw states that you can’t achieve both goals at the same time and that
the policy instrument is money supply. When one goes up the other one goes down and vice
versa, this is called The Phillips Curve. As stated in the movie this is a short run tradeoff, you
have to choose on over the other one. But nowadays this tradeoff does not really exist
because in the past year both inflation and unemployment has gone down. This doesn’t mean
that The Phillips Curve would not come in play again, some economists say it will.
Understanding these 10 principles is the key to understanding the whole concept of
economics.
Explain Baumol’s theory of sales revenue maximization
8/2/2019 Manege Rial Economics
http://slidepdf.com/reader/full/manege-rial-economics 72/74
According to Baumol, every business firm aims at maximization it sales revenue (price x
quantity0 rather than its profit. Hence his hypothesis has come to be known as sales
maximization theory & revenue maximization theory. According to baumol, sales have
become an end by themselves and accordingly sales maximization has become the ultimate
objective of the firm. Hence, the management of a firm directs its energies in promoting and
maximizing its sales revenue instead of profit.
The goal of sales maximization is explained by the management’s desire to maintain the
firm’s competitive position, which is dependent to a large extent on its size. Unlike the
shareholders who are interested in profit, the management is interested in sales revenue,either because large sales revenue is a matter of prestige or because its remuneration is often
related to the size of the firm’s operations than to its profits. Baumol, however does not
ignore the cost of production which has to be covered and also a margin of profit. In fact, he
advocates the adoption of a price, which will cover the cost and also will yield a minimum
rate of profits. That is, while the firm is maximizing its revenue from sales, it should also
“enough or more than enough profits” to keep the shareholders satisfied. According to
Baumol the typical digopolists objective can usually be characterized approximately as sales
maximization output does not yield adequate profit, the firm will have to choose that output
which will yield adequate profit even through it may not achieve sales maximization.
Theory of capital and investment decision.
Environmental issues pertain to the general business environment in which a business
operates. They are related to the overall economic, social and political atmosphere of the
country. The factors which constitute economic environment of a country include the
following factors:-
1. The type of economic system of the country
2. General trend in production, employment, income, price, savings and investment etc
3. Structure of the trends in the working of financial institutes e.g. banks, financial co-
operations, insurance companies
4. Magnitudes of trends in foreign trend
8/2/2019 Manege Rial Economics
http://slidepdf.com/reader/full/manege-rial-economics 73/74
5. Trends in labor and capital markets
6. Government’s economic policies e.g.. industrial policy, monetary policy, fiscal policy,
price policy etc.
7. Social factors like the value system of the society, property rights, customs and habits
8. Social organizations like trade unions, customer’s co-operatives and producers union
9. The degree of openness of the economy and the influence MNCs
What do you understand by Opportunity cost ?
The concept of opportunity cost is attributed to the alternate uses of scarce resources.
Resources both natural and man made, are scarce in relation to their demand to satisfy the
ever growing human needs and the resources have alternative use. The scarcity and the
alternative uses of the resources give rise to the concept of opportunity cost.
Opportunity cost of availing an opportunity is the expected income forgone from the second
best opportunity of using the resources.
The opportunity cost is also called Alternate Cost, had the resources available to a person, a
firm or a society been unlimited there would be no opportunity cost. But since resources are
limited, opportunity cost can never be zero.
Opportunity Cost in Finance
Suppose a firm has Rs. 100 million at its disposal and there are only three alternative uses :-
Alternative:-
1. To expand the size of the firm
2. To set up a new production unit in another locality and
3. To buy shares in another firm
8/2/2019 Manege Rial Economics
http://slidepdf.com/reader/full/manege-rial-economics 74/74
Suppose the expected annual return from the three alternatives uses of finance are :-
Alternative 1:- Expansion of the size of the firm - Rs. 20 million
Alternative 2:- Setting up a new production unit - Rs. 18 million
Alternative 3:- Buying shares in another firm - Rs. 16 million
All other steps being the same , rational decision-making would suggest invest the money in
alternative – 1. This implies that the manager would have to sacrifice the annual return of Rs.
18 million expected from Alternative – 2.
In economic jargon Rs. 18 million is called annual opportunity cost of an annual income of
Rs. 20
million.
Opportunity Cost in Production
Suppose that a firm has a sum of Rs.100000 which it has only two alternative uses. It can
either buy a printing machine or alternatively a lathe machine, both having a productive life
of 10 years. From the printing machine , the firm expects an annual income of Rs. 20,000 and
from the lathe, Rs. 15,000. A profit maximizing firm would invest its money in the printing
machine and forego the expected income from printing machine is the expected income from
the lathe i.e.. Rs.15000.
Opportunity Cost in Marketing
Suppose a company can sell a basket of apples for Rs. 1000/- in foreign market, for Rs. 600/-in domestic market . The company hence should export its produce . Hence the opportunity
cost from export market is the expected income from domestic market i.e.. Rs. 600/- per
market.