Embed Size (px)
DESCRIPTION
Manhattan Market Compass - Q4 2015 Report
Citation preview

Q 4 Q 4 Q 4 Q 4 Q 4 Q 4 Q 4 Q 4 Q 4 Q 4 Q 4 Q 4 Q 4 Q 4 Q 4 Q 4 Q 4 Q 4 Q 4
4 Q 4 Q 4 Q 4 Q 4 Q 4 Q 4 Q 4 Q 4 Q 4 Q 4 Q 4 Q 4 Q 4 Q 4 Q 4 Q 4 Q 4 Q 4 Q
Q 4 Q 4 Q 4 Q 4 Q 4 Q 4 Q 4 Q 4 Q 4 Q 4 Q 4 Q 4 Q 4 Q 4 Q 4 Q 4 Q 4 Q 4 Q 4
4 Q 4 Q 4 Q 4 Q 4 Q 4 Q 4 Q 4 Q 4 Q 4 Q 4 Q 4 Q 4 Q 4 Q 4 Q 4 Q 4 Q 4 Q 4 Q
Q 4 Q 4 Q 4 Q 4 Q 4 Q 4 Q 4 Q 4 Q 4 Q 4 Q 4 Q 4 Q 4 Q 4 Q 4 Q 4 Q 4 Q 4 Q 4
4 Q 4 Q 4 Q 4 Q 4 Q 4 Q 4 Q 4 Q 4 Q 4 Q 4 Q 4 Q 4 Q 4 Q 4 Q 4 Q 4 Q 4 Q 4 Q
Q 4 Q 4 Q 4 Q 4 Q 4 Q 4 Q 4 Q 4 Q 4 Q 4 Q 4 Q 4 Q 4 Q 4 Q 4 Q 4 Q 4 Q 4 Q 4
4 Q 4 Q 4 Q 4 Q 4 Q 4 Q 4 Q 4 Q 4 Q 4 Q 4 Q 4 Q 4 Q 4 Q 4 Q 4 Q 4 Q 4 Q 4 Q
Q 4 Q 4 Q 4 Q 4 Q 4 Q 4 Q 4 Q 4 Q 4 Q 4 Q 4 Q 4 Q 4 Q 4 Q 4 Q 4 Q 4 Q 4 Q 4
4 Q 4 Q 4 Q 4 Q 4 Q 4 Q 4 Q 4 Q 4 Q 4 Q 4 Q 4 Q 4 Q 4 Q 4 Q 4 Q 4 Q 4 Q 4 Q
Q 4 Q 4 Q 4 Q 4 Q 4 Q 4 Q 4 Q 4 Q 4 Q 4 Q 4 Q 4 Q 4 Q 4 Q 4 Q 4 Q 4 Q 4 Q 4
4 Q 4 Q 4 Q 4 Q 4 Q 4 Q 4 Q 4 Q 4 Q 4 Q 4 Q 4 Q 4 Q 4 Q 4 Q 4 Q 4 Q 4 Q 4 Q
Q 4 Q 4 Q 4 Q 4 Q 4 Q 4 Q 4 Q 4 Q 4 Q 4 Q 4 Q 4 Q 4 Q 4 Q 4 Q 4 Q 4 Q 4 Q 4
4 Q 4 Q 4 Q 4 Q 4 Q 4 Q 4 Q 4 Q 4 Q 4 Q 4 Q 4 Q 4 Q 4 Q 4 Q 4 Q 4 Q 4 Q 4 Q
Q 4 Q 4 Q 4 Q 4 Q 4 Q 4 Q 4 Q 4 Q 4 Q 4 Q 4 Q 4 Q 4 Q 4 Q 4 Q 4 Q 4 Q 4 Q 4
4 Q 4 Q 4 Q 4 Q 4 Q 4 Q 4 Q 4 Q 4 Q 4 Q 4 Q 4 Q 4 Q 4 Q 4 Q 4 Q 4 Q 4 Q 4 Q
Q 4 Q 4 Q 4 Q 4 Q 4 Q 4 Q 4 Q 4 Q 4 Q 4 Q 4 Q 4 Q 4 Q 4 Q 4 Q 4 Q 4 Q 4 Q 4
4 Q 4 Q 4 Q 4 Q 4 Q 4 Q 4 Q 4 Q 4 Q 4 Q 4 Q 4 Q 4 Q 4 Q 4 Q 4 Q 4 Q 4 Q 4 Q
Q 4 Q 4 Q 4 Q 4 Q 4 Q 4 Q 4 Q 4 Q 4 Q 4 Q 4 Q 4 Q 4 Q 4 Q 4 Q 4 Q 4 Q 4 Q 4
4 Q 4 Q 4 Q 4 Q 4 Q 4 Q 4 Q 4 Q 4 Q 4 Q 4 Q 4 Q 4 Q 4 Q 4 Q 4 Q 4 Q 4 Q 4 Q
Q 4 Q 4 Q 4 Q 4 Q 4 Q 4 Q 4 Q 4 Q 4 Q 4 Q 4 Q 4 Q 4 Q 4 Q 4 Q 4 Q 4 Q 4 Q 4
4 Q 4 Q 4 Q 4 Q 4 Q 4 Q 4 Q 4 Q 4 Q 4 Q 4 Q 4 Q 4 Q 4 Q 4 Q 4 Q 4 Q 4 Q 4 Q
Q 4 Q 4 Q 4 Q 4 Q 4 Q 4 Q 4 Q 4 Q 4 Q 4 Q 4 Q 4 Q 4 Q 4 Q 4 Q 4 Q 4 Q 4 Q 4
4 Q 4 Q 4 Q 4 Q 4 Q 4 Q 4 Q 4 Q 4 Q 4 Q 4 Q 4 Q 4 Q 4 Q 4 Q 4 Q 4 Q 4 Q 4 Q
Q 4 Q 4 Q 4 Q 4 Q 4 Q 4 Q 4 Q 4 Q 4 Q 4 Q 4 Q 4 Q 4 Q 4 Q 4 Q 4 Q 4 Q 4 Q 4
4 Q 4 Q 4 Q 4 Q 4 Q 4 Q 4 Q 4 Q 4 Q 4 Q 4 Q 4 Q 4 Q 4 Q 4 Q 4 Q 4 Q 4 Q 4 Q
Q 4 Q 4 Q 4 Q 4 Q 4 Q 4 Q 4 Q 4 Q 4 Q 4 Q 4 Q 4 Q 4 Q 4 Q 4 Q 4 Q 4 Q 4 Q 4
4 Q 4 Q 4 Q 4 Q 4 Q 4 Q 4 Q 4 Q 4 Q 4 Q 4 Q 4 Q 4 Q 4 Q 4 Q 4 Q 4 Q 4 Q 4 Q
Q 4 Q 4 Q 4 Q 4 Q 4 Q 4 Q 4 Q 4 Q 4 Q 4 Q 4 Q 4 Q 4 Q 4 Q 4 Q 4 Q 4 Q 4 Q 4
4 Q 4 Q 4 Q 4 Q 4 Q 4 Q 4 Q 4 Q 4 Q 4 Q 4 Q 4 Q 4 Q 4 Q 4 Q 4 Q 4 Q 4 Q 4 Q
Q 4 Q 4 Q 4 Q 4 Q 4 Q 4 Q 4 Q 4 Q 4 Q 4 Q 4 Q 4 Q 4 Q 4 Q 4 Q 4 Q 4 Q 4 Q 4
4 Q 4 Q 4 Q 4 Q 4 Q 4 Q 4 Q 4 Q 4 Q 4 Q 4 Q 4 Q 4 Q 4 Q 4 Q 4 Q 4 Q 4 Q 4 Q
Q 4 Q 4 Q 4 Q 4 Q 4 Q 4 Q 4 Q 4 Q 4 Q 4 Q 4 Q 4 Q 4 Q 4 Q 4 Q 4 Q 4 Q 4 Q 4
4 Q 4 Q 4 Q 4 Q 4 Q 4 Q 4 Q 4 Q 4 Q 4 Q 4 Q 4 Q 4 Q 4 Q 4 Q 4 Q 4 Q 4 Q 4 Q
Q 4 Q 4 Q 4 Q 4 Q 4 Q 4 Q 4 Q 4 Q 4 Q 4 Q 4 Q 4 Q 4 Q 4 Q 4 Q 4 Q 4 Q 4 Q 4
4 Q 4 Q 4 Q 4 Q 4 Q 4 Q 4 Q 4 Q 4 Q 4 Q 4 Q 4 Q 4 Q 4 Q 4 Q 4 Q 4 Q 4 Q 4 Q
Q 4 Q 4 Q 4 Q 4 Q 4 Q 4 Q 4 Q 4 Q 4 Q 4 Q 4 Q 4 Q 4 Q 4 Q 4 Q 4 Q 4 Q 4 Q 4
4 Q 4 Q 4 Q 4 Q 4 Q 4 Q 4 Q 4 Q 4 Q 4 Q 4 Q 4 Q 4 Q 4 Q 4 Q 4 Q 4 Q 4 Q 4 Q
Q 4 Q 4 Q 4 Q 4 Q 4 Q 4 Q 4 Q 4 Q 4 Q 4 Q 4 Q 4 Q 4 Q 4 Q 4 Q 4 Q 4 Q 4 Q 4
4 Q 4 Q 4 Q 4 Q 4 Q 4 Q 4 Q 4 Q 4 Q 4 Q 4 Q 4 Q 4 Q 4 Q 4 Q 4 Q 4 Q 4 Q 4 Q
Q 4 Q 4 Q 4 Q 4 Q 4 Q 4 Q 4 Q 4 Q 4 Q 4 Q 4 Q 4 Q 4 Q 4 Q 4 Q 4 Q 4 Q 4 Q 4
4 Q 4 Q 4 Q 4 Q 4 Q 4 Q 4 Q 4 Q 4 Q 4 Q 4 Q 4 Q 4 Q 4 Q 4 Q 4 Q 4 Q 4 Q 4 Q
Q 4 Q 4 Q 4 Q 4 Q 4 Q 4 Q 4 Q 4 Q 4 Q 4 Q 4 Q 4 Q 4 Q 4 Q 4 Q 4 Q 4 Q 4 Q 4
4 Q 4 Q 4 Q 4 Q 4 Q 4 Q 4 Q 4 Q 4 Q 4 Q 4 Q 4 Q 4 Q 4 Q 4 Q 4 Q 4 Q 4 Q 4 Q
Q 4 Q 4 Q 4 Q 4 Q 4 Q 4 Q 4 Q 4 Q 4 Q 4 Q 4 Q 4 Q 4 Q 4 Q 4 Q 4 Q 4 Q 4 Q 4
4 Q 4 Q 4 Q 4 Q 4 Q 4 Q 4 Q 4 Q 4 Q 4 Q 4 Q 4 Q 4 Q 4 Q 4 Q 4 Q 4 Q 4 Q 4 Q
Q 4 Q 4 Q 4 Q 4 Q 4 Q 4 Q 4 Q 4 Q 4 Q 4 Q 4 Q 4 Q 4 Q 4 Q 4 Q 4 Q 4 Q 4 Q 4
4 Q 4 Q 4 Q 4 Q 4 Q 4 Q 4 Q 4 Q 4 Q 4 Q 4 Q 4 Q 4 Q 4 Q 4 Q 4 Q 4 Q 4 Q 4 Q
Q 4 Q 4 Q 4 Q 4 Q 4 Q 4 Q 4 Q 4 Q 4 Q 4 Q 4 Q 4 Q 4 Q 4 Q 4 Q 4 Q 4 Q 4 Q 4
4 Q 4 Q 4 Q 4 Q 4 Q 4 Q 4 Q 4 Q 4 Q 4 Q 4 Q 4 Q 4 Q 4 Q 4 Q 4 Q 4 Q 4 Q 4 Q
Q 4 Q 4 Q 4 Q 4 Q 4 Q 4 Q 4 Q 4 Q 4 Q 4 Q 4 Q 4 Q 4 Q 4 Q 4 Q 4 Q 4 Q 4 Q 4
4 Q 4 Q 4 Q 4 Q 4 Q 4 Q 4 Q 4 Q 4 Q 4 Q 4 Q 4 Q 4 Q 4 Q 4 Q 4 Q 4 Q 4 Q 4 Q
Q 4 Q 4 Q 4 Q 4 Q 4 Q 4 Q 4 Q 4 Q 4 Q 4 Q 4 Q 4 Q 4 Q 4 Q 4 Q 4 Q 4 Q 4 Q 4
4 Q 4 Q 4 Q 4 Q 4 Q 4 Q 4 Q 4 Q 4 Q 4 Q 4 Q 4 Q 4 Q 4 Q 4 Q 4 Q 4 Q 4 Q 4 Q
Q 4 Q 4 Q 4 Q 4 Q 4 Q 4 Q 4 Q 4 Q 4 Q 4 Q 4 Q 4 Q 4 Q 4 Q 4 Q 4 Q 4 Q 4 Q 4
4 Q 4 Q 4 Q 4 Q 4 Q 4 Q 4 Q 4 Q 4 Q 4 Q 4 Q 4 Q 4 Q 4 Q 4 Q 4 Q 4 Q 4 Q 4 Q
Q 4 Q 4 Q 4 Q 4 Q 4 Q 4 Q 4 Q 4 Q 4 Q 4 Q 4 Q 4 Q 4 Q 4 Q 4 Q 4 Q 4 Q 4 Q 4
4 Q 4 Q 4 Q 4 Q 4 Q 4 Q 4 Q 4 Q 4 Q 4 Q 4 Q 4 Q 4 Q 4 Q 4 Q 4 Q 4 Q 4 Q 4 Q
Q 4 Q 4 Q 4 Q 4 Q 4 Q 4 Q 4 Q 4 Q 4 Q 4 Q 4 Q 4 Q 4 Q 4 Q 4 Q 4 Q 4 Q 4 Q 4
4 Q 4 Q 4 Q 4 Q 4 Q 4 Q 4 Q 4 Q 4 Q 4 Q 4 Q 4 Q 4 Q 4 Q 4 Q 4 Q 4 Q 4 Q 4 Q
Q 4 Q 4 Q 4 Q 4 Q 4 Q 4 Q 4 Q 4 Q 4 Q 4 Q 4 Q 4 Q 4 Q 4 Q 4 Q 4 Q 4 Q 4 Q 4
4 Q 4 Q 4 Q 4 Q 4 Q 4 Q 4 Q 4 Q 4 Q 4 Q 4 Q 4 Q 4 Q 4 Q 4 Q 4 Q 4 Q 4 Q 4 Q
Q 4 Q 4 Q 4 Q 4 Q 4 Q 4 Q 4 Q 4 Q 4 Q 4 Q 4 Q 4 Q 4 Q 4 Q 4 Q 4 Q 4 Q 4 Q 4
4 Q 4 Q 4 Q 4 Q 4 Q 4 Q 4 Q 4 Q 4 Q 4 Q 4 Q 4 Q 4 Q 4 Q 4 Q 4 Q 4 Q 4 Q 4 Q
Q 4 Q 4 Q 4 Q 4 Q 4 Q 4 Q 4 Q 4 Q 4 Q 4 Q 4 Q 4 Q 4 Q 4 Q 4 Q 4 Q 4 Q 4 Q 4
4 Q 4 Q 4 Q 4 Q 4 Q 4 Q 4 Q 4 Q 4 Q 4 Q 4 Q 4 Q 4 Q 4 Q 4 Q 4 Q 4 Q 4 Q 4 Q
Q 4 Q 4 Q 4 Q 4 Q 4 Q 4 Q 4 Q 4 Q 4 Q 4 Q 4 Q 4 Q 4 Q 4 Q 4 Q 4 Q 4 Q 4 Q 4
4 Q 4 Q 4 Q 4 Q 4 Q 4 Q 4 Q 4 Q 4 Q 4 Q 4 Q 4 Q 4 Q 4 Q 4 Q 4 Q 4 Q 4 Q 4 Q
2 0 1 5
C O M P A S S
M A N H A T T A N
M A R K E T
R E P O R T

01
EXECUTIVE SUMMARYQ4 2015 MARKET REPORT
Introducing the Compass Q4 2015 Manhattan Market Report
This report highlights the prevailing trends shaping the marketplace from this past quarter, and provides a glimpse into the research and data analytics in which Compass prides itself.

02
We hope to leave you with distinctive and useful insights on the
dynamic Manhattan real estate market.
There were several key trends observed throughout the fourth
quarter, and we would like to highlight three of them:
• The median price for a Manhattan property surged to $1.2M
during the fourth quarter.
• Four major submarkets set record median prices: the Upper
West Side, Downtown, Midtown East, and Midtown West.
• Properties spent an average of 48 days on the market, while
total supply measured 6.8 months.
As we enter 2016, we expect prices to continue to climb as many
new developments initiate the closing process. Inventory is
forecast to remain in short supply. The ultra-luxury sector will
continue to be closely watched as the sales pace in this price
bracket has slowed. Several new high-end developments currently
in construction will add additional supply to what is already
a crowded sector of the market.

Q4 2015 MARKET REPORT
03
MARKET HIGHLIGHTS
Total Available Listings in Manhattan:
8,740
Market Highlights

04
Median Days on Market
48
New Record - Median Price in Manhattan
$1,240,000New Record - Downtown
$1.7M
New Record - Midtown East
$923KNew Record - Midtown West
$1.4M
New Record - UWS
$1.3M
Share of Inventory Over $3M
23.9%

05
PRICESQ4 2015 MARKET REPORT
Prices
As supply decreased, demand strengthened and prices surged. With a multitude of luxury new development closings underway, record prices were set in Manhattan and in four major submarkets: Midtown East, Midtown West, Downtown, and the Upper West Side.

06
FIGURE YoY MEDIAN PRICE $1,240,000 +31.0%
CONDO - RESALE $1,700,000 +25.0%CO-OP - RESALE $769,500 +6.0%NEW DEVELOPMENT $2,088,706 +21.0%
CONDO PPSF: $1,533 +10.0%
BY LISTING STATUS
ASKING: $1,622,500 +8.0%IN-CONTRACT: $1,266,349 +31.0%

07
PRICESQ4 2015 MARKET REPORT
Historic PPSF Trends
The chart depicts the overall median closing PPSF trends from Q1 2006 to Q4 2015 in Manhattan. PPSF measured $1,385 this quarter.
‘07 ‘08 ‘09 ‘11‘10 ‘13‘12 ‘14 ‘15
1.5K
1.3K
1.1K
900
PPSF
(in
$)
Time (Year)
Source: Compass Research
‘06

08
Median Manhattan Price Tops $1.2M
The median price in Manhattan continued to climb in the fourth
quarter, topping $1.2M for the first time and reaching an all-time
record. This represents a 17% increase over the Q3 median price of
$1M and a 31% jump from the median price of $970,000 one year
ago. Notably, the median price is 59% higher than at the trough of
the recession when the reported median was $800,000 in Q4 2009.
The increase was due in large part to the significant number of new
development closings, many of which entered into contract over
the past two years.
Condo resale prices were up a significant amount in the fourth
quarter, jumping 28% from $1.3M last quarter to $1.7M. Property
demand and appreciation in Manhattan resulted in a 78% climb
from the recession-low of $956,000. Year-over-year, condo prices
were up 25% from $1.4M. Median resale co-op price remained flat
this quarter at $770,000, down 3% from $795,000 in Q3 2015. Year-
over-year, co-op prices were up 6% from $728,000 and up 24% from
the $620,000 median in Q4 2009.
New development properties have experienced dramatic increases
over time, reaching a record $2M in Q4. This is an 18% increase
from Q3 when the median price was $1.8M and a 21% increase
from Q4 2014 when the median price was $1.7M. Since 2009,
new development median prices have risen 83%, the most of
any property type. When compared to overall properties, new
development commanded a 64% premium, or $818,000.
Main Points:• Median Manhattan Price Tops $1.2M
• New Development Closings Generated Record Prices
in Four Major Markets
• Record Prices Set on the Upper West Side and Downtown

09
PRICESQ4 2015 MARKET REPORT
New Development Closings Generated Record Prices in Four Major Submarkets
As new development closings commenced across Manhattan,
record prices were set in four submarkets. The largest year-over-
year increase was on the Upper West Side which reached a record
$1.3M this quarter, up 40% from $925,000 in Q4 2014. This was also
an 8% increase from last quarter, when the median price was $1.2M.
New developments in the market include 50 Riverside Boulevard,
which played a significant role in overall closings this quarter,
accounting for nearly 22% of total submarket closures.
Downtown observed a significant increase since Q4 2014, up
39% from $1.2M to $1.7M. The most expensive submarket in
the city continued to attract a diverse clientele to the varying
neighborhoods throughout the area. Notable new developments
include 212 Warren in TriBeCa, 35 West 15th Street in Flatiron,
150 Charles Street in the West Village, 400 Park Avenue South in
NoMad, 505 West 19th Street in West Chelsea, and 36 Bleecker
Street in NoHo. These closings fueled 24% median price growth
over Q3, when the median was $1.4M.
Both Midtown neighborhoods also had price increases. Midtown
East, once known solely as a business district, now attracts a wide-
range of individuals to the varying housing options. The median
price was up 20% from Q4 2014 reaching $923,000. This was a
9% quarter-over-quarter increase from $850,000. Closings from
50 United Nations Plaza, 305 East 51st Street, and 325 Lexington
contributed to the rise.

Midtown West experienced a surge in construction as the Hudson
Yards office complex, the largest single-development project in the
nation, exhibited visual signs of progress, fueling additional growth
in the surrounding area. Prominent conversions include The
Sorting House at 318 West 52nd Street and Fifty Third and Eighth
located at 301 West 53rd Street. The median price set a new record
in Q4 topping $1.4M. The measurable jump is up 36% from one year
ago when the median was $1M and up 44% since last quarter.
PPSF Up 17% from One Year Ago
The median PPSF was up 17% year-over-year reaching a record-
breaking $1,385 and topping the pre-recession peak of $1,129 by
23%. Q4 was up 53% from the recession low of $902. Quarter-
over-quarter, the PPSF increase measured 11%, the highest single-
quarter increase reported since 2006.
Median condo resale PPSF was $1,532, surpassing the $1,500 mark
for the first time. The jump - up 8% from Q3 and 10% year-over-
year - continued from the overall upward trend; the current level
is up 56% from the recession low of $982. Resale co-ops recorded a
record median PPSF level, peaking at $977, up 1% from last quarter,
9% year-over-year, and 34% from $730 during the recession.
New development median PPSF levels also hit new highs, recording
$1,744 this quarter. This is a 12% jump from last quarter when the
median was $1,554, and a 6% jump from Q4 2014 when the median
was $1,638. Since the recession, new development PPSF has seen a
62% price increase.
10

11
PRICESQ4 2015 MARKET REPORT
Median Price By Property Type
The chart depicts the overall median closing prices by property type in Manhattan from Q1 2010 to Q4 2015. All property types with the exception of condos increased this quarter while median price increased to the highest point ever at $1,240,000.
2.0M
1.7M
1.4M
1.1M
800K
500K
0
2010 2011 2012
Med
ian
Pric
e (in
$)
Source: Compass Research
Time (Year)

12
OVERALL CONDO CO-OP NEW DEV
2012
Time (Year)
2013 2014 2015

13
INVENTORYQ4 2015 MARKET REPORT
Inventory
Inventory hit the lowest level of the past eight consecutive quarters, with 8,740 available units. As overall availability declined, less expensive properties decreased share while more expensive properties continued to increase market share.

14
FIGURE SHARE YoY AVAILABLE: 8,740 -13.0%
PRICE CATEGORY
<$500K: 852 9.9% -36.2%$500K-1M: 2,129 24.9% -9.1%$1M-3M: 3,071 35.9% -4.8%$3-5M: 995 11.6% +2.6%$5-10M: 903 10.5% -14.2%$10M+: 615 7.2% -5.7%
PROPERTY TYPE
CONDO: 4,168 47.7% -17.3%CO-OP: 3,988 45.6% -11.0%
BEDROOM TYPE
STUDIO: 1,149 13.5% -18.6%1BR: 2,696 31.6% -16.4%2BR: 2,433 28.5% -12.0%3BR: 1,256 14.7% -16.7%4BR+: 992 11.6% -13.7%

15
INVENTORYQ4 2015 MARKET REPORT
Q4 Available Inventory Shares by Price Category
The chart depicts the total available listing percentage (%) shares as they relate to price categories. Q4 2015 witnessed the smallest % shares of available inventory amongst any Q4 with only 34.8% of available inventory falling below the $1M threshold.
‘08‘07 ‘09 ‘11‘10 ‘13‘12 ‘14 ‘15
100%
80%
60%
40%
20%
0%
Ava
ilabl
e In
vent
ory
Shar
e (in
%)
Time (Year)
Source: Compass Research
‘06
<S500K $500K-$1M $1M-3M $3M-5M
$5M-10M $10M+

16
Inventory Shrank While Demand Remained Steady
Overall inventory was compressed throughout the year, with the
fourth quarter continuing the downward trend. Available units
dipped 11% from last quarter and 13% year-over-year to 8,740, the
lowest level recorded in eight quarters. Fourth quarter inventory
was also down 5% from the 10-year quarterly average of 9,210 units.
Carryover inventory, defined as available inventory that was listed
prior to the fourth quarter, accounted for 50% of total properties.
This marked a shift from the previous quarter when 74% of
active listings were carried over, suggesting a newly heightened
marketplace where properties are being traded at a more rapid rate.
The constrained inventory is due in part to a lack of high-density
buildings being constructed throughout Manhattan as developers
build fewer, larger apartments, attempting to maximize the
premium PPSF for larger bedroom counts. Furthermore, in what
has been widely perceived as a bull-market, sellers have delayed
listing properties expecting further appreciation in the future.
Main Points:• Inventory Shrank While Demand Remained Steady
• Less Expensive Properties Reduced Share as Pricey Listings
Remained on Market
• Condo and Co-op Inventory Shares Balanced

17
INVENTORYQ4 2015 MARKET REPORT
Less Expensive Properties Reduced Share as Pricey Listings Remained on Market
Listings priced under $500,000 reduced market share by 4% from
Q4 2014 to 9.9%. This is the first time the price bracket entered
single-digits in the fourth quarter. The decline in share, down
a remarkable 39% from the 10-year quarterly average of 16.4%,
signifies the strong demand and limited supply, where properties
listed in this price category often sell at a much more rapid rate
than those priced at higher levels.
In contrast, listings priced at $10M+ controlled 7% of market share.
This represents a 95% increase over the 10-year quarterly average of
4% and the fifth straight fourth quarter of an increase in total share.
The rise is twofold: developers are constructing more ultra-luxury
apartments in this price category while these apartments take a
significant longer period of time to sell. As more listings are added
to this price category, selling at a comparatively slower rate, the
market becomes ‘top-heavy’ as total share increases.
For the second straight fourth quarter, the $3-5M and $5-10M price
brackets controlled double-digit shares of the market. The $3-5M
bracket increased 1% year-over-year to 12% while the $5-10M
segment remained flat at 11%.
Condo and Co-op Shares Balanced
Condo inventory accounted for 48% of total inventory, consistent
with Q3 2015 but down from 50% one year ago. The total share is
up from the 10-year average of 47% as well as the post-recession

18
average of 45%. The increase in total condo share signals a growing
and expanding market with more new development than the post-
recession years.
As the share of condo inventory rose, co-op shares maintained
from the previous quarter at 46%. However, this is down from the
post-recession average of 48% and down slightly from the 10-year
average of 47%. Prior to the recession, condo share was 55% of
inventory while co-ops were 38%.
Amongst new inventory, condos and co-ops both accounted for
47% of total share. For condos, this is an increase from the 10-year
average of 44% and up from the post-recession average of 43%.
However, co-ops lost share from the 10-year average of 50% and the
post-recession average of 51%.
19
INVENTORYQ4 2015 MARKET REPORT
15K
14K
12K
10K
8K
6K
4K
2K
0
Tota
l Num
ber o
f Uni
ts
2010 2011 2012
Time (Year)

20
2012
Total Available Inventory
The chart depicts the total available inventory for each quarter from Q1 2010 to Q4 2015. Total inventory in Q4 2015 was 8,740.
Time (Year)
Source: Compass Research
OVERALL CONDO CO-OP
2013 2014 2015

21
TIME ON MARKETQ4 2015 MARKET REPORT
Time on Market
Q4 2015 properties recorded the highest median sold price while spending the least amount of time on the market of any fourth quarter in the past 10 years.

22
FIGURE YoY TIME ON MARKET (DAYS): 48 -23.9%
PRICE CATEGORY (DAYS)
<$500K: 45 -25.0%$500K-1M: 40 -23.1%$1M-3M: 51 +10.5%$3-5M: 70 -30.7%$5-10M: 71 +61.0%$10M+: 190 +20.3%
PROPERTY TYPE (DAYS)
CONDO: 55 -34.5%CO-OP: 44 -15.4%
BEDROOM TYPE (DAYS)STUDIO: 48 -21.3%1BR: 44 -18.5%2BR: 50 -20.6%3BR: 67 -32.2%4BR+: 71 -54.2%

23
TIME ON MARKETQ4 2015 MARKET REPORT
Time on Market
The chart depicts median days on market and median closing prices for all quarters between Q1 2006 and Q4 2015 and details Q4 2015’s performance relative to all other quarters during the period of observation. This quarter has outperformed nearly all other quarters with median days on market equating to 48 days while at the same time witnessing median sale price reach a record $1,240,000.
30 60 90 120
1.3M
1.1M
900K
700K
Med
ian
Clo
sing
Pric
e (in
$)
Time on Market (in days)
Q4 2015
Q4 2014
Source: Compass Research

24
Prices Climb, Pace Accelerates
The fourth quarter of 2015 experienced an increase in prices, while
properties spent less time on the market - the period defined as the
time from listing date to signed contract date. The shift towards
faster-paced absorption continued from Q3 2015. Overall, 59% of
sales occurred within the first 59 days of listing and only 11% were
on the market more than 180 days.
Main Points:• Q4 2015 Properties Spent the Shortest Time on Market of all
Previous Q4s since 2006
• Downtown and the Upper West Side had the Greatest Share Sell
within the First 30 Days
• High Priced Sales Slowed
Q4 2015 Properties Spent the Shortest Time on the Market of all Previous Q4s since 2006
The fourth quarter of 2015 measured the shortest time a property
was listed on the market compared to all previous fourth quarters
since 2006. The median time on market was 48 days, down 25%
from the 10-year average of 64 days, and down 24% from the 63-
day median one year ago. Additionally, total time on market in Q4
2015 was down 61% from the record 122 days set in Q4 2010.
The decrease in time spent on market was due to several drivers.
Speculation of an increase in the Federal Interest Rate was a
lingering concern throughout the quarter. The potential rise in
interest rates encouraged buyers to purchase before an increase
since the overall cost of ownership would be lower, especially
when securing financing. Moreover, in the past 10 years the
average median price increased 1.7% per quarter; the current
median price registered $1.2M.

25
TIME ON MARKETQ4 2015 MARKET REPORT
The Manhattan rental market continued to play a role in affecting
potential buyers. The median rental price climbed for the 21st
consecutive month, topping $3,300 and was 4% higher than one
year ago. The average rental price maintained a level above $4,000
per month.
Downtown and the Upper West Side had the Greatest Share Sell within the First 30 Days
The Upper West Side had the greatest share of properties enter into
contract within the first 30 days on market, totaling 36%. This is
an increase from 33.6% one year ago. Strong demand in the area
was accredited to the relatively affordable price-point, where 82%
of home sales were below $3M; 43% were priced between $1-3M.
Only 8.2% of properties spent more than 180 days on the market
before entering contract.
Downtown, 35% of listings sold in the first 30 days. This is a
measurable increase from Q3 2015 when only 29% sold in the
same time period and is a 1.6% increase from 33% one year ago.
Only 6% of homes in the area are priced below $500,000, while
31% are priced above $3M. Conversions and new construction
developments have dominated the Downtown residential arena.
The market continued to attract a wide-range of buyers and
has increasingly become a first choice destination for living,
entertainment, culinary, and shopping, creating
a 24/7 community.
Upper Manhattan had the largest year-over-year increase in
properties sell within the first 30 days. Presently, 33.9% sell in that
time, up an astonishing 70% from one year ago when only 20%
sold in the same time period. The spike in sales is due to Upper
Manhattan having the highest contingency of properties priced
below $500,000 at 22%. These buyers often compare properties

26
to Brooklyn, another marketplace with growing demand. Overall,
70% of homes were sold and 69% of inventory was priced under
$1M in the fourth quarter.
High Priced Sales Slowed
Amid the growing trend of high-end luxury projects constructed
throughout Manhattan, buyers have seemingly taken a pause as
the competition among new and resale luxury buildings grew in
the fourth quarter. Of homes priced above $10M, 55% sold in more
than 180 days. This signifies a substantial increase, which is 89%
higher than the 29% reported in Q3 2015 and a 78% jump from 32%
one year ago.
Year-over-year, properties that entered contract in the first 59 days
priced above $10M dropped from 49% to 24%. However, contract
signings were up 13% from the previous quarter, when only 21% of
homes accounted for the same time period.
A further indicator of competition amid slowing sales is the
status of ultra-luxury projects located along the Central Park
South corridor. CIM and Harry Macklowe, the developers behind
Manhattan’s current tallest luxury tower 432 Park Avenue, are
shrinking full-floor units on some of the top floors that typically
command the highest prices.
Another concern is the rise of additional ultra-luxury towers yet
to be built, including JDS Development Group’s 111 West 57 Street
and Extell’s Central Park Tower located at 225 West 57 Street, which
will claim the title of tallest residential building in New York City,
topping 1,500 feet.

27
TIME ON MARKETQ4 2015 MARKET REPORT
Bedroom Category
Major Market
Property Types
Price Category
STUDIO
1BR
2BR
3BR
4BR+
<$500K
$500K-1M
$1M-$3M
$3M-5M
$5M-10M
$10M+
OVERALL
CONDO
CO-OP
MIDTOWN E
MIDTOWN W
DOWNTOWN
UPPER E
UPPER W
UPPER MN
0%
29.1% 33.5% 21.7% 8.2% 7.4%
25.3% 29.7% 21.7% 8.8% 14.5%
30.0% 30.8% 21.4% 9.1% 8.6%
31.7% 27.4% 19.9% 10.1% 10.9%
37.5% 28.5% 19.4% 8.5% 6.1%
24.8% 23.9% 26.5% 11.1% 13.7%
33.6% 29.0% 19.9% 8.1% 9.4%
30.8% 26.0% 28.8% 5.7% 8.7%
22.7% 24.9% 17.8% 12.4% 22.2%
30.0% 25.1% 19.6% 13.2% 12.1%
29.1% 20.1% 17.1% 15.0% 18.8%
18.4% 5.3% 7.9% 13.2% 55.3%
33.9% 30.7% 21.6% 8.3% 5.5.%
30.4% 26.4% 21.2% 11.3% 10.8%
34.6% 26.5% 18.0% 10.0% 10.9%
31.5% 27.2% 20.8% 11.1% 9.4%
29.6% 35.4% 24.6% 6.5% 3.9%
29.0% 20.2% 16.9% 12.1% 21.8%
35.7% 28.7% 19.1% 8.2% 8.2%
28.4% 18.6% 15.7% 12.7% 24.5%

28
29.1% 33.5% 21.7% 8.2% 7.4%
25.3% 29.7% 21.7% 8.8% 14.5%
30.0% 30.8% 21.4% 9.1% 8.6%
31.7% 27.4% 19.9% 10.1% 10.9%
37.5% 28.5% 19.4% 8.5% 6.1%
24.8% 23.9% 26.5% 11.1% 13.7%
33.6% 29.0% 19.9% 8.1% 9.4%
30.8% 26.0% 28.8% 5.7% 8.7%
22.7% 24.9% 17.8% 12.4% 22.2%
30.0% 25.1% 19.6% 13.2% 12.1%
29.1% 20.1% 17.1% 15.0% 18.8%
18.4% 5.3% 7.9% 13.2% 55.3%
33.9% 30.7% 21.6% 8.3% 5.5.%
30.4% 26.4% 21.2% 11.3% 10.8%
34.6% 26.5% 18.0% 10.0% 10.9%
31.5% 27.2% 20.8% 11.1% 9.4%
29.6% 35.4% 24.6% 6.5% 3.9%
29.0% 20.2% 16.9% 12.1% 21.8%
35.7% 28.7% 19.1% 8.2% 8.2%
28.4% 18.6% 15.7% 12.7% 24.5%
Source: Compass Research
30-59<30 DAYS 60-119 120-179 <180
100%50%

29
CLOSINGSQ4 2015 MARKET REPORT
Closings
As total closings increased year-over-year, Q4 transaction volume reached a record high despite a total supply drop from one year ago.

30
FIGURE SHARE YoY TOTAL CLOSINGS 3,793 10.0%
CONDO - RESALE 1,208 31.8% +13.9%CO-OP - RESALE 1,848 48.7% -4.0%NEW DEVELOPMENT 538 14.2% +63.0%
MONTHS OF SUPPLY: 6.8 -23.1%
31
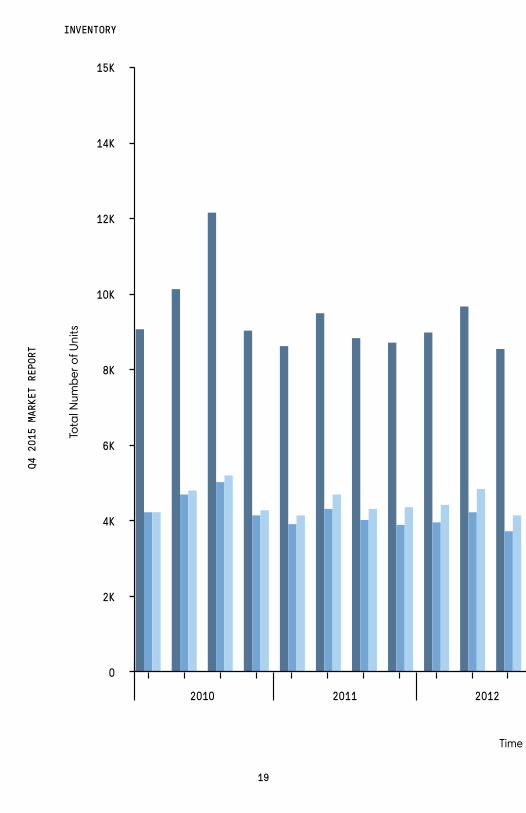
CLOSINGSQ4 2015 MARKET REPORT
Transaction Volume
The chart depicts the total historic Q4 transaction volume in dollars ($) of closed sales in Manhattan by property type.
‘07 ‘08 ‘09 ‘11‘10 ‘13‘12 ‘14 ‘15
12
10
8
6
4
2
0
Tota
l Tra
nsac
tion
Volu
me
(in U
SD B
illio
ns)
Time (Year)
Source: Compass Research
‘06
OVERALL CONDO CO-OP NEW DEV

32
Months of Supply Decreased 23% Year-Over-Year
The total months of supply, or time it would take for all current
available inventory to sell, dropped 23% year-over-year to 6.8
months. This level is 7% below the 10-year fourth quarter historic
average of 7.3 months and 21% below the 9 months of supply
measured in Q4 2008. Strong demand before years-end and
speculation among a potential rise in interest rates encouraged
buyers to purchase properties at a quicker rate.
Condo supply saw the most drastic decrease, dropping 29% to
10 months from the 14 months of supply recorded in Q4 2014.
Condo inventory is also down 17% from the 10-year fourth quarter
average of 12 months. Co-op shares were down 9% year-over-year,
hitting 6 months of total supply. This is down 4% from the 10-year
average of 7 months. The drop is attributed to market speculation
where properties have been appreciating at a more rapid rate
post-recession. In turn, this prompts buyers to enter the market to
realize future gains.
Although there has been an average gain of 2% per quarter
since 2006, absorption witnessed record quarter-over-quarter
decreases in 2015, with an average drop of 5%. The most notable
declines were in Q2 and Q3, which both saw quarter-over-quarter
reductions of 21%.
Main Points:• Months of Supply Decreased 23% Year-Over-Year
• Q4 Transaction Volume Hit a Fourth Quarter Record,
Topping $10B
• New Development Number of Closings Reached
a Pre-Recession High

33
CLOSINGSQ4 2015 MARKET REPORT
Q4 Transaction Volume Hit a Fourth Quarter Record, Topping $10B
The fourth quarter of 2015 experienced a record-shattering
level of transaction volume, delivering over $10B in sales volume.
This amount, up 14% from $9B in Q4 2014, tops the pre-recession
high of $8B in 2007 by 22%. The increase came despite a reported
3,793 closings in Q4 2015, a 19% drop from 2007 when 4,654
were recorded.
Condo revenue encompassed 39% of the Q4 total with $4B
in volume. This is a 27% increase from $3B one year ago and
a 40% surge from the $2.8B pre-recession high. Q4 2015 condo
revenue reached a 10-year fourth quarter record. Co-ops, which
measured 34% of the total, were down 7% year-over-year but up
a significant 22% from the previous high of $2.8B generated prior
to the recession.
New development closings made up 17% of total transaction
volume with $1.8B in sales. Although a noteworthy gain of 39%
from $1.3B last year, this is 14% below the pre-recession high
of $2B. New development fourth quarter volume changes have
averaged a 10% increase since Q4 2006.
New Development Number of Closings Reached a Pre-Recession High
The new development sector of the market, often one indicator
of overall health and future changes, recorded the most closings
since the pre-recession high in 2008. A total of 538 closings were
recorded in the fourth quarter, totaling 14% of closed deals. This

34
is an increase of 63% from one year ago when 330 new
development deals closed, making up 10% of the total, but still
a measurable decline of 56% from the 1,219 properties closed
in Q4 2008, which made up 34% of closings.
Condo closings increased by 14% from Q4 2014 with 1,208 deals,
and increased by 1% in share to 32% of the total. Co-ops, while still
capturing the majority of deals at 49% with 1,848, were down from
56% from one year ago when co-ops reached 1,926 deals. Co-ops
dipped below the 50% market share-rate for the first fourth quarter
since 2008, when they made up 41% and are below the 10-year
fourth quarter average of 51%.

35
CLOSINGSQ4 2015 MARKET REPORT
30
20
10
0
Mon
ths
of S
uppy
20072006 2008 2009 2010
Time (Year)
2011

36
2010
Time (Year)
1.5K
1.4K
1.3K
1.2K
1.1K
1.0K
900
800
Median PPSF (in U
SD)
2011 2012 2013 2014 2015
OVERALL CONDO CO-OP MEDIAN PPSF
Median Closing Price By Property Type vs Months of Supply
The chart depicts historic months of supply levels in Manhattan from Q1 2006 to Q4 2015 against median PPSF for the same period. The overall supply level in Q4 2015 has now reached 6.8 months.
Source: Compass Research
CLOSINGSQ4 2015 MARKET REPORT
Q 4 Q 4 Q 4 Q 4 Q 4 Q 4 Q 4 Q 4 Q 4 Q 4 Q 4 Q 4 Q 4 Q 4 Q 4 Q 4 Q 4 Q 4 Q 4
4 Q 4 Q 4 Q 4 Q 4 Q 4 Q 4 Q 4 Q 4 Q 4 Q 4 Q 4 Q 4 Q 4 Q 4 Q 4 Q 4 Q 4 Q 4 Q
Q 4 Q 4 Q 4 Q 4 Q 4 Q 4 Q 4 Q 4 Q 4 Q 4 Q 4 Q 4 Q 4 Q 4 Q 4 Q 4 Q 4 Q 4 Q 4
4 Q 4 Q 4 Q 4 Q 4 Q 4 Q 4 Q 4 Q 4 Q 4 Q 4 Q 4 Q 4 Q 4 Q 4 Q 4 Q 4 Q 4 Q 4 Q
Q 4 Q 4 Q 4 Q 4 Q 4 Q 4 Q 4 Q 4 Q 4 Q 4 Q 4 Q 4 Q 4 Q 4 Q 4 Q 4 Q 4 Q 4 Q 4
4 Q 4 Q 4 Q 4 Q 4 Q 4 Q 4 Q 4 Q 4 Q 4 Q 4 Q 4 Q 4 Q 4 Q 4 Q 4 Q 4 Q 4 Q 4 Q
Q 4 Q 4 Q 4 Q 4 Q 4 Q 4 Q 4 Q 4 Q 4 Q 4 Q 4 Q 4 Q 4 Q 4 Q 4 Q 4 Q 4 Q 4 Q 4
4 Q 4 Q 4 Q 4 Q 4 Q 4 Q 4 Q 4 Q 4 Q 4 Q 4 Q 4 Q 4 Q 4 Q 4 Q 4 Q 4 Q 4 Q 4 Q
Q 4 Q 4 Q 4 Q 4 Q 4 Q 4 Q 4 Q 4 Q 4 Q 4 Q 4 Q 4 Q 4 Q 4 Q 4 Q 4 Q 4 Q 4 Q 4
4 Q 4 Q 4 Q 4 Q 4 Q 4 Q 4 Q 4 Q 4 Q 4 Q 4 Q 4 Q 4 Q 4 Q 4 Q 4 Q 4 Q 4 Q 4 Q
Q 4 Q 4 Q 4 Q 4 Q 4 Q 4 Q 4 Q 4 Q 4 Q 4 Q 4 Q 4 Q 4 Q 4 Q 4 Q 4 Q 4 Q 4 Q 4
4 Q 4 Q 4 Q 4 Q 4 Q 4 Q 4 Q 4 Q 4 Q 4 Q 4 Q 4 Q 4 Q 4 Q 4 Q 4 Q 4 Q 4 Q 4 Q
Q 4 Q 4 Q 4 Q 4 Q 4 Q 4 Q 4 Q 4 Q 4 Q 4 Q 4 Q 4 Q 4 Q 4 Q 4 Q 4 Q 4 Q 4 Q 4
4 Q 4 Q 4 Q 4 Q 4 Q 4 Q 4 Q 4 Q 4 Q 4 Q 4 Q 4 Q 4 Q 4 Q 4 Q 4 Q 4 Q 4 Q 4 Q
Q 4 Q 4 Q 4 Q 4 Q 4 Q 4 Q 4 Q 4 Q 4 Q 4 Q 4 Q 4 Q 4 Q 4 Q 4 Q 4 Q 4 Q 4 Q 4
4 Q 4 Q 4 Q 4 Q 4 Q 4 Q 4 Q 4 Q 4 Q 4 Q 4 Q 4 Q 4 Q 4 Q 4 Q 4 Q 4 Q 4 Q 4 Q
Q 4 Q 4 Q 4 Q 4 Q 4 Q 4 Q 4 Q 4 Q 4 Q 4 Q 4 Q 4 Q 4 Q 4 Q 4 Q 4 Q 4 Q 4 Q 4
4 Q 4 Q 4 Q 4 Q 4 Q 4 Q 4 Q 4 Q 4 Q 4 Q 4 Q 4 Q 4 Q 4 Q 4 Q 4 Q 4 Q 4 Q 4 Q
Q 4 Q 4 Q 4 Q 4 Q 4 Q 4 Q 4 Q 4 Q 4 Q 4 Q 4 Q 4 Q 4 Q 4 Q 4 Q 4 Q 4 Q 4 Q 4
4 Q 4 Q 4 Q 4 Q 4 Q 4 Q 4 Q 4 Q 4 Q 4 Q 4 Q 4 Q 4 Q 4 Q 4 Q 4 Q 4 Q 4 Q 4 Q
Q 4 Q 4 Q 4 Q 4 Q 4 Q 4 Q 4 Q 4 Q 4 Q 4 Q 4 Q 4 Q 4 Q 4 Q 4 Q 4 Q 4 Q 4 Q 4
4 Q 4 Q 4 Q 4 Q 4 Q 4 Q 4 Q 4 Q 4 Q 4 Q 4 Q 4 Q 4 Q 4 Q 4 Q 4 Q 4 Q 4 Q 4 Q
Q 4 Q 4 Q 4 Q 4 Q 4 Q 4 Q 4 Q 4 Q 4 Q 4 Q 4 Q 4 Q 4 Q 4 Q 4 Q 4 Q 4 Q 4 Q 4
4 Q 4 Q 4 Q 4 Q 4 Q 4 Q 4 Q 4 Q 4 Q 4 Q 4 Q 4 Q 4 Q 4 Q 4 Q 4 Q 4 Q 4 Q 4 Q
Q 4 Q 4 Q 4 Q 4 Q 4 Q 4 Q 4 Q 4 Q 4 Q 4 Q 4 Q 4 Q 4 Q 4 Q 4 Q 4 Q 4 Q 4 Q 4
4 Q 4 Q 4 Q 4 Q 4 Q 4 Q 4 Q 4 Q 4 Q 4 Q 4 Q 4 Q 4 Q 4 Q 4 Q 4 Q 4 Q 4 Q 4 Q
Q 4 Q 4 Q 4 Q 4 Q 4 Q 4 Q 4 Q 4 Q 4 Q 4 Q 4 Q 4 Q 4 Q 4 Q 4 Q 4 Q 4 Q 4 Q 4
4 Q 4 Q 4 Q 4 Q 4 Q 4 Q 4 Q 4 Q 4 Q 4 Q 4 Q 4 Q 4 Q 4 Q 4 Q 4 Q 4 Q 4 Q 4 Q
Q 4 Q 4 Q 4 Q 4 Q 4 Q 4 Q 4 Q 4 Q 4 Q 4 Q 4 Q 4 Q 4 Q 4 Q 4 Q 4 Q 4 Q 4 Q 4
4 Q 4 Q 4 Q 4 Q 4 Q 4 Q 4 Q 4 Q 4 Q 4 Q 4 Q 4 Q 4 Q 4 Q 4 Q 4 Q 4 Q 4 Q 4 Q
Q 4 Q 4 Q 4 Q 4 Q 4 Q 4 Q 4 Q 4 Q 4 Q 4 Q 4 Q 4 Q 4 Q 4 Q 4 Q 4 Q 4 Q 4 Q 4
4 Q 4 Q 4 Q 4 Q 4 Q 4 Q 4 Q 4 Q 4 Q 4 Q 4 Q 4 Q 4 Q 4 Q 4 Q 4 Q 4 Q 4 Q 4 Q
Q 4 Q 4 Q 4 Q 4 Q 4 Q 4 Q 4 Q 4 Q 4 Q 4 Q 4 Q 4 Q 4 Q 4 Q 4 Q 4 Q 4 Q 4 Q 4
4 Q 4 Q 4 Q 4 Q 4 Q 4 Q 4 Q 4 Q 4 Q 4 Q 4 Q 4 Q 4 Q 4 Q 4 Q 4 Q 4 Q 4 Q 4 Q
Q 4 Q 4 Q 4 Q 4 Q 4 Q 4 Q 4 Q 4 Q 4 Q 4 Q 4 Q 4 Q 4 Q 4 Q 4 Q 4 Q 4 Q 4 Q 4
4 Q 4 Q 4 Q 4 Q 4 Q 4 Q 4 Q 4 Q 4 Q 4 Q 4 Q 4 Q 4 Q 4 Q 4 Q 4 Q 4 Q 4 Q 4 Q
Q 4 Q 4 Q 4 Q 4 Q 4 Q 4 Q 4 Q 4 Q 4 Q 4 Q 4 Q 4 Q 4 Q 4 Q 4 Q 4 Q 4 Q 4 Q 4
4 Q 4 Q 4 Q 4 Q 4 Q 4 Q 4 Q 4 Q 4 Q 4 Q 4 Q 4 Q 4 Q 4 Q 4 Q 4 Q 4 Q 4 Q 4 Q
Q 4 Q 4 Q 4 Q 4 Q 4 Q 4 Q 4 Q 4 Q 4 Q 4 Q 4 Q 4 Q 4 Q 4 Q 4 Q 4 Q 4 Q 4 Q 4
4 Q 4 Q 4 Q 4 Q 4 Q 4 Q 4 Q 4 Q 4 Q 4 Q 4 Q 4 Q 4 Q 4 Q 4 Q 4 Q 4 Q 4 Q 4 Q
Q 4 Q 4 Q 4 Q 4 Q 4 Q 4 Q 4 Q 4 Q 4 Q 4 Q 4 Q 4 Q 4 Q 4 Q 4 Q 4 Q 4 Q 4 Q 4
4 Q 4 Q 4 Q 4 Q 4 Q 4 Q 4 Q 4 Q 4 Q 4 Q 4 Q 4 Q 4 Q 4 Q 4 Q 4 Q 4 Q 4 Q 4 Q
Q 4 Q 4 Q 4 Q 4 Q 4 Q 4 Q 4 Q 4 Q 4 Q 4 Q 4 Q 4 Q 4 Q 4 Q 4 Q 4 Q 4 Q 4 Q 4
4 Q 4 Q 4 Q 4 Q 4 Q 4 Q 4 Q 4 Q 4 Q 4 Q 4 Q 4 Q 4 Q 4 Q 4 Q 4 Q 4 Q 4 Q 4 Q
Q 4 Q 4 Q 4 Q 4 Q 4 Q 4 Q 4 Q 4 Q 4 Q 4 Q 4 Q 4 Q 4 Q 4 Q 4 Q 4 Q 4 Q 4 Q 4
4 Q 4 Q 4 Q 4 Q 4 Q 4 Q 4 Q 4 Q 4 Q 4 Q 4 Q 4 Q 4 Q 4 Q 4 Q 4 Q 4 Q 4 Q 4 Q
Q 4 Q 4 Q 4 Q 4 Q 4 Q 4 Q 4 Q 4 Q 4 Q 4 Q 4 Q 4 Q 4 Q 4 Q 4 Q 4 Q 4 Q 4 Q 4
4 Q 4 Q 4 Q 4 Q 4 Q 4 Q 4 Q 4 Q 4 Q 4 Q 4 Q 4 Q 4 Q 4 Q 4 Q 4 Q 4 Q 4 Q 4 Q
Q 4 Q 4 Q 4 Q 4 Q 4 Q 4 Q 4 Q 4 Q 4 Q 4 Q 4 Q 4 Q 4 Q 4 Q 4 Q 4 Q 4 Q 4 Q 4
4 Q 4 Q 4 Q 4 Q 4 Q 4 Q 4 Q 4 Q 4 Q 4 Q 4 Q 4 Q 4 Q 4 Q 4 Q 4 Q 4 Q 4 Q 4 Q
Q 4 Q 4 Q 4 Q 4 Q 4 Q 4 Q 4 Q 4 Q 4 Q 4 Q 4 Q 4 Q 4 Q 4 Q 4 Q 4 Q 4 Q 4 Q 4
4 Q 4 Q 4 Q 4 Q 4 Q 4 Q 4 Q 4 Q 4 Q 4 Q 4 Q 4 Q 4 Q 4 Q 4 Q 4 Q 4 Q 4 Q 4 Q
Q 4 Q 4 Q 4 Q 4 Q 4 Q 4 Q 4 Q 4 Q 4 Q 4 Q 4 Q 4 Q 4 Q 4 Q 4 Q 4 Q 4 Q 4 Q 4
4 Q 4 Q 4 Q 4 Q 4 Q 4 Q 4 Q 4 Q 4 Q 4 Q 4 Q 4 Q 4 Q 4 Q 4 Q 4 Q 4 Q 4 Q 4 Q
Q 4 Q 4 Q 4 Q 4 Q 4 Q 4 Q 4 Q 4 Q 4 Q 4 Q 4 Q 4 Q 4 Q 4 Q 4 Q 4 Q 4 Q 4 Q 4
4 Q 4 Q 4 Q 4 Q 4 Q 4 Q 4 Q 4 Q 4 Q 4 Q 4 Q 4 Q 4 Q 4 Q 4 Q 4 Q 4 Q 4 Q 4 Q
Q 4 Q 4 Q 4 Q 4 Q 4 Q 4 Q 4 Q 4 Q 4 Q 4 Q 4 Q 4 Q 4 Q 4 Q 4 Q 4 Q 4 Q 4 Q 4
4 Q 4 Q 4 Q 4 Q 4 Q 4 Q 4 Q 4 Q 4 Q 4 Q 4 Q 4 Q 4 Q 4 Q 4 Q 4 Q 4 Q 4 Q 4 Q
Q 4 Q 4 Q 4 Q 4 Q 4 Q 4 Q 4 Q 4 Q 4 Q 4 Q 4 Q 4 Q 4 Q 4 Q 4 Q 4 Q 4 Q 4 Q 4
4 Q 4 Q 4 Q 4 Q 4 Q 4 Q 4 Q 4 Q 4 Q 4 Q 4 Q 4 Q 4 Q 4 Q 4 Q 4 Q 4 Q 4 Q 4 Q
Q 4 Q 4 Q 4 Q 4 Q 4 Q 4 Q 4 Q 4 Q 4 Q 4 Q 4 Q 4 Q 4 Q 4 Q 4 Q 4 Q 4 Q 4 Q 4
4 Q 4 Q 4 Q 4 Q 4 Q 4 Q 4 Q 4 Q 4 Q 4 Q 4 Q 4 Q 4 Q 4 Q 4 Q 4 Q 4 Q 4 Q 4 Q
Q 4 Q 4 Q 4 Q 4 Q 4 Q 4 Q 4 Q 4 Q 4 Q 4 Q 4 Q 4 Q 4 Q 4 Q 4 Q 4 Q 4 Q 4 Q 4
4 Q 4 Q 4 Q 4 Q 4 Q 4 Q 4 Q 4 Q 4 Q 4 Q 4 Q 4 Q 4 Q 4 Q 4 Q 4 Q 4 Q 4 Q 4 Q
Q 4 Q 4 Q 4 Q 4 Q 4 Q 4 Q 4 Q 4 Q 4 Q 4 Q 4 Q 4 Q 4 Q 4 Q 4 Q 4 Q 4 Q 4 Q 4
4 Q 4 Q 4 Q 4 Q 4 Q 4 Q 4 Q 4 Q 4 Q 4 Q 4 Q 4 Q 4 Q 4 Q 4 Q 4 Q 4 Q 4 Q 4 Q
Q 4 Q 4 Q 4 Q 4 Q 4 Q 4 Q 4 Q 4 Q 4 Q 4 Q 4 Q 4 Q 4 Q 4 Q 4 Q 4 Q 4 Q 4 Q 4
4 Q 4 Q 4 Q 4 Q 4 Q 4 Q 4 Q 4 Q 4 Q 4 Q 4 Q 4 Q 4 Q 4 Q 4 Q 4 Q 4 Q 4 Q 4 Q
“Compass makes no representations or warranties, express or implied, with respect to future market conditions or prices of residential product at the time the subject property or any competitive property is complete and ready for occupancy or with respect to any report, study, finding, recommendation or other information provided by Compass herein. Moreover, no warranty, express or implied, is made or should be assumed regarding the accuracy, adequacy, completeness, legality, reliability, merchantability or fitness for a particular purpose of any information, in part or whole, contained herein. All material is presented with the understanding that Compass shall not be deemed to provide legal, accounting or other professional services. This is not intended to solicit the purchase or sale of any property. Any and all such warranties are hereby expressly disclaimed. Equal Housing Opportunity.”
(c) Compass. All Rights Reserved. This information may not be copied, used or distributed without Compass’ consent.