Embed Size (px)
Citation preview

University of Wollongong University of Wollongong
Research Online Research Online
Faculty of Engineering and Information Sciences - Papers: Part A
Faculty of Engineering and Information Sciences
1-1-2012
Manifold drived MR-less PiB SUVR normalisation Manifold drived MR-less PiB SUVR normalisation
P Bourgeat CSIRO
P Raniga CSIRO
V Dore CSIRO
L Zhou CSIRO, [email protected]
S L. Macaulay CSIRO
See next page for additional authors
Follow this and additional works at: https://ro.uow.edu.au/eispapers
Part of the Engineering Commons, and the Science and Technology Studies Commons
Recommended Citation Recommended Citation Bourgeat, P; Raniga, P; Dore, V; Zhou, L; Macaulay, S L.; Martins, R; Masters, C L.; Ames, D; Ellis, K; Villemagne, V L.; Rowe, C C.; Salvado, O; and Fripp, J, "Manifold drived MR-less PiB SUVR normalisation" (2012). Faculty of Engineering and Information Sciences - Papers: Part A. 1877. https://ro.uow.edu.au/eispapers/1877
Research Online is the open access institutional repository for the University of Wollongong. For further information contact the UOW Library: [email protected]

Manifold drived MR-less PiB SUVR normalisation Manifold drived MR-less PiB SUVR normalisation
Abstract Abstract Pittsburgh Compound B (PiB) is a C11 PET tracer designed to bind to amyloid plaques, one of the hallmark of Alzheimer's disease. The potential of PiB as an early marker of Alzheimer's disease has lead to an increasing use of PiB and the development of several F18 equivalents. Quantitative analysis of PiB images requires an accurate normalisation, parcellation and estimation of retention in the brain's gray matter. Typically this relies on co-registered MRI to extract the cerebellum, compute the standardized uptake value ratio (SUVR) and provide parcellation and segmentation for quantification of neocortical SUVR. However, not all subjects undergo MRI. In this paper we propose a highly accurate MR-less parcellation, SUVR normalisation and quantification method for PiB images. This involves rigidly registering the raw PiB images to a PiB atlas, computing pair-wise normalised mutual information, and constructing a 2D manifold. Each new scan is mapped on the manifold and its k nearest neighbours are selected as atlases in a segmentation propagation scheme with their associated MRI segmentations and parcellation used as priors to estimate the SUVR normalisation and quantification. Comparison of our MRless approach to an MR-based approach showed a coefficient of correlation of neocortical PiB SUVR of R2=0.94 and an absolute mean error of 5.9%.
Keywords Keywords drived, manifold, normalisation, suvr, pib, less, mr
Disciplines Disciplines Engineering | Science and Technology Studies
Publication Details Publication Details Bourgeat, P., Raniga, P., Dore, V., Zhou, L., Macaulay, S. L., Martins, R., Masters, C. L., Ames, D., Ellis, K., Villemagne, V. L., Rowe, C. C., Salvado, O. & Fripp, J. (2012). Manifold drived MR-less PiB SUVR normalisation. In L. Wang, P. Yushkevich & S. Ourselin (Eds.), 15th International Conference on Medical Image Computing and Computer Assisted Intervention: Workshop on Novel Imaging Biomarkers for Alzheimer's Disease and Related Disorders (NIBAD) (pp. 1-12). Nice, France: CreateSpace Independent Publishing Platform.
Authors Authors P Bourgeat, P Raniga, V Dore, L Zhou, S L. Macaulay, R Martins, C L. Masters, D Ames, K Ellis, V L. Villemagne, C C. Rowe, O Salvado, and J Fripp
This conference paper is available at Research Online: https://ro.uow.edu.au/eispapers/1877

Manifold driven MR-less PiB SUVR normalisation
P. Bourgeat1, P. Raniga1, V. Dore1, L. Zhou1, S.L. Macaulay1, R. Martins2, C. L. Masters3, D. Ames4, K. Ellis5, V. L. Villemagne6, C. C. Rowe6, O. Salvado1,
J. Fripp1, and the AIBL Research Group7.
1. Preventative Health Flagship, CSIRO ICT 2. Centre of Excellence for Alzheimer’s Disease Research & Care, Edith Cowan University 3. The Mental
Health Research Institute, University of Melbourne 4. Department of Psychiatry, University of Melbourne 5. National Ageing Research Institute, University of Melbourne 6. Department of Nuclear Medicine and Centre for
PET, Austin Health, 7. http://www.aibl.csiro.au/partners.html.
Abstract. Pittsburgh Compound B (PiB) is a C11 PET tracer designed to bind to amyloid plaques, one of the hallmark of Alzheimer’s disease. The potential of PiB as an early marker of Alzheimer’s disease has lead to an increasing use of PiB and the development of several F18 equivalents. Quantitative analysis of PiB images requires an accurate normalisation, parcellation and estimation of retention in the brain’s gray matter. Typically this relies on co-registered MRI to extract the cerebellum, compute the standardized uptake value ratio (SUVR) and provide parcellation and segmentation for quantification of neocortical SUVR. However, not all subjects undergo MRI. In this paper we propose a highly accurate MR-less parcellation, SUVR normalisation and quantification method for PiB images. This involves rigidly registering the raw PiB images to a PiB atlas, computing pair-wise normalised mutual information, and constructing a 2D manifold. Each new scan is mapped on the manifold and its k nearest neighbours are selected as atlases in a segmentation propagation scheme with their associated MRI segmentations and parcellation used as priors to estimate the SUVR normalisation and quantification. Comparison of our MR-less approach to an MR-based approach showed a coefficient of correlation of neocortical PiB SUVR of R2=0.94 and an absolute mean error of 5.9%.
Keywords: Manifold learning, PET quantification, Alzheimer’s disease
L. Wang, P. Yushkevich and S. Ourselin (Eds.): MICCAI 2012 Workshop on Novel ImagingBiomarkers for Alzheimer’s Disease and Related Disorders (NIBAD’12), p. 1, 2012.Copyright held by author/owner(s).

1 Introduction
Pittsburgh Compound B (PiB) is a C11 PET tracer designed to bind to amyloid plaques, one of the hallmark of Alzheimer’s disease [1, 2]. The Australian Imaging Biomarkers and Lifestyle (AIBL) was the first large scale study examining the potential of PiB as an early marker of Alzheimer’s disease [3]. Promising results from this study have lead to an increased use of PiB in clinical studies and the evaluation of several F18 equivalents. The analysis of PiB images requires an accurate quantification of its retention in the brain. This quantification usually relies on the parcellation of a corresponding MRI to extract the cerebellum and normalise the PiB intensity using the standardised uptake value ratio (SUVR) [4]. Neocortical masks are also derived from the MRI to provide quantification of the neocortical SUVR retention. As more and more subjects undergo PiB imaging, there is an increasing number of subject who cannot undergo MRI, or studies which do not include MRI as part of their examination routine. For instance, 20% of the subjects enrolled in AIBL did not undergo an MRI scan at baseline, which means that with current image analysis technique, their PiB retention cannot be quantitatively assessed.
The automatic parcellation and quantification of PiB-PET images without any structural information is a complex problem due to the lack of anatomical information, the effect of partial voluming and the variability in intensity distribution across the brain, rendering typical approaches of atlas based segmentation propagation unsuitable. Previous approaches have looked at directly segmenting the PET image [5] using an EM approach with a Spline model to account for intensity variations. Such approach can give reasonable segmentation, but does not provide a parcellation, or a mean of SUVR quantification. A more interesting approach was proposed in [6] where a subject specific atlas was iteratively generated using a statistical appearance model of PiB retention, and the registration to this atlas was constrained by a statistical deformation model. The drawback of this approach is that it is model driven, and atypical patterns not initially modelled by the statistical model can result in inaccurate quantification. Previous work on the AIBL database has shown that a 2D manifold on PiB images could be used to describe the progression from low to high PiB retention [7] and could therefore be used for atlas selection.
In this paper, we are proposing an MR-less parcellation, SUVR normalisation and quantification method for PiB images. The proposed method is based on multi-atlas segmentation propagation, where a manifold of PiB images is used to perform the atlas selection. The approach is compared to using a standard mean atlas segmentation propagation strategy, and using the manifold to directly extrapolate neocortical SUVR values using neighbourhood neocortical SUVR values.
2 Materials and Method
Data used in the preparation of this paper were obtained from the Australian Imaging, Biomarkers and Lifestyle (AIBL) study (http://www.aibl.csiro.au/) [3]. All subjects who received both MRI and PiB-PET scans at baseline were used. The 239 participants included 38 patients who met National Institute of Neurological and
2 Bourgeat et al.

Communicative Disorders and Stroke/Alzheimer’s Disease and Related Disorders Association criteria for probable AD; 44 participants with mild cognitive impairment (MCI); 157 healthy controls. MR imaging was performed using a Siemens 3T Trio (~60%) and a Siemens 1.5T Magnetom Avanto (~40%). The imaging protocol was defined to follow ADNI’s guideline on the 3T scanner (http://adni.loni.ucla.edu/research/protocols/mri-protocols) and a custom MPRage sequence was used on the 1.5T scanner.
2.1 MRI Processing
All T1W images were first corrected for bias field using the Insight Journal implementation of the N4 algorithm [8]. The images were then smoothed using anisotropic filtering to remove the noise. T2W images were motion corrected using inverse interpolation [9]. An overview of the MRI processing pipeline and construction of the PiB SUVR ground truth is provided in Fig 1.
2.1.1 Tissue segmentation in native space.
For each subject, the T2W MR image was registered to its corresponding T1W image, and was classified into CSF and GM/WM using an implementation of the expectation maximization segmentation algorithm [10] using MNI152 priors. The resulting CSF probability map was used as a CSF prior for the segmentation of the T1W image into CSF, GM and WM. The resulting segmentation was used as a brain mask for skull-stripping, and all the skull stripped T1W images were rigidly registered to the MNI average brain and their segmentation propagated. The T2W images were co-registered to their corresponding T1W images in MNI space.
2.1.2 Population specific template
Using the skull-stripped T1W images in MNI space, a group-wise atlas creation procedure was employed to generate a population template along with priors of GM, WM and CSF [11]. We employed 5 iteration of affine registration and 5 iteration of non rigid registration using nifty-reg [12] and a final control point spacing of 10mm. The segmentations from all cases were propagated to the last iteration of the template and averaged to generate new population specific priors of GM, WM and CSF. The population template was then registered to each T1W image in MNI space, before they were segmented using the expectation maximization segmentation algorithm [10] with the population derived GM, WM and CSF priors.
Manifold Driven MR-less PiB SUVR Normalisation 3

MRI
Segmentation
MNI�Atlas
Segmentation
Rigid�Registration
Composite
Native�Space
MNI�SpaceMRIMNI
NonͲrigid�Registration
AIBL�Atlas
Propagation
NMI
MRI�Manifold
Affinity�Matrix
Composite�Database
...
Composite�1
Composite�2
Composite�N
MNI�Priors
AIBL�Priors
PiB
Rigid�Registration
LEAPAtlas�Selection
...
NonͲrigid�Registration
Vote
Labels
MRI�1�+�Labels
MRI�2�+�Labels
MRI�20�+�Labels
SUVR�Normalisation
MRIMNI
Figure 1. MRI processing pipeline used to compute the SUVR PiB ground truth.
4 Bourgeat et al.

2.1.3 LEAP-based MRI Parcellation
The MRI parcellation was performed using Learning Embeddings for Atlas Propagation (LEAP) following the work of Wolz et al [13]. This approach relies on the construction of an affinity matrix which captures the similarity between each pair of images in the database. The affinity matrix is then decomposed using the Eigen Maps decomposition and the first two modes are kept. In [13], the metric used to compute the similarity between each pair of images was the Normalised Mutual information (NMI). To pseudo normalize the MRI acquisitions so that variations in NMI only represent morphological changes, a composite segmentation image of GM, WM and CSF was created for each case, by assigning each tissue type a different value (CSF=1, GM=2 and WM=3). The NMI was then computed between pairs of composite segmentation images using 3 bins. Hierarchical Clustering was employed to identify M clusters on the manifold. All cases are then segmented by segmentation propagation using cases from the closest cluster (starting with the cluster containing the 20 atlases).
All MRI and the 20 atlases used in [13] were included in the manifold. The manual parcellation provided with the 20 atlases does not offer any granularity in the choice of cerebellum regions for SUVR normalisation. Using the whole cerebellum region is inadequate as it covers regions close to the neocortex, which are subject of spill over and lead to inaccurate SUVR normalisation. We therefore mapped the Automated Anatomic Labeling (AAL) parcellation [14], which offers a more adequate parcellation of the cerebellum (we use the cerebellum crus2 for SUVR normalisation), to the 20 atlases. The registrations were performed using nifty-reg [12], with a final control point spacing of 2mm. The number of clusters was empirically set to M=5. At the end of the procedure, the propagated and voted AAL parcellations were masked by the GM segmentation to generate the final cerebellum and neocortical mask for subsequent computation of neocortical SUVR uptake.
2.2 PiB Processing
PiB images were cropped to remove the top and bottom 4 slices which mostly contain ring reconstruction artefacts.
2.2.1 PiB MR-based SUVR normalisation
Each PiB image was co-registered to its corresponding MRI in MNI space, and SUVR normalised using the cerebellum masks. The neocortical SUVR value was computed using the mean SUVR in the neocortical mask. The MR-based neocortical values are thereafter used as ground truth for all SUVR comparisons.
2.2.2 PiB Manifold
From the population specific atlas procedure defined in section 2.1.2, a population specific PiB atlas was generated by propagation of the PiB images to the MRI atlas
Manifold Driven MR-less PiB SUVR Normalisation 5

using their corresponding MRI transformations. All Raw PiB images were affinely registered to the PiB atlas, pair-wise NMI were computed and a 2D manifold was generated (Fig 2).
2.2.3 PiB MR-less SUVR normalisation
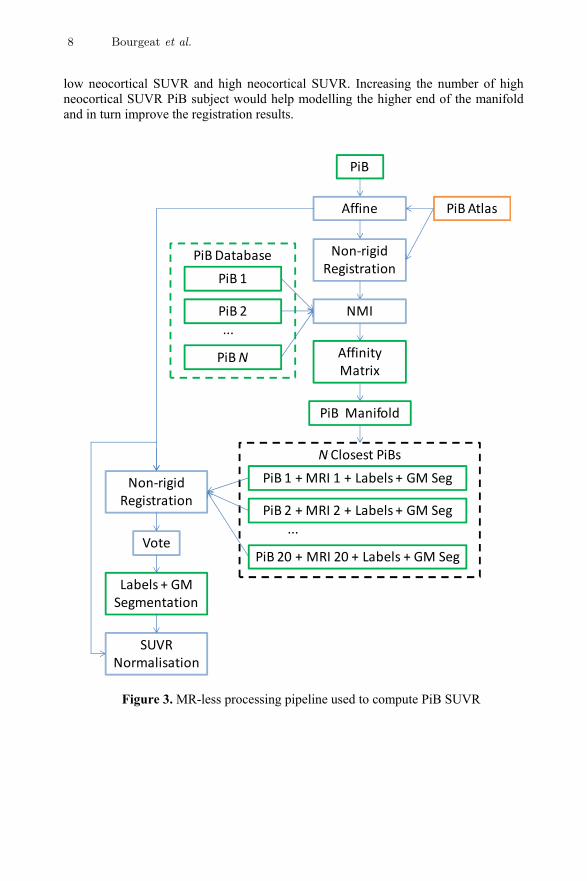
Each Raw PiB was mapped on the manifold, and its k closest PiB neighbours on the manifold were identified, and registered to the PiB image first affinely using NMI, and then non rigidly with nifty-reg (5mm control point spacing). The cerebellum, neocortical and GM masks were then propagated and voted. For easier comparison with the MR-based method, the target PiB was chosen to be the PiB co-registered to its corresponding MRI in MNI space instead of the PiB image affinely registered to the PiB atlas, noting that this is just an extra affine transformation which in practice would not significantly change the results. The number of neighbours k was set to 20. An overview of the MR-less SUVR normalisation pipeline is provided in Fig 3.
Figure 2. PiB manifold constructed from Raw PiB images. The colour of the dots represents their neocortical SUVR retention as quantified by the MRI. Example SUVR images are also displayed for illustration purposes.
6 Bourgeat et al.

2.3 Experimental design
In the first set of experiments, we aim to measure the accuracy of the segmentation propagation approach. We compute the Dice similarity coefficient (DSC) between the MRI segmentations and the GM, WM and CSF segmentation obtained using our multi-atlas approach (with either affine or non-rigid registration), and a standard atlas-based segmentation propagation (with either affine or non-rigid with 10mm control point spacing) using the population mean PiB atlas and the population mean GM, WM and CSF priors converted to hard segmentations using maximum likelihood.
In the second set of experiments, we aim to compare the accuracy of the estimation of neocortical SUVR, using both the single and multi-atlas approaches, and a purely manifold-based method, where the predicted neocortical SUVR retention is computed as an inverse distance weighted mean of the neocortical SUVR retention of the k neighbours, with the weight based on the inverse of the Euclidean distance of the neighbours to the point of interest in the 2D manifold space. Neocortical SUVR values were compared to the MRI-based SUVR normalisation in terms in mean absolute difference (MD) and through the coefficient of determination (R2).
3 Results and discussion
Fig 2 shows the PiB manifold constructed using the Raw PiB images. The colour of the dots represents the ground truth neocortical SUVR values as quantified using the MRI. The graph also shows some examples of SUVR normalised PiB images. From this graph, it is quite clear that the pattern of PiB retention is sufficient to group PiB images with similar neocortical SUVR values. This validates the hypothesis that atlas selection for PiB segmentation can be performed using a manifold built on non-SUVR normalised PiB images. Of note, two subjects had to be excluded from the manifold (1 AD with large asymmetric ventricle enlargement and 1 MCI with atypical PiB retention pattern) as they were collapsing the manifold to one axis.
3.1 Segmentation results
Table 1 shows the results of the segmentation using a registration to a mean PiB atlas using affine and non-rigid registration, and segmentation using the MR-less approach using affine and non-rigid registration with k=20 neighbours. Example segmentation results are illustrated in Fig 4. The results show that the multi-atlas voting on the manifold outperforms the single atlas approach, especially in the MCI and NC groups. In the AD group, the advantage of the multi-atlas approach is minimal. This is probably due to the lower density of points on the manifold in the space containing high neocortical SUVR PiB images. This can be observed in Fig 2 where the density of points is quite high in low SUVR values, and becomes much lower in the space of high to very high SUVR values. As AD subjects tend to have high SUVR values, they have fewer neighbours in their immediate neighbourhood, and as the candidate atlases are more dissimilar, the registration tends to produce a lower quality matching. As the AIBL database favours NC over MCI and AD subject, there is an unbalance between
Manifold Driven MR-less PiB SUVR Normalisation 7
low neocortical SUVR and high neocortical SUVR. Increasing the number of high neocortical SUVR PiB subject would help modelling the higher end of the manifold and in turn improve the registration results.
N�Closest�PiBs
...
NonͲrigid�Registration
Vote
Labels�+�GM�Segmentation�
PiB�1�+�MRI�1�+�Labels�+�GM�Seg
PiB�2�+�MRI�2�+�Labels�+�GM�Seg
PiB�20�+�MRI�20�+�Labels�+�GM�Seg
NonͲrigid�Registration
PiB
PiB�Atlas
NMI
PiB��Manifold
Affinity�Matrix
PiB�Database
...
PiB�1
PiB�2
PiB�N
Affine
SUVR�Normalisation
Figure 3. MR-less processing pipeline used to compute PiB SUVR
8 Bourgeat et al.

Figure 4. Segmentation results for AD (top), MCI (middle) and NC (bottom). Images show from left to right SUVR normalised PiB, mean atlas segmentation, multi-atlas segmentation,
MRI segmentation. The cases presented here were selected so that their DSC corresponds to the mean DSC of their respective group.
Table 1: Segmentation performances of the PiB-only methods, presented as mean (GM, WM, CSF) DSC
Mean population PiB atlas 20 Nearest Neighbours Diagnosis group (N) Affine Non Rigid Affine Non Rigid
AD (37) (0.60, 0.70, 0.53) (0.61, 0.72, 0.52) (0.57, 0.70, 0.58) (0.61, 0.74, 0.66) MCI (43) (0.60, 0.69, 0.55) (0.61, 0.71, 0.57) (0.58, 0.70, 0.57) (0.62, 0.75, 0.65) NC (157) (0.62, 0.70, 0.57) (0.61, 0.70, 0.58) (0.60, 0.70, 0.56) (0.65, 0.75, 0.65) ALL (237) (0.61, 0.70, 0.56) (0.61, 0.71, 0.57) (0.59, 0.70, 0.57) (0.64, 0.75, 0.65)
Results presented in Table 2 and illustrated in Figure 5 show that the multi-atlas
method outperforms the other PiB-only quantification methods. The non rigid registration to a mean population atlas did perform quite well in terms of R2 but with a fairly large mean error. Hence the SUVR values estimated using this approach will suffer from a systematic bias (as observed in Fig 5.), making it harder to mix the obtained SUVR values with MR-based ones when the MRI is available. A control point spacing of 10mm was used for the registration of the mean atlas to the PiB (as compared to 5mm for the Multi-Atlas approach), as a smaller control point spacing of
Manifold Driven MR-less PiB SUVR Normalisation 9

5mm lead to performances worse than the affine results due to foldings in the deformation field.
Table 2: Neocortical SUVR estimation of PiB-only methods, compared to the MRI-based quantification. Results are presented in terms of mean absolute difference, and coefficient of
determination: MD (R2)
Mean population PiB atlas 20 Nearest Neighbours Inverse distance weighted mean Diagnosis
group (N) Affine Non Rigid Affine Non Rigid
AD (37) 8.1% (0.67) 12.4% (0.75) 8.6% (0.60) 8.0% (0.66) 11.2% (0.27)
MCI (43) 7.3% (0.93) 11.8% (0.88) 8.5% (0.92) 6.1% (0.91) 8.5% (0.78)
NC (157) 8.9% (0.88) 10.4% (0.92) 8.3% (0.87) 5.4% (0.94) 8.0% (0.84)
ALL (237) 8.5% (0.91) 11.0% (0.92) 8.4% (0.90) 5.9% (0.94) 8.6% (0.84)
Table 3: Neocortical SUVR estimation of our PiB-only method compared to the MRI-based quantification in various regions. Results are presented in terms of mean absolute difference,
and coefficient of determination: MD (R2)
Diagnosis group (N) Frontal Occipital Parietal Precuneus Temporal
AD (37) 8.0% (0.67) 8.2% (0.70) 8.4% (0.55) 8.0% (0.63) 7.7% (0.74)
MCI (43) 5.9% (0.93) 7.4% (0.85) 7.3% (0.87) 6.0% (0.93) 6.6% (0.90)
NC (157) 5.4% (0.95) 6.8% (0.83) 5.8% (0.92) 6.0% (0.95) 5.5% (0.93)
ALL (237) 5.9% (0.94) 7.1% (0.87) 6.5% (0.91) 6.3% (0.94) 6.0% (0.93)
Fripp et al. [6] NA (0.78) NA (0.87) NA (0.84) NA (0.96) NA (0.96)
As mentioned earlier, the improvement of the multi-atlas approach is more
significant in the NC and MCI as they benefit from more accurate segmentations and parcellations. The mean error across the population of 5.9% is close to the 5% test-retest variability measured in SUVR estimation of PiB scan [4].
The SUVR estimation based on the inverse distance weighted mean, despite its theoretical appeal, performs quite poorly. The low performances can be explained by Fig 1, which shows that some high SUVR cases are mapped next to low SUVR cases. It is worth noting here that the manifold was created with an affine registration of the PiB images to a template, and therefore, does not account for atrophy. Hence, the mapping on the manifold reflects both the PiB distribution and the level of atrophy, which will be most noticeable in the ventricles on PiB images. A soft non rigid registration before the generation of the manifold could potentially alleviate some of the effects of atrophy and lead to an improve mapping of SUVR values on the manifold.
Table 3 illustrate the performance of our approach in the estimation of SUVR retention in different regions of the brain. Our results compared favourably with the results reported in [6], giving more consistent performances across all regions of the brain.
10 Bourgeat et al.

Figure 5: Scatter plot of the neocortical SUVR estimation of PiB-only methods (y-axis),
compared to the MRI-based quantification (x-axis).
Manifold Driven MR-less PiB SUVR Normalisation 11

4 Conclusion
We have presented an MR-less approach to quantify PiB image when no MRI are available. Results showed that the proposed approach can led to an accurate quantification of SUVR values. As amyloid tracers become more prevalent and used in the clinic, MR-less approaches will become critical when no MRs are available. Future work will focus on trying to minimise the effects of atrophy in the manifold construction to better select neighbouring atlases.
References
1. Jack C.R., Lowe V.J., Weigand S.D., et al. Serial PIB and MRI in normal, mild cognitive impairment and Alzheimer’s disease: implications for sequence of pathological events in Alzheimer’s disease. Brain. 132, 1355–1365 (2009).
2. Pike K.E., Savage G., Villemagne V.L., et al. ȕ-amyloid imaging and memory in non-demented individuals: evidence for preclinical Alzheimer’s disease. Brain. 130, 2837–2844 (2007).
3. Ellis K.A., Bush A.I., Darby D., et al. The Australian Imaging, Biomarkers and Lifestyle (AIBL) study of aging: methodology and baseline characteristics of 1112 individuals recruited for a longitudinal study of Alzheimer’s disease. Int Psychogeriatr. 21, 672–687 (2009).
4. Lopresti B.J., Klunk W.E., Mathis C.A., et al. Simplified Quantification of Pittsburgh Compound B Amyloid Imaging PET Studies: A Comparative Analysis. J Nucl Med. 46, 1959–1972 (2005).
5. Raniga P., Bourgeat P., Villemagne V., et al. Spline based inhomogeneity correction for 11C-PIB PET segmentation using expectation maximization. MICCAI'07. 228–235 (2007).
6. Fripp J., Bourgeat P., Raniga P., et al. MR-Less High Dimensional Spatial Normalization of 11C PiB PET Images on a Population of Elderly, Mild Cognitive Impaired and Alzheimer Disease Patients. MICCAI'08. 442–449. (2008).
7. Fiot J.-B., Cohen L. D., Bourgeat P., et al. Multimodality Imaging Population Analysis using Manifold Learning. VipIMAGE'11, Olhão, Portugal, 2011.
8. Tustison N.J., Avants B.B., Cook P.A., et al. N4ITK: Improved N3 Bias Correction. IEEE TMI. 29, 1310–1320 (2010).
9. Rohlfing T., Rademacher M.H., Pfefferbaum A.: Volume Reconstruction by Inverse interpolation: Application to Interleaved MR Motion Correction. MICCAI'08. 798–806 (2008).
10. Van Leemput K., Maes F., Vandermeulen D., Suetens P. Automated model-based tissue classification of MR images of the brain. IEEE TMI. 18, 897–908 (1999).
11. Rohlfing T., Brandt R., Maurer C.R., Menzel R. Bee brains, B-splines and computational democracy: generating an average shape atlas. MMBIA'01. 187–194. (2001).
12. Modat M., Ridgway G.R., Taylor Z.A., et al. Fast free-form deformation using graphics processing units. Comput. Methods Prog. Biomed. 98, 278–284 (2010).
13. Wolz R., Aljabar P., Hajnal et al. LEAP: learning embeddings for atlas propagation. Neuroimage. 49, 1316–1325 (2010).
14. Tzourio-Mazoyer N., Landeau B., Papathanassiou D., et al. Automated anatomical labeling of activations in SPM using a macroscopic anatomical parcellation of the MNI MRI single-subject brain. Neuroimage. 15, 273–289 (2002).
12 Bourgeat et al.