Embed Size (px)
Citation preview

Research Paper
102Yu et al. | Okavango mantle structureGEOSPHERE | Volume 13 | Number 1
Mantle structure beneath the incipient Okavango rift zone in southern AfricaYouqiang Yu1,2, Kelly H. Liu2, Zhouchuan Huang3, Dapeng Zhao4, Cory A. Reed2, Moikwathai Moidaki5, Jianshe Lei6, and Stephen S. Gao2
1State Key Laboratory of Marine Geology, Tongji University, Shanghai 200092, China2Geology and Geophysics Program, Missouri University of Science and Technology, Rolla, Missouri 65409, USA3School of Earth Sciences and Engineering, Nanjing University, Nanjing 210023, China4Department of Geophysics, Tohoku University, Sendai 980-8577, Japan5Department of Physics, University of Botswana, Gaborone, Private Bag 0022, Botswana6Key Laboratory of Crustal Dynamics, Institute of Crustal Dynamics, China Earthquake Administration, Beijing 100085, China
ABSTRACT
Numerous investigations of the mature segments of the East African rift system (EARS) have significantly improved our understanding of the structure and processes associated with well-developed continental rifts. In contrast, knowledge of rifting processes at their early stage is still significantly limited. Here we present results from a teleseismic P-wave tomography investigation of the incipient Okavango rift zone (ORZ), which is located at the southwestern terminus of the EARS. P-wave relative travel-time residuals recorded by 17 re-cently deployed portable seismic stations were manually picked and inverted for three-dimensional upper-mantle and mantle transition-zone tomographic images beneath the ORZ and its adjacent areas. High-velocity anomalies prob-ably representing cratonic lithosphere are visible under the Congo and Kala-hari cratons, extending to depths of ~250–350 km. The tectonic boundary of the Congo craton is observed along the western edge of the ORZ. A localized low-velocity anomaly of about –1% in magnitude is revealed in the upper astheno sphere beneath the ORZ, which is interpreted to represent decompres-sion melting induced by lithospheric thinning. The results support the notion that the initiation and early-stage development of the ORZ are mostly due to lithospheric stretching resulted from the relative motion between the Archean Congo and Kalahari cratons along preexisting ancient orogenic zones.
INTRODUCTION
Continental rifting plays a significant role in the evolution of the Earth (e.g., Ziegler and Cloetingh, 2004). Our current comprehension of rifting processes is primarily obtained from studying relatively mature rifts such as the Main Ethiopian and Kenyan rifts of the East African rift system (EARS). In contrast, the mechanisms and processes associated with the initiation and early-stage development of rifting are inadequately investigated, preventing a thorough understanding of the whole rifting cycle.
Most mature rifts are characterized by a low-velocity (low-V), potentially partially molten upper mantle, which has been interpreted as the result of ac-
tive upwelling of mantle plumes or decompression melting due to passive lithospheric stretching (White and McKenzie, 1989). In addition, the time of the emplacement of the sub-rift low-V zone as well as the amplitude of the anomaly beneath emerging young rifts are still poorly constrained. Here we seek to fill the knowledge gap of the evolution of rifting at its earliest stage by conducting a seismic body-wave tomographic investigation of the incipient Okavango rift zone (ORZ) in southern Africa.
The ORZ is believed to be one of the youngest continental rifts in the world (Reeves, 1972; Reeves and Hutchins, 1975; Scholz et al., 1976). The initiation of the ORZ is estimated to have been in the Holocene, approximately between 120 ka and 40 ka (Modisi et al., 2000; Moore and Larkin, 2001). The ORZ is considered to be the terminal section of the southwestern branch of the EARS (Reeves, 1972; Modisi et al., 2000), having primarily developed within the Paleo protero zoic Magondi belt, the Paleo-Mesoproterozoic Rehoboth prov-ince, and the Neo protero zoic Damara belt between the Archean Congo craton to the northwest and the Kalahari craton (which includes the Kaapvaal and Zimbabwe cratons and the Limpopo belt in the study area) to the southeast (Fig. 1; Begg et al., 2009).
Based on analyses of Shuttle Radar Topography Mission and aeromag-netic data, Kinabo et al. (2008) proposed that the localization and development of rift-associated faults beneath the ORZ were mainly controlled by preexist-ing basement fabrics. Similarly, Khoza et al. (2013) suggested that the ORZ was generated in preexisting orogenic zones, on the basis of the lack of ele-vated mantle conductivity from two-dimensional (2-D) and three-dimensional (3-D) inversions of magnetotelluric data. Gravity and magnetic investigations concluded that hydrothermal metasomatism and strain-weakening of the lithospheric mantle promoted the initiation of the ORZ (Leseane et al., 2015). Recently, using broadband seismic data from Seismic Arrays for African Rift Initiation (SAFARI; Gao et al., 2013), Yu et al. (2015a) showed that the Moho shallows by 4–5 km and that there are no thermal anomalies in the mantle tran-sition zone beneath the ORZ, ruling out the existence of one or more mantle plumes originating from the lower mantle directly beneath the study area (Yu et al., 2015b). The observations, however, cannot readily rule out the influence on early-stage rifting by one or more mantle plumes entering the upper mantle
GEOSPHERE
GEOSPHERE; v. 13, no. 1
doi:10.1130/GES01331.1
7 figures; 2 supplemental files
CORRESPONDENCE: sgao@ mst .edu
CITATION: Yu, Y., Liu, K.H., Huang, Z., Zhao, D., Reed, C.A., Moidaki, M., Lei, J., and Gao, S.S., 2017, Mantle structure beneath the incipient Okavango rift zone in southern Africa: Geosphere, v. 13, no. 1, p. 102–111, doi:10.1130/GES01331.1.
Received 6 March 2016Revision received 15 September 2016Accepted 25 October 2016Published online 23 November 2016
For permission to copy, contact Copyright Permissions, GSA, or [email protected].
© 2016 Geological Society of America

Research Paper
103Yu et al. | Okavango mantle structureGEOSPHERE | Volume 13 | Number 1
from outside the study area, e.g., farther north along the EARS (Ebinger and Sleep, 1998). In addition, mantle anisotropy beneath the ORZ and its adjacent areas is characterized by dominantly northeast-southwest fast orientations, which are consistent with those observed in the surrounding areas in southern Africa, suggesting a lack of small-scale mantle flow circulation associated with the ORZ (Yu et al., 2015c). The evolution of the ORZ has thus been proposed to follow a passive rifting mode and to be associated with relative movements of the Archean cratons (Yu et al., 2015c).
Due to the existence of a thick Kalahari sedimentary cover (Cooke and Verstappen, 1984; Ringrose et al., 2005), results from previous geological stud-ies are controversial regarding the location of the southern boundary of the Congo craton (Singletary et al., 2003; Begg et al., 2009; McCourt et al., 2013). Investigations by Begg et al. (2009) show that the boundary of the Congo cra-
ton is situated outside of Botswana, while those by Singletary et al. (2003) and McCourt et al. (2013) indicate that the Congo craton occupies part of north-western Botswana (Fig. 1). In contrast, magnetotelluric studies show that the lithospheric thickness beneath the northern and southern ORZ is ~160 km (Muller et al., 2009) and 180 km (Miensopust et al., 2011), respectively, and the boundary of the Congo craton approaches the northwestern border of the ORZ (Khoza et al., 2013).
One of the main seismological observables that is still lacking is the upper- mantle velocity structure beneath the ORZ. In this study, we conduct a teleseis-mic P-wave tomography investigation of the upper-mantle and mantle transi-tion zone velocity structure in the vicinity of the ORZ. The tomographic results shed new light on rifting initiation and early-stage development, as well as on the location of cratonic boundaries in the lithosphere.
20°E 22°E 24°E 26°E 28°E24°S
22°S
20°S
18°S
600 800 1000 1200 1400 1600
Congo
Craton
Damar
a Be
lt
Prov
ince
Rehob
oth
Kaapvaal Craton
Limpopo
Belt
Mag
ondi
Belt
ZimbabweCraton
Elevation(m)
N
B01KR
B02LT
B03SL
B04KHB05MO
B06OR
B07DX
B08TS
B09NK
B10PPB11ET
B12SSB13NX
B14MH
B15MW
B1665
B17CI
Botswana
Nam
ibia
Zambia
ORZFigure 1. Tectonic units of the study area (southern Africa) and distribution of Seismic Arrays for African Rift Initiation stations (red triangles) used in this study. The gray lines indicate the major tec-tonic boundaries modified from McCourt et al. (2013), and the red lines are country boundaries. The gray area represents the Okavango rift zone (ORZ), and the dashed black lines show major faults (Kinabo et al., 2008). The white dashed line shows the location of the vertical cross-section in Figure 7. The Kalahari craton in the study area is composed of the Kaapvaal and Zimbabwe cratons and the Limpopo belt. The box in the inset map defines the loca-tion of the present study area and the East African rift system (the blue lines denote the rift axes).

Research Paper
104Yu et al. | Okavango mantle structureGEOSPHERE | Volume 13 | Number 1
DATA AND METHOD
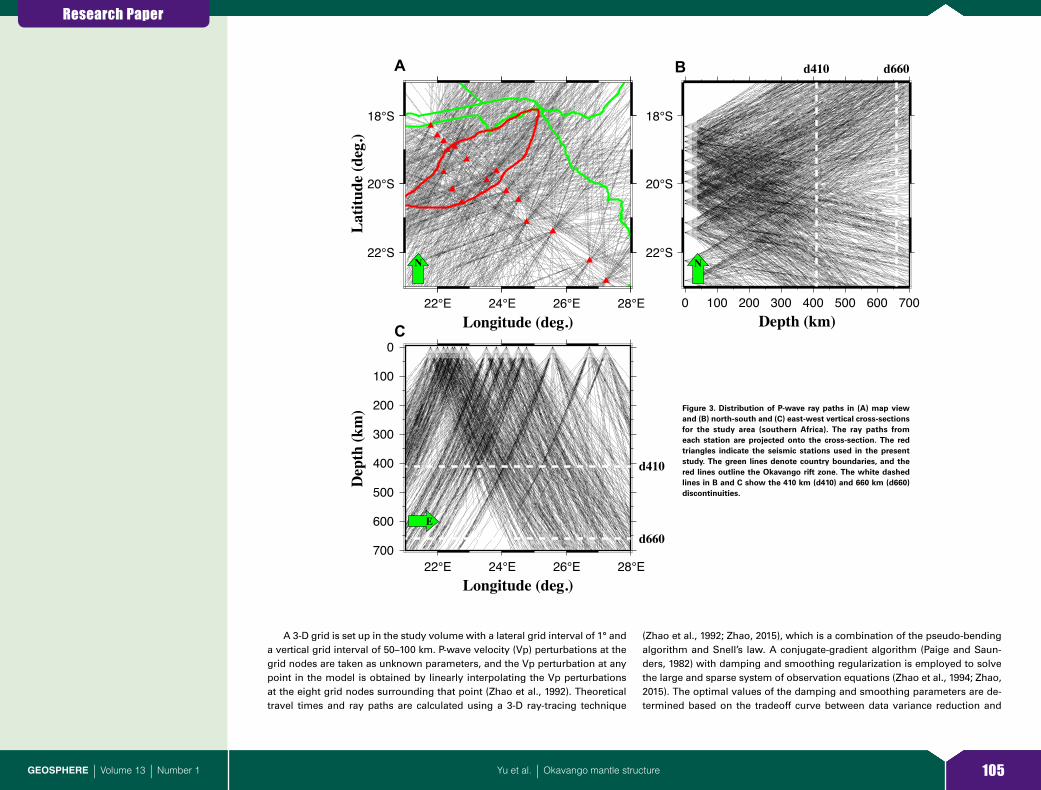
Data used in the study were recorded by 17 broadband seismic stations belonging to the SAFARI experiment (Gao et al., 2013). The stations were de-ployed along a ~760-km-long northwest-southeast profile traversing the ORZ (Fig. 1) with a sampling frequency of 50 Hz and a continuous recording time of 2 yr starting from May 2012. The epicentral distance of the events used in the study ranges from 25° to 95°, and the minimum body-wave magnitude is 4.3, as determined by the U.S. Geological Survey (http:// earthquake .usgs .gov /earthquakes /search). The vertical-component seismograms with a high signal-to-noise ratio are windowed based on the theoretical arrival times computed using the IASP91 Earth model (Kennett and Engdahl, 1991), and the P-wave arrival time is manually picked. The picking accuracy is estimated to be 0.1–0.2 s, as demonstrated in the example shown in Supplemental Fig-ure S11. The picking procedure includes several interactive steps. For a given event, we start with a careful visual check of all the vertical-component seis-mograms to reject all lacking a clear P-wave onset. Those remaining are then zoomed (Supplemental Fig. S1C [see footnote 1]) and the onset is picked. The seismograms are then aligned according to the picked arrival time to iden-tify mis-picked traces, and necessary corrections are made until the align-ment is satisfactory. Each of the events used in the study was recorded by at least five stations. A total of 1736 direct P-wave arrivals from 148 teleseismic events (Fig. 2) are used for the tomographic inversion. The ray paths criss-cross reasonably well in both the horizontal and vertical planes down to a depth of 700 km (Fig. 3).
In order to minimize the effects of the uncertainties in hypocenter loca-tions and origin times, as well as velocity heterogeneities outside the study volume, we compute relative travel-time residuals for each event in the Sup-plemental Data2 by subtracting the mean residual from the raw residuals prior to the tomographic inversion. The tomographic method of Zhao et al. (1994) is then applied to image the 3-D upper mantle velocity structure under the ORZ and its surrounding areas. The IASP91 Earth model is adopted to be the starting one-dimensional velocity model for the tomographic inversion. The effect of surface topography and contributions from crustal thickness variations on the observed residuals are removed by interpolating a crustal model determined by a receiver-function study using data from the same stations (Yu et al., 2015a). An average crustal P-wave velocity of 6.5 km/s is adopted based on a previous seismic refraction study in the Kaapvaal craton (Durrheim and Green, 1992), and the length of the ray path in the crust is cal-culated by considering the angle of incidence calculated using the ray param-eter. The small crustal thickness variation of ~5 km across the profile leads to a maximum difference of ~0.1 s in crustal contribution to the observed relative residuals. Most of the corrected relative residuals fall in the range of –0.4 to 0.4 s (Supplemental Fig. S2 [see footnote 1]), and relative to the Kaapvaal craton to the southeast of the rift, the ORZ exhibits a travel-time delay of ~0.4 s (see Yu et al., 2015b, their figure 7), which is significantly smaller than the amount of delay associated with mature rifts such as Baikal
(southeastern Russia, ~1.3 s; Gao et al., 2003; Zhao et al., 2006), Rio Grande (southwestern USA and northern Mexico, ~1.5 s; Gao et al., 2004), and the Tanzanian and Ethiopian sections of the EARS (>2.0 s; Ritsema et al., 1998; Bastow et al., 2005).
The mean travel-time residual for each of the events, which is removed from the raw travel-time residuals to obtain relative residuals, ranges from –0.8 to 4.5 s, with an average of 1.5 ± 0.1 s. Given the decent azimuthal coverage of the events (Fig. 2) and the associated small likelihood that the delay is dominantly caused by low-V anomalies near the hypocentral areas, this observation suggests an overall slower-than-normal mantle beneath southern Africa. Interestingly, previous surface-wave studies (e.g., Fishwick, 2010; Priestley et al., 2008) reveal normal to higher-than-normal velocities in the upper mantle beneath the study area. These observations are con-sistent with the existence of a large-scale low-V anomaly (the so-called African super plume) in the lower mantle beneath southern Africa (Ritsema et al., 1998).
30
60
90100S
N
W E
Figure 2. Epicentral distribution of the 148 teleseismic events (red crosses) used in this study. The red triangle indicates the center of the study area, and the numbers show the epicentral distance in degrees from the center of the study area.
In this file, all the events and travel time residuals involved in the study are listed. The numbers in the event line are corresponding to the information on the occurring of the event: year, month, day, hour, minute, second, latitude, longitude, depth, magnitude, number-of-stations
50˚W 40˚W 30˚W 20˚W 10˚W 0˚ 10˚E 20˚E 30˚E 40˚E
30˚S
20˚S
10˚S
0˚
10˚N
EQ2013-175-2204 EVLA=10.7 EVLO=-42.6(A)
-4
-2
0
2
4
6
8
10
B14
MH
__X
K
B13
NX
__X
K
B12
SS__
XK
B11
ET
__X
K
B09
NK
__X
K
B10
PP__
XK
B08
TS_
_XK
B17
CI_
_XK
B07
DX
__X
K
B06
OR
__X
K
B15
MW
__X
K
B05
MO
__X
K
B04
KH
__X
K
B03
SL__
XK
B02
LT
__X
K
B01
KR
__X
K
B16
65__
XK
69.8 70.0 70.3 70.5 70.6 70.6 71.0 71.1 71.3 71.8 72.0 72.5 72.9 73.3 74.1 75.4 76.0
Tim
e re
lativ
e to
IASP
91 (s
)
(B)
-4
-2
0
2
4
6
8
10
-0.4
0.0
0.4
0.8
1.2
B14
MH
__X
K
B13
NX
__X
K
B12
SS__
XK
B11
ET
__X
K
B09
NK
__X
K
B10
PP__
XK
B08
TS_
_XK
B17
CI_
_XK
B07
DX
__X
K
B06
OR
__X
K
B15
MW
__X
K
B05
MO
__X
K
B04
KH
__X
K
B03
SL__
XK
B02
LT
__X
K
B01
KR
__X
K
B16
65__
XK
69.8 70.0 70.3 70.5 70.6 70.6 71.0 71.1 71.3 71.8 72.0 72.5 72.9 73.3 74.1 75.4 76.0
Tim
e re
lativ
e to
IASP
91 (s
)
(C)
-0.4
0.0
0.4
0.8
1.2
Epicentral distacne(degree)
Figure S1. Examples of picking original seismograms for one event occurring in 2013. (A)
Distribution of seismic stations (red triangles) and hypocenter (star). (B) Original seismograms with
hand-picked P wave arrivals (horizontal red bars). (C) Same as (B) while enlarged in the time
window of –0.4s~1.2s.
2Supplemental Data. Travel-time residuals. Please visit http:// dx .doi .org /10 .1130 /GES01331 .S2 or the full-text article on www .gsapubs .org to view the Sup-plemental Data.
1Supplemental Figures S1–S12. Please visit http:// dx .doi .org /10 .1130 /GES01331 .S1 or the full-text arti-cle on www .gsapubs .org to view the Supplemental Figures.
Research Paper
105Yu et al. | Okavango mantle structureGEOSPHERE | Volume 13 | Number 1
A 3-D grid is set up in the study volume with a lateral grid interval of 1° and a vertical grid interval of 50–100 km. P-wave velocity (Vp) perturbations at the grid nodes are taken as unknown parameters, and the Vp perturbation at any point in the model is obtained by linearly interpolating the Vp perturbations at the eight grid nodes surrounding that point (Zhao et al., 1992). Theoretical travel times and ray paths are calculated using a 3-D ray-tracing technique
(Zhao et al., 1992; Zhao, 2015), which is a combination of the pseudo-bending algorithm and Snell’s law. A conjugate-gradient algorithm (Paige and Saun-ders, 1982) with damping and smoothing regularization is employed to solve the large and sparse system of observation equations (Zhao et al., 1994; Zhao, 2015). The optimal values of the damping and smoothing parameters are de-termined based on the tradeoff curve between data variance reduction and
22°E 24°E 26°E 28°E
22°S
20°S
18°S
N
A
Latit
ude (
deg.
)
Longitude (deg.)
22°S
20°S
18°S
0 100 200 300 400 500 600 700
N
Depth (km)
d410 d660B
22°E 24°E 26°E 28°E
0
100
200
300
400
500
600
700
E
Dep
th (k
m)
d410
d660
C
Longitude (deg.)
Figure 3. Distribution of P-wave ray paths in (A) map view and (B) north-south and (C) east-west vertical cross-sections for the study area (southern Africa). The ray paths from each station are projected onto the cross-section. The red triangles indicate the seismic stations used in the present study. The green lines denote country boundaries, and the red lines outline the Okavango rift zone. The white dashed lines in B and C show the 410 km (d410) and 660 km (d660) discontinuities.

Research Paper
106Yu et al. | Okavango mantle structureGEOSPHERE | Volume 13 | Number 1
model norm (Fig. 4; Hansen, 1992). The root-mean-square relative travel-time residuals before and after the inversion with 77 iterations are 0.32 s and 0.25 s, respectively (Supplemental Fig. S2B [see footnote 1]).
RESOLUTION TESTS AND RESULTS
In order to evaluate the resolution scale and reliability of our tomographic model, we conducted checkerboard resolution tests (CRTs), which are a con-venient way to examine the spatial resolution of tomographic images. The 3-D grid nodes are assigned with alternatively negative and positive Vp anomalies of 3%. The numbers of stations, events, and ray paths in the synthetic data set are the same as those in the real data set. Synthetic travel-time residuals are calculated for the input checkerboard model. Random noise with a standard deviation of 0.1 s is added to the synthetic data to simulate the picking errors in the observed data. The same tomographic algorithm is then applied for invert-ing the synthetic data to recover the input checkerboard model. Areas where the checkerboard model is well reconstructed are considered to have a high resolution.
Several CRTs with different grid intervals are conducted (Fig. 5; Supplemen-tal Figs. S3–S8 [see footnote 1]). Considering the balance between the resolu-tion scale and model reliability, a grid interval of 1° is chosen to conduct the optimal tomographic inversion of the real data. The CRT results show that the checkerboard pattern is well recovered for the depth range of 50–700 km in and around the ORZ (Fig. 5; Supplemental Figs. S3 and S4 [see footnote 1]). Due to the nearly vertically incident rays near the surface, the input anomalies in the shallower lithosphere (≤100 km depth) are generally resolved beneath the areas in and around the seismic array. With increasing depth, the crisscrossing of seismic rays gradually improves (Fig. 3) and the area with an acceptable resolution becomes larger (Fig. 5). However, the spatial resolution becomes significantly lower with depth in and around the ORZ area, where a limited ray-path coverage exists at greater depths (Fig. 3). This is the consequence of the fact that the linear array, which was designed to be perpendicular to the ORZ, is not optimally oriented toward the world’s main seismic zones. The resulting limited azimuthal coverage of the incoming rays could lead to biased velocity anomalies for nodes with strong seismic anisotropy. However, the study area is dominated by northeast-southwest–oriented azimuthal anisotropy (Yu et al., 2015c) which is parallel to the back-azimuth of the majority of the events used in this tomography study (Fig. 2). Consequently, the influence of azimuthal aniso-tropy may not be significant, although a quantitative evaluation of the degree of influence is impossible because the depth distribution of the azimuthal aniso-tropy is not known. As a whole, the CRT results (Fig. 5) suggest that the ob-tained tomographic images (Figs. 6 and 7) in the top 700 km depth are reliable.
Both low- and high-velocity bodies are clearly revealed in the upper man-tle, and there are few or no significant low-V anomalies within the mantle tran-sition zone, an observation that is consistent with the receiver-function results (Yu et al., 2015b). The velocity anomalies are dominantly in the range of –2% to 2% (Fig. 6). The distribution of the observed velocity anomalies is closely asso-
ciated with the tectonic terranes. For the Congo craton which is in the north-western part of the study area, low-V anomalies are constrained in the shallow lithosphere (<100 km depth), while the underlying depth range of 100–300 km is dominated by a high-V body (Fig. 7B). The most prominent feature observed on the cross-section (Fig. 7B) is a low-V zone in the depth range of 150–350 km beneath the ORZ. The anomaly covers the entire ORZ on the depth slices at 200 km and 300 km (Fig. 6) and possibly extends to the north of the ORZ. High-V anomalies, which are characteristic of the lithosphere, exist from the surface to the depth of ~150 km beneath the ORZ area and to ~250 km beneath the Kalahari craton (Fig. 7).
To confirm the main features of the tomographic images, we also conduct a restoring resolution test (RRT; Zhao and Hasegawa, 1993; Zhao et al., 1994). The RRT is similar to the CRT in principle, but instead of using the alternating velocity anomalies used in the CRT, the obtained tomographic results from the real data set are taken as the RRT input model. The resulting RRT image shows that the main features such as the low-V anomalies beneath the ORZ and the high-V bodies beneath the Congo and Kalahari cratons are well recovered (Figs. 7C; Supplemental Fig. S9 [see footnote 1]). More synthetic tests with different input models beneath the ORZ are conducted (Supplemental Figs. S10–S12 [see footnote 1]), and the test results suggest that the input models are well recovered in the upper mantle, whereas the resolution becomes lower in and below the mantle transition zone.
0.12
0.15
0.18
0.21
0.24
0.0 0.2 0.4 0.6 0.8 1.0 1.2
1015
20
30
4050
60
80
100
123
58
Norm of Solution (%)
RM
S Tr
avel
-Tim
e R
esid
ual (
s)
Figure 4. Trade-off curve for the norm of three-dimensional velocity models and root-mean-square (RMS) travel-time residuals for the tomographic inversions with different values of the damping parameter (shown along the curve). The filled dot indicates the optimal value (10) of the damping parameter used in this study.

Research Paper
107Yu et al. | Okavango mantle structureGEOSPHERE | Volume 13 | Number 1
20°E 24°E 28°E24°S
20°S
16°S50 kmA
20°E 24°E 28°E
100 kmB
20°E 24°E 28°E
200 kmC
20°E 24°E 28°E24°S
20°S
16°S300 kmD
20°E 24°E 28°E
400 kmE
20°E 24°E 28°E
500 kmF
20°E 24°E 28°E24°S
20°S
16°S600 kmG
20°E 24°E 28°E
700 kmH
–3% –1.5% 1.5% 3%
Figure 5. Results at different depths of a checkerboard resolution test for the study area (southern Africa) with a lateral grid in-terval of 1° and input velocity anomalies of ±3%. The red triangles represent the seis-mic stations. The open and solid circles indicate slow and fast velocity anoma lies (whose scale is shown below panel F), respectively. The gray shaded area is the Okavango rift zone.

Research Paper
108Yu et al. | Okavango mantle structureGEOSPHERE | Volume 13 | Number 1
DISCUSSION
Lithospheric Thickness
The prominent high-V anomalies clearly show the depth extent of the cra-tonic roots and the lithosphere beneath the rift zone (Figs. 6 and 7). Under the commonly used assumption that high-V anomalies represent the cratonic litho-sphere (James et al., 2001), our results suggest that the lithosphere beneath the Archean Congo craton may extend to an estimated maximum depth of 300–350 km, which is deeper than what was obtained from the 2-D and 3-D
inversions of magnetotelluric data (Fig. 7B; Khoza et al., 2013). The inferred lithospheric thickness of the Kalahari craton is ~250 km (Fig. 6), which is similar to the tomographic results in southern Africa, where the high-V mantle roots extend to depths of at least 250 km and locally 300 km (e.g., James et al., 2001). It is also consistent with results of a magnetotelluric experiment on the Zim-babwe craton, which shows a lithospheric thickness of 220 km (Miensopust et al., 2011). Our tomographic results suggest that the Congo craton terminates near the northern edge of the ORZ (Figs. 6C and 6D). The boundary of the Congo craton described by McCourt et al. (2013) and Singletary et al. (2003) is >100 km from what we determined from our tomographic images (Figs. 6C and 6D).
22°E 24°E 26°E 28°E
22°S
20°S
18°S
50 km
A22°E 24°E 26°E 28°E
100 km
B22°E 24°E 26°E 28°E
200 km
C
22°S
20°S
18°S
300 km
D
400 km
E
500 km
F
22°S
20°S
18°S
600 km
G
700 km
H
–2 –1 0 1 2
dVp (%)
Figure 6. Map views of P-wave tomogra-phy at different depths obtained by this study. The red and blue colors denote slow and fast velocities, respectively. The crosses denote the seismic stations. The black dashed line in the northwestern cor-ner of each map is the southern boundary of the Congo craton proposed by Single-tary et al. (2003), and the red dashed line in C and D shows the revised boundary based on results from this study. The white lines indicate major tectonic boundaries.
Research Paper
109Yu et al. | Okavango mantle structureGEOSPHERE | Volume 13 | Number 1
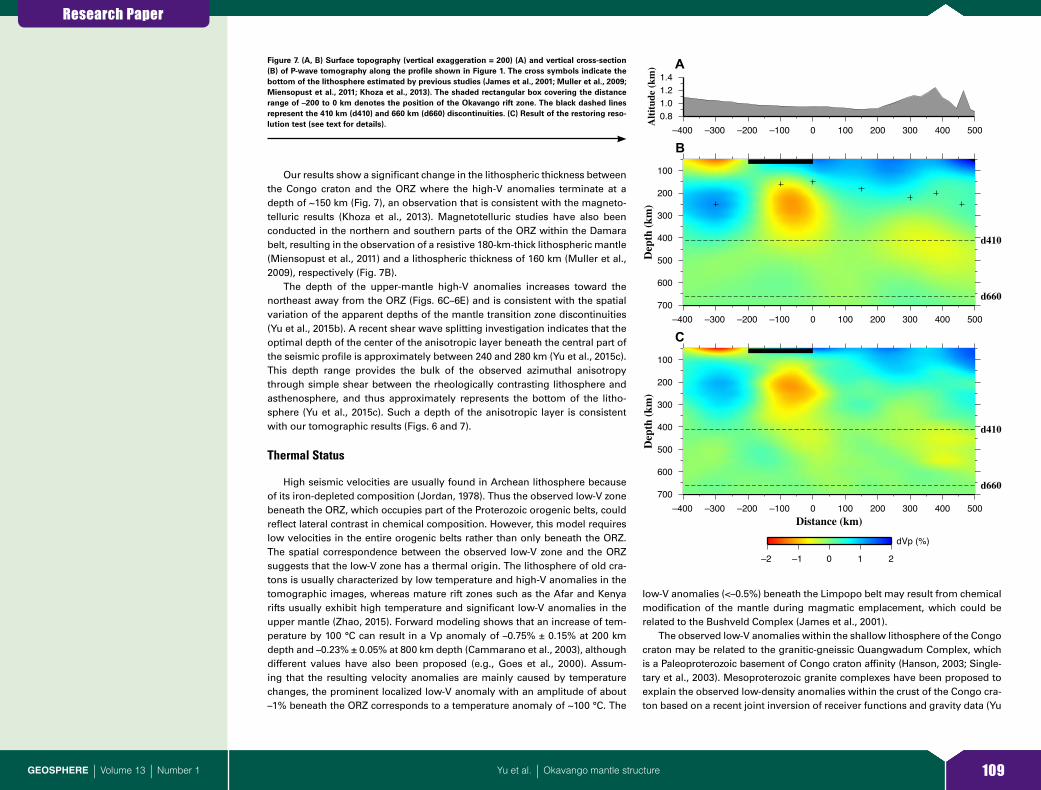
Our results show a significant change in the lithospheric thickness between the Congo craton and the ORZ where the high-V anomalies terminate at a depth of ~150 km (Fig. 7), an observation that is consistent with the magneto-telluric results (Khoza et al., 2013). Magnetotelluric studies have also been conducted in the northern and southern parts of the ORZ within the Damara belt, resulting in the observation of a resistive 180-km-thick lithospheric mantle (Miensopust et al., 2011) and a lithospheric thickness of 160 km (Muller et al., 2009), respectively (Fig. 7B).
The depth of the upper-mantle high-V anomalies increases toward the northeast away from the ORZ (Figs. 6C–6E) and is consistent with the spatial variation of the apparent depths of the mantle transition zone discontinuities (Yu et al., 2015b). A recent shear wave splitting investigation indicates that the optimal depth of the center of the anisotropic layer beneath the central part of the seismic profile is approximately between 240 and 280 km (Yu et al., 2015c). This depth range provides the bulk of the observed azimuthal anisotropy through simple shear between the rheologically contrasting lithosphere and asthenosphere, and thus approximately represents the bottom of the litho-sphere (Yu et al., 2015c). Such a depth of the anisotropic layer is consistent with our tomographic results (Figs. 6 and 7).
Thermal Status
High seismic velocities are usually found in Archean lithosphere because of its iron-depleted composition (Jordan, 1978). Thus the observed low-V zone beneath the ORZ, which occupies part of the Proterozoic orogenic belts, could reflect lateral contrast in chemical composition. However, this model requires low velocities in the entire orogenic belts rather than only beneath the ORZ. The spatial correspondence between the observed low-V zone and the ORZ suggests that the low-V zone has a thermal origin. The lithosphere of old cra-tons is usually characterized by low temperature and high-V anomalies in the tomographic images, whereas mature rift zones such as the Afar and Kenya rifts usually exhibit high temperature and significant low-V anomalies in the upper mantle (Zhao, 2015). Forward modeling shows that an increase of tem-perature by 100 °C can result in a Vp anomaly of –0.75% ± 0.15% at 200 km depth and –0.23% ± 0.05% at 800 km depth (Cammarano et al., 2003), although different values have also been proposed (e.g., Goes et al., 2000). Assum-ing that the resulting velocity anomalies are mainly caused by temperature changes, the prominent localized low-V anomaly with an amplitude of about –1% beneath the ORZ corresponds to a temperature anomaly of ~100 °C. The
low-V anomalies (<–0.5%) beneath the Limpopo belt may result from chemical modification of the mantle during magmatic emplacement, which could be related to the Bushveld Complex (James et al., 2001).
The observed low-V anomalies within the shallow lithosphere of the Congo craton may be related to the granitic-gneissic Quangwadum Complex, which is a Paleoproterozoic basement of Congo craton affinity (Hanson, 2003; Single-tary et al., 2003). Mesoproterozoic granite complexes have been proposed to explain the observed low-density anomalies within the crust of the Congo cra-ton based on a recent joint inversion of receiver functions and gravity data (Yu
0.81.01.21.4
–400 –300 –200 –100 0 100 200 300 400 500
A
Alti
tude
(km
)
100
200
300
400
500
600
700–400 –300 –200 –100 0 100 200 300 400 500
B
Dep
th (k
m)
d410
d660
100
200
300
400
500
600
700–400 –300 –200 –100 0 100 200 300 400 500
C
Dep
th (k
m)
Distance (km)
d410
d660
–2 –1 0 1 2
dVp (%)
Figure 7. (A, B) Surface topography (vertical exaggeration = 200) (A) and vertical cross-section (B) of P-wave tomography along the profile shown in Figure 1. The cross symbols indicate the bottom of the lithosphere estimated by previous studies (James et al., 2001; Muller et al., 2009; Miensopust et al., 2011; Khoza et al., 2013). The shaded rectangular box covering the distance range of –200 to 0 km denotes the position of the Okavango rift zone. The black dashed lines represent the 410 km (d410) and 660 km (d660) discontinuities. (C) Result of the restoring reso-lution test (see text for details).

Research Paper
110Yu et al. | Okavango mantle structureGEOSPHERE | Volume 13 | Number 1
et al., 2015a). Consistent with tomographic studies (James et al., 2001) of the adjacent Kalahari craton, there is no evidence to support a significant low-V asthenospheric layer beneath the Archean keel.
There is a significant low-V zone in the depth range of 300–500 km situated at the northern edge of our study area (Fig. 6). In the vicinity of this area, xeno-lith-defined temperature profiles suggest that the Congo craton lithosphere experienced melt-induced metasomatic episodes ca. 32 Ma (Batumike et al., 2009). Numerical modeling shows that for a cratonic lithosphere, long-term processes related to metasomatism and fertilization associated with magma percolation may modify the composition of the lithosphere through time (Manatschal et al., 2015).
Decompression Melting and Rifting Implications
The localized low-V anomaly beneath the ORZ could be a result of partial melting in the lithospheric mantle, which can be attributed to increased tem-perature, reduced pressure, or presence of volatiles (Shankland et al., 1981; Aivazpourporgou et al., 2015). The most commonly cited source leading to an increased mantle temperature is the presence of a mantle plume (Zhao, 2015). However, the expected significant low-V anomalies associated with lower- mantle plumes beneath the ORZ are not observed (Figs. 6 and 7). Instead, our results support the existence of an estimated –1% Vp anomaly in the upper asthenosphere beneath the ORZ. The absence of plumes in the upper mantle and mantle transition zone beneath the ORZ is also supported by the observed normal thickness of the mantle transition zone (Yu et al., 2015b), the lack of ele-vated mantle conductivity (Khoza et al., 2013), the lack of rift-related anomalies in the dominantly northeast-southwest mantle anisotropy (Yu et al., 2015c), and the localized uplift of the Moho (Yu et al., 2015a).
A possible cause of the observed low-V anomalies beneath the ORZ is de-compression melting. A recent geodetic study (Malservisi et al., 2013) shows that the South African block is probably rotating clockwise relative to the Afri-can continent along the Damara belt with an estimated spreading rate of ~0.5–1.5 mm/yr in the vicinity of the ORZ. Such a relative motion can exert a trans-ex-tensional force to the ORZ, leading to mechanical stretching of the litho sphere. Mechanical stretching can in turn induce lithospheric thinning which will re-duce the overlying pressure, enhancing decompression melting (Corti et al., 2003; Acocella, 2014). The existence of lithospheric decompression melting be-neath the ORZ has also been suggested based on the observed relatively lower subcrustal mantle density from inversion of gravity data (Yu et al., 2015a). In addition, the high heat flow observed within the ORZ may have a mantle origin, as suggested by a 3-D inversion of aeromagnetic data (Leseane et al., 2015).
CONCLUSIONS
Our tomographic images show that the lithosphere beneath the ORZ, which is embedded within Proterozoic orogenic belts between the Archean Congo and Kalahari cratons, is thinner than that of the adjacent cratons. The
cratonic roots are outlined in the tomographic images by high-V anomalies, which extend to 250–350 km depths beneath the Congo and Kalahari cratons. Our observations provide the most convincing evidence thus far that the southern boundary of the Congo craton extends to near the ORZ. The localized low-V anomaly observed in the upper asthenosphere is most likely caused by decompression melting from lithospheric stretching, and corresponds to an estimated temperature anomaly of 100 °C. Our results suggest that de-compression melting is induced during the earliest stage of continental rift-ing. Results from this teleseismic P-wave tomography study of the ORZ, when combined with those from recent crustal and mantle structure and anisotropy investigations, indicate that the ORZ is characterized as a passive rift initiated in a preexisting zone of lithospheric weakness, probably due to relative move-ments of rigid cratonic blocks.
ACKNOWLEDGMENTS
Equipment and logistical support from the Incorporated Research Institutions for Seismology (IRIS) Program for Array Seismic Studies of the Continental Lithosphere (PASSCAL) Instrument Center is greatly appreciated. We thank the Data Management Center of IRIS for archiving the SAFARI seismic data sets used in this study. We are grateful to Angela M. Reusch of PASSCAL and Keletso Kaisara of the University of Botswana for field assistance. Constructive comments from two anonymous reviewers and the Associate Editor significantly improved the manuscript. The field and data analysis work was supported by the U.S. National Science Foundation under award EAR-1009946 to S.S.G. and K.H.L., and was partly funded by the National Natural Science Foundation of China through grant 41606043 to Y.Y., and the National Program on Global Changing and Air-Sea Interaction through grant GASI-GEOGE-05.
REFERENCES CITED
Acocella, V., 2014, Structural control on magmatism along divergent and convergent plate boundaries: Overview, model, problems: Earth-Science Reviews, v. 136, p. 226–288, doi: 10 .1016 /j .earscirev .2014 .05 .006 .
Aivazpourporgou, S., Thiel, S., Hayman, P.C., Moresi, L.N., and Heinson, G., 2015, Decompres-sion melting driving intraplate volcanism in Australia: Evidence from magnetotelluric sounding: Geophysical Research Letters, v. 42, p. 346–354, doi: 10 .1002 /2014GL060088 .
Bastow, I.D., Stuart, G.W., Kendall, J.M., and Ebinger, C.J., 2005, Upper-mantle seismic structure in a region of incipient continental breakup: Northern Ethiopian rift: Geophysical Journal International, v. 162, p. 479–493, doi: 10 .1111 /j .1365 -246X .2005 .02666 .x .
Batumike, J.M., Griffin, W.L., and O’Reilly, S.Y., 2009, Lithospheric mantle structure and the dia-mond potential of kimberlites in southern D.R. Congo: Lithos, v. 112, p. 166–176, doi: 10 .1016 /j .lithos .2009 .04 .020 .
Begg, G.C., Griffin, W.L., Natapov, L.M., O’Reilly, S.Y., Grand, S.P., O’Neill, C.J., Hronsky, J.M.A., Djomani, Y.P., Swain, C.J., Deen, T., and Bowden, P., 2009, The lithospheric architecture of Africa: Seismic tomography, mantle petrology, and tectonic evolution: Geosphere, v. 5, p. 23–50, doi: 10 .1130 /GES00179 .1 .
Cammarano, F., Goes, S., Vacher, P., and Giardini, D., 2003, Inferring upper-mantle temperatures from seismic velocities: Physics of the Earth and Planetary Interiors, v. 138, p. 197–222, doi: 10 .1016 /S0031 -9201 (03)00156 -0 .
Cooke, H.J., and Verstappen, H.T., 1984, The landforms of the western Makgadikgadi basin in northern Botswana, with a consideration of the chronology of the evolution of Lake Palaeo- Makgadikgadi: Zeitschrift für Geomorphologie, v. 28, p. 1–19.
Corti, G., Bonini, M., Conticelli, S., Innocenti, F., Manetti, P., and Sokoutis, D., 2003, Analogue modelling of continental extension: A review focused on the relations between the patterns of deformation and the presence of magma: Earth-Science Reviews, v. 63, p. 169–247, doi: 10 .1016 /S0012 -8252 (03)00035 -7 .
Durrheim, R.J., and Green, R.W.E., 1992, A seismic refraction investigation of the Archaean Kaapvaal Craton, South Africa, using mine tremors as the energy source: Geophysical Jour-nal International, v. 108, p. 812–832, doi: 10 .1111 /j .1365 -246X .1992 .tb03472 .x .

Research Paper
111Yu et al. | Okavango mantle structureGEOSPHERE | Volume 13 | Number 1
Ebinger, C.J., and Sleep, N.H., 1998, Cenozoic magmatism throughout east Africa resulting from impact of a single plume: Nature, v. 395, p. 788–791, doi: 10 .1038 /27417 .
Fishwick, S., 2010, Surface wave tomography: Imaging of the lithosphere-asthenosphere bound-ary beneath central and southern Africa?: Lithos, v. 120, p. 63–73, doi: 10 .1016 /j .lithos .2010 .05 .011 .
Gao, S.S., Liu, K.H., Davis, P.M., Slack, P.D., Zorin, Y.A., Mordvinova, V.V., and Kozhevnikov, V.M., 2003, Evidence for small-scale mantle convection in the upper mantle beneath the Baikal rift zone: Journal of Geophysical Research, v. 108, 2194, doi: 10 .1029 /2002JB002039 .
Gao, S.S., Liu, K.H., Reed, C.A., Yu, Y., Massinque, B., Mdala, H., Moidaki, M., Mutamina, D., Atekwana, E.A., Ingate, S., and Reusch, A.M., 2013, Seismic arrays to study African rift initiation: Eos (Transactions, American Geophysical Union), v. 94, p. 213–214, doi: 10 .1002 /2013EO240002 .
Gao, W., Grand, S.P., Baldridge, W.S., Wilson, D., West, M., Ni, J.F., and Aster, R., 2004, Upper mantle convection beneath the central Rio Grande rift imaged by P and S wave tomography: Journal of Geophysical Research, v. 109, B03305, doi: 10 .1029 /2003JB002743 .
Goes, S., Govers, R., and Vacher, P., 2000, Shallow mantle temperatures under Europe from P and S wave tomography: Journal of Geophysical Research, v. 105, p. 11,153–11,169, doi: 10 .1029 /1999JB900300 .
Hansen, P.C., 1992, Analysis of discrete ill-posed problems by means of the L-curve: SIAM (Soci-ety for Industrial and Applied Mathematics) Review, v. 34, p. 561–580, doi: 10 .1137 /1034115 .
Hanson, R.E., 2003, Proterozoic geochronology and tectonic evolution of southern Africa, in Yoshida, M., Windley, B.F., and Dasgupta, S., eds., Proterozoic East Gondwana: Superconti-nent Assembly and Breakup: Geological Society of London Special Publication 206, p. 427–463, doi: 10 .1144 /GSL .SP .2003 .206 .01 .20 .
James, D.E., Fouch, M.J., VanDecar, J.C., and Van Der Lee, S., 2001, Tectospheric structure beneath southern Africa: Geophysical Research Letters, v. 28, p. 2485–2488, doi: 10 .1029 /2000GL012578 .
Jordan, T.H., 1978, Composition and development of the continental tectosphere: Nature, v. 274, p. 544–548, doi: 10 .1038 /274544a0 .
Kennett, B.L.N., and Engdahl, E.R., 1991, Traveltimes for global earthquake location and phase identification: Geophysical Journal International, v. 105, p. 429–465, doi: 10 .1111 /j .1365 -246X .1991 .tb06724 .x .
Khoza, T.D., Jones, A.G., Muller, M.R., Evans, R.L., Miensopust, M.P., and Webb, S.J., 2013, Litho-spheric structure of an Archean craton and adjacent mobile belt revealed from 2-D and 3-D inversion of magnetotelluric data: Example from southern Congo craton in northern Namibia: Journal of Geophysical Research, v. 118, p. 4378–4397, doi: 10 .1002 /jgrb .50258 .
Kinabo, B.D., Hogan, J.P., Atekwana, E.A., Abdelsalam, M.G., and Modisi, M.P., 2008, Fault growth and propagation during incipient continental rifting: Insights from a combined aeromagnetic and Shuttle Radar Topography Mission digital elevation model investigation of the Okavango Rift Zone, northwest Botswana: Tectonics, v. 27, TC3013, doi: 10 .1029 /2007TC002154 .
Leseane, K., Atekwana, E.A., Mickus, K.L., Abdelsalam, M.G., Shemang, E.M., and Atekwana, E.A., 2015, Thermal perturbations beneath the incipient Okavango Rift Zone, northwest Botswana: Journal of Geophysical Research, v. 120, p. 1210–1228, doi: 10 .1002 /2014JB011029 .
Malservisi, R., Hugentobler, U., Wonnacott, R., and Hackl, M., 2013, How rigid is a rigid plate? Geodetic constraint from the TrigNet CGPS network, South Africa: Geophysical Journal In-ternational, v. 192, p. 918–928, doi: 10 .1093 /gji /ggs081 .
Manatschal, G., Lavier, L., and Chenin, P., 2015, The role of inheritance in structuring hyper-extended rift systems: Some considerations based on observations and numerical model-ing: Gondwana Research, v. 27, p. 140–164, doi: 10 .1016 /j .gr .2014 .08 .006 .
McCourt, S., Armstrong, R.A., Jelsma, H., and Mapeo, R.B.M., 2013, New U-Pb SHRIMP ages from the Lubango region, SW Angola: Insights into the Palaeoproterozoic evolution of the Angolan Shield, southern Congo Craton, Africa: Journal of the Geological Society, v. 170, p. 353–363, doi: 10 .1144 /jgs2012 -059 .
Miensopust, M.P., Jones, A.G., Muller, M.R., Garcia, X., and Evans, R.L., 2011, Lithospheric struc-tures and Precambrian terrane boundaries in northeastern Botswana revealed through mag-netotelluric profiling as part of the Southern African Magnetotelluric Experiment: Journal of Geophysical Research, v. 116, B02401, doi: 10 .1029 /2010JB007740 .
Modisi, M.P., Atekwana, E.A., Kampunzu, A.B., and Ngwisanyi, T.H., 2000, Rift kinematics during the incipient stages of continental extension: Evidence from the nascent Okavango rift basin, northwest Botswana: Geology, v. 28, p. 939–942, doi: 10 .1130 /0091 -7613 (2000)28 <939: RKDTIS>2 .0 .CO;2 .
Moore, A.E., and Larkin, P.A., 2001, Drainage evolution in south-central Africa since the breakup of Gondwana: South African Journal of Geology, v. 104, p. 47–68, doi: 10 .2113 /104 .1 .47 .
Muller, M.R., Jones, A.G., Evans, R.L., Grütter, H.S., Hatton, C., Garcia, X., Hamilton, M.P., Mien-sopust, M.P., Cole, P., Ngwisanyi, T., and Hutchins, D., 2009, Lithospheric structure, evolution and diamond prospectivity of the Rehoboth Terrane and western Kaapvaal Craton, southern Africa: Constraints from broadband magnetotellurics: Lithos, v. 112, p. 93–105, doi: 10 .1016 /j .lithos .2009 .06 .023 .
Paige, C.C., and Saunders, M.A., 1982, LSQR: An algorithm for sparse linear equations and sparse least squares: ACM (Association for Computing Machinery) Transactions on Mathe-matical Software, v. 8, p. 43–71, doi: 10 .1145 /355984 .355989 .
Priestley, K., McKenzie, D., Debayle, E., and Pilidou, S., 2008, The African upper mantle and its relationship to tectonics and surface geology: Geophysical Journal International, v. 175, p. 1108–1126, doi: 10 .1111 /j .1365 -246X .2008 .03951 .x .
Reeves, C.V., 1972, Rifting in the Kalahari?: Nature, v. 237, p. 95–96, doi: 10 .1038 /237095a0 .Reeves, C.V., and Hutchins, D.G., 1975, Crustal structures in central southern Africa: Nature,
v. 254, p. 408–410, doi: 10 .1038 /254408a0 .Ringrose, S., Huntsman-Mapila, P., Kampunzu, A.B., Downey, W., Coetzee, S., Vink, B., Mathe-
son, W., and Vanderpost, C., 2005, Sedimentological and geochemical evidence for palaeo- environmental change in the Makgadikgadi subbasin, in relation to the MOZ rift depression, Botswana: Palaeogeography, Palaeoclimatology, Palaeoecology, v. 217, p. 265–287, doi: 10 .1016 /j .palaeo .2004 .11 .024 .
Ritsema, J., Ni, S., Helmberger, D.V., and Crotwell, H.P., 1998, Evidence for strong shear velocity reductions and velocity gradients in the lower mantle beneath Africa: Geophysical Research Letters, v. 25, p. 4245–4248, doi: 10 .1029 /1998GL900127 .
Scholz, C.H., Koczynski, T.A., and Hutchins, D.G., 1976, Evidence for incipient rifting in south-ern Africa: Geophysical Journal International, v. 44, p. 135–144, doi: 10 .1111 /j .1365 -246X .1976 .tb00278 .x .
Shankland, T.J., O’Connell, R.J., and Waff, H.S., 1981, Geophysical constraints on partial melt in the upper mantle: Reviews of Geophysics, v. 19, p. 394–406, doi: 10 .1029 /RG019i003p00394 .
Singletary, S.J., Hanson, R.E., Martin, M.W., Crowley, J.L., Bowring, S.A., Key, R.M., Ramokate, L.V., Direng, B.B., and Krol, M.A., 2003, Geochronology of basement rocks in the Kalahari Desert, Botswana, and implications for regional Proterozoic tectonics: Precambrian Re-search, v. 121, p. 47–71, doi: 10 .1016 /S0301 -9268 (02)00201 -2 .
White, R., and McKenzie, D., 1989, Magmatism at rift zones: The generation of volcanic continen-tal margins and flood basalts: Journal of Geophysical Research, v. 94, p. 7685–7729, doi: 10 .1029 /JB094iB06p07685 .
Yu, Y., Liu, K.H., Reed, C.A., Moidaki, M., Mickus, K., Atekwana, E.A., and Gao, S.S., 2015a, A joint receiver function and gravity study of crustal structure beneath the incipient Okavango Rift, Botswana: Geophysical Research Letters, v. 42, p. 8398–8405, doi: 10 .1002 /2015GL065811 .
Yu, Y., Liu, K.H., Moidaki, M., Reed, C.A., and Gao, S.S., 2015b, No thermal anomalies in the mantle transition zone beneath an incipient continental rift: Evidence from the first receiver function study across the Okavango Rift Zone, Botswana: Geophysical Journal International, v. 202, p. 1407–1418, doi: 10 .1093 /gji /ggv229 .
Yu, Y., Gao, S.S., Moidaki, M., Reed, C.A., and Liu, K.H., 2015c, Seismic anisotropy beneath the in-cipient Okavango rift: Implications for rifting initiation: Earth and Planetary Science Letters, v. 430, p. 1–8, doi: 10 .1016 /j .epsl .2015 .08 .009 .
Zhao, D., 2015, Multiscale Seismic Tomography: Tokyo, Springer Japan, 304 p.Zhao, D., and Hasegawa, A., 1993, P wave tomographic imaging of the crust and upper mantle
beneath the Japan islands: Journal of Geophysical Research, v. 98, p. 4333–4353, doi: 10 .1029 /92JB02295 .
Zhao, D., Hasegawa, A., and Horiuchi, S., 1992, Tomographic imaging of P and S wave velocity structure beneath northeastern Japan: Journal of Geophysical Research, v. 97, p. 19,909–19,928, doi: 10 .1029 /92JB00603 .
Zhao, D., Hasegawa, A., and Kanamori, H., 1994, Deep structure of Japan subduction zone as derived from local, regional, and teleseismic events: Journal of Geophysical Research, v. 99, p. 22,313–22,329, doi: 10 .1029 /94JB01149 .
Zhao, D., Lei, J., Inoue, T., Yamada, A., and Gao, S., 2006, Deep structure and origin of the Baikal rift zone: Earth and Planetary Science Letters, v. 243, p. 681–691, doi: 10 .1016 /j .epsl .2006 .01 .033 .
Ziegler, P.A., and Cloetingh, S., 2004, Dynamic processes controlling evolution of rifted basins: Earth-Science Reviews, v. 64, p. 1–50, doi: 10 .1016 /S0012 -8252 (03)00041 -2 .