Embed Size (px)
Citation preview
Page 1 of 13
M A N U A L F O R P R O GR A M M E M A N A G E M E N T B U D G E T ( P M B ) E X C E L T O O L – V E R S I O N 7
( J U N E 1 6 , 2 0 1 4 )
CONTENU
1. Introduction ........................................................................................................................................................2
2. The structure of the PMB tool ............................................................................................................................2
3. DATA ENTRY SHEETS ...........................................................................................................................................3
3.1. “Identification” Sheet .................................................................................................................................3
3.2. “PMB Entry FORM” sheet ...........................................................................................................................5
4. INFORMATION SHEET .........................................................................................................................................7
4.1. “Code of accounts” sheet ...........................................................................................................................7
5. PIVOT TABLES .....................................................................................................................................................8
5.1. “Pivot DETAIL PER YEAR” sheet ..................................................................................................................8
5.2. “Pivot DETAIL PER QUARTER” sheet ...........................................................................................................8
5.3. “Pivot SUMMARY” sheet ............................................................................................................................8
5.4. “Pivot RATIOS 1” sheet ...............................................................................................................................8
5.5. “Pivot RATIOS 2” sheet ...............................................................................................................................8
5.6. RATIOS 3 sheet ...........................................................................................................................................8
6. ANNEXES .............................................................................................................................................................9
ANNEX 1 –STATE AND REGION CODES ...................................................................................................................9
ANNEX 2 –LIST OF NGO CODES ..............................................................................................................................9
ANNEX 3 –LIST OF COLUMNS, LABELS AND FORMULAS IN PMB ........................................................................ 12
Page 2 of 13
1. INTRODUCTION
It was decided to extend the approach used for component 1 to all 3MDG components. Each IP proposal will comprise of two budgets: the Programme Management Budget (PMB) on the one hand (using the PMB Excel tool), and the Plan and budget for “field activities” on the other hand (using the CTHP Excel tool).
Both tools have been developed in a “database approach” which means that there is a clear separation between the raw data (entered by the user) and the reports/queries the managers want to draw. The numerous advantages of this approach notably include:
Drop-down lists for limited predefined list of options No formulas in the main Data Entry sheet No macros Automatic codification (using the Code of Accounts) The different reports/queries (pivot tables) are all generated based on the same data
source, which ensures consistency in figures Data can be automatically transferred from the Excel sheets to a database for the purpose
of consolidation, queries and reporting (data mining)
2. THE STRUCTURE OF THE PMB TOOL
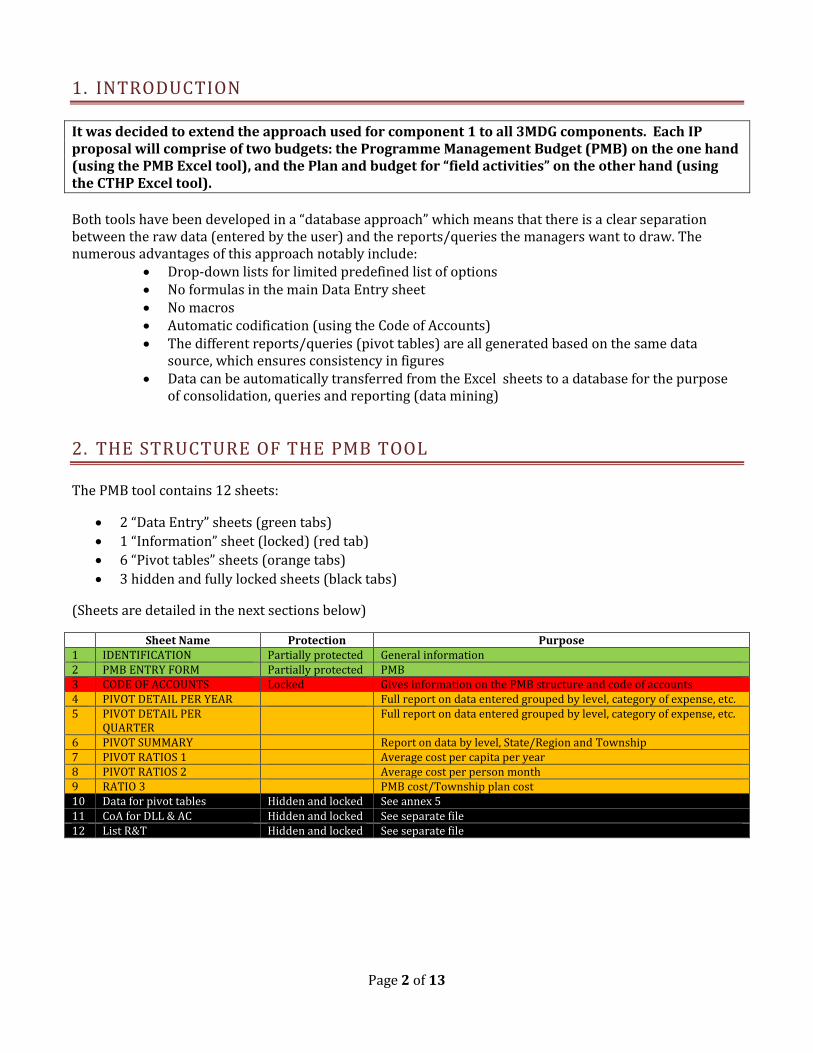
The PMB tool contains 12 sheets:
2 “Data Entry” sheets (green tabs)
1 “Information” sheet (locked) (red tab)
6 “Pivot tables” sheets (orange tabs)
3 hidden and fully locked sheets (black tabs)
(Sheets are detailed in the next sections below)
Sheet Name Protection Purpose 1 IDENTIFICATION Partially protected General information 2 PMB ENTRY FORM Partially protected PMB 3 CODE OF ACCOUNTS Locked Gives information on the PMB structure and code of accounts 4 PIVOT DETAIL PER YEAR Full report on data entered grouped by level, category of expense, etc. 5 PIVOT DETAIL PER
QUARTER Full report on data entered grouped by level, category of expense, etc.
6 PIVOT SUMMARY Report on data by level, State/Region and Township 7 PIVOT RATIOS 1 Average cost per capita per year 8 PIVOT RATIOS 2 Average cost per person month 9 RATIO 3 PMB cost/Township plan cost 10 Data for pivot tables Hidden and locked See annex 5 11 CoA for DLL & AC Hidden and locked See separate file 12 List R&T Hidden and locked See separate file
Page 3 of 13
3. DATA ENTRY SHEETS
3.1. “IDENTIFICATION” SHEET
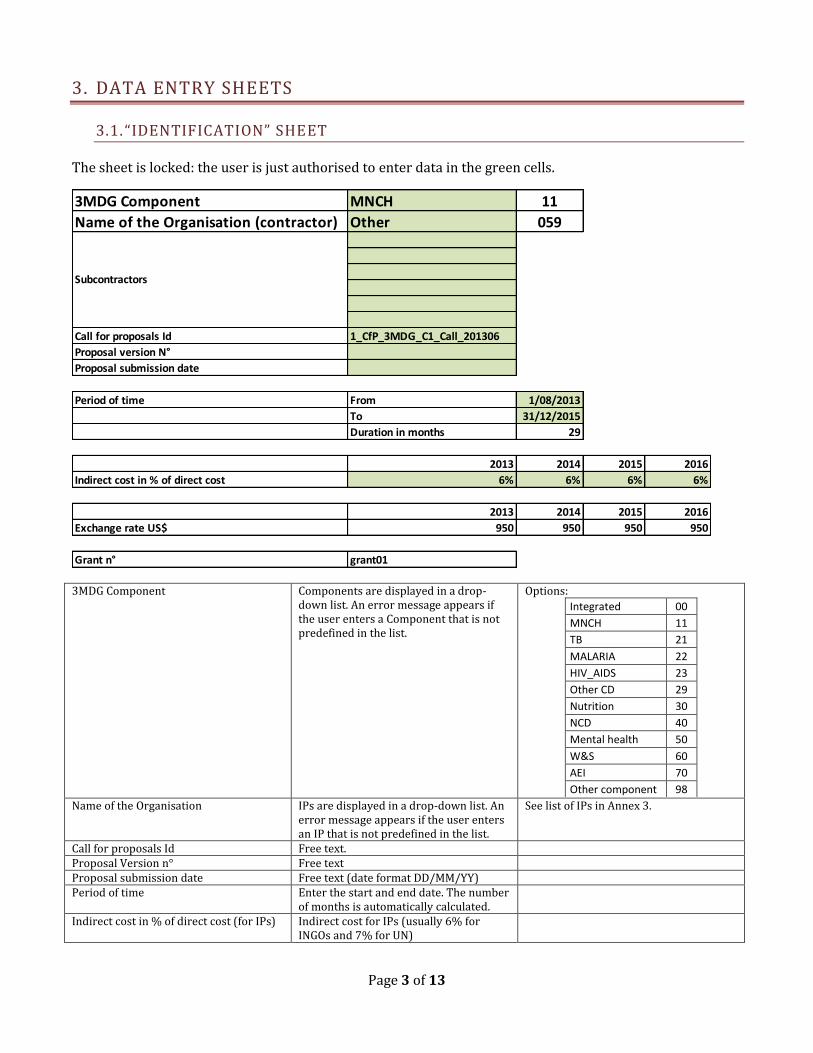
The sheet is locked: the user is just authorised to enter data in the green cells.
3MDG Component Components are displayed in a drop-down list. An error message appears if the user enters a Component that is not predefined in the list.
Options:
Integrated 00
MNCH 11
TB 21
MALARIA 22
HIV_AIDS 23
Other CD 29
Nutrition 30
NCD 40
Mental health 50
W&S 60
AEI 70
Other component 98
Name of the Organisation IPs are displayed in a drop-down list. An error message appears if the user enters an IP that is not predefined in the list.
See list of IPs in Annex 3.
Call for proposals Id Free text. Proposal Version n° Free text Proposal submission date Free text (date format DD/MM/YY) Period of time Enter the start and end date. The number
of months is automatically calculated.
Indirect cost in % of direct cost (for IPs) Indirect cost for IPs (usually 6% for INGOs and 7% for UN)
3MDG Component MNCH 11
Name of the Organisation (contractor) Other 059
Call for proposals Id 1_CfP_3MDG_C1_Call_201306
Proposal version N°
Proposal submission date
Subcontractors
Period of time From 1/08/2013
To 31/12/2015
Duration in months 29
2013 2014 2015 2016
Indirect cost in % of direct cost 6% 6% 6% 6%
2013 2014 2015 2016
Exchange rate US$ 950 950 950 950
Grant n° grant01
Page 4 of 13
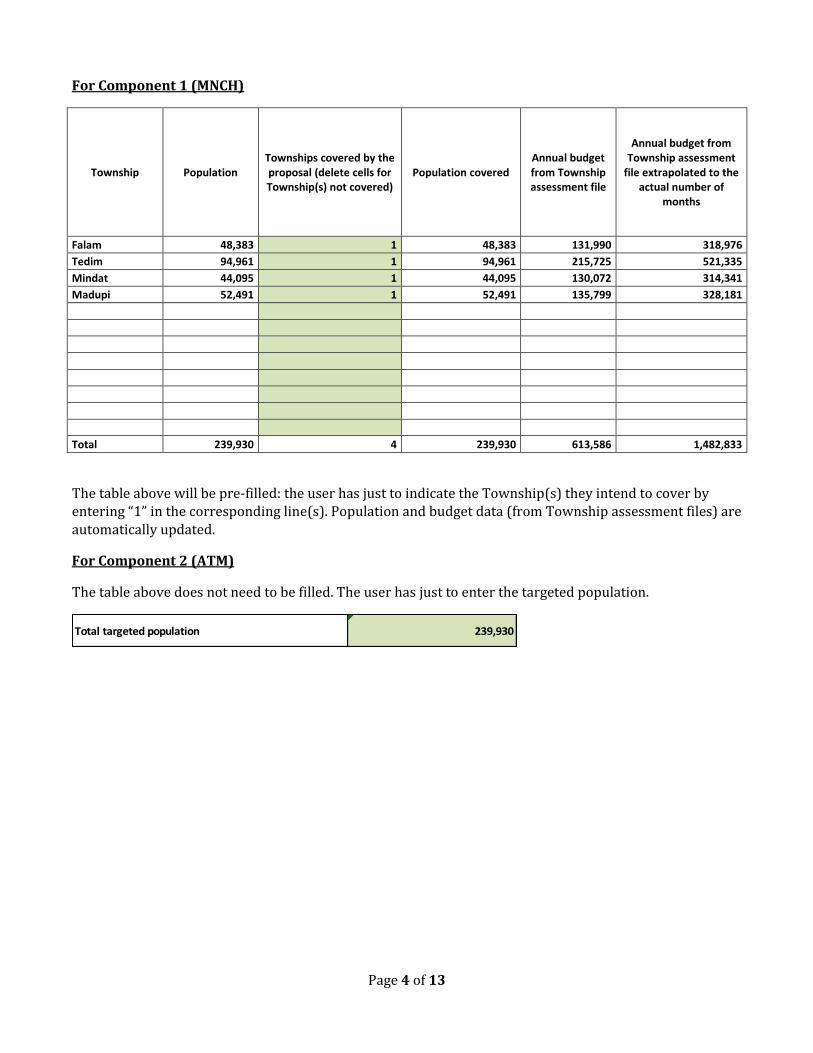
For Component 1 (MNCH)
Township Population Townships covered by the proposal (delete cells for Township(s) not covered)
Population covered Annual budget from Township assessment file
Annual budget from Township assessment
file extrapolated to the actual number of
months
Falam 48,383 1 48,383 131,990 318,976
Tedim 94,961 1 94,961 215,725 521,335
Mindat 44,095 1 44,095 130,072 314,341
Madupi 52,491 1 52,491 135,799 328,181
Total 239,930 4 239,930 613,586 1,482,833
The table above will be pre-filled: the user has just to indicate the Township(s) they intend to cover by entering “1” in the corresponding line(s). Population and budget data (from Township assessment files) are automatically updated.
For Component 2 (ATM)
The table above does not need to be filled. The user has just to enter the targeted population.
Total targeted population 239,930
Page 5 of 13
3.2. “PMB ENTRY FORM” SHEET
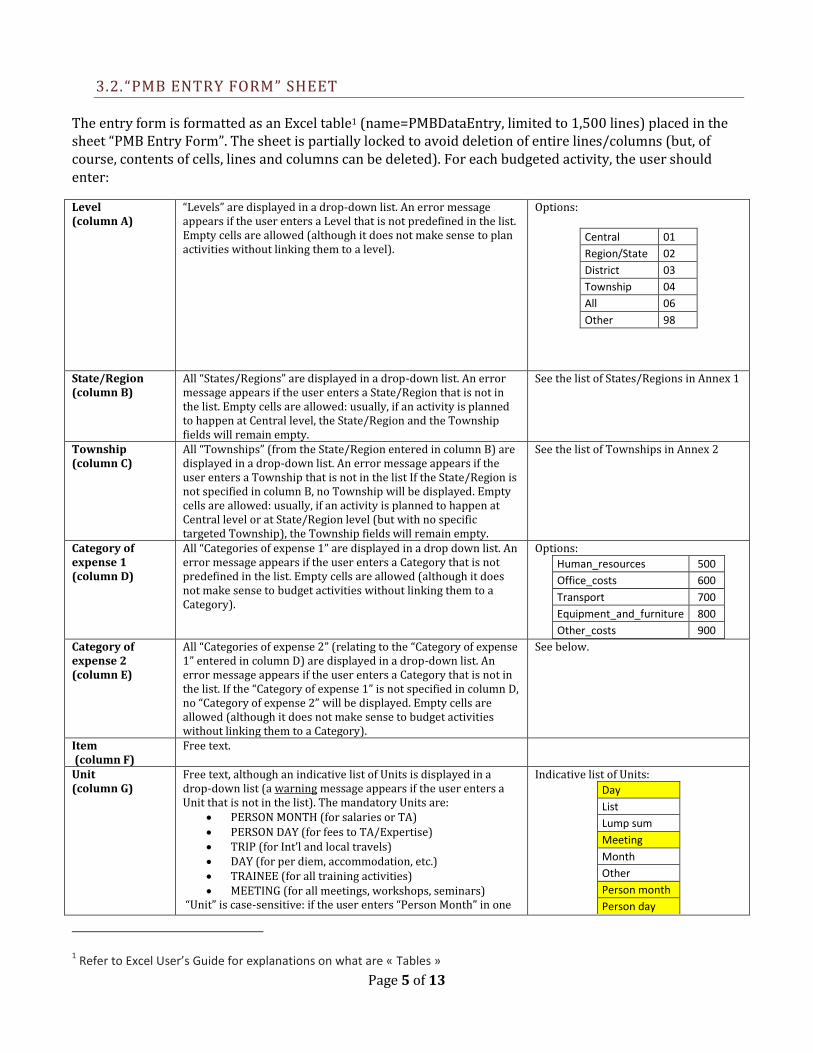
The entry form is formatted as an Excel table1 (name=PMBDataEntry, limited to 1,500 lines) placed in the sheet “PMB Entry Form”. The sheet is partially locked to avoid deletion of entire lines/columns (but, of course, contents of cells, lines and columns can be deleted). For each budgeted activity, the user should enter:
Level (column A)
“Levels” are displayed in a drop-down list. An error message appears if the user enters a Level that is not predefined in the list. Empty cells are allowed (although it does not make sense to plan activities without linking them to a level).
Options:
Central 01
Region/State 02
District 03
Township 04
All 06
Other 98
State/Region (column B)
All “States/Regions” are displayed in a drop-down list. An error message appears if the user enters a State/Region that is not in the list. Empty cells are allowed: usually, if an activity is planned to happen at Central level, the State/Region and the Township fields will remain empty.
See the list of States/Regions in Annex 1
Township (column C)
All “Townships” (from the State/Region entered in column B) are displayed in a drop-down list. An error message appears if the user enters a Township that is not in the list If the State/Region is not specified in column B, no Township will be displayed. Empty cells are allowed: usually, if an activity is planned to happen at Central level or at State/Region level (but with no specific targeted Township), the Township fields will remain empty.
See the list of Townships in Annex 2
Category of expense 1 (column D)
All “Categories of expense 1” are displayed in a drop down list. An error message appears if the user enters a Category that is not predefined in the list. Empty cells are allowed (although it does not make sense to budget activities without linking them to a Category).
Options:
Human_resources 500
Office_costs 600
Transport 700
Equipment_and_furniture 800
Other_costs 900
Category of expense 2 (column E)
All “Categories of expense 2” (relating to the “Category of expense 1” entered in column D) are displayed in a drop-down list. An error message appears if the user enters a Category that is not in the list. If the “Category of expense 1” is not specified in column D, no “Category of expense 2” will be displayed. Empty cells are allowed (although it does not make sense to budget activities without linking them to a Category).
See below.
Item (column F)
Free text.
Unit (column G)
Free text, although an indicative list of Units is displayed in a drop-down list (a warning message appears if the user enters a Unit that is not in the list). The mandatory Units are:
PERSON MONTH (for salaries or TA) PERSON DAY (for fees to TA/Expertise) TRIP (for Int’l and local travels) DAY (for per diem, accommodation, etc.) TRAINEE (for all training activities) MEETING (for all meetings, workshops, seminars)
“Unit” is case-sensitive: if the user enters “Person Month” in one
Indicative list of Units:
Day
List
Lump sum
Meeting
Month
Other
Person month
Person day
1 Refer to Excel User’s Guide for explanations on what are « Tables »
Page 6 of 13
line and “person month” in other lines, the Pivot Tables will display 2 different groups.
Quarter
Workshop
Trainee
Trip
Village
Year
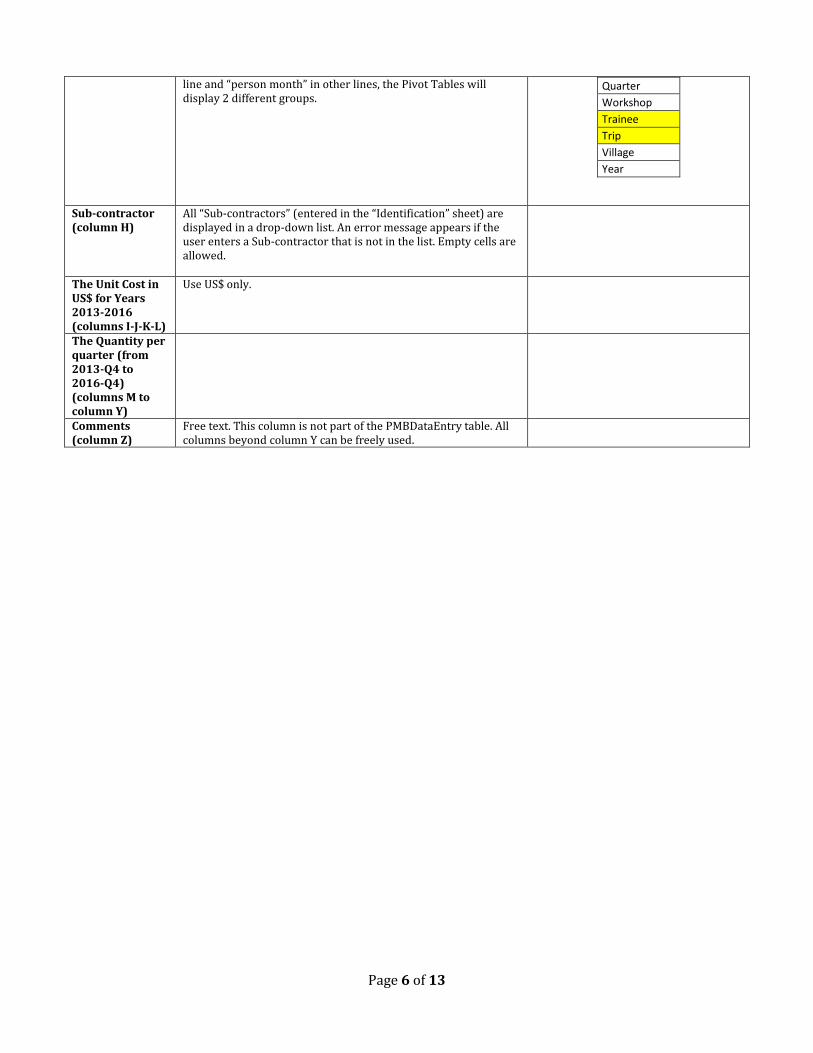
Sub-contractor (column H)
All “Sub-contractors” (entered in the “Identification” sheet) are displayed in a drop-down list. An error message appears if the user enters a Sub-contractor that is not in the list. Empty cells are allowed.
The Unit Cost in US$ for Years 2013-2016 (columns I-J-K-L)
Use US$ only.
The Quantity per quarter (from 2013-Q4 to 2016-Q4) (columns M to column Y)
Comments (column Z)
Free text. This column is not part of the PMBDataEntry table. All columns beyond column Y can be freely used.
Page 7 of 13
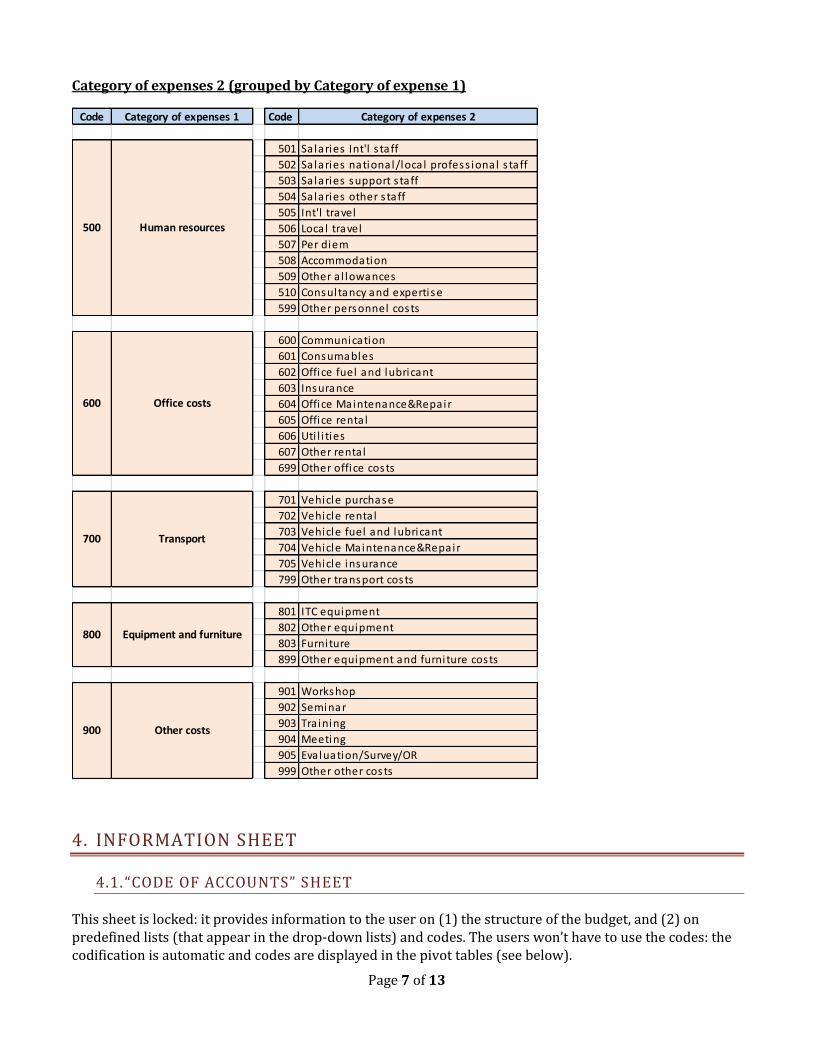
Category of expenses 2 (grouped by Category of expense 1)
4. INFORMATION SHEET
4.1. “CODE OF ACCOUNTS” SHEET
This sheet is locked: it provides information to the user on (1) the structure of the budget, and (2) on predefined lists (that appear in the drop-down lists) and codes. The users won’t have to use the codes: the codification is automatic and codes are displayed in the pivot tables (see below).
Code Category of expenses 1 Code Category of expenses 2
501 Salaries Int'l s taff
502 Salaries national/loca l profess ional s taff
503 Salaries support s taff
504 Salaries other s taff
505 Int'l travel
506 Local travel
507 Per diem
508 Accommodation
509 Other a l lowances
510 Consultancy and expertise
599 Other personnel costs
600 Communication
601 Consumables
602 Office fuel and lubricant
603 Insurance
604 Office Maintenance&Repair
605 Office rental
606 Uti l i ties
607 Other rental
699 Other office costs
701 Vehicle purchase
702 Vehicle rental
703 Vehicle fuel and lubricant
704 Vehicle Maintenance&Repair
705 Vehicle insurance
799 Other transport costs
801 ITC equipment
802 Other equipment
803 Furniture
899 Other equipment and furniture costs
901 Workshop
902 Seminar
903 Tra ining
904 Meeting
905 Evaluation/Survey/OR
999 Other other costs
Human resources
Transport
600 Office costs
Equipment and furniture
Other costs
500
700
800
900
Page 8 of 13
5. PIVOT TABLES
Five pivot tables2 are pre-defined in the tool. Pivot tables are used to transform raw data (from the PMBEntry Form) into structured reports. Users can add as many more pivot tables as they consider necessary (see annex 4 for the list of fields that can be used to create pivot tables).
5.1. “PIVOT DETAIL PER YEAR” SHEET
This pivot table displays the data entered in the PMBntryForm broken down by Level, Regions/State, Township, Category of expense 1, Category of expense 2, and Item with annual quantity and value (US$) – Indirect cost, direct cost and total cost.
5.2. “PIVOT DETAIL PER QUARTER” SHEET
This pivot table displays the data entered in the PMBntryForm broken down by Level, Regions/State, Township, Category of expense 1, Category of expense 2, and Item with quarter quantity and value (US$) –direct cost only.
5.3. “PIVOT SUMMARY” SHEET
This pivot table displays the data entered in the CTHPEntryForm broken down by Level, Regions/State, Township, Category of expense 1, Category of expense 2, with total quantity and value (US$) – Indirect cost, direct cost and total cost.
5.4. “PIVOT RATIOS 1” SHEET
This pivot table displays the data entered in the CTHPEntryForm broken down by Level, Regions/State, and Township with total cost (US$) and cost per capita per year.
5.5. “PIVOT RATIOS 2” SHEET
This pivot table displays the data entered in the CTHPEntryForm broken down by Level, Regions/State, and Township with total quantity of “Person month” and average cost of “Person month”.
5.6. RATIOS 3 SHEET
Actually this is not a pivot table but just two ratios:
Total PMB cost divided by Total Township plan cost (from Township assessment files – “Identification” sheet).
Total PMB cost divided by (Total Township plan cost + Total PMB cost)
2 We refer the users to the MSEXCEL guidelines and User’s Manual for more explanation on how to create and use « pivot
tables ».
Page 9 of 13
6. ANNEXES
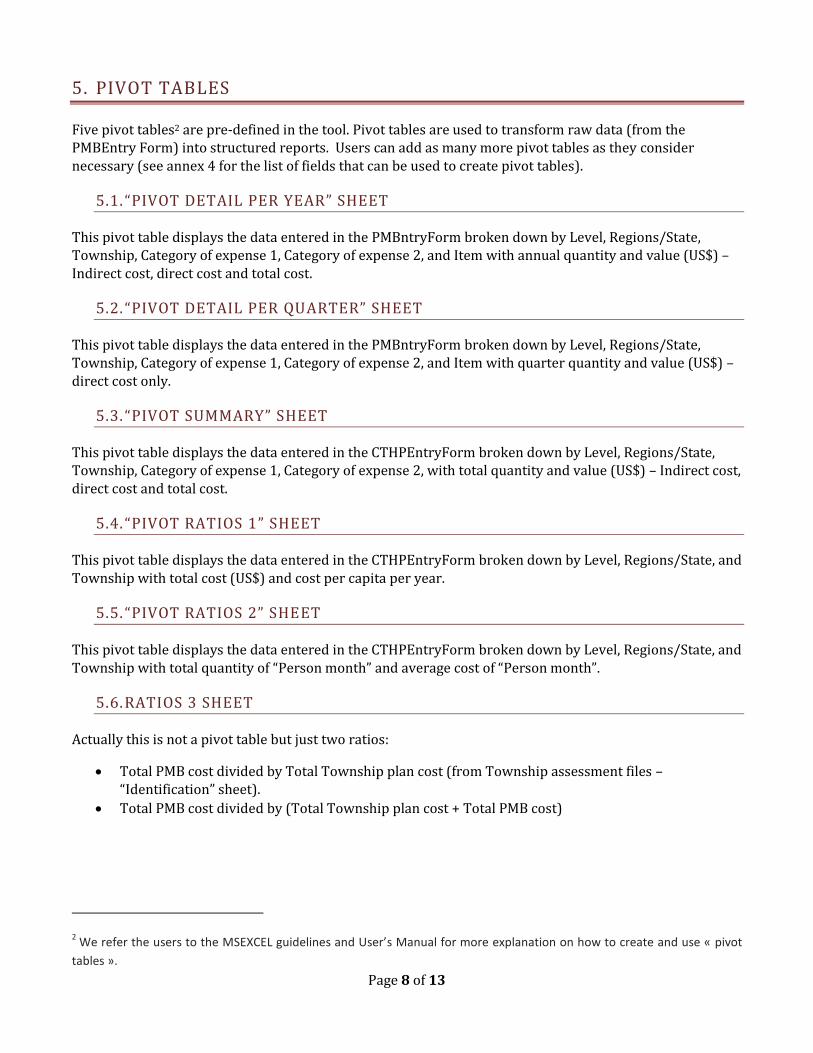
ANNEX 1 –STATE AND REGION CODES
State/Regions Code
Ayeyarwady 017
Bago_East 007
Bago_West 008
Chin 004
Kachin 001
Kayah 002
Kayin 003
Magway 009
Mandalay 010
Mon 011
Rakhine 012
Sagaing 005
Shan_East 016
Shan_North 015
Shan_South 014
Tanintharyi 006
Yangon 013
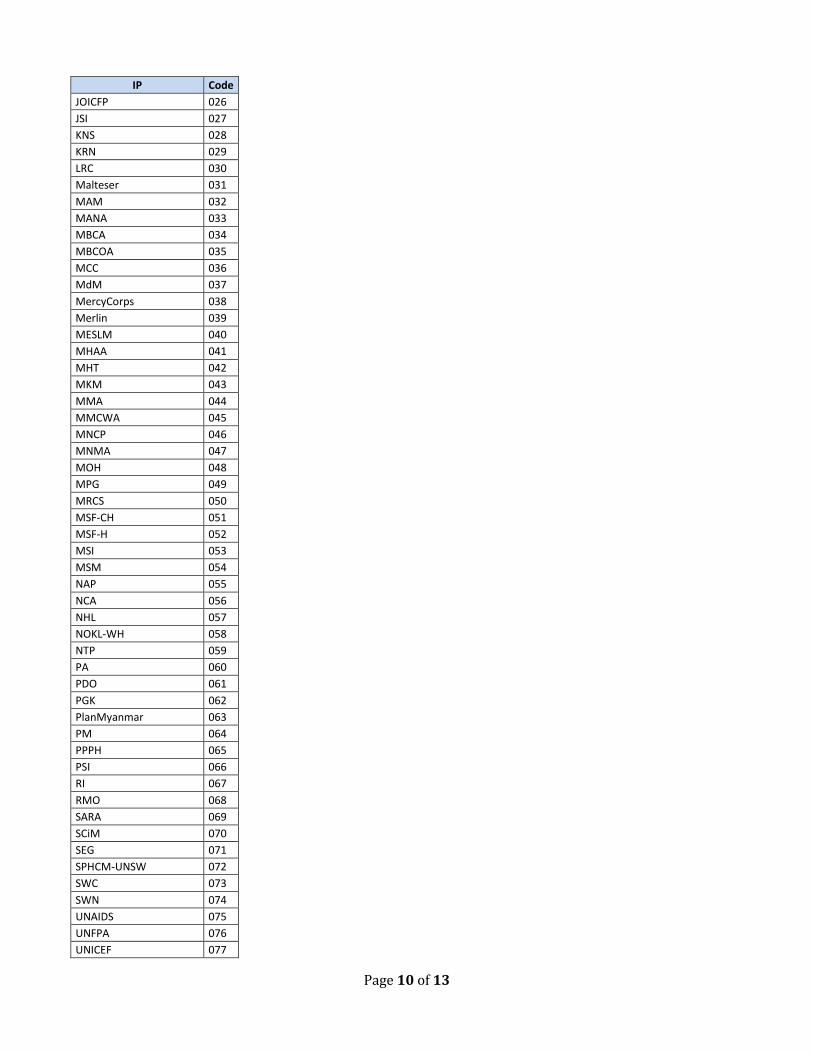
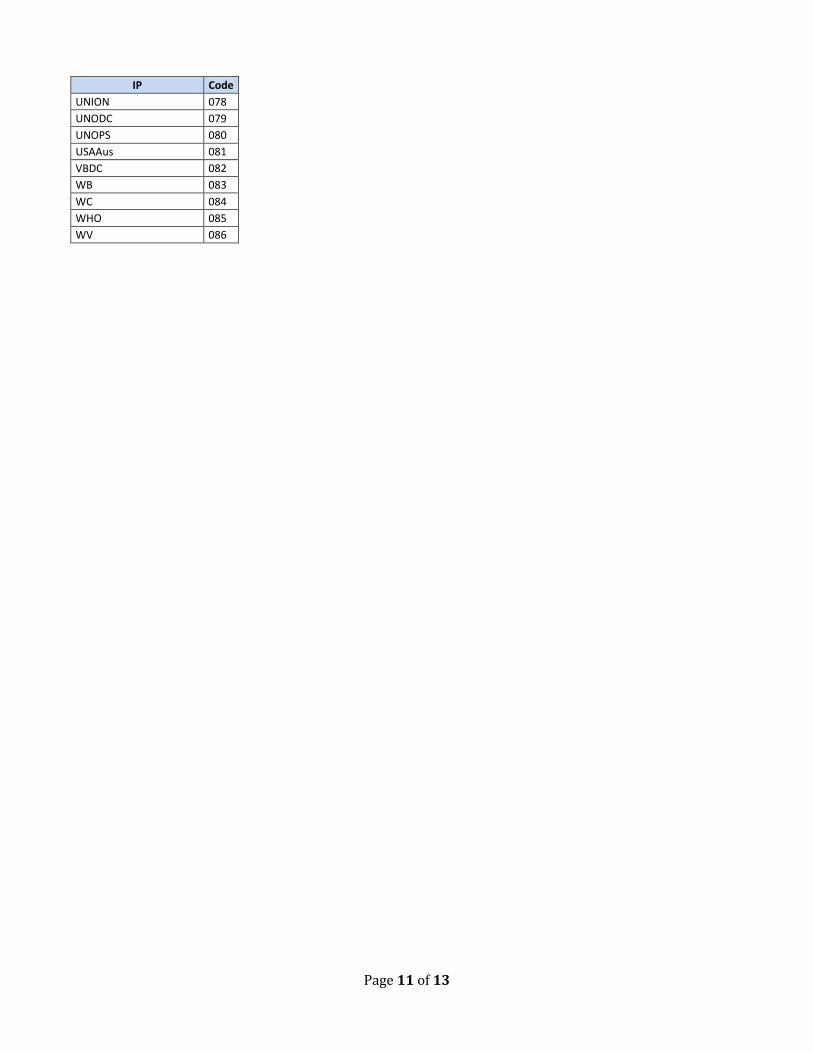
ANNEX 2 –LIST OF NGO CODES
IP Code
AFXB 001
AHRN 002
Alliance 003
AMI 004
ASG 005
AusAID 006
BI-MM 007
BS 008
CARE 009
CDA 010
CESVI 011
ChristianAid 012
CMSD 013
Consortium 014
CWS 015
DMIA 016
DRC 017
FL 018
GMS 019
GRET 020
HELP 021
HKI 022
HLHS 023
IDU 024
IOM 025
Page 10 of 13
IP Code
JOICFP 026
JSI 027
KNS 028
KRN 029
LRC 030
Malteser 031
MAM 032
MANA 033
MBCA 034
MBCOA 035
MCC 036
MdM 037
MercyCorps 038
Merlin 039
MESLM 040
MHAA 041
MHT 042
MKM 043
MMA 044
MMCWA 045
MNCP 046
MNMA 047
MOH 048
MPG 049
MRCS 050
MSF-CH 051
MSF-H 052
MSI 053
MSM 054
NAP 055
NCA 056
NHL 057
NOKL-WH 058
NTP 059
PA 060
PDO 061
PGK 062
PlanMyanmar 063
PM 064
PPPH 065
PSI 066
RI 067
RMO 068
SARA 069
SCiM 070
SEG 071
SPHCM-UNSW 072
SWC 073
SWN 074
UNAIDS 075
UNFPA 076
UNICEF 077
Page 11 of 13
IP Code
UNION 078
UNODC 079
UNOPS 080
USAAus 081
VBDC 082
WB 083
WC 084
WHO 085
WV 086
Page 12 of 13
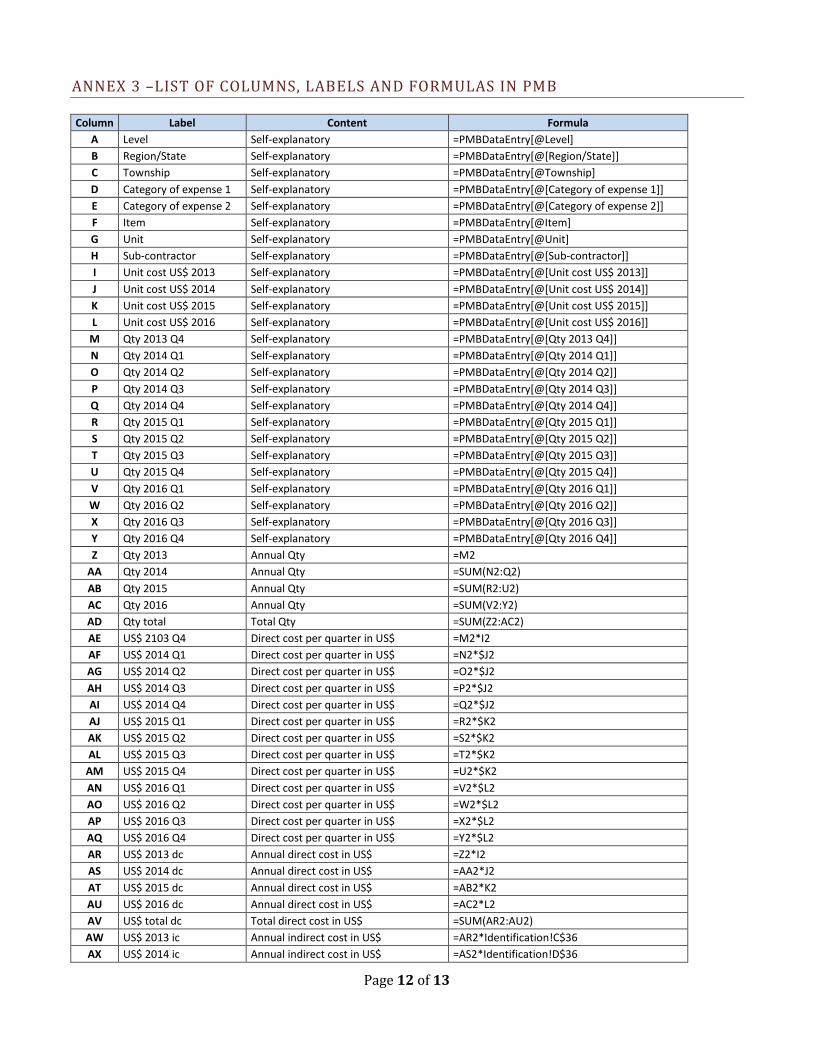
ANNEX 3 –LIST OF COLUMNS, LABELS AND FORMULAS IN PMB
Column Label Content Formula
A Level Self-explanatory =PMBDataEntry[@Level]
B Region/State Self-explanatory =PMBDataEntry[@[Region/State]]
C Township Self-explanatory =PMBDataEntry[@Township]
D Category of expense 1 Self-explanatory =PMBDataEntry[@[Category of expense 1]]
E Category of expense 2 Self-explanatory =PMBDataEntry[@[Category of expense 2]]
F Item Self-explanatory =PMBDataEntry[@Item]
G Unit Self-explanatory =PMBDataEntry[@Unit]
H Sub-contractor Self-explanatory =PMBDataEntry[@[Sub-contractor]]
I Unit cost US$ 2013 Self-explanatory =PMBDataEntry[@[Unit cost US$ 2013]]
J Unit cost US$ 2014 Self-explanatory =PMBDataEntry[@[Unit cost US$ 2014]]
K Unit cost US$ 2015 Self-explanatory =PMBDataEntry[@[Unit cost US$ 2015]]
L Unit cost US$ 2016 Self-explanatory =PMBDataEntry[@[Unit cost US$ 2016]]
M Qty 2013 Q4 Self-explanatory =PMBDataEntry[@[Qty 2013 Q4]]
N Qty 2014 Q1 Self-explanatory =PMBDataEntry[@[Qty 2014 Q1]]
O Qty 2014 Q2 Self-explanatory =PMBDataEntry[@[Qty 2014 Q2]]
P Qty 2014 Q3 Self-explanatory =PMBDataEntry[@[Qty 2014 Q3]]
Q Qty 2014 Q4 Self-explanatory =PMBDataEntry[@[Qty 2014 Q4]]
R Qty 2015 Q1 Self-explanatory =PMBDataEntry[@[Qty 2015 Q1]]
S Qty 2015 Q2 Self-explanatory =PMBDataEntry[@[Qty 2015 Q2]]
T Qty 2015 Q3 Self-explanatory =PMBDataEntry[@[Qty 2015 Q3]]
U Qty 2015 Q4 Self-explanatory =PMBDataEntry[@[Qty 2015 Q4]]
V Qty 2016 Q1 Self-explanatory =PMBDataEntry[@[Qty 2016 Q1]]
W Qty 2016 Q2 Self-explanatory =PMBDataEntry[@[Qty 2016 Q2]]
X Qty 2016 Q3 Self-explanatory =PMBDataEntry[@[Qty 2016 Q3]]
Y Qty 2016 Q4 Self-explanatory =PMBDataEntry[@[Qty 2016 Q4]]
Z Qty 2013 Annual Qty =M2
AA Qty 2014 Annual Qty =SUM(N2:Q2)
AB Qty 2015 Annual Qty =SUM(R2:U2)
AC Qty 2016 Annual Qty =SUM(V2:Y2)
AD Qty total Total Qty =SUM(Z2:AC2)
AE US$ 2103 Q4 Direct cost per quarter in US$ =M2*I2
AF US$ 2014 Q1 Direct cost per quarter in US$ =N2*$J2
AG US$ 2014 Q2 Direct cost per quarter in US$ =O2*$J2
AH US$ 2014 Q3 Direct cost per quarter in US$ =P2*$J2
AI US$ 2014 Q4 Direct cost per quarter in US$ =Q2*$J2
AJ US$ 2015 Q1 Direct cost per quarter in US$ =R2*$K2
AK US$ 2015 Q2 Direct cost per quarter in US$ =S2*$K2
AL US$ 2015 Q3 Direct cost per quarter in US$ =T2*$K2
AM US$ 2015 Q4 Direct cost per quarter in US$ =U2*$K2
AN US$ 2016 Q1 Direct cost per quarter in US$ =V2*$L2
AO US$ 2016 Q2 Direct cost per quarter in US$ =W2*$L2
AP US$ 2016 Q3 Direct cost per quarter in US$ =X2*$L2
AQ US$ 2016 Q4 Direct cost per quarter in US$ =Y2*$L2
AR US$ 2013 dc Annual direct cost in US$ =Z2*I2
AS US$ 2014 dc Annual direct cost in US$ =AA2*J2
AT US$ 2015 dc Annual direct cost in US$ =AB2*K2
AU US$ 2016 dc Annual direct cost in US$ =AC2*L2
AV US$ total dc Total direct cost in US$ =SUM(AR2:AU2)
AW US$ 2013 ic Annual indirect cost in US$ =AR2*Identification!C$36
AX US$ 2014 ic Annual indirect cost in US$ =AS2*Identification!D$36
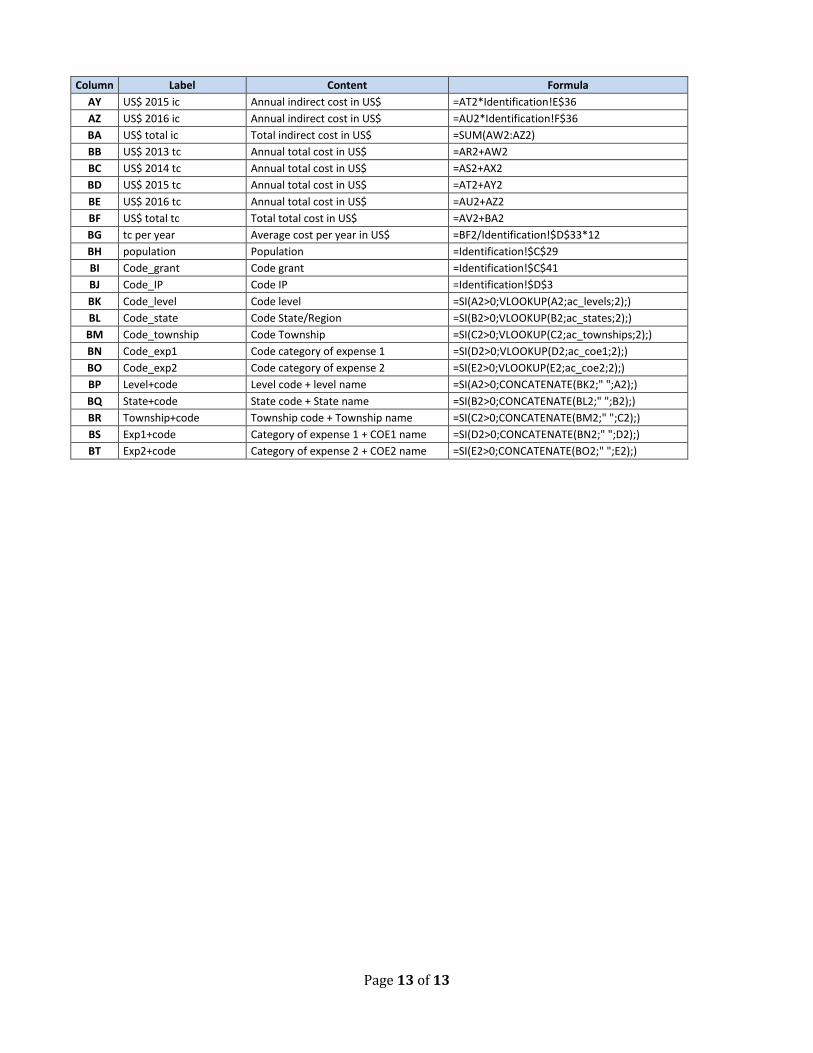
Page 13 of 13
Column Label Content Formula
AY US$ 2015 ic Annual indirect cost in US$ =AT2*Identification!E$36
AZ US$ 2016 ic Annual indirect cost in US$ =AU2*Identification!F$36
BA US$ total ic Total indirect cost in US$ =SUM(AW2:AZ2)
BB US$ 2013 tc Annual total cost in US$ =AR2+AW2
BC US$ 2014 tc Annual total cost in US$ =AS2+AX2
BD US$ 2015 tc Annual total cost in US$ =AT2+AY2
BE US$ 2016 tc Annual total cost in US$ =AU2+AZ2
BF US$ total tc Total total cost in US$ =AV2+BA2
BG tc per year Average cost per year in US$ =BF2/Identification!$D$33*12
BH population Population =Identification!$C$29
BI Code_grant Code grant =Identification!$C$41
BJ Code_IP Code IP =Identification!$D$3
BK Code_level Code level =SI(A2>0;VLOOKUP(A2;ac_levels;2);)
BL Code_state Code State/Region =SI(B2>0;VLOOKUP(B2;ac_states;2);)
BM Code_township Code Township =SI(C2>0;VLOOKUP(C2;ac_townships;2);)
BN Code_exp1 Code category of expense 1 =SI(D2>0;VLOOKUP(D2;ac_coe1;2);)
BO Code_exp2 Code category of expense 2 =SI(E2>0;VLOOKUP(E2;ac_coe2;2);)
BP Level+code Level code + level name =SI(A2>0;CONCATENATE(BK2;" ";A2);)
BQ State+code State code + State name =SI(B2>0;CONCATENATE(BL2;" ";B2);)
BR Township+code Township code + Township name =SI(C2>0;CONCATENATE(BM2;" ";C2);)
BS Exp1+code Category of expense 1 + COE1 name =SI(D2>0;CONCATENATE(BN2;" ";D2);)
BT Exp2+code Category of expense 2 + COE2 name =SI(E2>0;CONCATENATE(BO2;" ";E2);)