Embed Size (px)
Citation preview
DEMONSTRATION ROTORKIT LONG BASE
MANUAL and WORKBOOK
DEMONSTRATION ROTOR WORKBOOK Sales Technology, Inc. 2911 South Shore Blvd., Ste. 170 League City, TX 77573 TEL: (281) 334-0766 FAX: (281) 334-4255
TABLE OF CONTENTS
A. Demonstration Rotor Description
B. Test Measurement Instrumentation
1. DC Voltmeter 2. Oscilloscope 3. FFT Analyzer
C. Demonstration Topics
1. Single Proximity Transducer
a. Calibration b. DC Gap Voltage c. Shaft Relative Measurements d. Vibration Signals
2. Dual Proximity Transducer
a. Shaft Centerline b. Orbits c. Phase Relationships
3. Phase Transducer
a. Phase Signal Descriptions b. Phase Measurements with Single Transducer c. Phase Measurements with Dual Transducer (Time Based) d. Phase Measurements with Dual Transducers (Orbits) e. Rotor Speed
4. Instrumentation Conventions
a. Transducer Orientations b. Oscilloscope Presentations c. Transducer Operating Conventions
5. Speed Transducer
a. Installation b. Speed Signal Descriptions
6. Critical Speeds - Single Mass Rotor
a. Identification Using Vibration Signals b. Identification Using Phase Signals c. Amplification Factor Using Orbits d. Bode' Plot Usage e. Polar Plot Usage
7. Critical Speeds - Dual Mass Rotor
a. Identification Using Vibration Signals b. Identification Using Phase Signals c. Amplification Factor Using Orbits d. Bode' Plot Usage e. Polar Plot Usage
8. Rotor Bow
a. Time Based Measurements b. Frequency Based Measurements
9. Rotor Rubbing
a. Time Based Measurements b. Frequency Based Measurements
10. Anti-friction Bearing
a. Calculating Bearing Frequencies b. Time Based Measurements c. Frequency Based Measurements
11. Balancing
a. One Plane Under Critical Speed b. One Plane Above Critical Speed c. Two Plane Under Critical Speed d. Two Plane Above Critical Speed
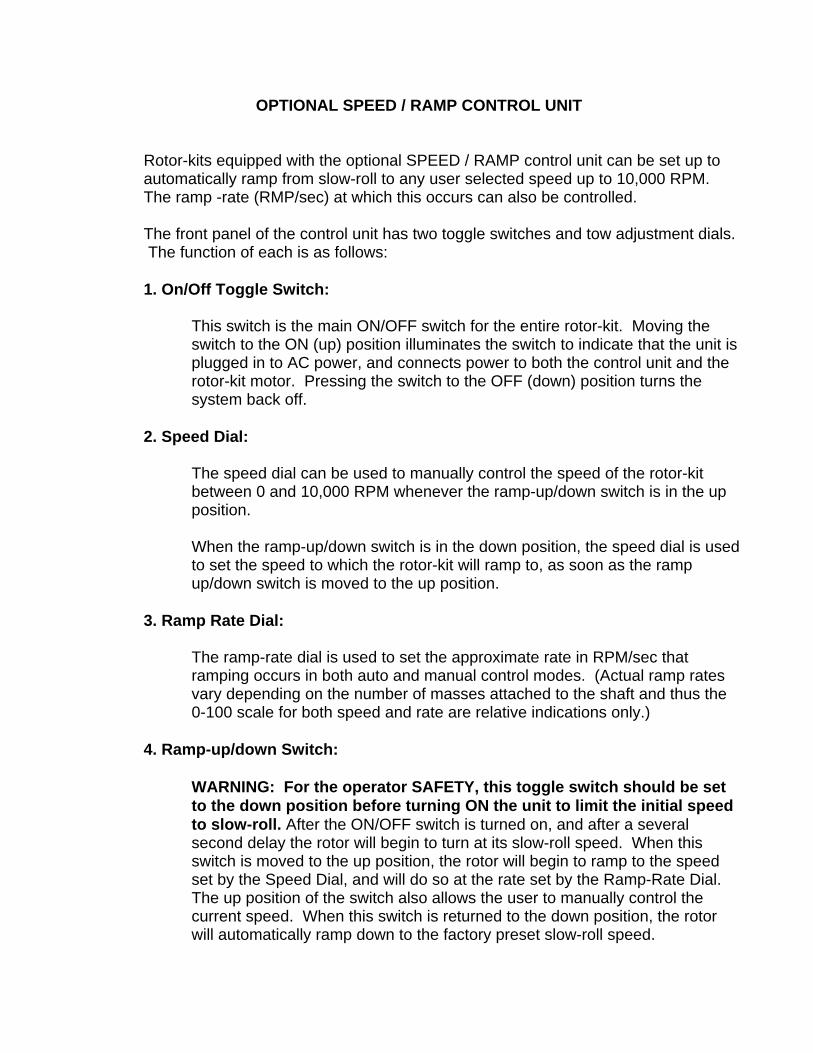
OPTIONAL SPEED / RAMP CONTROL UNIT
Rotor-kits equipped with the optional SPEED / RAMP control unit can be set up to automatically ramp from slow-roll to any user selected speed up to 10,000 RPM. The ramp -rate (RMP/sec) at which this occurs can also be controlled.
The front panel of the control unit has two toggle switches and tow adjustment dials. The function of each is as follows:
1. On/Off Toggle Switch:
This switch is the main ON/OFF switch for the entire rotor-kit. Moving the switch to the ON (up) position illuminates the switch to indicate that the unit is plugged in to AC power, and connects power to both the control unit and the rotor-kit motor. Pressing the switch to the OFF (down) position turns the system back off.
2. Speed Dial:
The speed dial can be used to manually control the speed of the rotor-kit between 0 and 10,000 RPM whenever the ramp-up/down switch is in the up position.
When the ramp-up/down switch is in the down position, the speed dial is used to set the speed to which the rotor-kit will ramp to, as soon as the ramp up/down switch is moved to the up position.
3. Ramp Rate Dial:
The ramp-rate dial is used to set the approximate rate in RPM/sec that ramping occurs in both auto and manual control modes. (Actual ramp rates vary depending on the number of masses attached to the shaft and thus the 0-100 scale for both speed and rate are relative indications only.)
4. Ramp-up/down Switch:
WARNING: For the operator SAFETY, this toggle switch should be set to the down position before turning ON the unit to limit the initial speed to slow-roll. After the ON/OFF switch is turned on, and after a several second delay the rotor will begin to turn at its slow-roll speed. When this switch is moved to the up position, the rotor will begin to ramp to the speed set by the Speed Dial, and will do so at the rate set by the Ramp-Rate Dial. The up position of the switch also allows the user to manually control the current speed. When this switch is returned to the down position, the rotor will automatically ramp down to the factory preset slow-roll speed.

The rear panel of the control unit has two cords that exit from either side. The cord on the same side as the ON/OFF switch is the AC power cable. This cord plugs into a standard 115/120 Volt AC wall outlet, or the 120 Volt AC outlet side of the step-down transformer supplied with systems ordered with the 220/230 Volt AC power option.
The cord on the opposite side is the motor interface cable. This cord mates only with the integral motordrive cable.
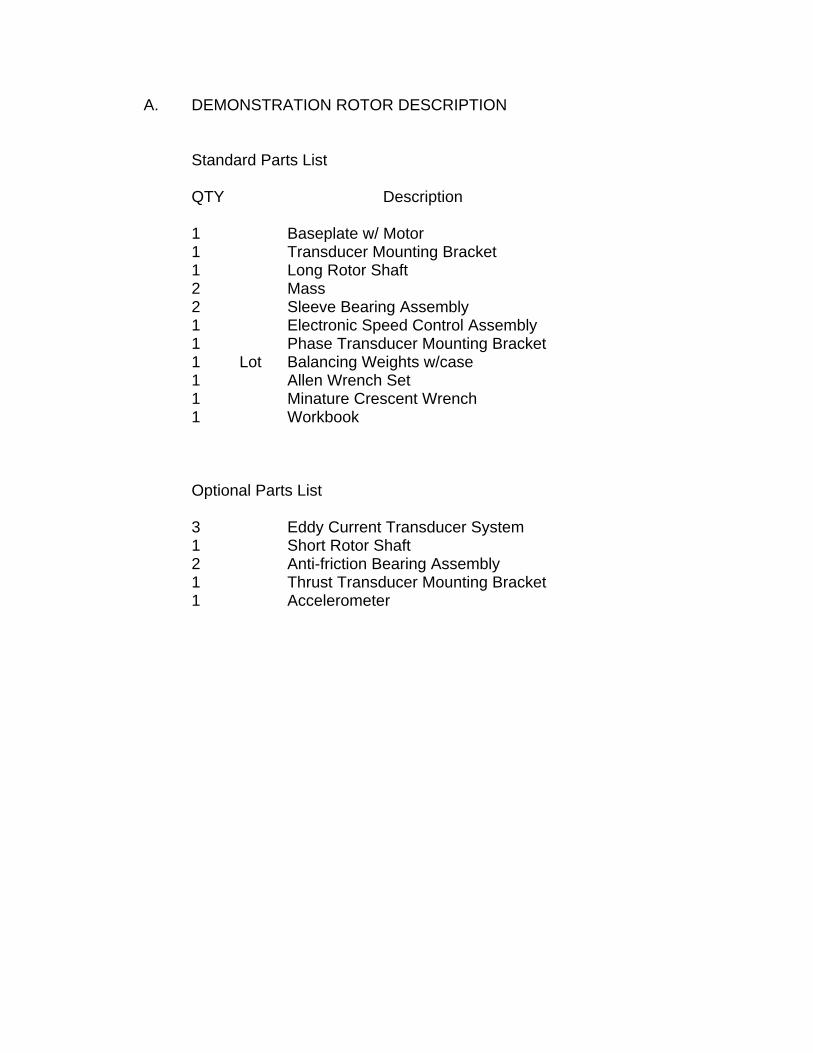
A. DEMONSTRATION ROTOR DESCRIPTION
Standard Parts List
QTY Description
1 Baseplate w/ Motor 1 Transducer Mounting Bracket 1 Long Rotor Shaft 2 Mass 2 Sleeve Bearing Assembly 1 Electronic Speed Control Assembly 1 Phase Transducer Mounting Bracket 1 Lot Balancing Weights w/case 1 Allen Wrench Set 1 Minature Crescent Wrench 1 Workbook
Optional Parts List
3 Eddy Current Transducer System 1 Short Rotor Shaft 2 Anti-friction Bearing Assembly 1 Thrust Transducer Mounting Bracket 1 Accelerometer
B. TEST MEASUREMENT INSTRUMENTATION
In addition to the supplied transducer systems specific test instrumentation will be utilized for complete demonstration purposes. Although many of these functions are incorporated into vibration monitoring systems the monitoring systems may not be available during training demonstrations. Specific test measurement instrumentation described and utilized for these demonstrations include DC Voltmeter, Oscilloscope, and FFT Analyzer.
1. DC Voltmeter: Fluke Model 77 or equivalent.
2. Oscilloscope, Dual Channel: Tektronix Model 5110 or equivalent.
3. FFT Analyzer: HP 3582 or equivalent.
-1
Chapter 1. Single Proximity Transducer
OBJECTIVE: This topic will demonstrate the capabilities of the proximity transducer. The transducer operates on the eddy current loss principle to sense and convert mechanical motion into an equivalent electrical signal. In addition, the transducer can sense and convert physical distance into an equivalent electrical signal.
The proximity transducer electrical signal is basically a DC voltage. The equivalent DC signal is proportional to the distance from the transducer tip to the rotor shaft surface according to the transducer system sensitivity (i.e. 200 mv/mil). This signal provides a measurement of the DC GAP at which the transducer is calibrated.
Vibration measurements, obtained with the proximity transducer, will manifest themselves essentially as a varying DC voltage. This signal will appear as an AC signal when the vibration has a sinusoidal form. Both signals may be measured simultaneously while the demonstration rotor is operating.
This demonstration will show:
1. How to calibrate the proximity transducer 2. How to obtain DC gap voltages 3. How the DC voltages relate to shaft motion 4. Vibration signals obtained with a single NCPU
Specific test measurement instrumentation required for this demonstration include:
DC Voltmeter
Oscilloscope
DC Power Supply, -24 VDC
Demonstration Rotor and Instrumentation Setup:
Assemble the demonstration rotor using two (2) sleeve bearing assemblies, as shown in Figure 1.1. Install the single transducer in the mounting bracket in the vertical position.
PROCEDURE:
1. Apply -24 VDC to the proximity transducer. -2
-3
2. Connect the DC Voltmeter negative lead to the signal ground terminal of the proximitor and connect the positive lead to the signal output terminal of the proximitor. This electrical signal corresponds to the DC gap measurement.
3. Screw the transducer into the mounting bracket while observing the DC voltage
with the DC Voltmeter. Continue adjusting the NCPU until the DC voltage is approximately -12.0 VDC. This completes the NCPU calibration.
NOTE: Avoid excessive twisting of the transducer cable.
4. Connect channel A of the oscilloscope to the proximitor signal ground and signal
output terminals as noted in step 2 above. Adjust the oscilloscope display for 200 mv/division, AC coupled, and 50 ms/division. Adjust the vertical display position so that the displayed signal is centered.
5. With the demonstration rotor stopped, carefully lift the rotor shaft. A corresponding decrease in the voltage should be observable with the DC Voltmeter. Note that the oscilloscope display did not shift because the input signal was AC coupled.
6. Re-adjust the oscilloscope so that the input signal is DC coupled.
7. Repeat step 5 and observe the signal changes on the DC Voltmeter and the
oscilloscope. Note that the oscilloscope trace shifted as the shaft was lifted because the input signal was DC coupled.
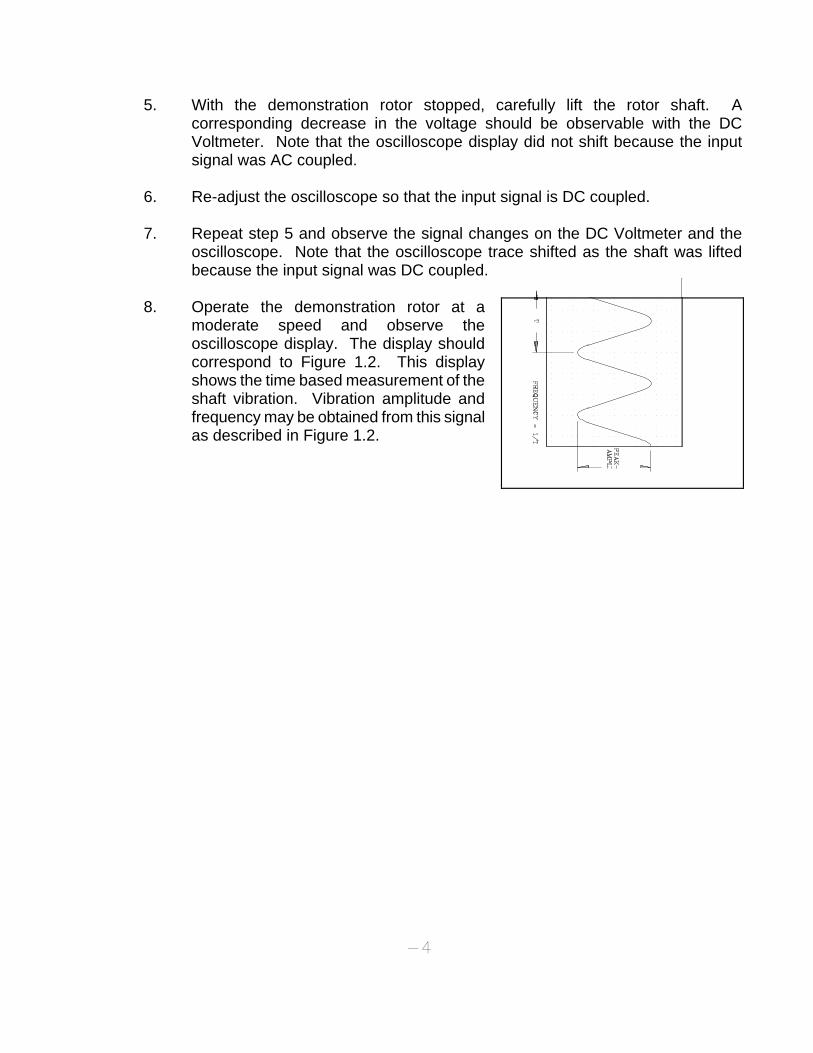
8. Operate the demonstration rotor at a
moderate speed and observe the oscilloscope display. The display should correspond to Figure 1.2. This display shows the time based measurement of the shaft vibration. Vibration amplitude and frequency may be obtained from this signal as described in Figure 1.2.
-4
-1
Chapter 2. Dual Proximity Transducer
OBJECTIVE: This topic will demonstrate the capabilities of utilizing two transducers. The transducer operates on the eddy current loss principle to sense and convert mechanical motion into an equivalent electrical signal. In addition, the transducer can sense and convert physical distance into an equivalent electrical signal.
The proximity transducer electrical signal is basically a DC voltage. The equivalent DC signal is proportional to the distance from the transducer tip to the rotor shaft surface according to the transducer system sensitivity (i.e. 200 mv/mil). This signal provides a measurement of the DC GAP at which the transducer is calibrated.
Vibration measurements, obtained with the transducer, will manifest themselves essentially as a varying DC voltage. This signal will appear as an AC signal when the vibration has a sinusoidal form. Both signals may be measured simultaneously while the demonstration rotor is operating.
This demonstration will show:
1. How to obtain shaft centerline measurements 2. How to obtain orbit (lissouji) measurements 3. The phase relationship between each transducer
Specific test measurement instrumentation required for this demonstration include:
DC Voltmeter
Two Channel Oscilloscope
DC Power Supply, -24 VDC
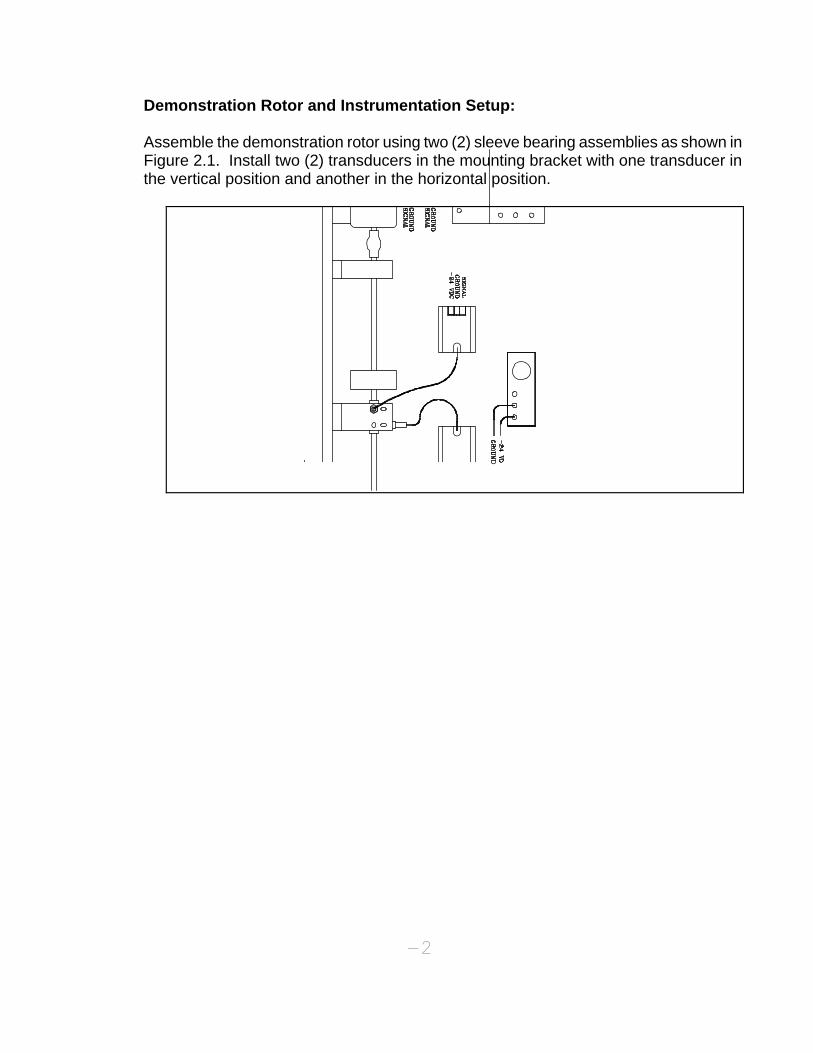
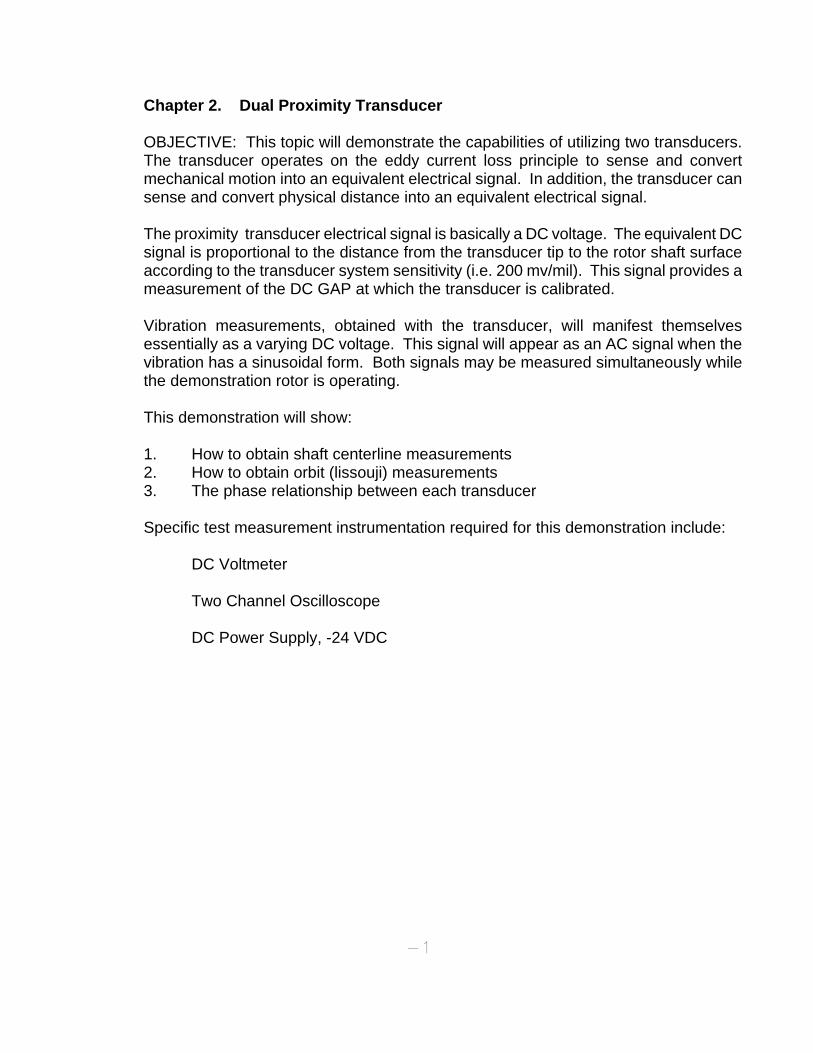
Demonstration Rotor and Instrumentation Setup:
Assemble the demonstration rotor using two (2) sleeve bearing assemblies as shown in Figure 2.1. Install two (2) transducers in the mounting bracket with one transducer in the vertical position and another in the horizontal position.
-2
-3
Install the transducer mounting bracket so that the horizontal mounting hole is to the right when viewed from the motor to the rotor mass.
Procedure:
1. Apply -24 VDC to both proximity transducers.
2. Calibrate (adjust) both transducers as described in Single Proximity Transducer
demonstration topic.
3. Connect the vertical transducer to channel B of the oscilloscope and connect the horizontal transducer to channel A of the oscilloscope.
4. Adjust the oscilloscope display for 200 mv/division, DC coupled, XY operation,
and 50 ms/division.
5. With the demonstration rotor shut off, adjust the vertical and horizontal position controls so that the dot is centered in the display.
6. With the demonstration rotor shut off, carefully lift the rotor shaft towards the
vertical transducer. Note that the dot on the oscilloscope moves up towards the top of the display. Next, carefully move the rotor shaft towards the horizontal transducer. Note that the dot on the oscilloscope moves towards the right side of the display. This illustrates that when a pair of mutually orthogonal transducers are viewing the same plane of the shaft and the oscilloscope is set for XY operation, the theoretical shaft centerline is displayed.
7. Operate the demonstration rotor at a moderate speed.
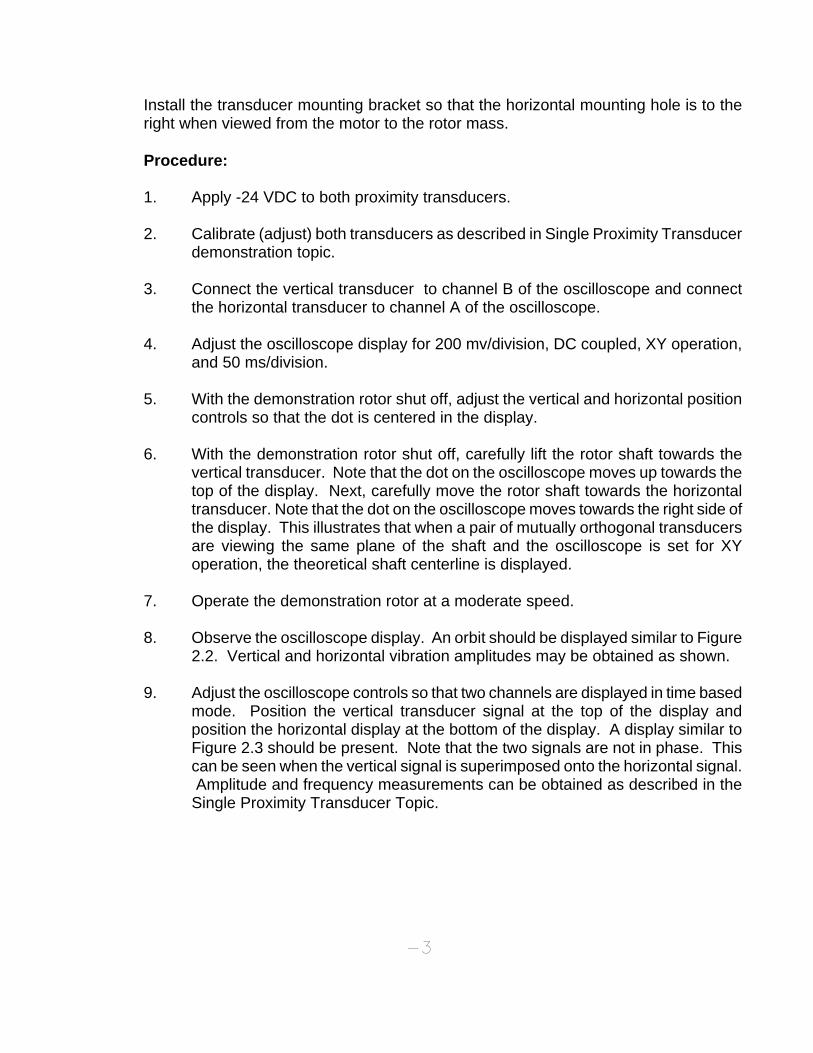
8. Observe the oscilloscope display. An orbit should be displayed similar to Figure
2.2. Vertical and horizontal vibration amplitudes may be obtained as shown.
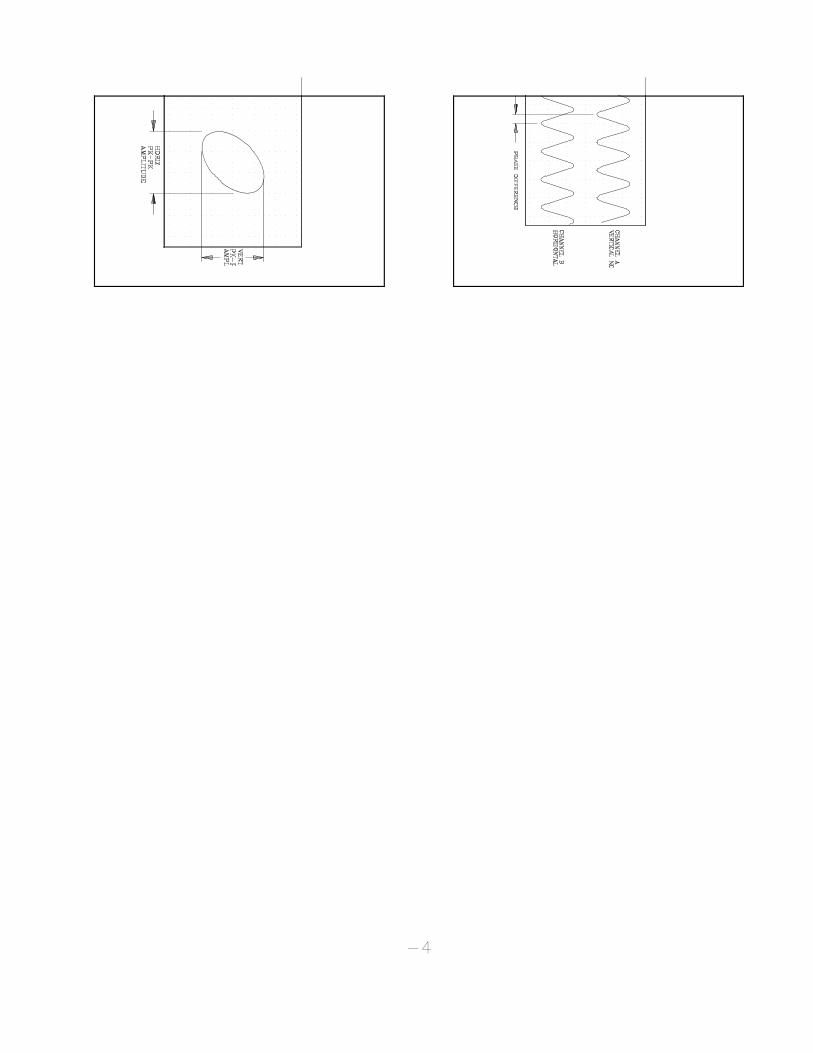
9. Adjust the oscilloscope controls so that two channels are displayed in time based mode. Position the vertical transducer signal at the top of the display and position the horizontal display at the bottom of the display. A display similar to Figure 2.3 should be present. Note that the two signals are not in phase. This can be seen when the vertical signal is superimposed onto the horizontal signal. Amplitude and frequency measurements can be obtained as described in the Single Proximity Transducer Topic.
-4
Chapter 3. Phase Transducer
OBJECTIVE: Phase angle measurements attempt to provide answers to what, where, and how problems are happening to the machine train. Phase angle measurements are a means of describing the location of the rotor or vibrating part at a particular instant in time.
Phase is defined as "the position of a vibrating part at a given instant with reference to a fixed point or another part." The phase transducer will be the reference in this demonstration.
The phase transducer when operating properly will produce a single pulse each time a notch or projection passes under the transducer. Phase measurement is made by relating the single pulse to a vibration signal. Since the pulse occurs every 360o of shaft revolution a phase measurement is defined as the number of degrees from the fixed reference pulse to the first positive peak of a vibration signal.
Phase measurements may be obtained simply by observing the input signals with an oscilloscope. The phase signal, when input into the Z-axis intensity, will provide a blanking of the vibration signal when the phase pulse occurs.
This demonstration will show:
1. What a phase signal looks like 2. How to measure phase using a single transducer 3. How to measure phase using dual transducer signals displayed in time base
format 4. How to measure phase using dual transducer signals displayed in orbit format 5. How to measure rotor speed with the phase transducer
Specific test measurement instrumentation required for this demonstration include:
Three (3) Eddy Current Displacement Transducers
Two channel oscilloscope with Z-axis intensity input
DC Power Supply, -24 VDC
1 Micro Farad Capacitor (optional)
3-1
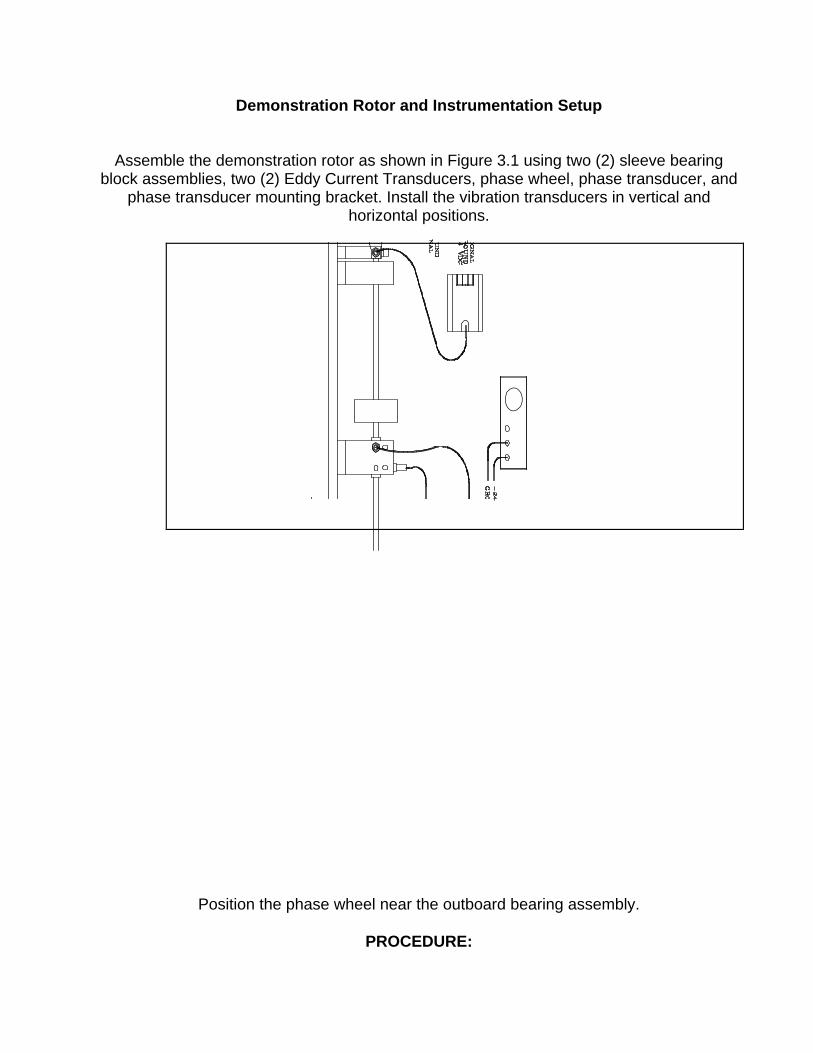
Demonstration Rotor and Instrumentation Setup
Assemble the demonstration rotor as shown in Figure 3.1 using two (2) sleeve bearing block assemblies, two (2) Eddy Current Transducers, phase wheel, phase transducer, and
phase transducer mounting bracket. Install the vibration transducers in vertical and horizontal positions.
Position the phase wheel near the outboard bearing assembly.
PROCEDURE:
1.Apply power to the proximitors and calibrate as discussed in topics 1 and 2, Single
Proximity Transducer and Dual Proximity Transducer.
2.Connect the vertical transducer to channel A of the oscilloscope.
3.Align the phase transducer to the phase wheel. Calibrate as discussed in topic 1, Single Proximity Transducer.
NOTE: Rotate the phase wheel so that the outer diameter of the phase wheel is
under the phase transducer.
4.Adjust the oscilloscope for time sweep operation, AC coupled, external trigger, 200 mv/division, and 50 ms/division. Center the sweep trace in the oscilloscope display.
3-2
5.Connect the phase transducer signal to channel B of the oscilloscope.
6.Operate the demonstration rotor at a moderate speed.
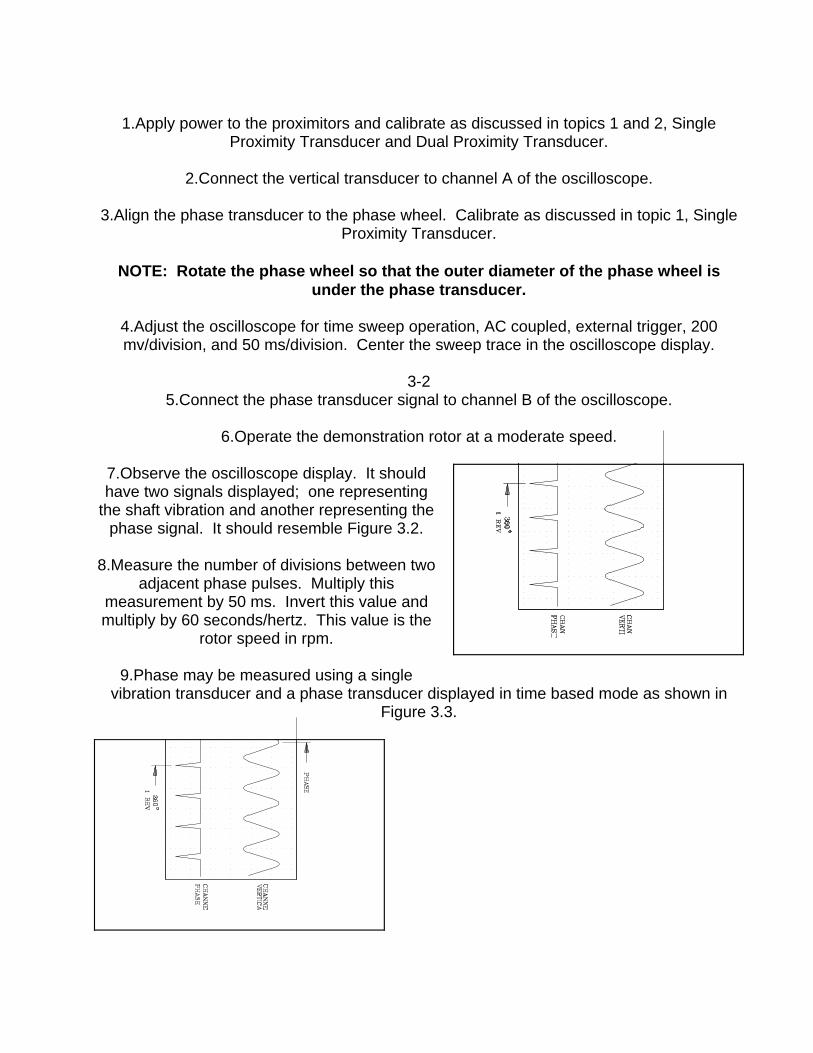
7.Observe the oscilloscope display. It should have two signals displayed; one representing
the shaft vibration and another representing the phase signal. It should resemble Figure 3.2.
8.Measure the number of divisions between two
adjacent phase pulses. Multiply this measurement by 50 ms. Invert this value and multiply by 60 seconds/hertz. This value is the
rotor speed in rpm.
9.Phase may be measured using a single vibration transducer and a phase transducer displayed in time based mode as shown in
Figure 3.3.
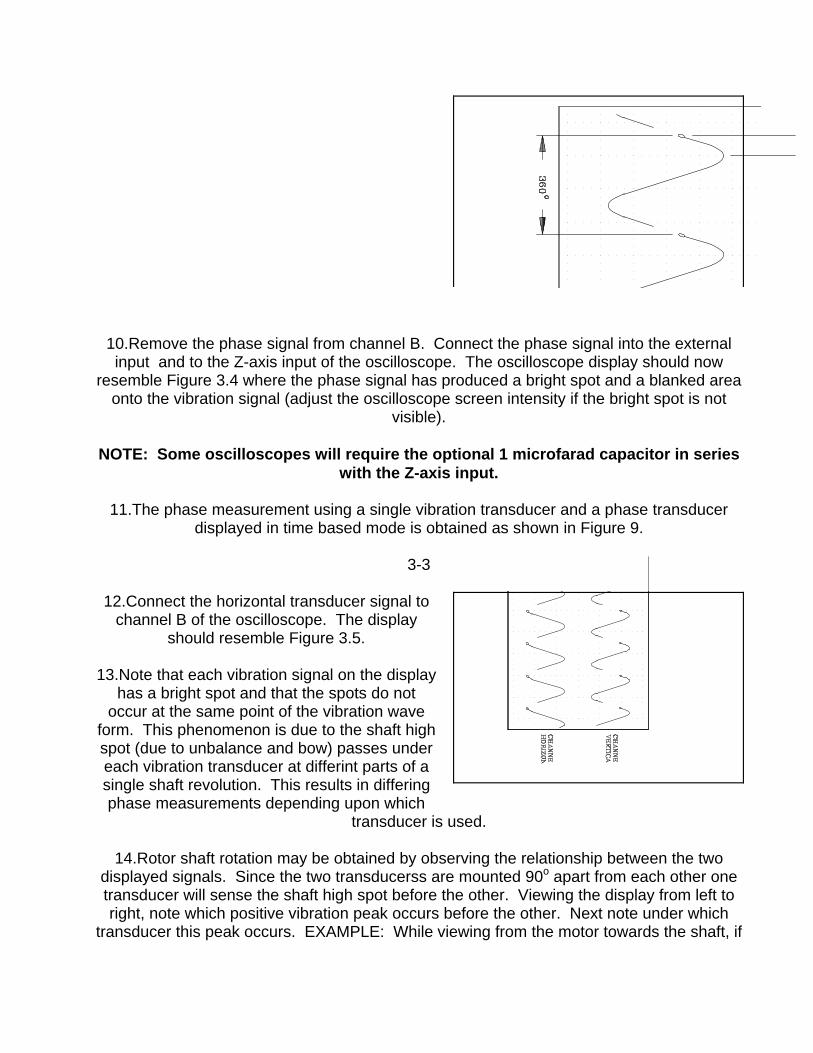
10.Remove the phase signal from channel B. Connect the phase signal into the external input and to the Z-axis input of the oscilloscope. The oscilloscope display should now
resemble Figure 3.4 where the phase signal has produced a bright spot and a blanked area onto the vibration signal (adjust the oscilloscope screen intensity if the bright spot is not
visible).
NOTE: Some oscilloscopes will require the optional 1 microfarad capacitor in series with the Z-axis input.
11.The phase measurement using a single vibration transducer and a phase transducer
displayed in time based mode is obtained as shown in Figure 9.
3-3
12.Connect the horizontal transducer signal to channel B of the oscilloscope. The display
should resemble Figure 3.5.
13.Note that each vibration signal on the display has a bright spot and that the spots do not
occur at the same point of the vibration wave form. This phenomenon is due to the shaft high spot (due to unbalance and bow) passes under each vibration transducer at differint parts of a single shaft revolution. This results in differing phase measurements depending upon which
transducer is used.
14.Rotor shaft rotation may be obtained by observing the relationship between the two
displayed signals. Since the two transducerss are mounted 90o apart from each other one transducer will sense the shaft high spot before the other. Viewing the display from left to right, note which positive vibration peak occurs before the other. Next note under which
transducer this peak occurs. EXAMPLE: While viewing from the motor towards the shaft, if
the vertical transducer signal peaks before the horizontal transducer signal, then the shaft rotates clockwise. This example assumes that the horizontal transducer is mounted to the
right of the vertical transducer, when they are viewed from the motor towards the shaft.
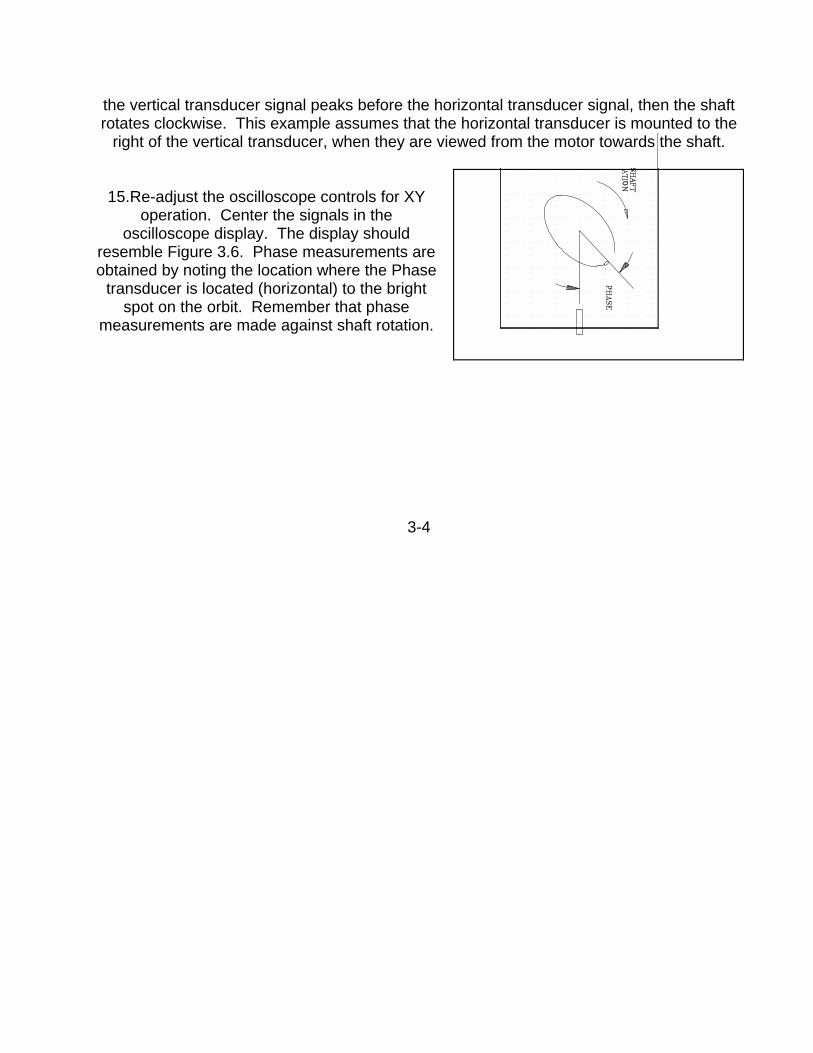
15.Re-adjust the oscilloscope controls for XY operation. Center the signals in the
oscilloscope display. The display should resemble Figure 3.6. Phase measurements are obtained by noting the location where the Phase
transducer is located (horizontal) to the bright spot on the orbit. Remember that phase
measurements are made against shaft rotation.
3-4
-1
Chapter 4. Instrumentation Conventions
OBJECTIVE: Instrumentation conventions are a sensible means to organize the various types of information acquired by vibration measurements. By developing standardized methods for installing measurement instrumentation, the interpretation of the information obtained will be made easier. Instrumentation system troubleshooting will also benefit from instrumentation conventions.
The oscilloscope will illustrate many instrumentation conventions that are used for information interpretation. A convention designed into oscilloscopes are that when operating in time based operation, time traces start at the left side and progress to the right side of the display (time progresses to the right). Another convention is that when in XY operation mode, channel A represents vertical motion and channel B represents horizontal motion. Also, when in XY mode, the oscilloscope trace will move up for positive voltage changes input into channel A and will move to the right for positive voltage changes input into channel B.
This demonstration topic will:
1. Introduce orientation conventions for vibration transducers 2. Describe oscilloscope conventions 3. Demonstrate transducer operating conventions
Specific test measurement instrumentation required for this demonstration include:
Eddy Current Transducer
Velocity Pickup
Accelerometer
DC Voltmeter
Two Channel Oscilloscope
DC Power Supply, variable +24 to -24 VDC
Demonstration Rotor and Instrumentation Setup
1. Assemble transducer system and apply -24 VDC to power the system.
2. Connect the DC Voltmeter to the output of the proximitor.
3. Observe the DC Voltmeter display, it should read -24 VDC.
4. Slowly bring the transducer tip towards a metallic surface and observe the proximitor output with the DC Voltmeter. The output will start at -24 VDC and approach 0 VDC. This illustrates the convention that motion of a metallic surface (i.e. rotor shaft) towards the transducer tip will produce a positive voltage change.
5. Connect the proximitor output to channel A of the oscilloscope (this channel is
the vertical channel when the oscilloscope is in XY mode). Adjust the oscilloscope controls for DC coupled input and XY mode, 200 mv/division. Center the dot in the display.
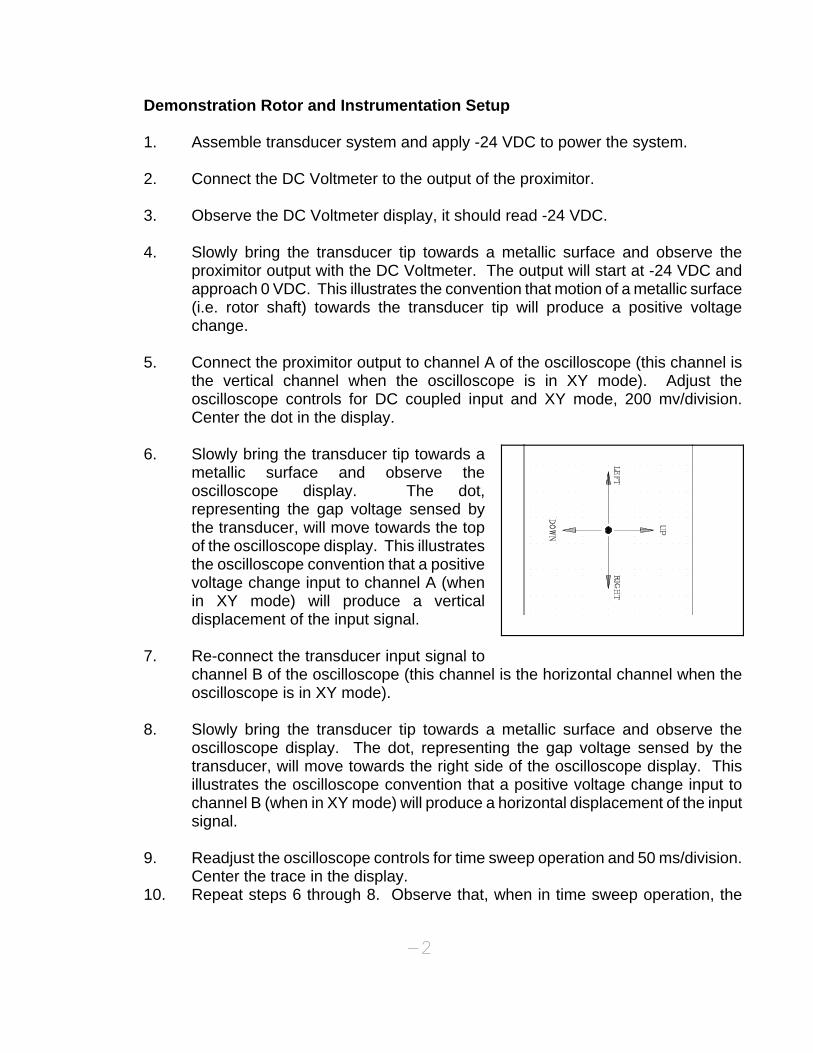
6. Slowly bring the transducer tip towards a
metallic surface and observe the oscilloscope display. The dot, representing the gap voltage sensed by the transducer, will move towards the top of the oscilloscope display. This illustrates the oscilloscope convention that a positive voltage change input to channel A (when in XY mode) will produce a vertical displacement of the input signal.
7. Re-connect the transducer input signal to
channel B of the oscilloscope (this channel is the horizontal channel when the oscilloscope is in XY mode).
8. Slowly bring the transducer tip towards a metallic surface and observe the
oscilloscope display. The dot, representing the gap voltage sensed by the transducer, will move towards the right side of the oscilloscope display. This illustrates the oscilloscope convention that a positive voltage change input to channel B (when in XY mode) will produce a horizontal displacement of the input signal.
9. Readjust the oscilloscope controls for time sweep operation and 50 ms/division.
Center the trace in the display. 10. Repeat steps 6 through 8. Observe that, when in time sweep operation, the
-2
-3
oscilloscope convention is unchanged; a positive voltage change produces a positive display change.
11. Assemble the demonstration rotor as described in topic 2, Dual Proximity
Transducer. Install a vertical transducer and a horizontal trans with the horizontal transducer located to the right when viewed from the motor to the shaft. Calibrate the transducers as described in topic 2, Dual Proximity Transducers.
12. Re-adjust the oscilloscope controls for XY mode. Connect the vertical
transducer output to channel A and connect the horizontal transducer output to channel B. Center the dot in the display.
13. Carefully lift the rotor shaft and observe the oscilloscope display. The dot,
representing the theoretical shaft centerline, will move towards to top of the display. Carefully move the rotor shaft away from the horizontal transducer and observe the oscilloscope display. The dot will move to the left side of the oscilloscope display.
14. Reinstall the two NCPUs so that they are located 45o from vertical. Viewing the
transducer mounting bracket from the motor to the shaft, connect the left transducer to oscilloscope channel A and connect the right transducer to oscilloscope channel B.
15. Carefully lift the rotor shaft vertically and observe the oscilloscope display. The
dot, representing the theoretical shaft centerline, will move towards the upper right corner of the display. This phenomenon is because lifting the shaft vertically actually moves the shaft observed surfaces towards both transducers and the oscilloscope displays positive voltage changes at both channels. For further clarification: Rotate the oscilloscope 45o to the left. This action orients the oscilloscope's assumed channel orientation to match actual transducer orientation. Which transducer is the "vertical" transducer? (answer: the transducer located to the left of vertical, when viewed from the motor towards the shaft)
Instrumentation Setup (Velocity)
1. Connect the output of the Velocity pickup to oscilloscope channel A.
2. Adjust the oscilloscope controls for time sweep operation, 200 mv/division, 100
ms/division, DC coupled and center the trace in the display.
-4
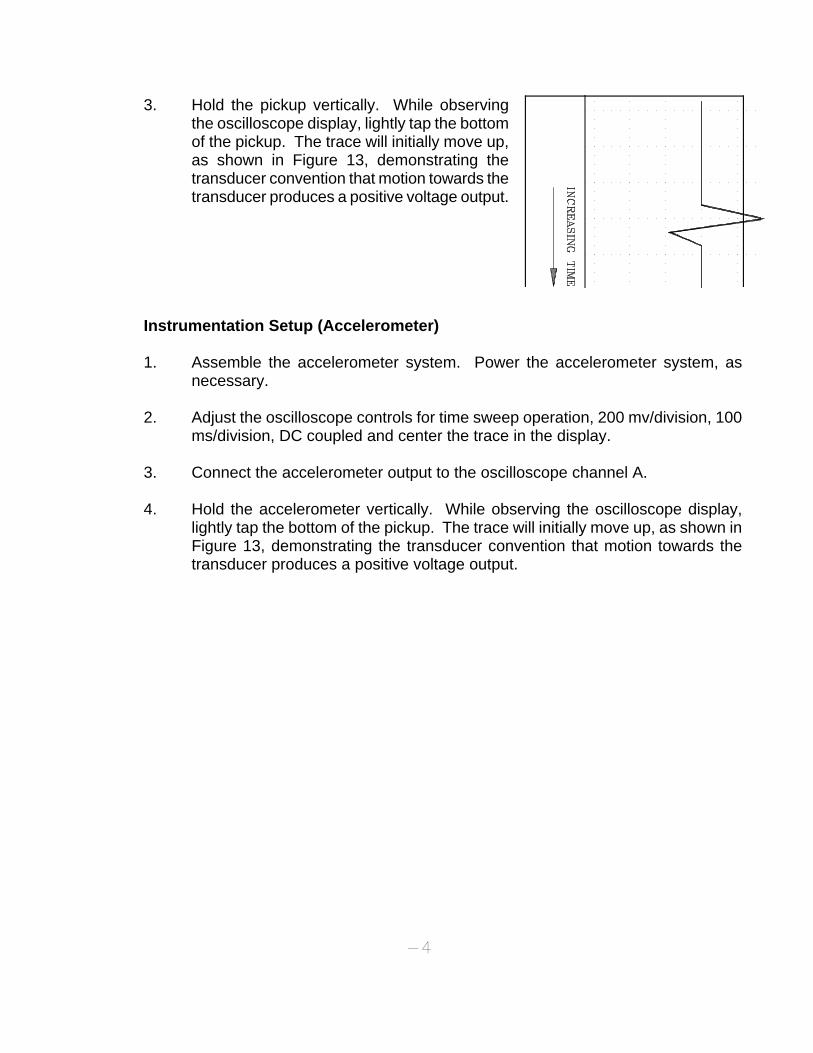
3. Hold the pickup vertically. While observing the oscilloscope display, lightly tap the bottom of the pickup. The trace will initially move up, as shown in Figure 13, demonstrating the transducer convention that motion towards the transducer produces a positive voltage output.
Instrumentation Setup (Accelerometer)
1. Assemble the accelerometer system. Power the accelerometer system, as necessary.
2. Adjust the oscilloscope controls for time sweep operation, 200 mv/division, 100
ms/division, DC coupled and center the trace in the display.
3. Connect the accelerometer output to the oscilloscope channel A.
4. Hold the accelerometer vertically. While observing the oscilloscope display, lightly tap the bottom of the pickup. The trace will initially move up, as shown in Figure 13, demonstrating the transducer convention that motion towards the transducer produces a positive voltage output.
-1
Chapter 5. Speed Transducer
OBJECTIVE: Precise rotor speed measurements are required on many machines. Most notably are turbine generators, where very precise rotor speed is a rotor synchronization requirement. In addition to rotor speed, angular acceleration measurements are important to system operation.
Although rotor speed may be obtained by a single event, such as a key way, the speed pulse occurs only once per revolution. Greater accuracy is obtained by observing a specially constructed speed wheel which has many precisely machined notches that are observed by a transducer. By having many timing pulses per shaft revolution more precise speed and angular acceleration are obtained.
This demonstration will show:
1. How to install speed transducers 2. What the speed signal looks like
Specific test measurement instrumentation required for this demonstration include:
DC Voltmeter
NCPU Transducer
Oscilloscope
DC Power Supply, -24 VDC
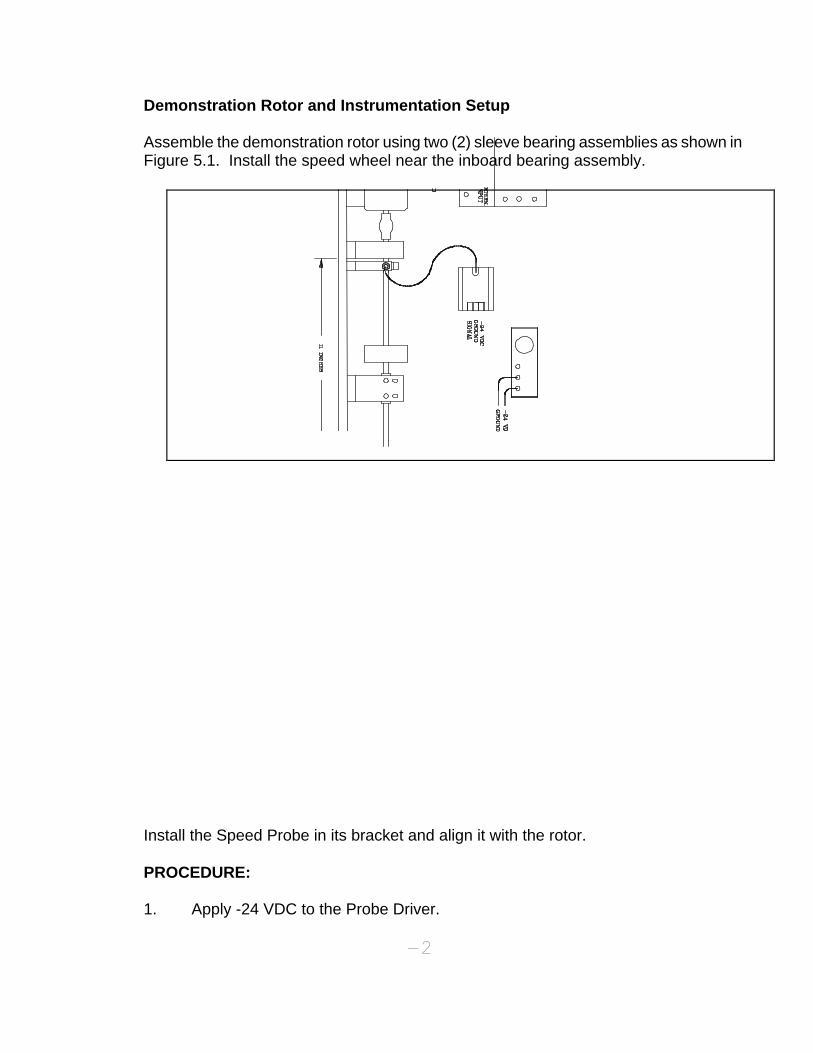
Demonstration Rotor and Instrumentation Setup Assemble the demonstration rotor using two (2) sleeve bearing assemblies as shown in Figure 5.1. Install the speed wheel near the inboard bearing assembly.
Install the Speed Probe in its bracket and align it with the rotor.
PROCEDURE:
-2
1. Apply -24 VDC to the Probe Driver.
-3
2. Rotate the Rotor so that the coupling is aligned with the probe tip at the major
diameter of the coupling.
3. Calibrate the transducer as discussed in topic 1, Single NCPU Transducer.
4. Connect the transducer output to oscilloscope channel A. Adjust the oscilloscope controls for DC coupled operation, 200 mv/division, 20 ms/division, and center the trace in the display.
5. Operate the demonstration rotor at a moderate speed.
6. Observe the oscilloscope display, it will display a signal pulse as coupling wheel
notch passes under the probe tip.
7. Rotor speed may be calculated by measuring the time from one pulse to the next, multiplying the pulse time by the number of notches present. Invert this value and multiply by 60 seconds/hertz to obtain rotor speed in rpm.
-1
Chapter 6. Critical Speeds - Single Mass Rotor
OBJECTIVE: This topic will demonstrate various methods to detect and document "critical speeds" which all rotors can experience. "Critical speeds" are a condition of natural resonance that is designed, either specifically or inadvertently, into machinery. Critical speeds are sometimes known as natural resonances, critical zones, or simply as criticals. They are all manifested as speed zones where vibration amplitudes may reach large values that can induce machinery or process damage. In addition to exhibiting increased amplitudes, large phase changes are usually experienced.
These criticals are experienced whenever some force, such as residual unbalance or mechanical looseness, induces a condition where a natural resonance frequency is excited. Fundamental rotor response studies have shown that at resonance condition the only restraining component available to restrict vibration amplitudes are damping forces. Machine designs with little damping will have large vibration amplitude excursions at resonance conditions.
This demonstration will show:
1. How to identify a critical speed using vibration measurements 2. How to identify a critical speed using phase measurements 3. How to measure amplification factors using orbit presentations 4. How to determine critical speeds and amplification factors using Bode' plots 5. How to determine critical speeds and amplification factors using Polar plots
Specific test measurement instrumentation required for this demonstration include:
Oscilloscope
DC Power Supply, variable -24 to +24 VDC
FFT analyzer, dual channel
Two (2) Eddy Current Transducers
Accelerometer
Demonstration Rotor and Instrumentation Setup
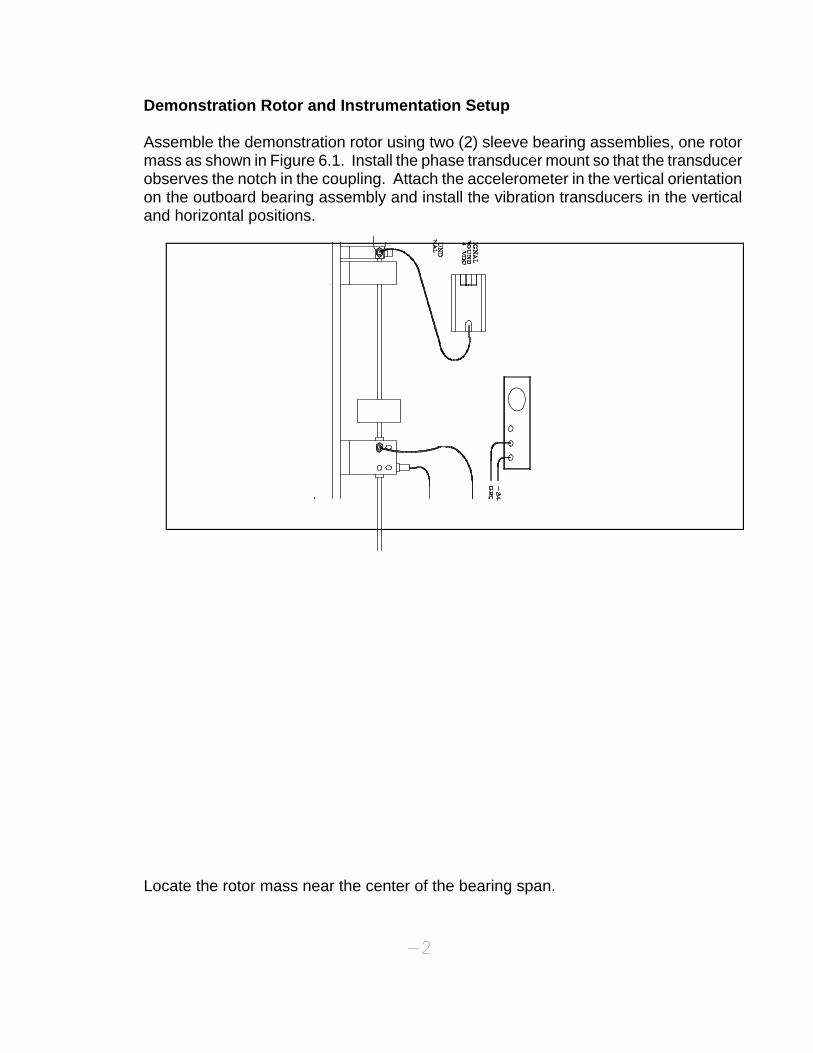
Assemble the demonstration rotor using two (2) sleeve bearing assemblies, one rotor mass as shown in Figure 6.1. Install the phase transducer mount so that the transducer observes the notch in the coupling. Attach the accelerometer in the vertical orientation on the outboard bearing assembly and install the vibration transducers in the vertical and horizontal positions.
Locate the rotor mass near the center of the bearing span. -2
-3
PROCEDURE:
How to identify a critical speed using vibration measurements.
1. Apply power to the transducers and calibrate the transducers as described in topics 2 and 3, Dual Proximity Transducer and Phase Transducer.
2. Connect the vertical vibration transducer to the Y oscilloscope channel and
connect the horizontal vibration transducer to the X oscilloscope channel. Connect the phase transducer to oscilloscope external trigger and to Z-axis intensity inputs.
3. Adjust the oscilloscope controls for AC coupled, 200 mv/division, external trigger,
and XY operation.
4. While observing the oscilloscope display, operate the rotor over its speed range. Control the rotor ramp rate for slow speed increase.
5. Note that at very low rotor speeds the orbit has a relatively small diameter. As
the critical speed is approached the orbit diameter increases sharply indicating high vibration amplitudes. Also, note that the phase bright spot rotates about 180o from its original location. At high rotor speeds the orbit again resumes a relatively small diameter.
6. Stop the rotor.
7. Re-adjust the oscilloscope controls for time sweep operation, dual channel
operation, and 50 ms/division. Locate the vertical transducer trace near the top of the display and locate the horizontal transducer trace near the bottom of the display.
8. While observing the oscilloscope display, operate the rotor over its speed range.
Control the rotor ramp rate for slow speed increase.
9. Note that at very low rotor speeds the peak-to-peak amplitudes traces have a relatively small value. As the critical speed is approached the vibration amplitude traces increase sharply indicating high vibration amplitudes. At high rotor speed the vibration traces again resume relatively small amplitudes.
10. The speed at which the vibration amplitudes and orbits reach maximum is the
critical speed.
11. Disconnect the transducer inputs from the X and Y oscilloscope channels.
-4
12. Power the accelerometer and connect its signal to oscilloscope channel A.
13. Re-adjust the oscilloscope controls for single channel operation, time sweep operation, and 100 mv/division. Center the trace in the display.
14. While observing the oscilloscope display, operate the rotor over its speed range.
Control the rotor ramp rate for slow speed increase.
15. Note that at very low rotor speeds the amplitude trace has a relatively small value. As the critical speed is approached the vibration amplitude trace increases sharply indicating high vibration amplitude. At high rotor speed the vibration trace again resumes a relatively small amplitude.
16. The speed at which the vibration amplitude reaches a maximum is the critical speed.
How to identify a critical speed using phase measurements.
1. Apply power to the transducers and calibrate the transducers as described in
topics 2 and 3, Dual Proximity Transducer and Phase Transducers.
2. Connect the vertical vibration transducer to the Y oscilloscope channel and connect the horizontal vibration transducer to the X oscilloscope channel. Connect the phase transducer to oscilloscope external trigger and to Z-axis intensity inputs.
3. Adjust the oscilloscope controls for AC coupled, 200 mv/division, external trigger,
and XY operation.
4. Calibrate the transducers as described in topics 2 and 3.
5. While observing the oscilloscope display, operate the rotor over its speed range. Control the rotor ramp rate for slow speed increase.
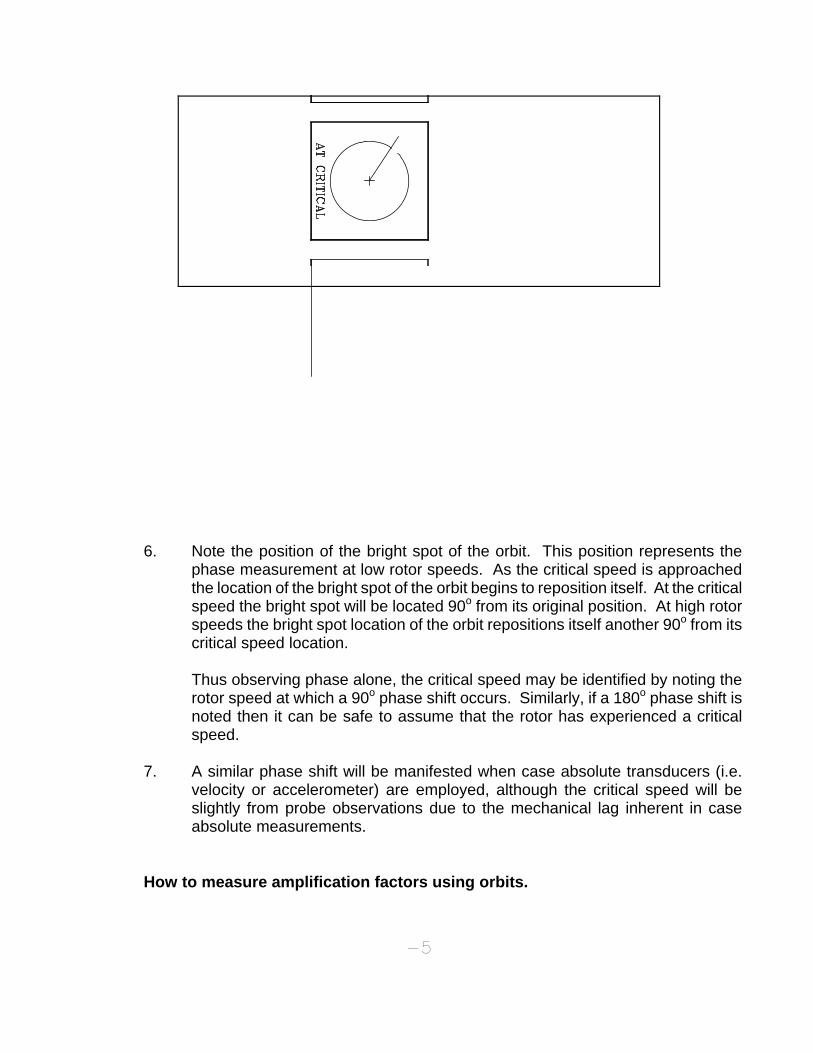
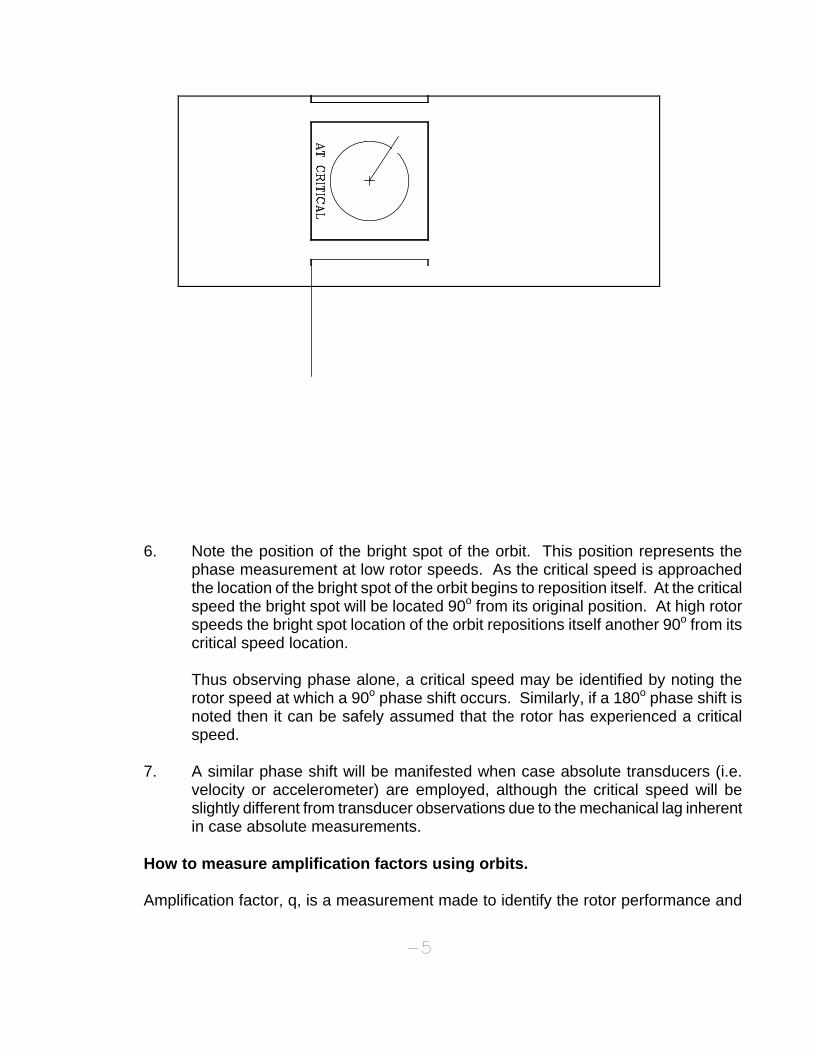
6. Note the position of the bright spot of the orbit. This position represents the phase measurement at low rotor speeds. As the critical speed is approached the location of the bright spot of the orbit begins to reposition itself. At the critical speed the bright spot will be located 90o from its original position. At high rotor speeds the bright spot location of the orbit repositions itself another 90o from its critical speed location.
Thus observing phase alone, the critical speed may be identified by noting the rotor speed at which a 90o phase shift occurs. Similarly, if a 180o phase shift is noted then it can be safe to assume that the rotor has experienced a critical speed.
7. A similar phase shift will be manifested when case absolute transducers (i.e.
velocity or accelerometer) are employed, although the critical speed will be slightly from probe observations due to the mechanical lag inherent in case absolute measurements.
How to measure amplification factors using orbits.
-5
-6
Amplification factor, q, is a measurement made to identify the rotor performance and rotor critical damping. The dimensionless amplification factor is inversely related to critical damping by the equation: Damping = 1/(2 x q) . Amplification factors should be measured with shaft relative transducers since case absolute damping factors are essentially meaningless. High amplification factors (greater than 5) indicate a machine that is sensitive to critical speeds and little damping is available to control vibration amplitudes whenever the rotor experiences a critical speed.
Amplification factors are obtained by the equation:
q = amplitude at critical/amplitude at high speed.
Amplitude measurements may be taken by either vertical or horizontally mounted transducers. The values for amplification factor will be nearly identical if the vertical and horizontal shaft stiffness are uniform.
1. While observing the oscilloscope display, operate the rotor over its speed range.
Control the rotor ramp rate for slow speed increase.
NOTE: Do not operate the demonstration rotor at its critical speed for extended periods as this action may cause severe damage and, possibly, personal injury.
2. Observe the vertical transducer and note the peak-to-peak amplitude when the
rotor has reached its critical speed, Ac = _______________________.
3. Note the vertical peak-to-peak amplitude when the rotor is at high speed, Ah = _______________________.
4. Calculate the amplification factor, q = Ac / Ah.
How to determine critical speeds and amplification factors using Bode' plots.
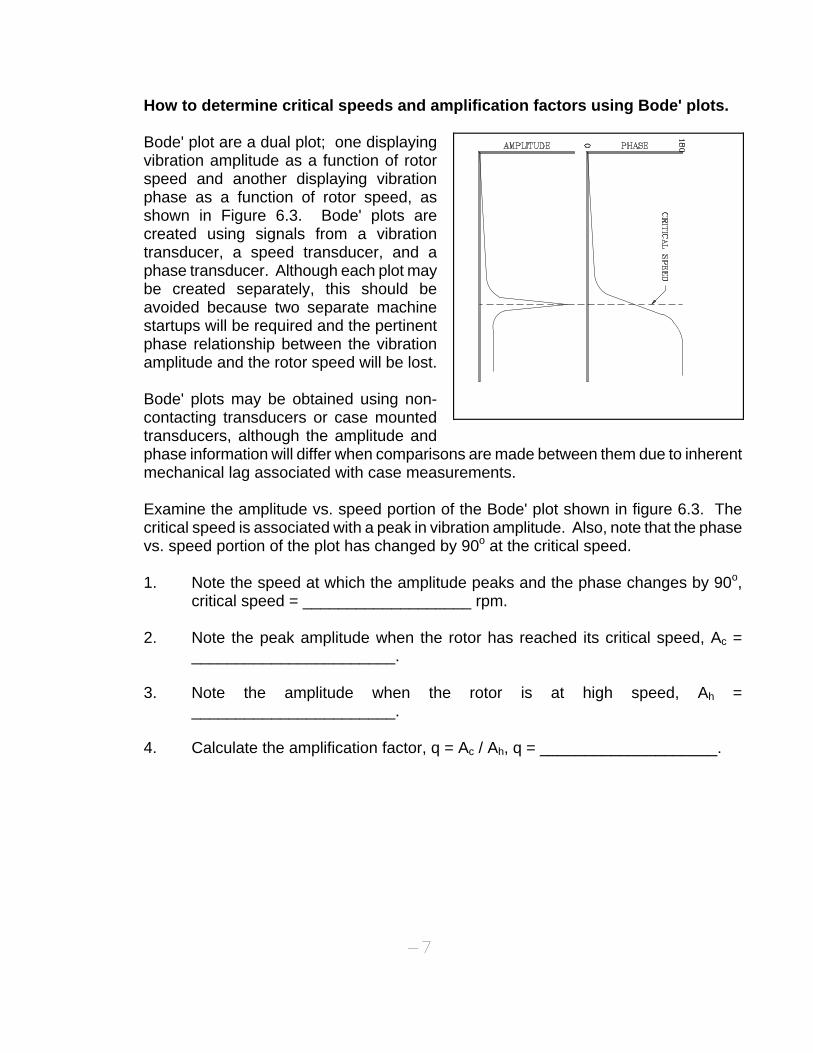
Bode' plot are a dual plot; one displaying vibration amplitude as a function of rotor speed and another displaying vibration phase as a function of rotor speed, as shown in Figure 6.3. Bode' plots are created using signals from a vibration transducer, a speed transducer, and a phase transducer. Although each plot may be created separately, this should be avoided because two separate machine startups will be required and the pertinent phase relationship between the vibration amplitude and the rotor speed will be lost.
-7
Bode' plots may be obtained using non-contacting transducers or case mounted transducers, although the amplitude and phase information will differ when comparisons are made between them due to inherent mechanical lag associated with case measurements.
Examine the amplitude vs. speed portion of the Bode' plot shown in figure 6.3. The critical speed is associated with a peak in vibration amplitude. Also, note that the phase vs. speed portion of the plot has changed by 90o at the critical speed.
1. Note the speed at which the amplitude peaks and the phase changes by 90o,
critical speed = ___________________ rpm.
2. Note the peak amplitude when the rotor has reached its critical speed, Ac = _______________________.
3. Note the amplitude when the rotor is at high speed, Ah =
_______________________.
4. Calculate the amplification factor, q = Ac / Ah, q = ____________________.
How to determine critical speeds and amplification factors using Polar plots.
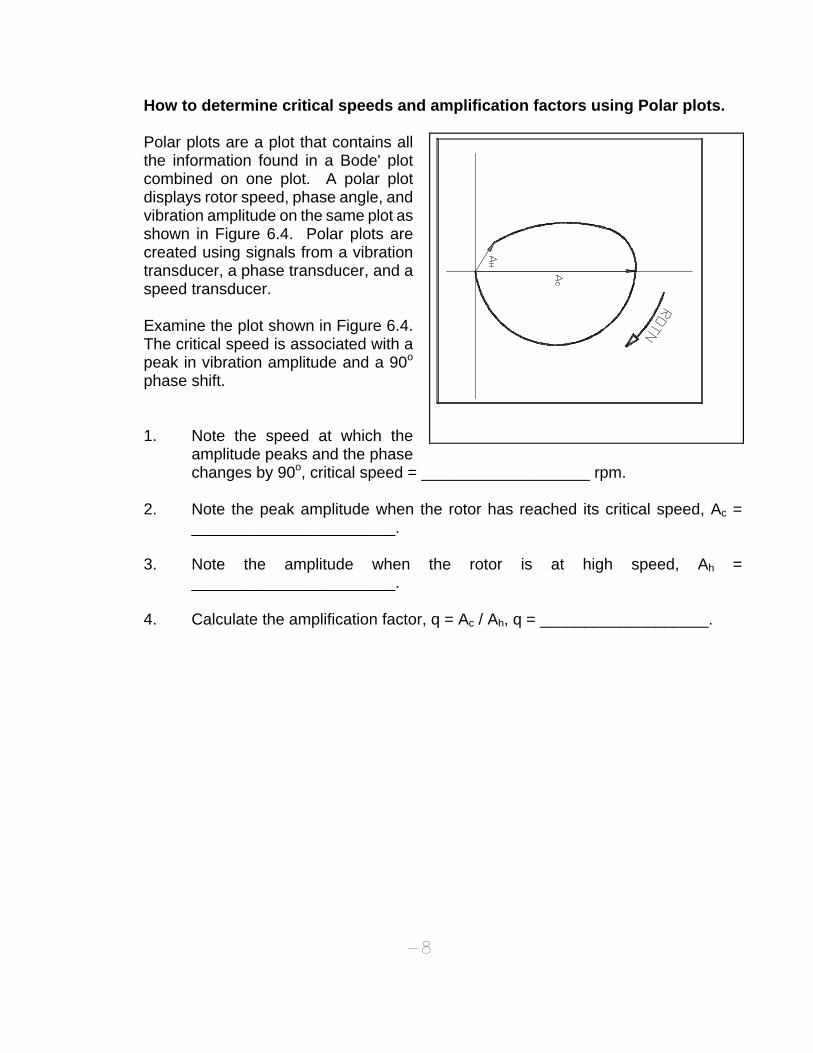
Polar plots are a plot that contains all the information found in a Bode' plot combined on one plot. A polar plot displays rotor speed, phase angle, and vibration amplitude on the same plot as shown in Figure 6.4. Polar plots are created using signals from a vibration transducer, a phase transducer, and a speed transducer.
-8
Examine the plot shown in Figure 6.4. The critical speed is associated with a peak in vibration amplitude and a 90o phase shift.
1. Note the speed at which the amplitude peaks and the phase changes by 90o, critical speed = ___________________ rpm.
2. Note the peak amplitude when the rotor has reached its critical speed, Ac =
_______________________.
3. Note the amplitude when the rotor is at high speed, Ah = _______________________.
4. Calculate the amplification factor, q = Ac / Ah, q = ___________________.

-1
Chapter 7. Critical Speeds - Dual Mass Rotor
OBJECTIVE: This topic will demonstrate various methods to detect and document "critical speeds" which all rotors can experience. "Critical speeds" are a condition of natural resonance that is designed, either specifically or inadvertently, into machinery. Critical speeds are sometimes known as natural resonances, critical zones, or simply as criticals. They are all manifested as speed zones where vibration amplitudes may reach large values that can induce machinery or process damage. In addition to exhibiting increased amplitudes, large phase changes are usually experienced.
These criticals are experienced whenever some force, such as residual unbalance or mechanical looseness, induces a condition where a natural resonance frequency is excited. Fundamental rotor response studies have shown that at resonance condition the only restraining component available to restrict vibration amplitudes are damping forces. Machine designs with little damping will have large vibration amplitude excursions at resonance conditions.
This demonstration will show:
1. How to identify a critical speed using vibration measurements 2. How to identify a critical speed using phase measurements 3. How to measure amplification factors using orbit presentations 4. How to determine critical speeds and amplification factors using Bode' plots 5. How to determine critical speeds and amplification factors using Polar plots
Specific test measurement instrumentation required for this demonstration include:
Oscilloscope
DC Power Supply, variable -24 to +24 VDC
FFT analyzer, dual channel
Two (2) Eddy Current Transducers
Accelerometer
Demonstration Rotor and Instrumentation Setup
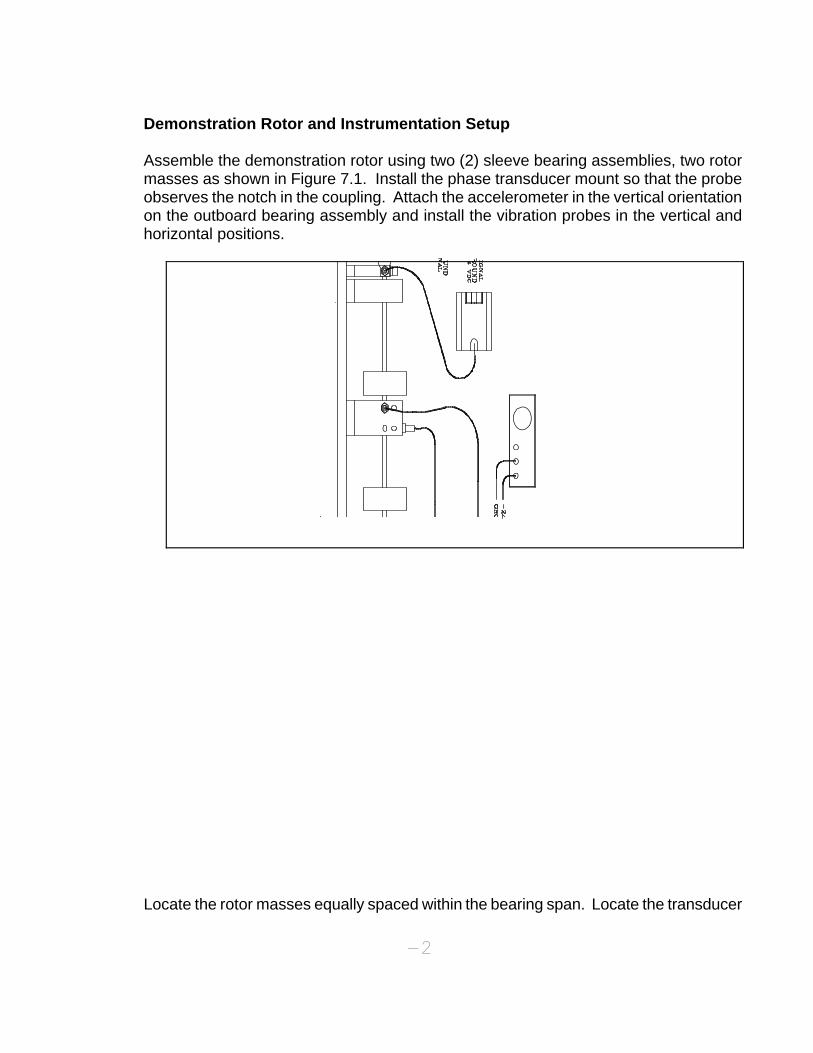
Assemble the demonstration rotor using two (2) sleeve bearing assemblies, two rotor masses as shown in Figure 7.1. Install the phase transducer mount so that the probe observes the notch in the coupling. Attach the accelerometer in the vertical orientation on the outboard bearing assembly and install the vibration probes in the vertical and horizontal positions.
Locate the rotor masses equally spaced within the bearing span. Locate the transducer -2
-3
mounting bracket near one of the rotor masses.
PROCEDURE:
How to identify a critical speed using vibration measurements.
1. Apply power to the transducers and calibrate the transducers as described in topics 2 and 3, Dual Proximity Transducer and Phase Transducer.
2. Connect the vertical vibration transducer to the Y oscilloscope channel and
connect the horizontal vibration transducer to the X oscilloscope channel. Connect the phase transducer to oscilloscope external trigger and to Z-axis intensity inputs.
3. Adjust the oscilloscope controls for AC coupled, 200 mv/division, external trigger,
and XY operation.
4. While observing the oscilloscope display, operate the rotor over its speed range. Control the rotor ramp rate for slow speed increase.
5. Note that at very low rotor speeds the orbit has a relatively small diameter. As a
critical speed is approached the orbit diameter increases sharply indicating high vibration amplitudes. Also, note that the phase bright spot rotates about 180o from its original location after the critical speed has been exceeded. At high rotor speeds the orbit again resumes a relatively small diameter.
6. Stop the rotor.
7. Re-adjust the oscilloscope controls for time sweep operation, dual channel
operation, and 50 ms/division. Locate the vertical transducer trace near the top of the display and locate the horizontal transducer trace near the bottom of the display.
8. While observing the oscilloscope display, operate the rotor over its speed range.
Control the rotor ramp rate for slow speed increase.
9. Note that at very low rotor speeds the peak-to-peak amplitudes traces have a relatively small value. As a critical speed is approached the vibration amplitude traces increase sharply indicating high vibration amplitudes. At high rotor speed the vibration traces again resume relatively small amplitudes.
10. The speed at which the vibration amplitudes and orbits reach maximum is the
critical speed.
-4
11. Disconnect the transducer inputs from the X and Y oscilloscope channels.
12. Power the accelerometer and connect its signal to oscilloscope channel A.
13. Re-adjust the oscilloscope controls for single channel operation, time sweep operation, and 100 mv/division. Center the trace in the display.
14. While observing the oscilloscope display, operate the rotor over its speed range.
Control the rotor ramp rate for slow speed increase.
15. Note that at very low rotor speeds the amplitude trace has a relatively small value. As the critical speed is approached the vibration amplitude trace increases sharply indicating high vibration amplitude. At high rotor speed the vibration trace again resumes a relatively small amplitude.
16. The speed at which the vibration amplitude reaches a maximum is the critical speed.
How to identify a critical speed using phase measurements.
1. Apply power to the transducers and calibrate the transducers as described in
topics 2 and 3, Dual Proximity Transducers and Phase Transducers.
2. Connect the vertical vibration transducer to the Y oscilloscope channel and connect the horizontal vibration transducers to the X oscilloscope channel. Connect the phase transducer to oscilloscope external trigger and to Z-axis intensity inputs.
3. Adjust the oscilloscope controls for AC coupled, 200 mv/division, external trigger,
and XY operation.
4. Calibrate the transducers as described in topics 2 and 3, Dual Transducers and Phase transducer.
5. While observing the oscilloscope display, operate the rotor over its speed range.
Control the rotor ramp rate for slow speed increase.
6. Note the position of the bright spot of the orbit. This position represents the phase measurement at low rotor speeds. As the critical speed is approached the location of the bright spot of the orbit begins to reposition itself. At the critical speed the bright spot will be located 90o from its original position. At high rotor speeds the bright spot location of the orbit repositions itself another 90o from its critical speed location.
Thus observing phase alone, a critical speed may be identified by noting the rotor speed at which a 90o phase shift occurs. Similarly, if a 180o phase shift is noted then it can be safely assumed that the rotor has experienced a critical speed.
7. A similar phase shift will be manifested when case absolute transducers (i.e.
velocity or accelerometer) are employed, although the critical speed will be slightly different from transducer observations due to the mechanical lag inherent in case absolute measurements.
How to measure amplification factors using orbits.
Amplification factor, q, is a measurement made to identify the rotor performance and
-5
-6
rotor critical damping. The dimensionless amplification factor is inversely related to critical damping by the equation: Damping = 1/(2 x q) . Amplification factors should be measured with shaft relative transducers since case absolute damping factors are essentially meaningless. High amplification factors (greater than 5) indicate a machine that is sensitive to critical speeds and little damping is available to control vibration amplitudes whenever the rotor experiences a critical speed.
Amplification factors are obtained by the equation:
q = amplitude at critical/amplitude at high speed.
Amplitude measurements may be taken by either vertical or horizontally mounted transducers. The values for amplification factor will be nearly identical if the vertical and horizontal shaft stiffness are uniform.
1. While observing the oscilloscope display, operate the rotor over its speed range.
Control the rotor ramp rate for slow speed increase.
NOTE: Do not operate the demonstration rotor at its critical speed for extended periods as this action may cause severe damage and, possibly, personal injury.
2. Observe the vertical transducer and note the peak-to-peak amplitude when the
rotor has reached its critical speed, Ac = _______________________.
3. Note the vertical peak-to-peak amplitude when the rotor is at high speed, Ah = _______________________.
4. Calculate the amplification factor, q = Ac / Ah.
How to determine critical speeds and amplification factors using Bode' plots.
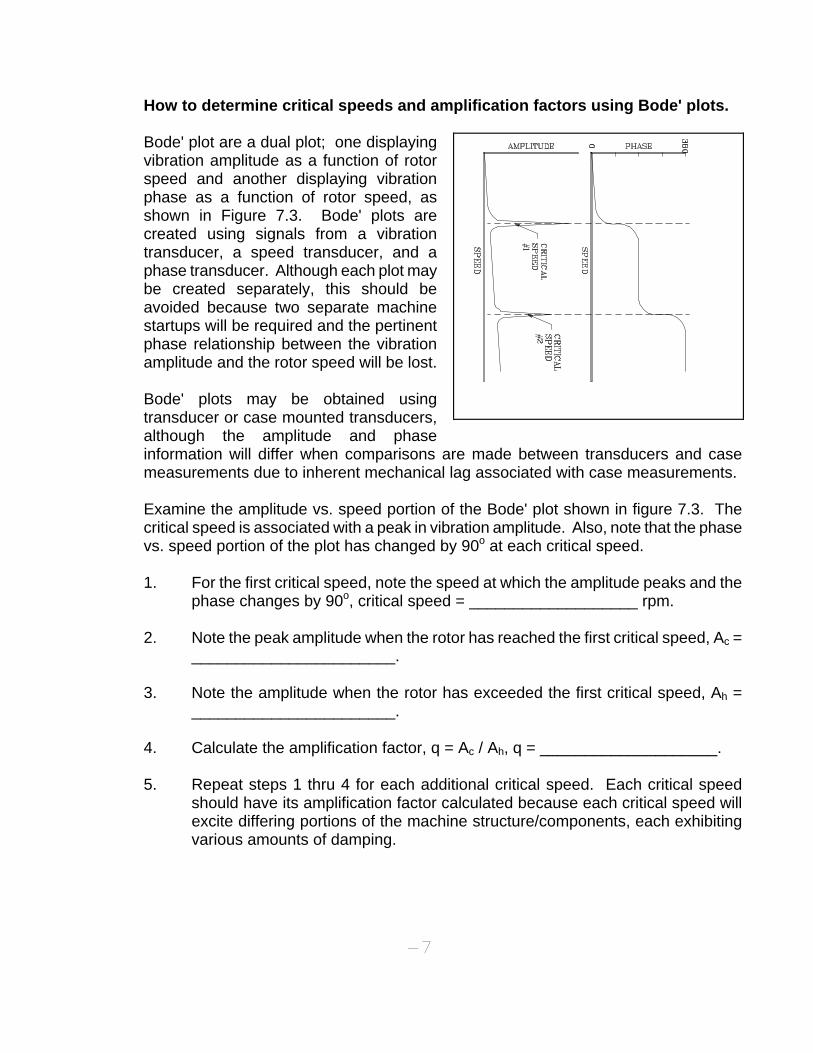
Bode' plot are a dual plot; one displaying vibration amplitude as a function of rotor speed and another displaying vibration phase as a function of rotor speed, as shown in Figure 7.3. Bode' plots are created using signals from a vibration transducer, a speed transducer, and a phase transducer. Although each plot may be created separately, this should be avoided because two separate machine startups will be required and the pertinent phase relationship between the vibration amplitude and the rotor speed will be lost.
-7
Bode' plots may be obtained using transducer or case mounted transducers, although the amplitude and phase information will differ when comparisons are made between transducers and case measurements due to inherent mechanical lag associated with case measurements.
Examine the amplitude vs. speed portion of the Bode' plot shown in figure 7.3. The critical speed is associated with a peak in vibration amplitude. Also, note that the phase vs. speed portion of the plot has changed by 90o at each critical speed.
1. For the first critical speed, note the speed at which the amplitude peaks and the
phase changes by 90o, critical speed = ___________________ rpm.
2. Note the peak amplitude when the rotor has reached the first critical speed, Ac = _______________________.
3. Note the amplitude when the rotor has exceeded the first critical speed, Ah =
_______________________.
4. Calculate the amplification factor, q = Ac / Ah, q = ____________________.
5. Repeat steps 1 thru 4 for each additional critical speed. Each critical speed should have its amplification factor calculated because each critical speed will excite differing portions of the machine structure/components, each exhibiting various amounts of damping.
How to determine critical speeds and amplification factors using Polar plots.
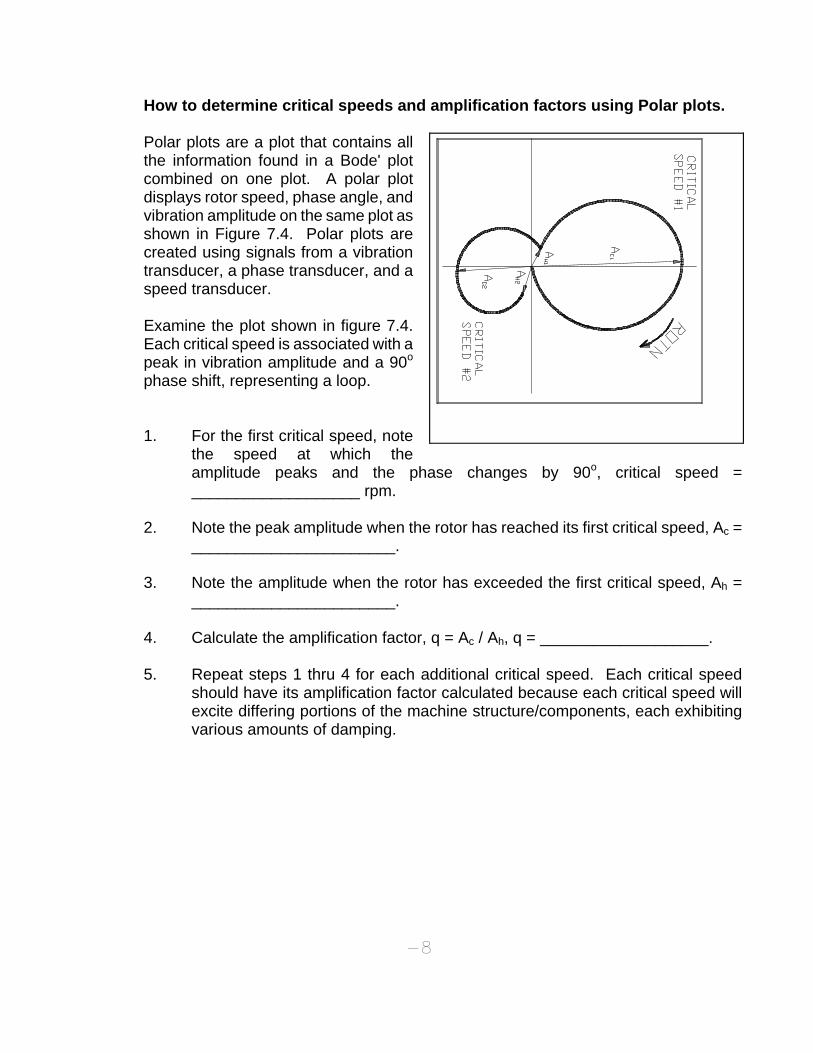
Polar plots are a plot that contains all the information found in a Bode' plot combined on one plot. A polar plot displays rotor speed, phase angle, and vibration amplitude on the same plot as shown in Figure 7.4. Polar plots are created using signals from a vibration transducer, a phase transducer, and a speed transducer.
-8
Examine the plot shown in figure 7.4. Each critical speed is associated with a peak in vibration amplitude and a 90o phase shift, representing a loop.
1. For the first critical speed, note the speed at which the amplitude peaks and the phase changes by 90o, critical speed = ___________________ rpm.
2. Note the peak amplitude when the rotor has reached its first critical speed, Ac =
_______________________.
3. Note the amplitude when the rotor has exceeded the first critical speed, Ah = _______________________.
4. Calculate the amplification factor, q = Ac / Ah, q = ___________________.
5. Repeat steps 1 thru 4 for each additional critical speed. Each critical speed
should have its amplification factor calculated because each critical speed will excite differing portions of the machine structure/components, each exhibiting various amounts of damping.
-1
Chapter 8. Rotor Bow
OBJECTIVE: A bowed or bent rotor can cause errors in vibration and phase measurements. Bowed rotors can inhibit attempts to correct rotor balance. Rotor bow manifests itself as a once per turn event and can be confused as unbalance. Since a rotor bow is a physical constant its effect upon vibration measurements is a constant.
Observing vibration amplitude and phase measurements while the rotor operates at slow speed will reveal the amount of rotor bow and its orientation with respect to the phase pickup. Once the amount of rotor bow has been measured it can be subtracted from the actual vibration and phase measurements.
Occasionally, a rotor bow will exist under specific circumstances. These circumstances are created due to metallurgical conditions within the rotor that induce a bow in a rotor either when the rotor is cold or hot.
This topic will show:
1. How to identify a rotor bow using time based vibration measurements,
2. How to identify a rotor bow using frequency based vibration measurements.
Specific test measurement instrumentation required for this demonstration include:
Oscilloscope, dual channel
DC Power Supply, -24 VDC
FFT Analyzer
Three (3) Eddy Current Transducers
Demonstration Rotor and Instrumentation Setup
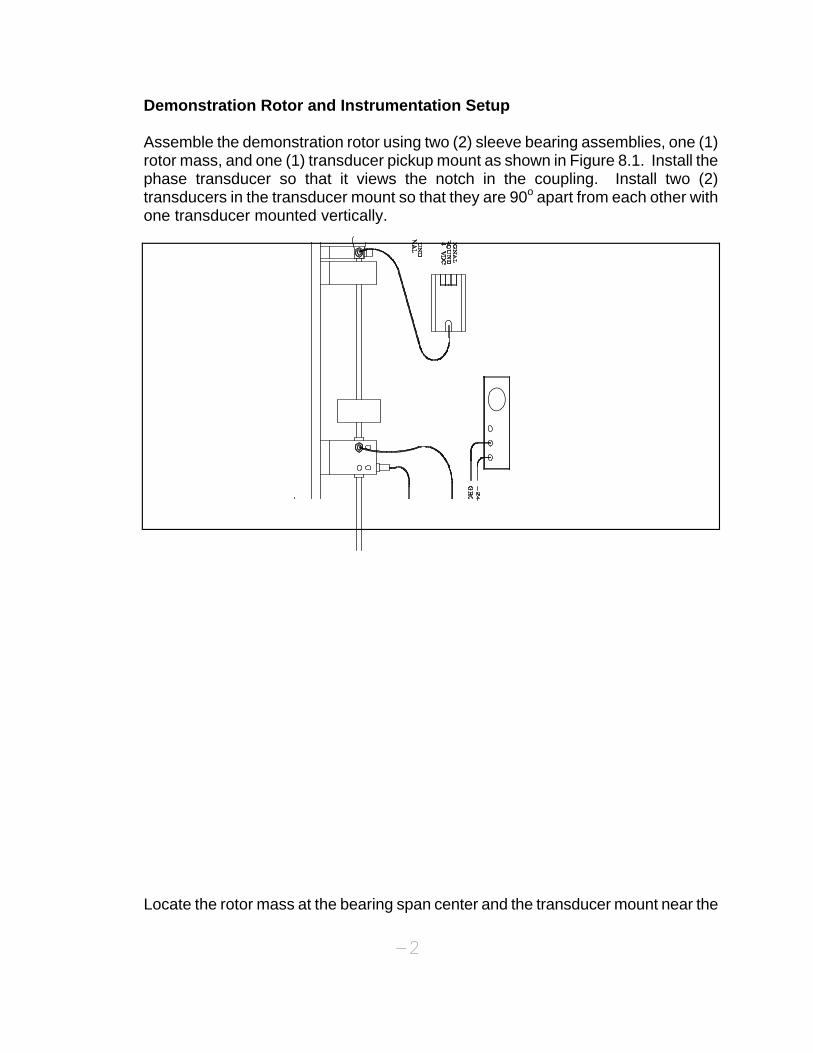
Assemble the demonstration rotor using two (2) sleeve bearing assemblies, one (1) rotor mass, and one (1) transducer pickup mount as shown in Figure 8.1. Install the phase transducer so that it views the notch in the coupling. Install two (2) transducers in the transducer mount so that they are 90o apart from each other with one transducer mounted vertically.
Locate the rotor mass at the bearing span center and the transducer mount near the -2
-3
rotor mass.
PROCEDURE:
How to identify a rotor bow using time based vibration measurements.
1. Apply power to the transducers and calibrate the transducers as described in topics 2 and 3, Dual Proximity Transducer and Phase Transducer.
2. Connect the vertical vibration transducer to the Y oscilloscope channel and
connect the horizontal vibration transducer to the X oscilloscope channel. Connect the phase transducer to oscilloscope external trigger and to Z-axis intensity inputs.
3. Adjust the oscilloscope controls for DC coupled, 200 mv/division, external
trigger, and XY operation. Center the oscilloscope display.
-4
4. Induce a slight bow in the rotor by applying pressure to the rotor mass.
5. While observing the oscilloscope, operate the rotor at a slow speed. The oscilloscope display should have an orbit present.
6. Note the location at which the oscilloscope dot brightens due to the z-axis
intensification. This location will locate the shaft orientation, with respect to one of the transducers, where the rotor bow is at its maximum. Vertical transducer phase = _______________ degrees, horizontal transducer phase = _______________ degrees.
7 Note the vertical and horizontal vibration amplitudes. Vertical amplitude =
_______________ mils, horizontal amplitude = _______________ mils. These readings provide the rotor bow magnitude.
8. Readjust the oscilloscope display so that two time traces are present with the
vertical transducer displayed above the horizontal transducer. Adjust the time sweep so that one or two vibration cycles are displayed.
9. Observing the oscilloscope display, measure the phase angle with respect to
each NCPU. Vertical NCPU phase = ________________ degrees. Horizontal NCPU phase = ________________ degrees. These readings should agree with readings obtained in step 6 above.
10 Note the vertical and horizontal vibration amplitudes. Vertical amplitude =
_______________ mils, horizontal amplitude = _______________ mils. These readings provide the rotor bow magnitude. These readings should agree with readings obtained in step 7 above.
11. Stop the rotor.
12. To correct the rotor bow: Manually rotate the rotor so that the phase notch is
located under the phase NCPU. Using either the vertical or horizontal readings noted in step 6 or 9 above, locate the point at which the rotor bow maximum exists (remember that phase is measured against rotor rotation). Apply pressure at this location to correct the rotor bow.
How to identify a rotor bow using frequency based vibration measurements.
1. Apply power to the transducers and calibrate the transducers as described in topics 2 and 3, Dual Transducer and Phase Transducer.
2. Connect the vertical vibration transducer to the Y FFT analyzer channel and
connect the horizontal vibration transducer to the X FFT analyzer channel. Connect the phase transducer to the external trigger input.
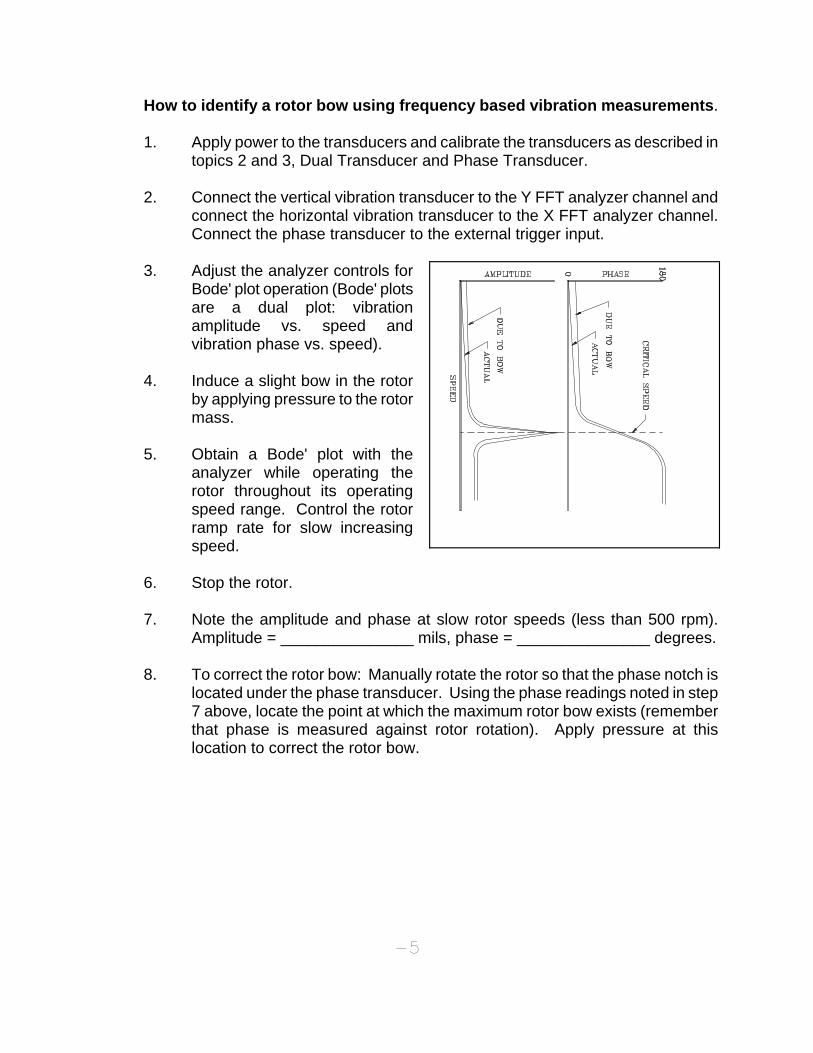
3. Adjust the analyzer controls for
Bode' plot operation (Bode' plots are a dual plot: vibration amplitude vs. speed and vibration phase vs. speed).
4. Induce a slight bow in the rotor
by applying pressure to the rotor mass.
5. Obtain a Bode' plot with the
analyzer while operating the rotor throughout its operating speed range. Control the rotor ramp rate for slow increasing speed.
6. Stop the rotor.
7. Note the amplitude and phase at slow rotor speeds (less than 500 rpm).
Amplitude = _______________ mils, phase = _______________ degrees.
8. To correct the rotor bow: Manually rotate the rotor so that the phase notch is located under the phase transducer. Using the phase readings noted in step 7 above, locate the point at which the maximum rotor bow exists (remember that phase is measured against rotor rotation). Apply pressure at this location to correct the rotor bow.
-5
-1
Chapter 9. ROTOR RUBBING
OBJECTIVE: Machinery rubs can cause severe damage to internal parts. Rubs are a kind of self correcting condition; they will eliminate the rubbing condition either by destroying the entire machine or re-machine the interfering clearances sufficiently to allow continued operation. The previous situation is to be avoided and the latter can have significant impacts upon process, product, and operation efficiency.
Rubbing may be initiated by excessive vibration amplitudes as the rotor passes a "critical" speed or a ratio of the "critical" speed. At each of these speeds specific spectral frequencies are generated.
Once the first "critical" speed is known the spectral frequencies of higher speeds can be identified. These higher speed frequencies follow fundamental rules as follows:
1. At rotor speeds up to twice the first "critical": the spectrum may contain 1X,
2X, 3X, etc. with the fundamental frequency (1X) having the largest amplitude,
2. At rotor speeds greater than twice the first "critical", but less than three times
the first "critical": the spectrum will contain the same frequency content as listed in item 1. above with additional frequencies at half frequencies (0.5X, 1.5X, 2.5X, etc.). The lowest frequency in this spectrum will have the largest amplitude.
3. At rotor speeds greater than three times the first "critical", but less than four
times the first "critical": the spectrum will contain the same frequency content as listed in item 1. above with additional frequencies at one third frequencies (0.33X, 0.66X, 1.33X, 1.66X, etc.). The lowest frequency in this spectrum will have the largest amplitude.
This topic will show:
1. How to identify rubbing conditions using time based measurements,
2. How to identify rubbing conditions using frequency based measurements.
-2
Specific test measurement instrumentation required for this demonstration include:
Oscilloscope, dual channel
DC Power Supply, -24 VDC
FFT Analyzer
Three (3) Eddy Current Transducers
Brass rubbing screw
Speed readout instrumentation
Long Base Rotor Kit With Long Shaft
Demonstration Rotor and Instrumentation Setup
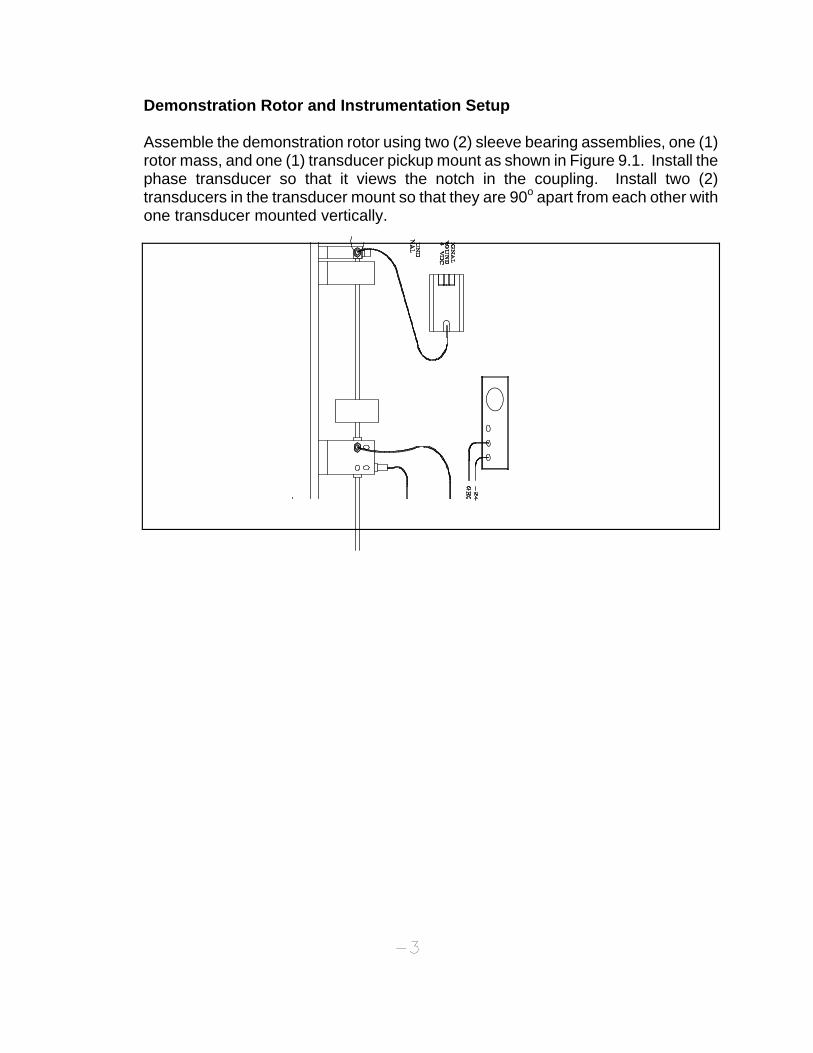
Assemble the demonstration rotor using two (2) sleeve bearing assemblies, one (1) rotor mass, and one (1) transducer pickup mount as shown in Figure 9.1. Install the phase transducer so that it views the notch in the coupling. Install two (2) transducers in the transducer mount so that they are 90o apart from each other with one transducer mounted vertically.
-3
Locate the rotor mass at the bearing span center and the transducer mount near the rotor mass. Locate the brass screw mount near the rotor mass.
PROCEDURE:
How to identify rubbing conditions using time based measurements
1. Apply power to the transducerss and calibrate the transducers as described
in topics 2 and 3.
2. Connect the vertical vibration transducer to the Y oscilloscope channel and connect the horizontal vibration transducer to the X oscilloscope channel. Connect the phase transducer to the oscilloscope external trigger and to the Z-axis intensity inputs.
3. Adjust the oscilloscope controls for AC coupled, 200 mv/division, external
trigger, and XY operation. Center the oscilloscope display.
4. Identify the "critical" speed as described in topic 6, Critical Speeds - Single Mass Rotor.
5. Operate the rotor at a speed greater than the "critical" speed.
6. Lightly induce a rub by screwing the brass screw until it touches the rotor
shaft.
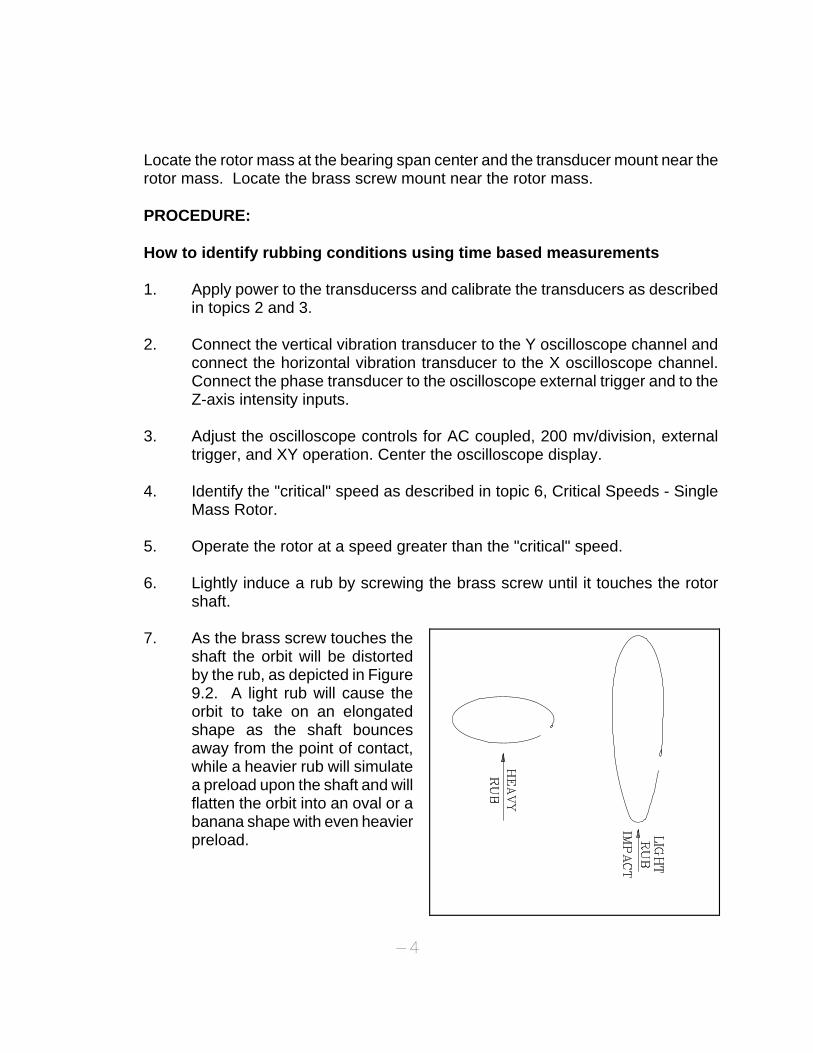
7. As the brass screw touches the shaft the orbit will be distorted by the rub, as depicted in Figure 9.2. A light rub will cause the orbit to take on an elongated shape as the shaft bounces away from the point of contact, while a heavier rub will simulate a preload upon the shaft and will flatten the orbit into an oval or a banana shape with even heavier preload.
-4
How to identify rubbing conditions using frequency based measurements
1. Apply power to the transducers and calibrate the transducers as described in topics 2 and 3.
2. Connect the vertical vibration transducer to the Y FFT Analyzer channel.
3. Adjust the FFT Analyzer controls for 20 mil amplitude and 40,000 cpm
frequency range.
4. Operate the rotor at a speed greater than the "critical" speed identified in the previous section of this topic.
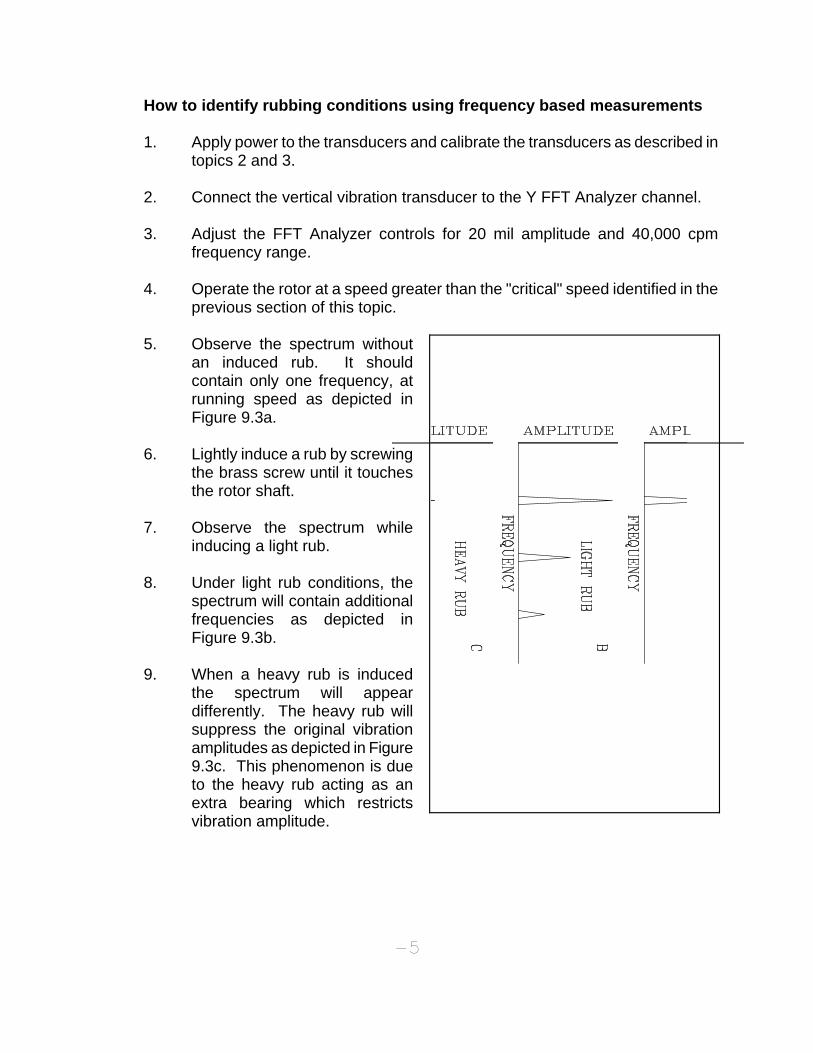
5. Observe the spectrum without
an induced rub. It should contain only one frequency, at running speed as depicted in Figure 9.3a.
-5
6. Lightly induce a rub by screwing
the brass screw until it touches the rotor shaft.
7. Observe the spectrum while
inducing a light rub.
8. Under light rub conditions, the spectrum will contain additional frequencies as depicted in Figure 9.3b.
9. When a heavy rub is induced
the spectrum will appear differently. The heavy rub will suppress the original vibration amplitudes as depicted in Figure 9.3c. This phenomenon is due to the heavy rub acting as an extra bearing which restricts vibration amplitude.
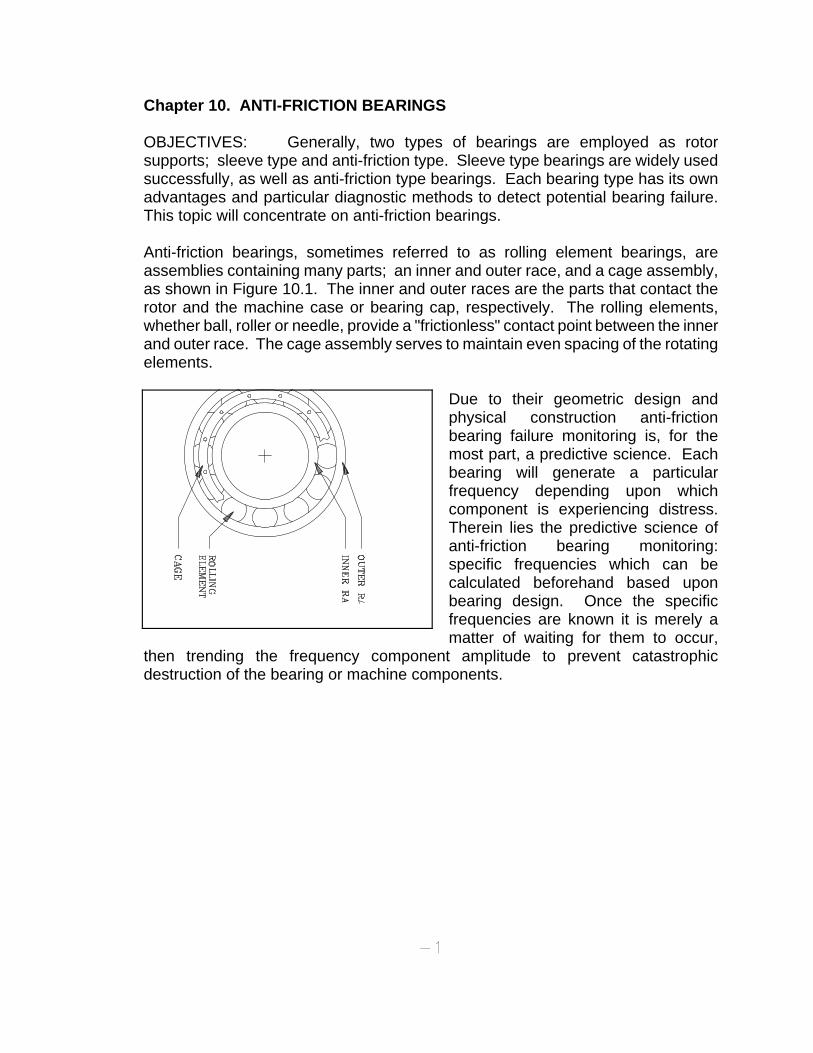
Chapter 10. ANTI-FRICTION BEARINGS OBJECTIVES: Generally, two types of bearings are employed as rotor supports; sleeve type and anti-friction type. Sleeve type bearings are widely used successfully, as well as anti-friction type bearings. Each bearing type has its own advantages and particular diagnostic methods to detect potential bearing failure. This topic will concentrate on anti-friction bearings. Anti-friction bearings, sometimes referred to as rolling element bearings, are assemblies containing many parts; an inner and outer race, and a cage assembly, as shown in Figure 10.1. The inner and outer races are the parts that contact the rotor and the machine case or bearing cap, respectively. The rolling elements, whether ball, roller or needle, provide a "frictionless" contact point between the inner and outer race. The cage assembly serves to maintain even spacing of the rotating elements.
Due to their geometric design and physical construction anti-friction bearing failure monitoring is, for the most part, a predictive science. Each bearing will generate a particular frequency depending upon which component is experiencing distress. Therein lies the predictive science of anti-friction bearing monitoring: specific frequencies which can be calculated beforehand based upon bearing design. Once the specific frequencies are known it is merely a matter of waiting for them to occur,
then trending the frequency component amplitude to prevent catastrophic destruction of the bearing or machine components.
-1
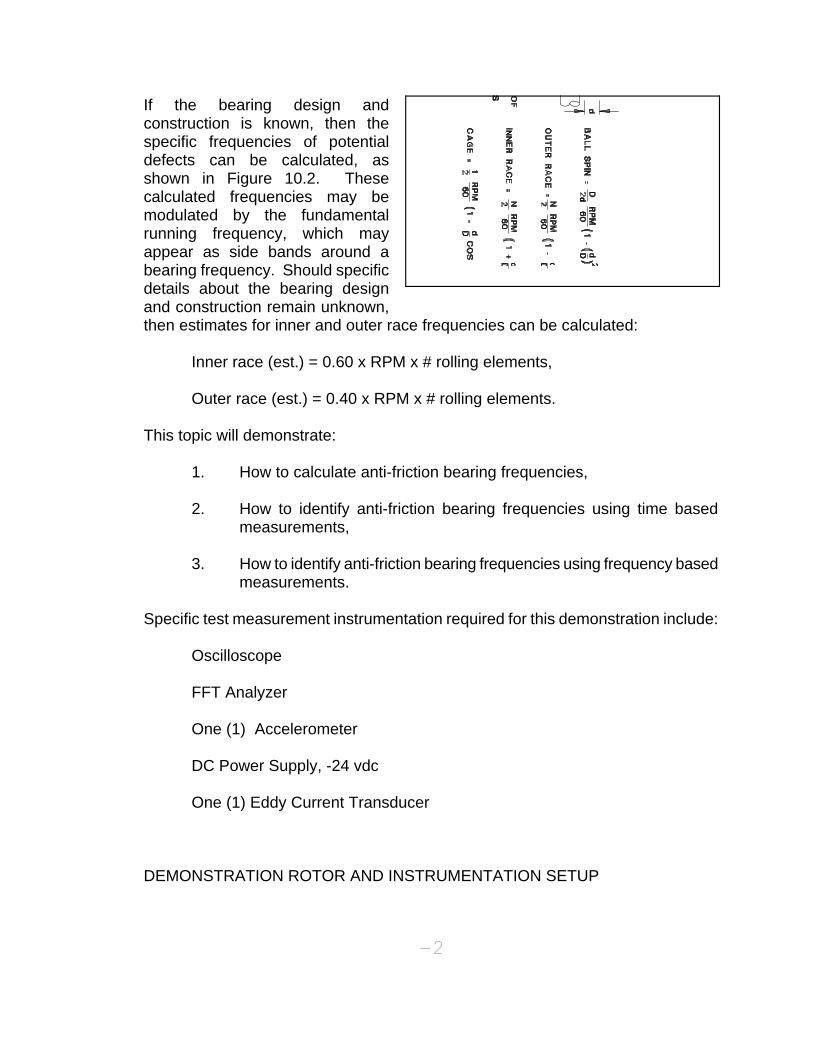
If the bearing design and construction is known, then the specific frequencies of potential defects can be calculated, as shown in Figure 10.2. These calculated frequencies may be modulated by the fundamental running frequency, which may appear as side bands around a bearing frequency. Should specific details about the bearing design and construction remain unknown, then estimates for inner and outer race frequencies can be calculated:
Inner race (est.) = 0.60 x RPM x # rolling elements,
Outer race (est.) = 0.40 x RPM x # rolling elements.
This topic will demonstrate:
1. How to calculate anti-friction bearing frequencies,
2. How to identify anti-friction bearing frequencies using time based measurements,
3. How to identify anti-friction bearing frequencies using frequency based
measurements. Specific test measurement instrumentation required for this demonstration include:
Oscilloscope
FFT Analyzer
One (1) Accelerometer
DC Power Supply, -24 vdc
One (1) Eddy Current Transducer DEMONSTRATION ROTOR AND INSTRUMENTATION SETUP
-2
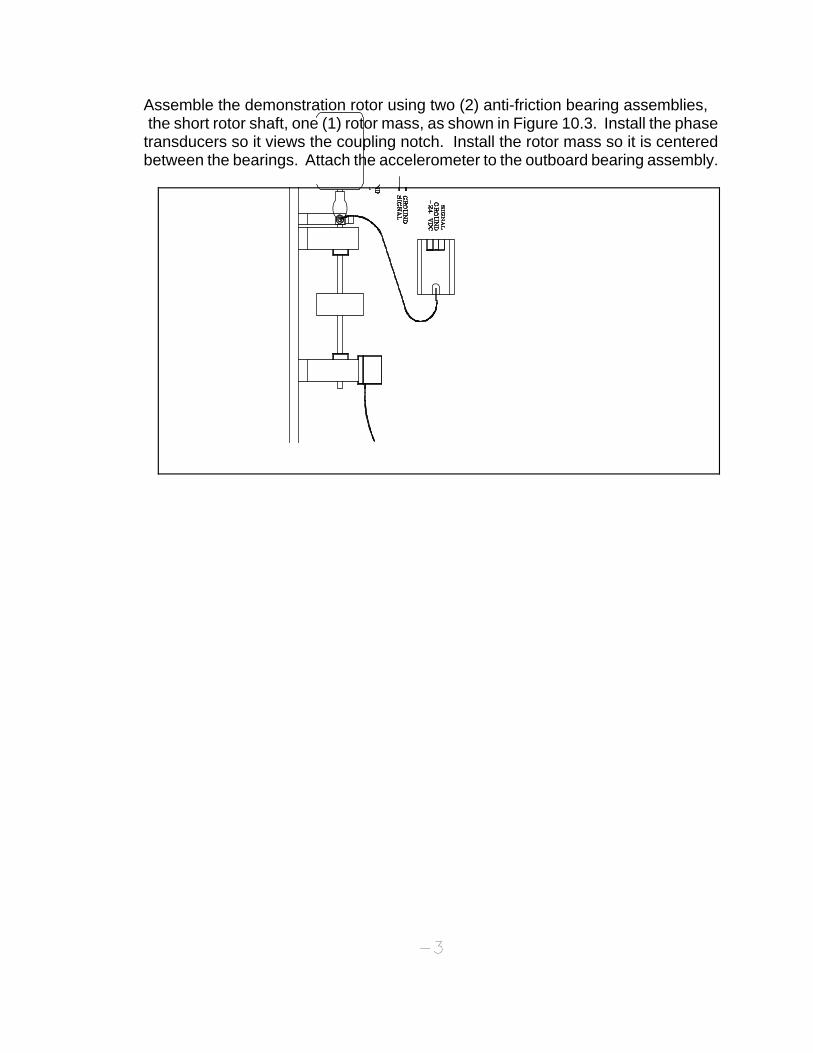
Assemble the demonstration rotor using two (2) anti-friction bearing assemblies, the short rotor shaft, one (1) rotor mass, as shown in Figure 10.3. Install the phase transducers so it views the coupling notch. Install the rotor mass so it is centered between the bearings. Attach the accelerometer to the outboard bearing assembly.
-3
-4
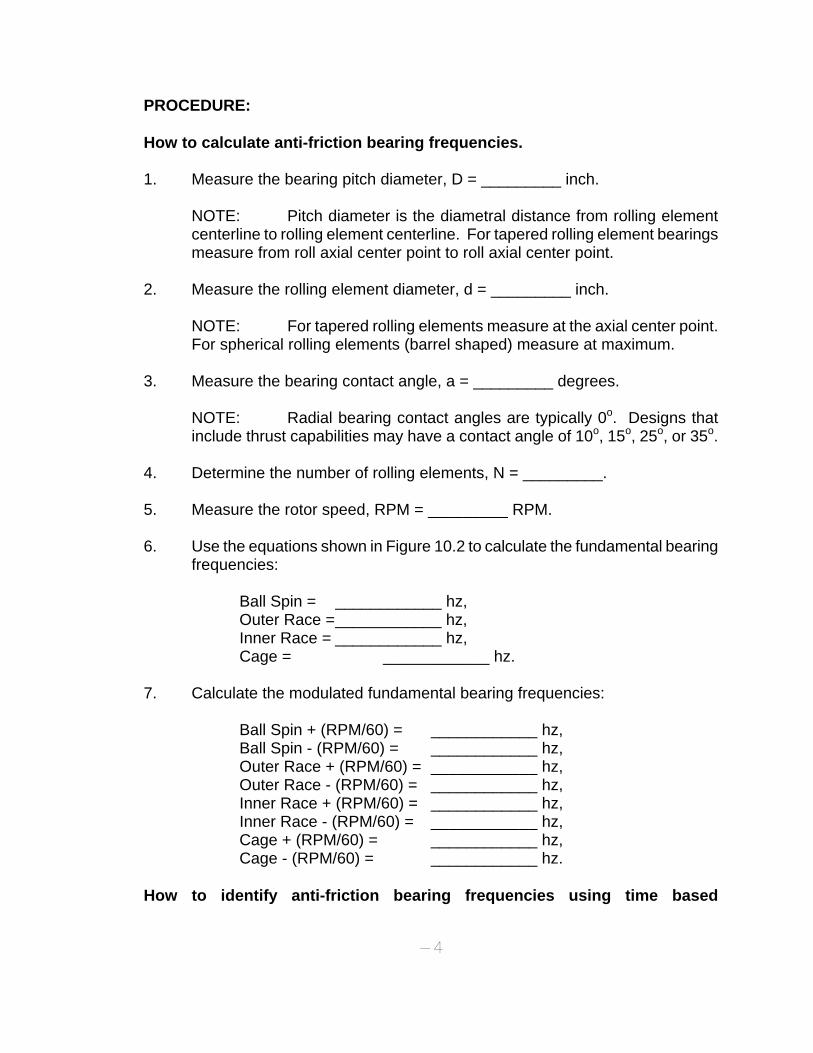
PROCEDURE: How to calculate anti-friction bearing frequencies. 1. Measure the bearing pitch diameter, D = _________ inch.
NOTE: Pitch diameter is the diametral distance from rolling element centerline to rolling element centerline. For tapered rolling element bearings measure from roll axial center point to roll axial center point.
2. Measure the rolling element diameter, d = _________ inch.
NOTE: For tapered rolling elements measure at the axial center point. For spherical rolling elements (barrel shaped) measure at maximum.
3. Measure the bearing contact angle, a = _________ degrees.
NOTE: Radial bearing contact angles are typically 0o. Designs that include thrust capabilities may have a contact angle of 10o, 15o, 25o, or 35o.
4. Determine the number of rolling elements, N = _________. 5. Measure the rotor speed, RPM = _________ RPM. 6. Use the equations shown in Figure 10.2 to calculate the fundamental bearing
frequencies:
Ball Spin = ____________ hz, Outer Race = ____________ hz, Inner Race = ____________ hz, Cage = ____________ hz.
7. Calculate the modulated fundamental bearing frequencies:
Ball Spin + (RPM/60) = ____________ hz, Ball Spin - (RPM/60) = ____________ hz, Outer Race + (RPM/60) = ____________ hz, Outer Race - (RPM/60) = ____________ hz, Inner Race + (RPM/60) = ____________ hz, Inner Race - (RPM/60) = ____________ hz, Cage + (RPM/60) = ____________ hz, Cage - (RPM/60) = ____________ hz.
How to identify anti-friction bearing frequencies using time based
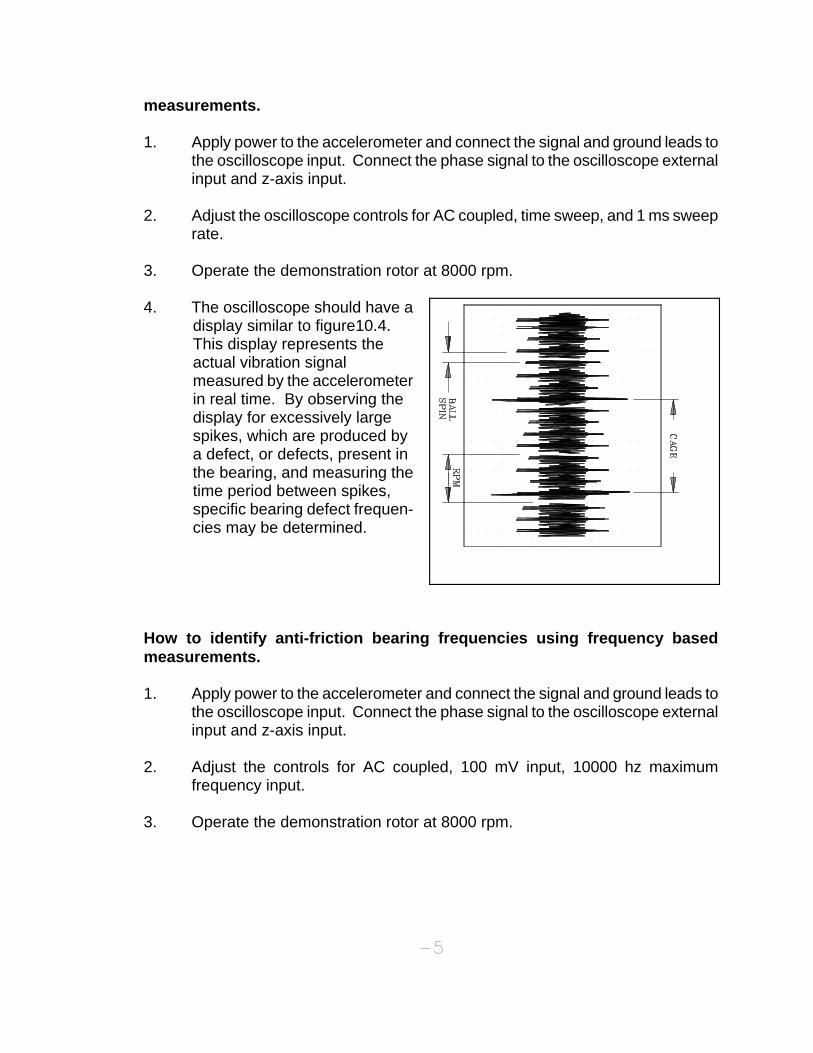
measurements. 1. Apply power to the accelerometer and connect the signal and ground leads to
the oscilloscope input. Connect the phase signal to the oscilloscope external input and z-axis input.
2. Adjust the oscilloscope controls for AC coupled, time sweep, and 1 ms sweep
rate. 3. Operate the demonstration rotor at 8000 rpm. 4. The oscilloscope should have a
display similar to figure10.4. This display represents the actual vibration signal measured by the accelerometer in real time. By observing the display for excessively large spikes, which are produced by a defect, or defects, present in the bearing, and measuring the time period between spikes, specific bearing defect frequen- cies may be determined. How to identify anti-friction bearing frequencies using frequency based measurements. 1. Apply power to the accelerometer and connect the signal and ground leads to
the oscilloscope input. Connect the phase signal to the oscilloscope external input and z-axis input.
2. Adjust the controls for AC coupled, 100 mV input, 10000 hz maximum
frequency input. 3. Operate the demonstration rotor at 8000 rpm.
-5
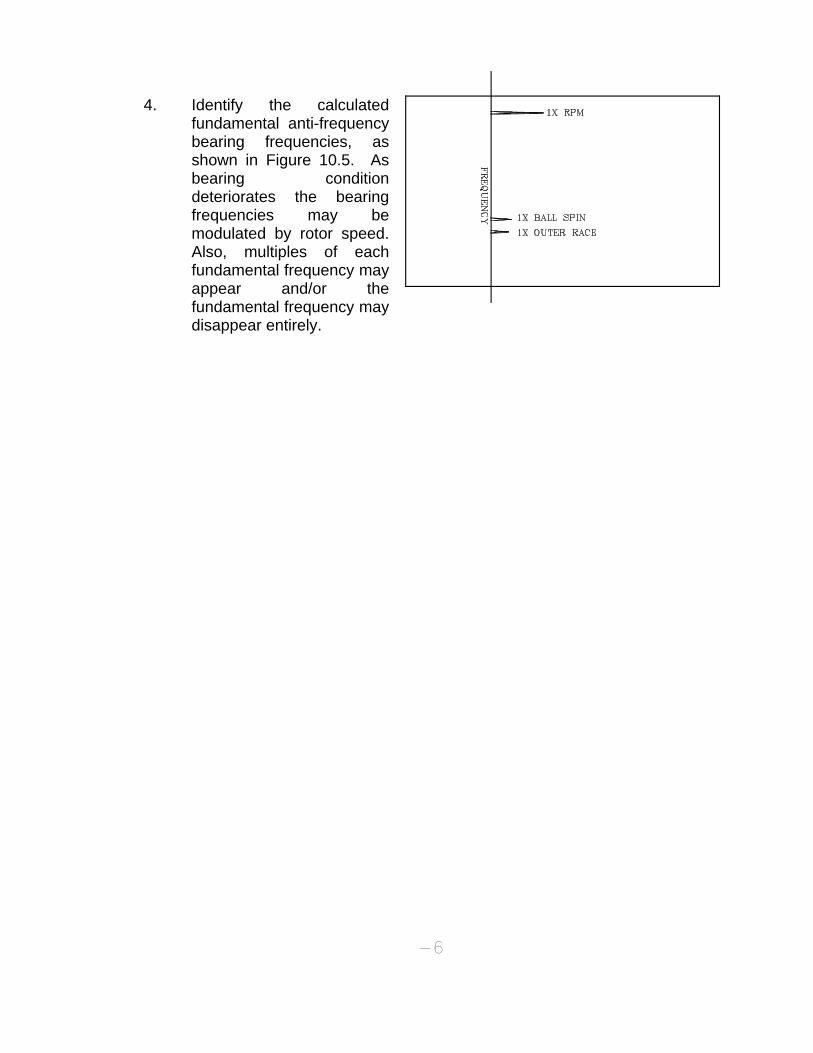
4. Identify the calculated fundamental anti-frequency bearing frequencies, as shown in Figure 10.5. As bearing condition deteriorates the bearing frequencies may be modulated by rotor speed. Also, multiples of each fundamental frequency may appear and/or the fundamental frequency may disappear entirely.
-6
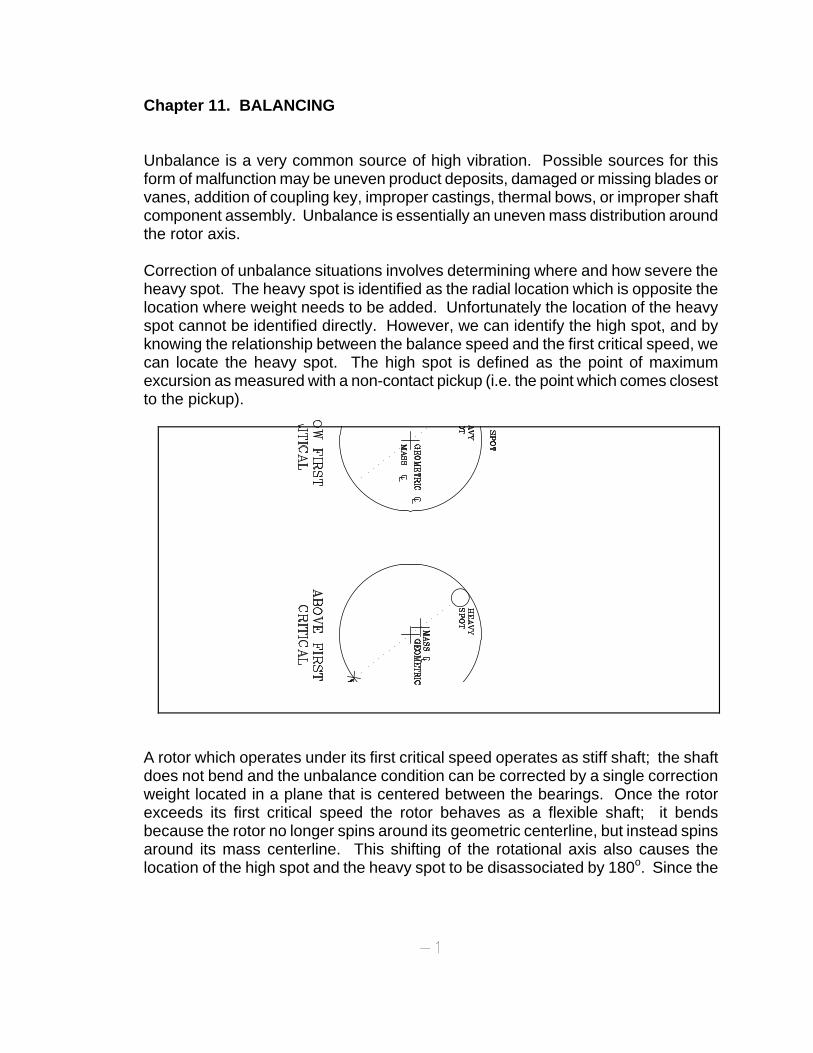
Chapter 11. BALANCING Unbalance is a very common source of high vibration. Possible sources for this form of malfunction may be uneven product deposits, damaged or missing blades or vanes, addition of coupling key, improper castings, thermal bows, or improper shaft component assembly. Unbalance is essentially an uneven mass distribution around the rotor axis. Correction of unbalance situations involves determining where and how severe the heavy spot. The heavy spot is identified as the radial location which is opposite the location where weight needs to be added. Unfortunately the location of the heavy spot cannot be identified directly. However, we can identify the high spot, and by knowing the relationship between the balance speed and the first critical speed, we can locate the heavy spot. The high spot is defined as the point of maximum excursion as measured with a non-contact pickup (i.e. the point which comes closest to the pickup).
A rotor which operates under its first critical speed operates as stiff shaft; the shaft does not bend and the unbalance condition can be corrected by a single correction weight located in a plane that is centered between the bearings. Once the rotor exceeds its first critical speed the rotor behaves as a flexible shaft; it bends because the rotor no longer spins around its geometric centerline, but instead spins around its mass centerline. This shifting of the rotational axis also causes the location of the high spot and the heavy spot to be disassociated by 180o. Since the
-1
transducer senses the high spot, we will see a 180o shift in phase measurements as the rotational axis is shifted (and a critical speed is surpassed), as was demonstrated in previous chapters and shown in Figure 11.1. Thus correcting an unbalance condition involves:
Using phase measurements to locate the high spot orientation,
Determining the relationship of the balance speed to the critical speeds to locate the heavy spot,
Finding the magnitude of the unbalance by measuring the influence of correction weights.
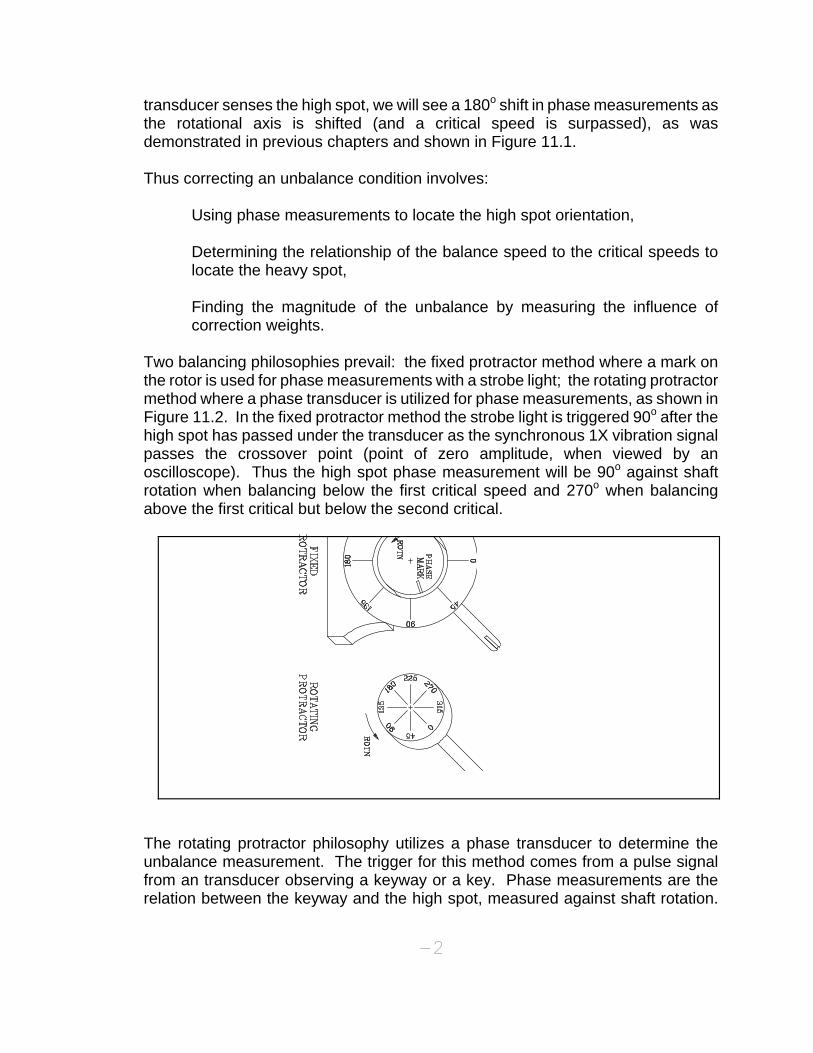
Two balancing philosophies prevail: the fixed protractor method where a mark on the rotor is used for phase measurements with a strobe light; the rotating protractor method where a phase transducer is utilized for phase measurements, as shown in Figure 11.2. In the fixed protractor method the strobe light is triggered 90o after the high spot has passed under the transducer as the synchronous 1X vibration signal passes the crossover point (point of zero amplitude, when viewed by an oscilloscope). Thus the high spot phase measurement will be 90o against shaft rotation when balancing below the first critical speed and 270o when balancing above the first critical but below the second critical.
The rotating protractor philosophy utilizes a phase transducer to determine the unbalance measurement. The trigger for this method comes from a pulse signal from an transducer observing a keyway or a key. Phase measurements are the relation between the keyway and the high spot, measured against shaft rotation.
-2
-3
Once a rotor has been balanced, or has had a trial weight installed that produces a change in vibration amplitude or phase, an unbalance constant can be calculated which can be used in future balance attempts. Each rotor will have a different unbalance constant, given in units of weight per amplitude (lbs/mil, oz/mil, gm/in/sec, etc.). This demonstration will show: 1. How to conduct one plane balancing when operating under the first critical
speed 2. How to conduct one plane balancing when operating above the first critical
speed 3. How to conduct two plane balancing when operating under the first critical
speed 4. How to conduct two plane balancing when operating above the first critical
speed 5. How to calculate the unbalance constant for a rotor Specific test measurement instrumentation required for this demonstration include:
Two (2) Eddy Current Transducers
Speed measurement instrumentation, Digital or equivalent
Phase pickup, Eddy Current Transducers
DC Power Supply, -24 VDC
Vibration instrumentation
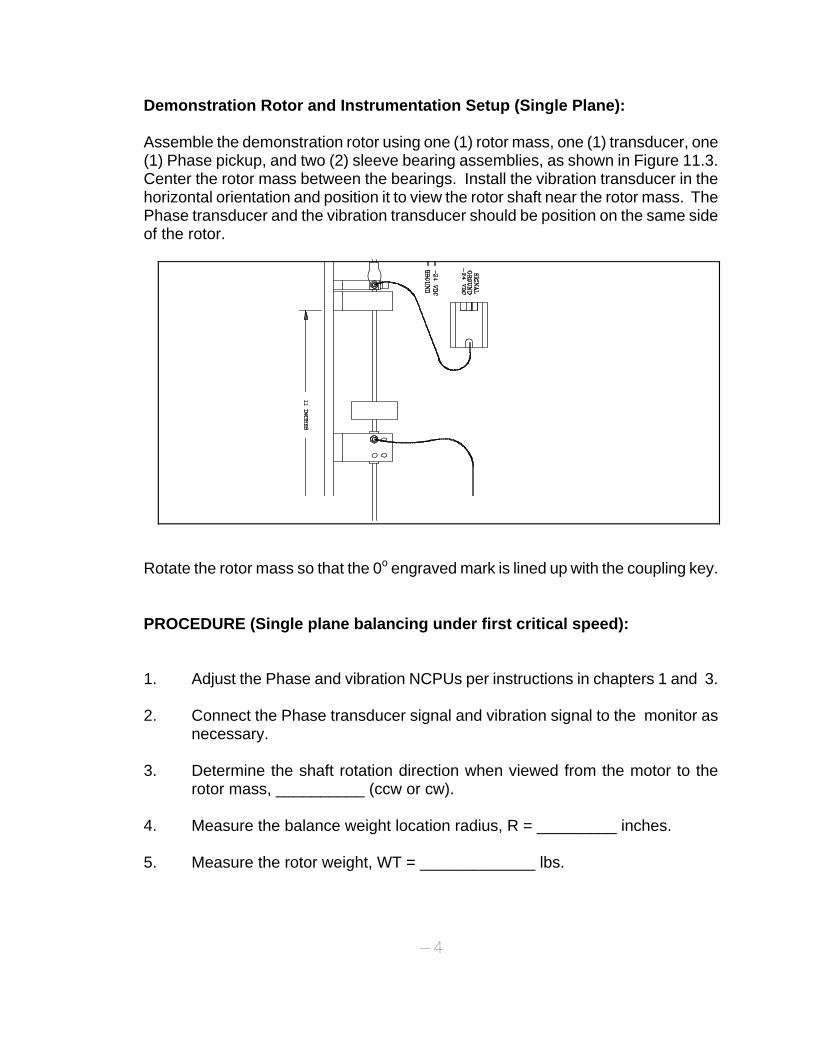
Demonstration Rotor and Instrumentation Setup (Single Plane): Assemble the demonstration rotor using one (1) rotor mass, one (1) transducer, one (1) Phase pickup, and two (2) sleeve bearing assemblies, as shown in Figure 11.3. Center the rotor mass between the bearings. Install the vibration transducer in the horizontal orientation and position it to view the rotor shaft near the rotor mass. The Phase transducer and the vibration transducer should be position on the same side of the rotor.
Rotate the rotor mass so that the 0o engraved mark is lined up with the coupling key. PROCEDURE (Single plane balancing under first critical speed): 1. Adjust the Phase and vibration NCPUs per instructions in chapters 1 and 3. 2. Connect the Phase transducer signal and vibration signal to the monitor as
necessary. 3. Determine the shaft rotation direction when viewed from the motor to the
rotor mass, __________ (ccw or cw). 4. Measure the balance weight location radius, R = _________ inches. 5. Measure the rotor weight, WT = _____________ lbs.
-4
-5
6. Operate the demonstration rotor over its entire operating speed. Determine the first critical speed, WR = __________ rpm.
7. Operate the demonstration rotor at 500 rpm below the first critical speed.
Note the balance speed here, SPD = ___________ rpm. 8. Record the vibration amplitude, V = ___________ inches. 9. Measure the phase angle, A = _________ degrees. 10. Determine the location of the heavy spot (remember that the high spot and
heavy spot are coincident when operating below the first critical speed), Heavy Spot = ___________ degrees.
11. Stop the rotor. 12. Calculate the Correction Weight (CW) as follows.
WR2 = K/M
CF = (V x K)/2
CF = (CW x R x SPD2)/G
where
CF = Centrifugal Force due to unbalance (lbs) WR = First critical speed (rpm) K = Rotor spring constant (lb/in) M = Rotor mass (rotor weight (lbs)/G) G = Acceleration of gravity (386.4 in/s2) V = Peak-to-Peak vibration (inch) SPD= Balance speed (rpm x 0.1047 rad/s) CW = Correction weight (lbs) R = Balance weight radius (inch)
Solve for CW.
CW = _______________ lbs.
13. Install the correction weight 180o opposite from the heavy spot. 14. Operate the rotor at the balance speed, SPD. Record the new vibration
amplitude, V1 = ____________ inches, and the new phase angle, A1 =
-6
___________ degrees. PROCEDURE (Single plane balancing above first critical speed): 1. Adjust the Phase and vibration transducers per instructions in Chapters 1
and 3, respectively. 2. Connect the Phase NCPU signal and vibration signal to the monitor as
necessary. 3. Determine the shaft rotation direction when viewed from the motor to the
rotor mass, __________ (ccw or cw). 4. Measure the balance weight location radius, R = _________ inches. 5. Measure the rotor weight, WT = _____________ lbs. 6. Operate the demonstration rotor over its entire operating speed. Determine
the first critical speed, WR = __________ rpm. 7. Operate the demonstration rotor at 1000 rpm above the first critical speed.
Note the balance speed here, SPD = ___________ rpm. 8. Record the vibration amplitude, V = ___________ inches. 9. Measure the phase angle, A = _________ degrees. 10. Determine the location of the heavy spot (remember that the high spot and
heavy spot are 180o apart when operating above the first critical speed), Heavy Spot = ___________ degrees.
11. Stop the rotor. 12. Calculate the Correction Weight (CW) as follows.
CF = WT x V x SPD2/(2 x G)
CF = CW x R x SPD2/G
where
CF = Centrifugal Force due to unbalance (lbs) WT = Rotor weight (lbs) G = Acceleration of gravity (386.4 in/s2) V = Peak-to-Peak vibration (inch) SPD= Balance speed (rpm x 0.1047 rad/s) CW = Correction weight (lbs) R = Balance weight radius (inch)
Solve for CW.
CW = _______________ lbs.
13. Install the correction weight 180o opposite from the heavy spot. 14. Operate the rotor at the balance speed, SPD. Record the new vibration
amplitude, V1 = ____________ inches, and the new phase angle, A1 = ___________ degrees.
-7
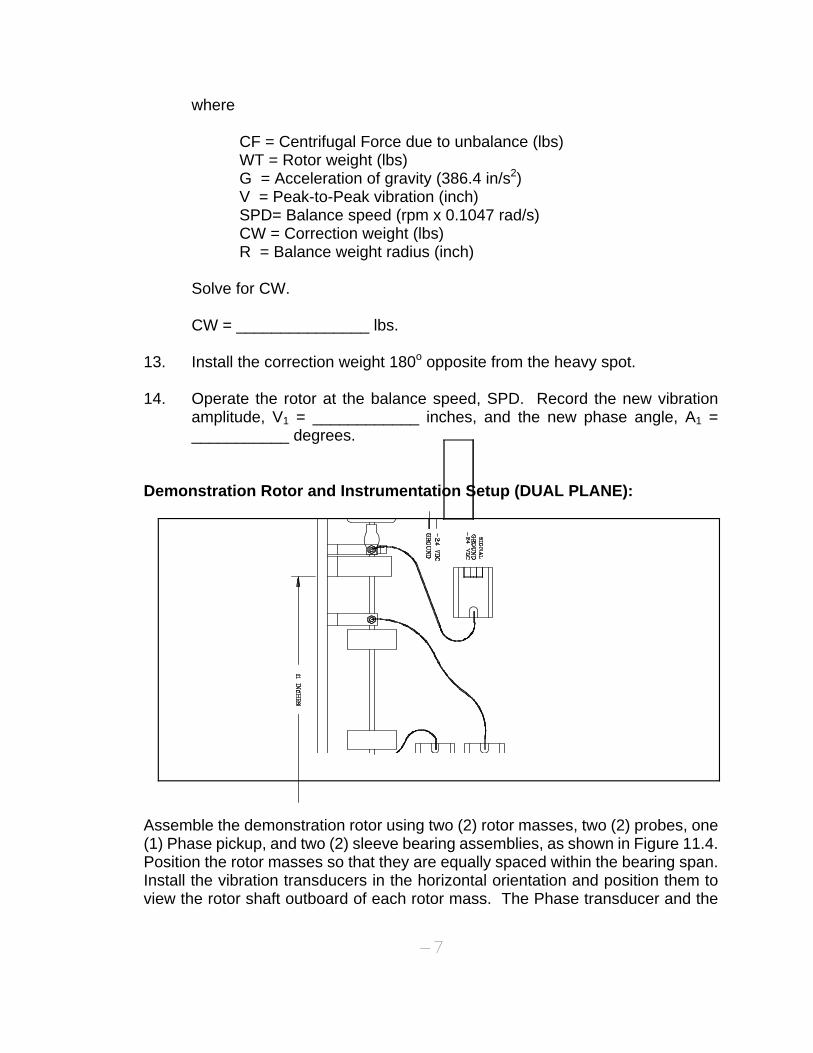
Demonstration Rotor and Instrumentation Setup (DUAL PLANE):
Assemble the demonstration rotor using two (2) rotor masses, two (2) probes, one (1) Phase pickup, and two (2) sleeve bearing assemblies, as shown in Figure 11.4. Position the rotor masses so that they are equally spaced within the bearing span. Install the vibration transducers in the horizontal orientation and position them to view the rotor shaft outboard of each rotor mass. The Phase transducer and the
-8
vibration transducer should be position on the same side of the rotor.Rotate the rotor masses so that the 0o engraved marks are lined up with the coupling key. PROCEDURE (Dual plane balancing under first critical speed): 1. Adjust the Phase and vibration transducers per instructions in Chapters 1
and 3, respectively. 2. Connect the Phase transducer signal and vibration signal to the monitor as
necessary. 3. Determine the shaft rotation direction when viewed from the motor to the
rotor mass, __________ (ccw or cw). 4. Measure the inboard balance weight location radius, RI = _________ inches.
Measure the outboard balance weight location radius, RO = _________ inches.
5. Measure the rotor weight, WT = _____________ lbs. 6. Operate the demonstration rotor over its entire operating speed. Determine
the first critical speed, WR = __________ rpm. 7. Operate the demonstration rotor at 500 rpm below the first critical speed.
Note the balance speed here, SPD = ___________ rpm. 8. Record the inboard vibration amplitude, VI = ___________ inches. Record
the outboard vibration amplitude, VO = ___________ inches. 9. Measure the inboard phase angle, AI = _________ degrees. Measure the
outboard phase angle, AO = _________ degrees. 10. Determine the location of the inboard heavy spot (remember that the high
spot and heavy spot are coincident when operating below the first critical speed), Inboard Heavy Spot = ___________ degrees. Determine the location of the outboard heavy spot , Outboard Heavy Spot = ___________ degrees.
11. Stop the rotor. 12. Calculate the Inboard Correction Weight (CWI) as follows.
WR2 = (2 x KI)/M
-9
CFI = (VI x KI)/2
CFI = (CWI x RI x SPD2)/G
where
CFI = Inboard Centrifugal Force due to unbalance (lbs) WR = First critical speed (rpm) KI = Inboard Rotor spring constant (lb/in) M = Rotor mass (rotor weight (lbs)/G) G = Acceleration of gravity (386.4 in/s2) VI = Inboard Peak-to-Peak vibration (inch) SPD = Balance speed (rpm x 0.1047 rad/s) CWI = Inboard Correction weight (lbs) RI = Inboard Balance weight radius (inch)
Solve for CWI.
Calculate the Outboard Correction Weight (CWO) as follows.
WR2 = (2 x KO)/M
CFO = (VO x KO)/2
CFO = (CWO x RO x SPD2)/G
where
CFO = Outboard Centrifugal Force due to unbalance (lbs) WR = First critical speed (rpm) KO = Outboard Rotor spring constant (lb/in) M = Rotor mass (rotor weight (lbs)/G) G = Acceleration of gravity (386.4 in/s2) VO = Outboard Peak-to-Peak vibration (inch) SPD = Balance speed (rpm x 0.1047 rad/s) CWO = Outboard Correction weight (lbs) RO = Outboard Balance weight radius (inch)
Solve for CWO.
CWI = _______________ lbs. CWO = _______________ lbs.
13. Install the inboard correction weight 180o opposite from its heavy spot and
-10
install the outboard correction weight 180o opposite from its heavy spot. 14. Operate the rotor at the balance speed, SPD. Record the new vibration
amplitudes, VI1 = ____________ inches, VO1 = ____________ inches, and the new phase angles, AI1 = ___________ degrees, AO1 = ___________ degrees.
PROCEDURE (Dual plane balancing above first critical speed): 1. Adjust the Phase and vibration NCPUs per instructions in Chapters 1 and 3,
respectively. 2. Connect the Phase transducer signal and vibration signal to the monitor as
necessary. 3. Determine the shaft rotation direction when viewed from the motor to the
rotor mass, __________ (ccw or cw). 4. Measure the balance weight location radius, R = _________ inches. 5. Measure the rotor weight, WT = _____________ lbs. 6. Operate the demonstration rotor over its entire operating speed. Determine
the first critical speed, WR = __________ rpm. 7. Operate the demonstration rotor at 1000 rpm above the first critical speed.
Note the balance speed here, SPD = ___________ rpm. 8. Record the inboard vibration amplitude, VI = ___________ inches and the
outboard vibration amplitude, VO = ___________ inches. 9. Measure the inboard phase angle, AI = _________ degrees and the outboard
phase angle, AO = _________ degrees. 10. Determine the location of the inboard heavy spot (remember that the high
spot and heavy spot are 180o apart when operating above the first critical speed), Inboard Heavy Spot = ___________ degrees. Determine the location of the outboard heavy spot outboard Heavy Spot = ___________ degrees.
11. Stop the rotor. 12. Calculate the Inboard Correction Weight (CWI) as follows.
-11
CFI = (WT/2) x VI x SPD2/(2 x G)
CFI = CWI x RI x SPD2/G where
CFI = Inboard Centrifugal Force due to unbalance
(lbs) WT = Rotor weight (lbs) G = Acceleration of gravity (386.4 in/s2) VI = Inboard Peak-to-Peak vibration (inch) SPD = Balance speed (rpm x 0.1047 rad/s) CWI = Inboard Correction weight (lbs) RI = Inboard Balance weight radius (inch)
Solve for CWI.
Calculate the Outboard Correction Weight (CWO) as follows.
CFO = (WT/2) x VO x SPD2/(2 x G)
CFO = CWO x RO x SPD2/G
-12
where
CFO = Outboard Centrifugal Force due to unbalance (lbs)
WT = Rotor weight (lbs) G = Acceleration of gravity (386.4 in/s2) VO = Outboard Peak-to-Peak vibration (inch) SPD = Balance speed (rpm x 0.1047 rad/s) CWO = Outboard Correction weight (lbs) RO = Outboard Balance weight radius (inch)
Solve for CWO.
CWI = _______________ lbs. CWO = _______________ lbs.
13. Install the inboard correction weight 180o opposite from its heavy spot. Install
the outboard correction weight 180o opposite from its heavy spot. 14. Operate the rotor at the balance speed, SPD. Record the new vibration
amplitudes, VI1 = ____________ inches, VO1 = ____________ inches, and the new phase angles, AI1 = ___________ degrees, AO1 = ___________ degrees.
PROCEDURE (Unbalance Constant Calculation): 1. Measure the final balance weight, CW = __________ lb.
Note the angular orientation of the final balance weight, angle = ______________ degrees.
NOTE: If multiple weights exist, they should be combined into an equivalent balance weight.
2. Measure the final vibration amplitude, A = _________ mil. 3. Calculate the unbalance constant, U = CW/A, U = __________ lb/mil. 4. Trim balancing is accomplished by measuring the current vibration amplitude
and multiplying the unbalance constant to the current vibration amplitude:
Trim balance = vibration amplitude x unbalance constant.
NOTE: Install the trim balance weight in the same angular orientation as the final balance weight.

Field Service
One-Plane Balance Work-Sheet 1P
Machine ID#:
Rotor Weight:
Description:
Rotor Speed:
Location:
Radius of Weight:
Date:
Trial Weight:
By:
Transducer Type:
Instrument#:
Phase Input Type:
Work-Sheet Step
Instructions
Amplitude
Angle
1.
Starting or Original (Reference) Vibration
2.
Trial or Calibration Weight (Weight/Angle)
3.
Trial Run Vibration
4.
Correction Weight (Weight/Angle)
Split Weight #1 (Weight/Angle)
Split Weight #2 (Weight/Angle)
5.
Trim Run #1 Vibration
6.
Correction Weight (Weight/Angle)
Split Weight #1 (Weight/Angle)
Split Weight #2 (Weight/Angle)
7.
Trim Run #2 Vibration
8.
Correction Weight (Weight/Angle)
Split Weight #1 (Weight/Angle)
Split Weight #2 (Weight/Angle)
9.
Trim Run #3 Vibration
Comments:
Copyright 1995, Sales Technology Inc. Gardnerville, Nevada USA
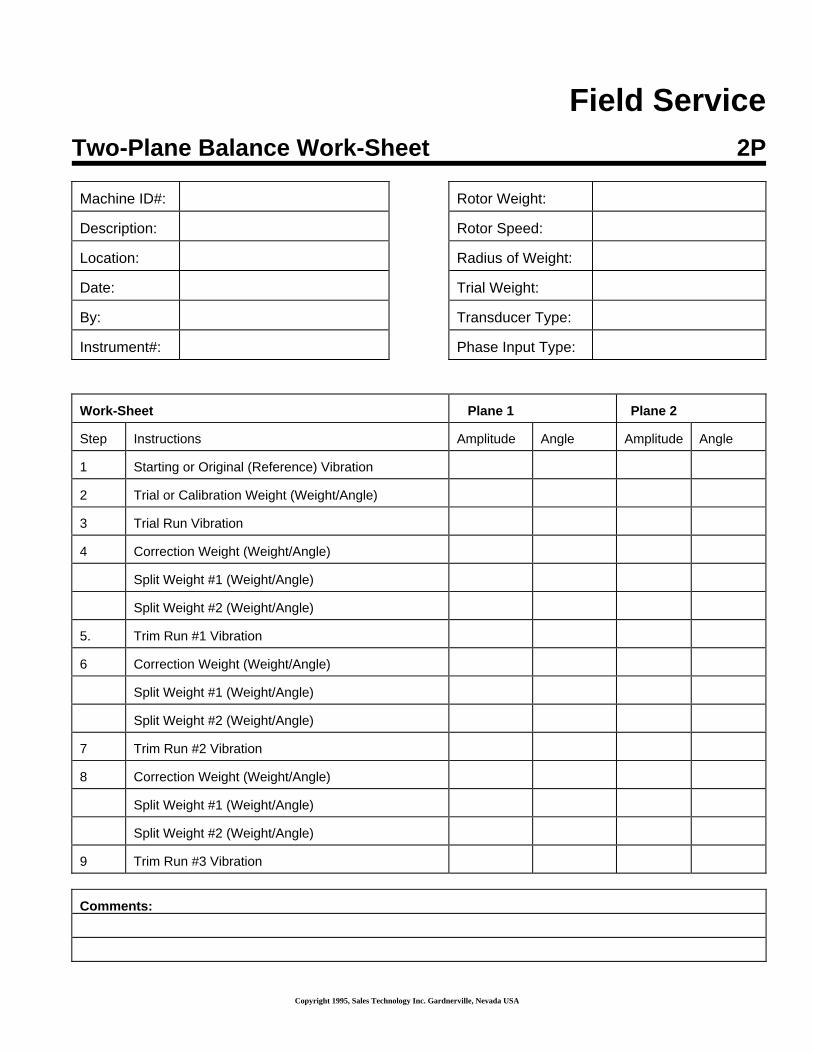
Field Service
Two-Plane Balance Work-Sheet 2P
Machine ID#:
Rotor Weight:
Description:
Rotor Speed:
Location:
Radius of Weight:
Date:
Trial Weight:
By:
Transducer Type:
Instrument#:
Phase Input Type:
Work-Sheet
Plane 1
Plane 2
Step
Instructions
Amplitude
Angle
Amplitude
Angle
1
Starting or Original (Reference) Vibration
2
Trial or Calibration Weight (Weight/Angle)
3
Trial Run Vibration
4
Correction Weight (Weight/Angle)
Split Weight #1 (Weight/Angle)
Split Weight #2 (Weight/Angle)
5.
Trim Run #1 Vibration
6
Correction Weight (Weight/Angle)
Split Weight #1 (Weight/Angle)
Split Weight #2 (Weight/Angle)
7
Trim Run #2 Vibration
8
Correction Weight (Weight/Angle)
Split Weight #1 (Weight/Angle)
Split Weight #2 (Weight/Angle)
9
Trim Run #3 Vibration
Comments:
Copyright 1995, Sales Technology Inc. Gardnerville, Nevada USA
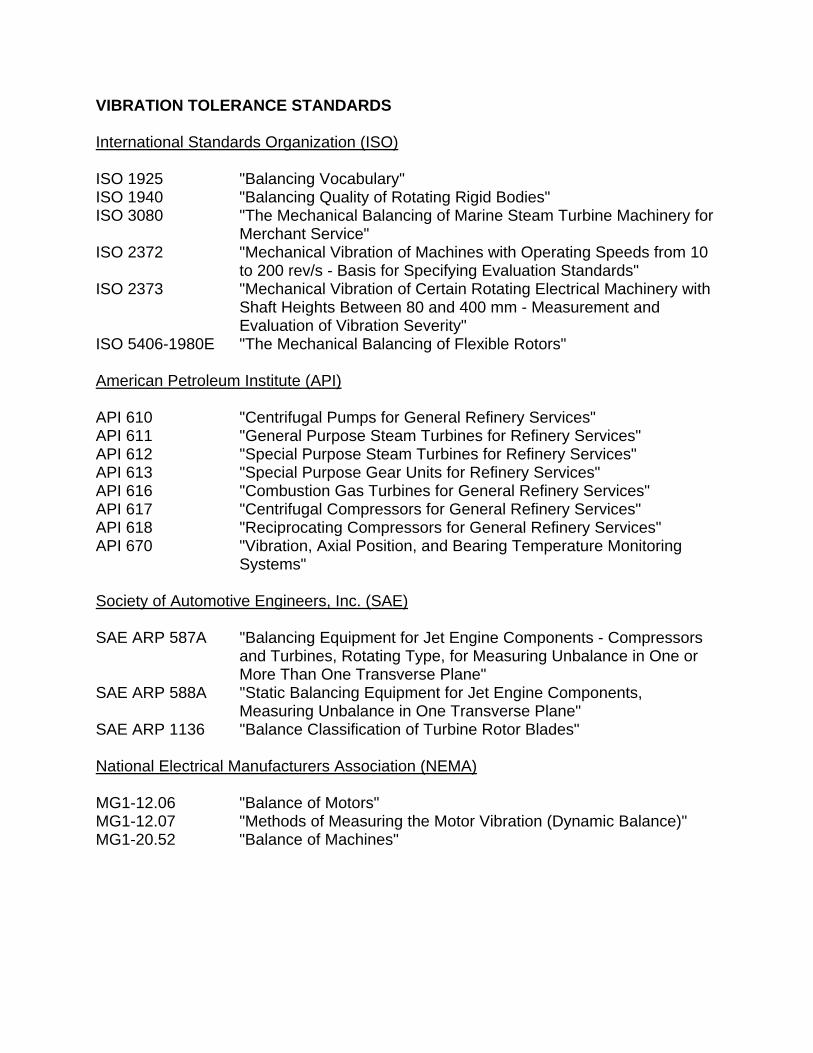
VIBRATION TOLERANCE STANDARDS International Standards Organization (ISO) ISO 1925 "Balancing Vocabulary" ISO 1940 "Balancing Quality of Rotating Rigid Bodies" ISO 3080 "The Mechanical Balancing of Marine Steam Turbine Machinery for
Merchant Service" ISO 2372 "Mechanical Vibration of Machines with Operating Speeds from 10
to 200 rev/s - Basis for Specifying Evaluation Standards" ISO 2373 "Mechanical Vibration of Certain Rotating Electrical Machinery with
Shaft Heights Between 80 and 400 mm - Measurement and Evaluation of Vibration Severity"
ISO 5406-1980E "The Mechanical Balancing of Flexible Rotors" American Petroleum Institute (API) API 610 "Centrifugal Pumps for General Refinery Services" API 611 "General Purpose Steam Turbines for Refinery Services" API 612 "Special Purpose Steam Turbines for Refinery Services" API 613 "Special Purpose Gear Units for Refinery Services" API 616 "Combustion Gas Turbines for General Refinery Services" API 617 "Centrifugal Compressors for General Refinery Services" API 618 "Reciprocating Compressors for General Refinery Services" API 670 "Vibration, Axial Position, and Bearing Temperature Monitoring
Systems" Society of Automotive Engineers, Inc. (SAE) SAE ARP 587A "Balancing Equipment for Jet Engine Components - Compressors
and Turbines, Rotating Type, for Measuring Unbalance in One or More Than One Transverse Plane"
SAE ARP 588A "Static Balancing Equipment for Jet Engine Components, Measuring Unbalance in One Transverse Plane"
SAE ARP 1136 "Balance Classification of Turbine Rotor Blades" National Electrical Manufacturers Association (NEMA) MG1-12.06 "Balance of Motors" MG1-12.07 "Methods of Measuring the Motor Vibration (Dynamic Balance)" MG1-20.52 "Balance of Machines"
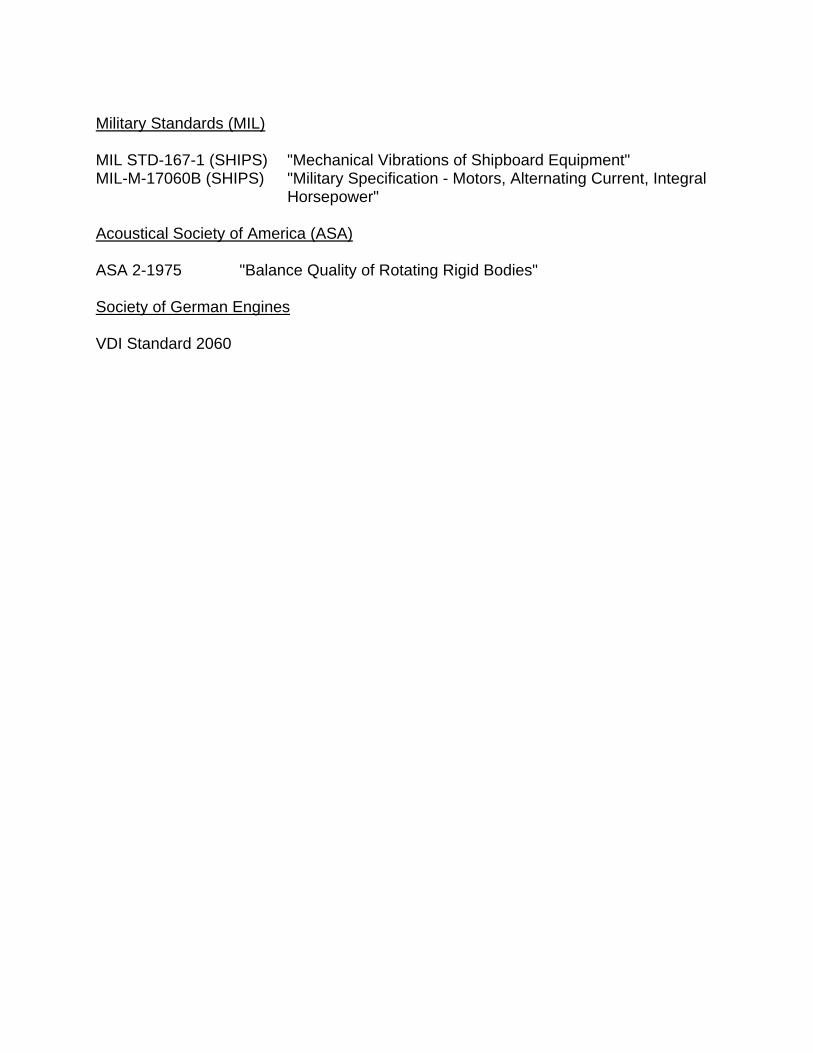
Military Standards (MIL) MIL STD-167-1 (SHIPS) "Mechanical Vibrations of Shipboard Equipment" MIL-M-17060B (SHIPS) "Military Specification - Motors, Alternating Current, Integral
Horsepower" Acoustical Society of America (ASA) ASA 2-1975 "Balance Quality of Rotating Rigid Bodies" Society of German Engines VDI Standard 2060
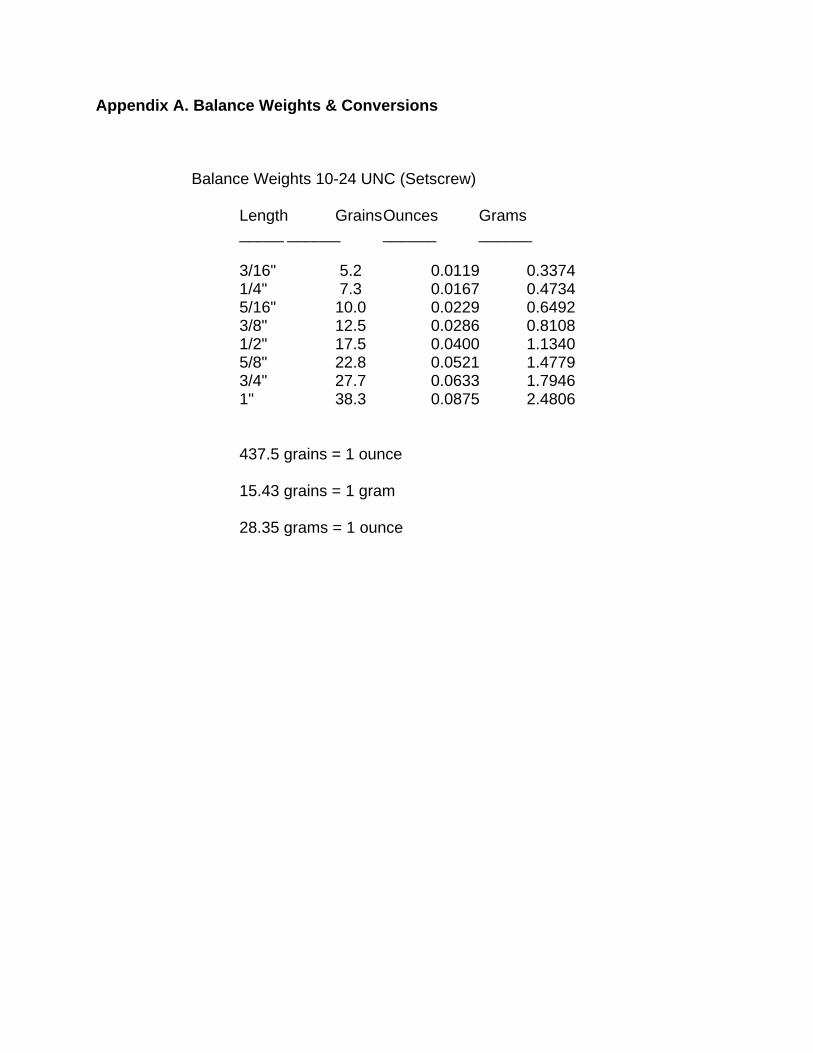
Appendix A. Balance Weights & Conversions
Balance Weights 10-24 UNC (Setscrew)
Length Grains Ounces Grams _____ ______ ______ ______
3/16" 5.2 0.0119 0.3374 1/4" 7.3 0.0167 0.4734 5/16" 10.0 0.0229 0.6492 3/8" 12.5 0.0286 0.8108 1/2" 17.5 0.0400 1.1340 5/8" 22.8 0.0521 1.4779 3/4" 27.7 0.0633 1.7946 1" 38.3 0.0875 2.4806
437.5 grains = 1 ounce
15.43 grains = 1 gram
28.35 grams = 1 ounce
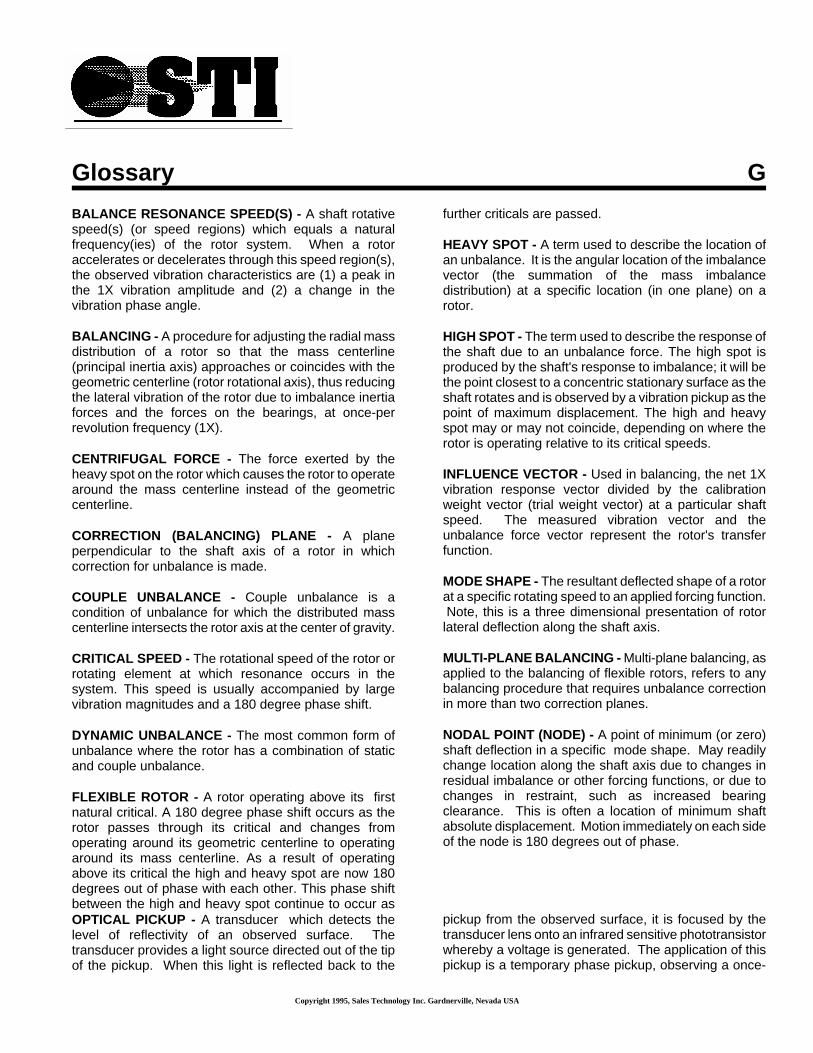
Glossary G BALANCE RESONANCE SPEED(S) - A shaft rotative speed(s) (or speed regions) which equals a natural frequency(ies) of the rotor system. When a rotor accelerates or decelerates through this speed region(s), the observed vibration characteristics are (1) a peak in the 1X vibration amplitude and (2) a change in the vibration phase angle. BALANCING - A procedure for adjusting the radial mass distribution of a rotor so that the mass centerline (principal inertia axis) approaches or coincides with the geometric centerline (rotor rotational axis), thus reducing the lateral vibration of the rotor due to imbalance inertia forces and the forces on the bearings, at once-per revolution frequency (1X). CENTRIFUGAL FORCE - The force exerted by the heavy spot on the rotor which causes the rotor to operate around the mass centerline instead of the geometric centerline. CORRECTION (BALANCING) PLANE - A plane perpendicular to the shaft axis of a rotor in which correction for unbalance is made. COUPLE UNBALANCE - Couple unbalance is a condition of unbalance for which the distributed mass centerline intersects the rotor axis at the center of gravity. CRITICAL SPEED - The rotational speed of the rotor or rotating element at which resonance occurs in the system. This speed is usually accompanied by large vibration magnitudes and a 180 degree phase shift. DYNAMIC UNBALANCE - The most common form of unbalance where the rotor has a combination of static and couple unbalance. FLEXIBLE ROTOR - A rotor operating above its first natural critical. A 180 degree phase shift occurs as the rotor passes through its critical and changes from operating around its geometric centerline to operating around its mass centerline. As a result of operating above its critical the high and heavy spot are now 180 degrees out of phase with each other. This phase shift between the high and heavy spot continue to occur as
further criticals are passed. HEAVY SPOT - A term used to describe the location of an unbalance. It is the angular location of the imbalance vector (the summation of the mass imbalance distribution) at a specific location (in one plane) on a rotor. HIGH SPOT - The term used to describe the response of the shaft due to an unbalance force. The high spot is produced by the shaft's response to imbalance; it will be the point closest to a concentric stationary surface as the shaft rotates and is observed by a vibration pickup as the point of maximum displacement. The high and heavy spot may or may not coincide, depending on where the rotor is operating relative to its critical speeds. INFLUENCE VECTOR - Used in balancing, the net 1X vibration response vector divided by the calibration weight vector (trial weight vector) at a particular shaft speed. The measured vibration vector and the unbalance force vector represent the rotor's transfer function. MODE SHAPE - The resultant deflected shape of a rotor at a specific rotating speed to an applied forcing function. Note, this is a three dimensional presentation of rotor lateral deflection along the shaft axis. MULTI-PLANE BALANCING - Multi-plane balancing, as applied to the balancing of flexible rotors, refers to any balancing procedure that requires unbalance correction in more than two correction planes. NODAL POINT (NODE) - A point of minimum (or zero) shaft deflection in a specific mode shape. May readily change location along the shaft axis due to changes in residual imbalance or other forcing functions, or due to changes in restraint, such as increased bearing clearance. This is often a location of minimum shaft absolute displacement. Motion immediately on each side of the node is 180 degrees out of phase.
OPTICAL PICKUP - A transducer which detects the level of reflectivity of an observed surface. The transducer provides a light source directed out of the tip of the pickup. When this light is reflected back to the
pickup from the observed surface, it is focused by the transducer lens onto an infrared sensitive phototransistor whereby a voltage is generated. The application of this pickup is a temporary phase pickup, observing a once-
Copyright 1995, Sales Technology Inc. Gardnerville, Nevada USA
Copyright 1995, Sales Technology Inc. Gardnerville, Nevada USA
per-revolution target. ORBIT - The dynamic path of the shaft centerline displacement motion as it vibrates during shaft rotation. The orbit can be observed on a dual channel data collector or an oscilloscope connected to XY eddy probes. PHASE LAG ANGLE - The distance around the shaft from 0 to 360 degrees a shaft turns after the phase pulse to the location of the high spot. POLAR FORMAT - A graphical format consisting of a center reference point surrounded by concentric circles. Vector information can be graphed on this format by specifying vector magnitude (vibration amplitude) as the proportional length of a radial line, and vector angle (vibration phase lag angle) as the angular direction of the line projection. RESIDUAL (FINAL) UNBALANCE - Residual unbalance is that unbalance of any kind that remains after balancing. RIGID ROTOR - A rotor is considered rigid when it can be corrected in any two planes and after that correction, its unbalance does not exceed the balancing tolerances at any speed up to a maximum operating speed. ROTATING PROTRACTOR SYSTEM - In balancing, a method to measure phase angle where the degrees are measured on the shaft. This method is used when eddy probes, optical phase pickups, and laser sensors are employed. SINGLE PLANE (STATIC) BALANCING - Single plane balancing is a process, by which the mass distribution of a rigid rotor is adjusted in order to ensure that the residual static unbalance is within specified limits and which requires correction in only one plane. STATIC UNBALANCE - Static unbalance is that condition of unbalance for which the central principal axis is displaced only parallel to the shaft axis. STATIONARY (FIXED) PROTRACTOR SYSTEM - In balancing, a method of measuring phase angle where the phase angle is measured on a stationary part of the machine. This method is employed when strobe lights are used. TWO-PLANE (DYNAMIC) BALANCING - Two-Plane balancing is procedure by which the mass distribution of a rigid rotor is adjusted in order to ensure that the residual static unbalance in two planes is within specified limits referred to those planes. UNBALANCE - Unequal radial mass distribution on a
rotor system; a shaft condition where the mass centerline (principal inertial axis) does not coincide with the geometric centerline. Also, the effective mass causing the rotor to be out of balance. VECTOR - A quantity which has both magnitude and direction. For a vibration vector, magnitude is expressed as amplitude (displacement, velocity, or acceleration) and direction as phase lag angle (degrees).


![61)5Þ731J— 1 6:30 0000000000006 1 5:00 OÕBÊtž TEL : 0766 … · 2019. 6. 4. · 0000000000006 1 5:00 OÕBÊtž TEL : 0766-20'1560/FAX: 0766-20-1562 . 13 : 30 ! 1.1.] r cavcj](https://img.pdfslide.net/doc/110x75/6053f4719249891ac45c7613/615731ja-1-630-0000000000006-1-500-obt-tel-0766-2019-6-4-0000000000006.jpg)