Embed Size (px)
Citation preview

1
Manufacturing Sector of Bangladesh-Growth, Structure and Strategies for Future Development
Dr. N. C.Nath* Dated July, 2012 Paper for Presentation at the Biennial Conference “ Global Economy and Vision 2021” during 12-14 July,2012, to be held at the Institution of Engineers, Dhaka *Research Fellow, Bangladesh Institute of Development Studies, Dhaka

2
Manufacturing Sector of Bangladesh-Growth, Structure and Strategies
Dr. N. C.Nath
Abstract The aim of the paper is to analyse the role of manufacturing in the economic transformation, its growth pattern and structural change and desirable strategic options for future development of Bangladesh. The paper tried to establish that the country has to accelerate manufacturing growth to achieve the target of accelerated growth and reduction of poverty. The paper has argued that manufacturing sector can play more significant role in accelerating economic growth. It has been found that manufacturing can grow to the extent required for projected economic growth under Sixth Five Year Plan, and in order to achieve that growth , manufactured export must grow at high rate as in the past, and there is a need for uplifting the sector from low technology driven narrow production base to technologically upgraded, high productive and diversified production base . It has been found that manufacturing employment must grow at double digit growth rate in order to attain projected employment growth under the current five year plan. Manufacturing employment growth at such a high rate seems to be a challenging task before the country. The paper analysed the structural change of manufacturing and sources of manufacturing growth, and hinted on the contribution of size of enterprise, market orientation, factor intensities and subsectoral contribution to manufacturing growth. The work attempted to pick up sectors enjoying comparative advantage or having growth potentials for future manufacturing development of Bangladesh. The paper tried to reveal technology level of manufacturing and highlight the status of competitive performance of manufacturing of Bangladesh at global level. The paper analysed the constraints in the way of and desirable strategic options for future manufacturing development of Bangladesh. The paper argued for parallel strategies of export expansion, domestic demand expansion and import substitution. Though labour intensiveness need to be emphasised given the factor proportions in the economy, the paper argued that labour productivity enhancement need to be adequately fostered for long term manufacturing development in the country. Similarly, the paper stressed the need for both price and non-price competitiveness simultaneously for export sector development and effective import substitution. I. Introduction 1.1. Motivation of the Study Given the ambitious growth targets of the Vision 2021, it is considered very important to give serious attention to manufacturing for both employment expansion, productivity enhancement and increasing per capita income oriented to reduction of poverty in the country.The main aim of the paper is to review the role of manufacturing in the transformation of the Bangladesh economy, analyse the pattern of its growth and structural change in the economy as well as within itself and identify critical areas of growth and sort out strategic options for its future development destined to move the Bangladesh economy forward. The research task here is to highlight sources of growth and growth potentials of manufacturing by size, market orientation, factor intensities and subsectoral contribution. The study will examine the structure of manufacturing in terms of value added, employment and export earnings. It will review the constraints and challenges of manufacturing sector and sort out the desirable strategies for its development.
3
1.2. Concrete Objectives of the Study Main Objectives of the Paper are basically five: i. To analyse role of manufacturing sector in economic transformation and economic growth of the country; ii. To analyse the structural change of manufacturing and sources of its growth in Bangladesh; iii. To analyse pattern of manufacturing employment and manufactured exports in Bangladesh; iv. To analyse the status of competitive performance of manufacturing and identify the important products enjoying comparative advantage for future growth; v. To review the challenges and strategic options for development of manufacturing in Bangladesh. 1.3. Methodology of the Study 1.3.1. Approach of the Study We shall analyse the data of forty years by economic phase wise during 1972-2012, the phase being of five years and examine the planned targets and policies for manufacturing growth at aggregate and disaggregated level in view of the needs of economic growth and employment creation in the economy and problems and challenges of manufacturing sector by using secondary data. Manufacturing is a part and subset of industry which includes extractive industries and mining, power and energy and construction besides manufacturing. 1.3.2. Data Source The main data source would be secondary data base of BBS, Bangladesh Planning Commission, SME Foundation, Bangladesh bank, EPB, UN, World Bank and IMF. In spite of the limitations of data of BBS on manufacturing, we have relied heavily on BBS. We have used data of CMI and Economic Census of BBS to cover entire manufacturing sector. We have used data of SMEF in the groupings of micro, small, medium and large subsectors of manufacturing in six subsectors. There is no uniformity of definition of different size of manufacturing in between the regulatory agencies. We have taken the definition of BBS for analysis. 1.3.3. Tools of Analysis Our tools of analysis would be estimation of indicators and seeing them longitudinally and as compared to other countries of similar setting. We have resorted to Tabular Analysis, Graphical Analysis and Regression Analysis to arrive at conclusion.
1.4. Structure of the Paper The paper will be structured into eleven parts: i. Introduction, ii Importance of Manufacturing for growth and in Structural Transformation in the Economy, iii. Sources of Manufacturing Growth in Bangladesh, iv. Manufacturing Employment as New conduit of Job creation and Rebalancing of employment, v. Analysis of Status of Components of Competitive Performance of Manufacturing Sector of Bangladesh, vi.Factor Intensities and Productivities of Sub-sectors, vii. Constraints and Challenges in the way of Development of manufacturing, viii. Strategic Options for Industrial development, and ix. Conclusion.

4
II. Importance of Manufacturing for Growth and role of Manufacturing in Structural Transformation in the Economy 2.1. Importance of Manufacturing for Economic Growth in Bangladesh It is widely acknowledged that accelerated economic growth and poverty alleviation, which are the vital goals before the country, require ensuring radical structural shift in the economy favouring the manufacturing sector (Different Plan Documents of Bangladesh)i. In the context of the limited resource base of Bangladesh, low technology and productivity base, narrow product mix, the constraints of the domestic market, the pressure for gainful employment of a growing labour force and increasing scope to use the emerging global opportunities, the task of designing a strategy of manufacturing development capable of addressing the emerging challenges, both domestic and global, has become important for future development of Bangladesh. Manufacturing sector is unique in enjoying benefits of increasing return to scale. The importance of manufacturing is also reinforced by the development of agriculture and service sectors for their reliance on backward and forward linkages with the manufacturing. Manufacturing produces most of the capital goods, all intermediate goods and most of the consumer goods. Manufacturing sector is the most vibrant force of development, and as Weiss (1988)ii reported, manufacturing “retains the characteristics of an engine of growth-rapid productivity growth, dynamic increasing returns to scale, rapid technological change, and various dynamic externalities”. The case for development of manufacturing as a key feature of development strategy of Bangladesh to accelerate growth and reduce poverty has got established firmly immediately after country’s liberation in the very First Five Year Planiii. This has been consistent with the need of the country at that time for its dynamic development and in line with the stand of economists like Prebisch (1950 and 1984)iv and Singer (1950) who were the pioneersv for manufacturing development to deal with the problems of backward nations in income generation and employment creation. For a country like Bangladesh from its very inception, the question has been thus not whether but how to develop manufacturing in order to satisfy basic needs of vast population in food and non-food goods, make savings for increased investment, earn foreign exchange and create employment of growing labour force not absorbed in agriculture or in service sector. As evidence showed, manufacturing of Bangladesh was very slow to compensate the decline of share of agriculture to increase GDP of the country over time and ranks low among the comparable nations in terms of contribution of manufacturing to GDP and its growth. Perspective Plan of Bangladesh 2010-2021vi has emphasized the need for gearing industrialization to achieve the macroeconomic performance target of 8% growth target by 2015 and 10% growth by 2021. The overarching goal for the country’s industrialization, as the document of Perspective plan noted, is to enhance the industrial contribution to GDP to 40% over the next decade, with a share of 30% for the manufacturing sector. Bangladesh Industrial policy of 2010vii has recognized the importance of manufacturing for economy- wide productivity enhancement and diversification of economic base of the country. Likewise, manufacturing sector received serious attention under sixth five year plan and perspective plan in consonance with Vision 2021 for country’s future development and achievement of high growth rate. Main concern here is that Bangladesh manufacturing is narrowly concentrated in low technology based sub-sectors, and has to face challenges in the way of diversification and productivity enhancement. Sixth Five year plan has recognized importance of manufacturing as a vehicle for accelerating growth of the economy. It is projected that during the period of Sixth Five Year Plan, the manufacturing sector will have to outface both the agricultural and service sectors and follow a smooth upward trajectory. The manufacturing sector is planned to follow an upward trend from annual growth of 6.5% in FY 2010 to 11.7% in FY 2015 with average annual growth of 10%
5
during the plan period. This five year development plan will upgrade the industrial employment to 25 per cent of the population from the current 17 per cent by June 2015, its final implementation time. 2.2. Strategic Structural Transformation and role of Manufacturing 2.2.1. Past experiences of Transformation of Bangladesh Economy
In strategic transformation of Bangladesh economy, past experiences of Bangladesh indicate that while share of agriculture is on sharp decline from 44% in 1972-80, to 20% in 2006-10, share of manufacturing to GDP has increased from 10% in 70s only to 17% in 2006-10. It is widely acknowledged that with development of the economy, usually share of agriculture declines and share of industry increases and eventually increases the service sector. In Bangladesh, with the decline of agriculture, share of industry did not increase substantially. Here, service sector provided low paid employment to the surplus labour pushed out of agriculture. Transforming Bangladesh’s agrarian economy into a modern manufacturing and organized service based economy is a long term challenge. This is needed to enhance productivity and faster growth. The focus on manufacturing is based on two important points. Firstly, expansion of agriculture is limited by fixity of land, secondly, the increase in labour productivity will require switch over from low productive agriculture to high productive industry and modern service sector. Following the initial debacle in the 70s and 80s growing below the average economic growth, the manufacturing sector growth performance improved during the 1990s. The faster pace of expansion of manufacturing relative to total GDP since FY91 caused its share to increase gradually, rising from its low level 12 percent in FY91 to 17.2 percent in FY10 (Fig.1). In the 1970s and 1980s, manufacturing sector performance was constrained by the dominance of poor performing nationalized enterprises and inadequate private investment and reckless divesture of public enterprises leading to their virtual closure and severe sickness in many cases. In Bangladesh, the pace of industrialization has been gradual and slow, and over the years, there has been a moderate structural shift from a predominantly agrarian economy to a more organized manufacturing sector. Though there has been higher share of manufacturing in GDP as agriculture continues to decline a share of GDP, while services remained fairly steady throughout, as compared with the performance of the some East Asian economies, it appears as a rather slow industrial deepening over the two decade. Compared to Bangladesh’s share of manufacturing, Vietnam increased its share of manufacturing from 12.3% in 1990 to 21% in 2008 and Malaysia from 24% to 28% over the same period. On the other hand, China’s share of manufacturing has been steady at 32-33% over that period. Even Thailand’s manufacturing grew so rapidly since 1990 that its share rose from 27% to 35 percent (Appendix Table-1). The common thread in the policies of these economies is claimed to be emphasis on private sector driven growth and trade openness. Since 1990, Bangladesh has also changed economic policy stance in these general directions though in a more gradual way. Progress is most advanced in regards to emphasizing the role of the private sector, but attracting direct foreign private investment is less advanced. One notable development in the economy is the predominance of manufacturing goods in exports (90-95%) as the latter progressively becomes the driver of high growth.

6
Fig.1: Structural Change of Bangladesh Economy
2.2.2. Strategic Goal of Structural Transformation Promotion of structural transformation in the economy has been cited as one of the important strategic goals of Perspective Plan of Bangladesh 2010-21. In the structural transformation process, within the time of Perspective plan-2011-21, agriculture’s share will decline from 22% in 2009 to 16% at the end of Sixth Five Year Plan and 15% by the end of Seventh Five Year Plan and share of industry will increase from 29% to 35% by the end of Sixth FY Plan and 40% by the end of Seventh Five Year Plan. Share of manufacturing will grow from 17% in 2010 to 26% in 2015 and 30% in 2021viii. Taking past experiences into consideration, achieving 26% share of manufacturing by 2015 and 30% by 2021 as projected by perspective plan seems to have been highly challenging task. Hence, Sixth Five Year Plan has revised share of manufacturing downward to 22% by 2015. As the Plan document reported, the SYFP target of reaching 8 percent annual GDP growth in the outer years is premised on a vibrant manufacturing sector growing at double digits on a sustained basis and the manufacturing sector is planned to continue to account for a larger share of GDP compensating for the secular decline in the share of agricultural sector. This trend is consistent with the stylized facts of structural change in the process of development experienced by different countries. Thus the strategy for achieving the high growth target under the SYFP and beyond includes further manufacturing deepening supported by a highly-productive agriculture sector. For Bangladesh to reach middle income threshold by 2021, manufacturing expansion is obligated to accompany hand-in-hand with highly productive farm and non-farm agriculture. As a strategic option, Sixth Five Year Plan explicitly has chosen the path of boosting manufacturing for creating productive high income jobs and development. It is found that decline in share of agriculture is projected to be compensated by increased share of industry and manufacturing while share of services remains steady (Table-2.2). The Plan tried to make a balance, thereby creating more employment opportunities in the manufacturing and allowing a shifting of large number of workers engaged in low productive employment in agriculture and informal services to these higher productivity sectors of the economy. It was planned, much of the high productivity, high income jobs, will need to come from a labor-

7
intensive manufacturing sector based on domestic and export markets. In the future transformation of Bangladesh from low productive to high productivity level thus, manufacturing has to assume a crucial role to play. Accordingly, manufacturing is projected to constitute 21.1% by 2015 increased from 18% in 2010, and its dynamic growth contribution is projected to be around 30% increased from 18.5% in 2010 i.e. by 11% (Table-2.2). Table-2.1 Strategic Goal of Structural Change (Sectoral Share of GDP, per cent) Sectors Average
(FY04-FY09)
Target FY 2015 as per Perspective Plan
Target FY 2015 as per SFYP
Target FYFY2021
Agriculture 21.70 16.0 15.5 15.0 Industry 29.00 35.0 32.0 40.0 Manufacturing 17.10 26.0 21.1 30.0 Service 49.30 49.0 52.5 45.0 Source: Perspective Plan of Bangladesh 2010-2021 and Sixth Five Year Plan of Bangladesh 2011-15 Table-2.2 Planned Projection of role of Manufacturing in the Transformation of future Bangladesh 2010 2011 2012 2013 2014 2015
Share as % of GDP
Agriculture 18.6 18.4 17.7 16.9 16.2 15.5
Industry 28.5 28.7 28.9 30.4 31.3 32 of which Manufacturing 17.9 18.2 18.7 19.6 20.4 21.1
Services 52.9 52.9 52.9 52.7 52.5 52.5 % Contribution to GDP Growth Agriculture 15.38 13.05 11.11 9.92 8.91 7.90
Industry 29.92 37.44 38.70 40.16 42.05 43.59
Manufacturing 18.51 24.52 25.57 26.41 27.93 29.24
Services 54.69 49.51 50.18 49.92 49.04 48.51
Total 100.00 100.00 100.00 100.00 100.00 100.00 Source: Adapted from Data of SFYP, 2011. 2.3. Manufacturing Growth Performance of Bangladesh in Different economic Phases Bangladesh witnessed decades of slow economic growth until 1990 (Table-2.3). Growth rate started to rise since early 1990s and during the first decade of the 21st century, the average economic growth rate approached 6 percent per annum (Table-2.3). Even though the Bangladesh growth path is rising, the average growth rate for Bangladesh during the 2000s was much lower than that of the rates in China, India and Vietnamix. Manufacturing growth during the seventies lagged behind economic growth. In the later period since eighties, manufacturing growth outstripped GDP growth (Table-2.3). Double digit growth in manufacturing is a long cherished goal for the country though it did not yet reach the goal

8
(Fig.2). Though manufacturing has small share of GDP, its growth over the years has been steady (7% a.m. in the last 10 years). Double digit growth is though challenging is not unachievable if power and infrastructure problems are resolved and political stability is maintained. Growth of manufacturing has expectedly exceeded GDP growth though not by high margin (Fig.3). Elasticity results show that for 8% GDP growth, manufacturing growth need to be around 11.0-12.0% p.a which will not be unreachable, though a bit difficult given its past growth experiences and prevailing problems of infrastructure and political instability. Table-2.3 Growth performance of the economy and Manufacturing in Different Plan Periods 1973-2010
Plan period Annual average growth (%)
Target Actual GDP Growth Mfg Growth First five year plan (FY73-FY78) 5.5 4 2.5
Two year plan (FY78-FY80) 5.6 3.5 6.3
Second five year plan (FY80-FY85) 5.4 3.8 4.7
Third five year plan (FY85-FY90) 5.4 3.8 5.1
Fourth five year plan (FY90-FY95) 5 4.2 6.9
Fifth five year plan (FY97-FY02) 7 5.1 5.78
FY02-FY06 5.5 8.95
FY06-FY10 6.3 7.48
Weighted Average 4.53 5.81 Source: Adapted and calculated from the data of Bangladesh Bureau of Statistics Fig.2. Growth of Manufacturing of Bangladesh during 1976-2010

9
Fig.3: Relation between GDP Growth and Manufacturing Growth in different planned phases
2.4. Dynamics of Sources of Economic Growth and role of Manufacturing Drivers of structural change of economic growth have been found industry and service sectors in all the plan phases of Bangladesh economy. Drastic reduction of contribution to growth of the economy was during 1980-95. Agriculture revived its contribution to economic growth during Fifth Five Year Plan period. Again, it fell during 2002-2010.In the First Five Year Plan Period, contribution of service sector to economic growth was only 29%. In this period, contribution of industrial and manufacturing sector was spectacularly high (46% and 26% respectively) which was not repeated in the subsequent period. This might be associated with reckless divesture of public sector manufacturing plants to the hands of inexperienced investors and rental interests. During 2006-10, contribution of manufacturing to economic growth has been only 21.6% which is much lower than that of First Five Year Plan Period (Fig.4). Though share of contribution of agriculture to economic growth has declined sharply, manufacturing sector could not fill up the vacuum and consequently service sector of low value added activities came to absorb labour unleashed from agriculture to increase income of the population. With declined share of low productive agriculture to economic growth, it was expected that share of high productive manufacturing could have developed creating a dynamic path of development of a backward economy. The contribution of service sector to economic growth during 2006-10 has increased to 54% which is the highest after 1990. This might be due to anomalies during Caretaker Government, food and energy crisis, global financial crisis and environmental hazards making great havoc on the economy. Desirable condition would be increased contribution of industry and manufacturing resulting in reduction of share of contribution of low value added service sector activities.

10
Fig.4. Contribution of Manufacturing along with other sectors to GDP Growth
Contribution of Different Sectors to GDP growth
010203040506070
1973
-78
1978
-80
1980
-85
1985
-90
1990
-95
1997
-02
2002
-06
2006
-10
Economic Phases
Per
cent
age
% Share ofManufacturing asGDP Growth Source% Industry to growthof GDP
% Agriculture toGrowth of GDP
% Service to Growthof GDP
2.5. Growth Projections of Manufacturing under Sixth Five Year Plan
Manufacturing growth has been planned to increase from 6.5% in 2010 to 11.7% in 2015 (Table-2.5). This growth is necessary in case of declined growth of agriculture (as predicted) over the period to sustain growth momentum of the economy. Thus double digit growth in manufacturing and industrial sector is important for realization of target goal of economic growth envisaged in the plan. In the eventual development, share of manufacturing has been planned to increase from 17.8% in 2010 to 21% by 2015 which is not very high. Table-2.5 Growth projections and Projections of share of the sectors and of Manufacturing and their Contribution to GDP Growth FY2010 FY2011 FY2012 FY2013 FY2014 FY2015
Growth Rate (%)
Agriculture 5.2 5 4.5 4.4 4.3 4.3 Industry 6.6 9.2 9.6 9.9 10.5 11.5 of which Manufacturing 6.5 9.5 9.8 10.1 10.7 11.7 Services 6.5 6.6 6.8 7.1 7.3 7.8 GDP 6.1 6.7 7 7.2 7.6 8
Share as % of GDP
Agriculture 18.6 18.4 17.7 16.9 16.2 15.5 Industry 28.5 28.7 28.9 30.4 31.3 32 of which Manufacturing 17.9 18.2 18.7 19.6 20.4 21.1 Services 52.9 52.9 52.9 52.7 52.5 52.5
Source: Calculated from BBS and SFYP Projections

11
III. Sources of Manufacturing Growth We shall analyse here sources of manufacturing growth by scale of operation, market orientation and subsectoral performance. 3.1. Dynamics of Sources of Manufacturing Growth by scale of manufacturing Results of data analysis suggest that though in the seventies proportion of both sizes was near to each other, divergence grew in course of time to such an extent that now only 30% of manufacturing is from small sized manufacturing (Fig.5). Though share of large scale manufacturing has grown from 5.55% to GDP to 12.3% GDP, share of small manufacturing to GDP has remained at 5% in 2006-10 as was in the seventies. Fig.5. Share of Large and Small Scale Manufacturing to GDP
Share of Large and Small Manufacturing to GDP
0
5
10
15
20
1972-80
1981-85
1986-90
1991-95
1996-00
2001-05
2006-10
Economic Phases
Per
cent
age
of G
DP % Share of Mfg to
GDP% Share of Large Mfgto GDP% Share of SmallScale Mfg to GDP
Growth remains steady at around 8% in both sizes after 90s and contribution of large and small size to growth of manufacturing remains at 70% and 30% respectively (Fig.7). Again, labour productivity, capital productivity and profitability are higher in small and medium enterprises. Thus both size categories deserve import attention for accelerating manufacturing growth in the economy. Small manufacturing units need special attention because of more flexibility and labour absorptive capacity. Growth of manufacturing was as high as 26% in 1970s because of high growth in large and medium enterprises. During 1981-1990, manufacturing growth did not increase more than 5%. During 1990-95, there was steady manufacturing growth of 8% per annum. Again, it slowed down in 1996-2000.During 2001-2010, manufacturing growth was on average 7.8% per annum (Fig.6). Under the Sixth Five year Plan, this growth figure of manufacturing need to be increased to around 10% p.a. on average to attain average economic growth of 7.3% p.a. Manufacturing growth during the period of SFYP is expected to come from both small, medium and large sizes. The role of small enterprises is particularly important to provide the employment base. The promotion of small enterprises in rural areas needs to be a major strategic element for creating higher income and employment in the rural economy, which is critical for sustained poverty reduction.

12
Fig.6. Growth of Overall Manufacturing and Large and Small Scale Manufacturing
0
1
2
3
4
5
6
7
8
9
1974-80 1981-85 1986-90 1991-95 2006-10
Mfg growthlarge mfg growthSmall mfg growth
One of the observations regarding scale of manufacturing operation from the data of Economic Census, 2002 of BBSx is that 93.3% of manufacturing enterprises belong to small and micro manufacturing enterprises (1-9 persons) and provide 47% of manufacturing employment, and the large manufacturing enterprises (10 & above as per definition of Economic Census) constitute 6.7% and provide 53% of manufacturing employment. Both micro and small enterprises (1-49 as per CMI definition) constitute 98.7% of total manufacturing enterprises. Large and medium enterprises constitute 1.3% of total manufacturing enterprises. Second important observation is that share of manufacturing in non-farm establishment and employment increases with the size of enterprise from 12.6% and 26.4% respectively in micro and small enterprise to 32.7% and 52.4% respectively in large size manufacturing. From this, it is evident that Bangladesh manufacturing is characterized by dualistic pattern implying need for dualistic approach in financing the enterprises, making decisions for technology choice and for technology upgradation as well as marketing the products. Though there has been duality in the size of manufacturing, there has been concentration of employment and output in large size of enterprises in terms of fixed assets. However, there has been some reduction of concentration in 2005-06 a compared to 2001-02 (CMI surveysxi).There has been reduction of number of enterprises (-30.3%), employment (-17.5%), gross output (19%) and Value Added (-26%) in the largest size categories of fixed assets and increased proportion of employment and value added among the small and medium enterprises of orgaised manufacturing.

13
Fig.7: Share of Contribution to GDP Growth of Different Sizes of Manufacturing
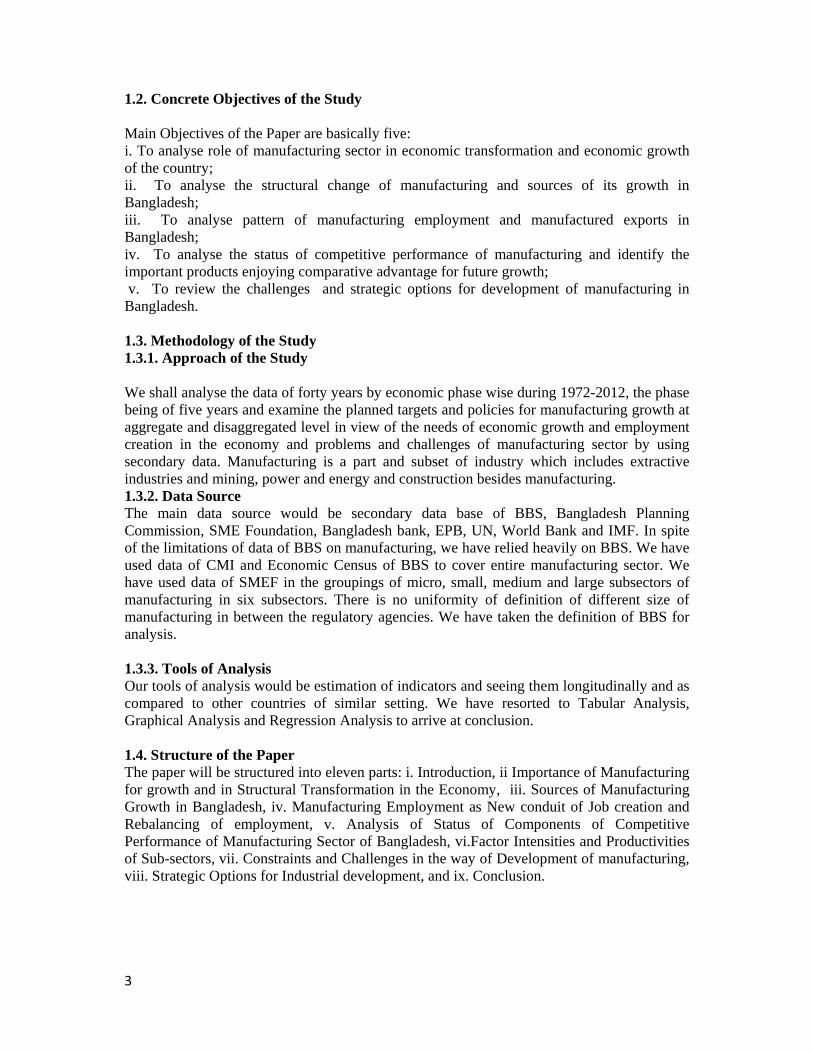
3.2. Sources of Manufacturing Growth by Market Orientation: Export Expansion, Import Substitution and Domestic Demand Expansion Historically there has been strategic shift from import substitution to export orientation strategy for manufacturing development in Bangladesh. The dynamism in manufacturing sector is thought to benefit from greater outward orientation. Bangladesh has witnessed this benefit from the highly positive experience of the ready-made garments (RMG) sector. Following experiences from Korea, China, India, Thailand and Vietnam, Bangladesh has started strengthening the role of exports in manufacturing development. In the seventies as estimated by the author following Chenery’s methodology of decomposition of sources of growthxii , export orientation strategy could contribute only 15% manufacturing growth. In the early eighties its contribution rose to 24%. During the period 1986-2000, export expansion as source of manufacturing growth has contributed more than fifty percent. After 2001, its share of contribution again declined from 69% in 1996-00 to 34% in2001-05 and 45% in 2006-2010.Import substitution and domestic demand expansion together as sources of growth have worked well upto 1985. But import substitution independently did not work well even in the seventies. Thus except in the two periods-period of early 1980s and early 2000s, import substitution could not show positive contribution to manufacturing growth. This is a reflection of weak base of manufacturing and import dependence for manufactured consumption and for long term industrial development of the economy. Domestic demand expansion has been found to have a crucial role in the growth of manufacturing in all the periods. Export expansion has steadily and increasingly contributed as well to the growth of manufacturing (Fig.8). Manufacturing sector is expected to be thrusted upon for effective addressing not only external market but also vast domestic demand of more than 150 Million people of the country. Experiences of East Asia suggest that strengthening domestic production base for addressing domestic consumers and competing imports is the precedence for gaining export competitiveness. Import substitution efforts are in the long run preparations for strengthening edge for export competitiveness. This is important when we are losing our domestic market and can not expand our export market either except for one product-ready made garment. The country has been suffering
14
from narrow product and low technology industrial base with little exportable surplus. This is important when the global financial crisis is yet to be settled and recovered, and the developed countries are still in uncertainty of investment decisions. Thus export expansion and import substitution are not exclusive for industrial development of Bangladesh. Medium and long term plans are needed to look into using its abundant labour resources through constant development of their skill and education under a long term manpower planning. Industry should have been planned for economy-wide productivity enhancement and would be used for strengthening competitiveness and sustained import substitution and export orientation.
Fig.8.Sources of Manufacturing Growth by Market Orientation
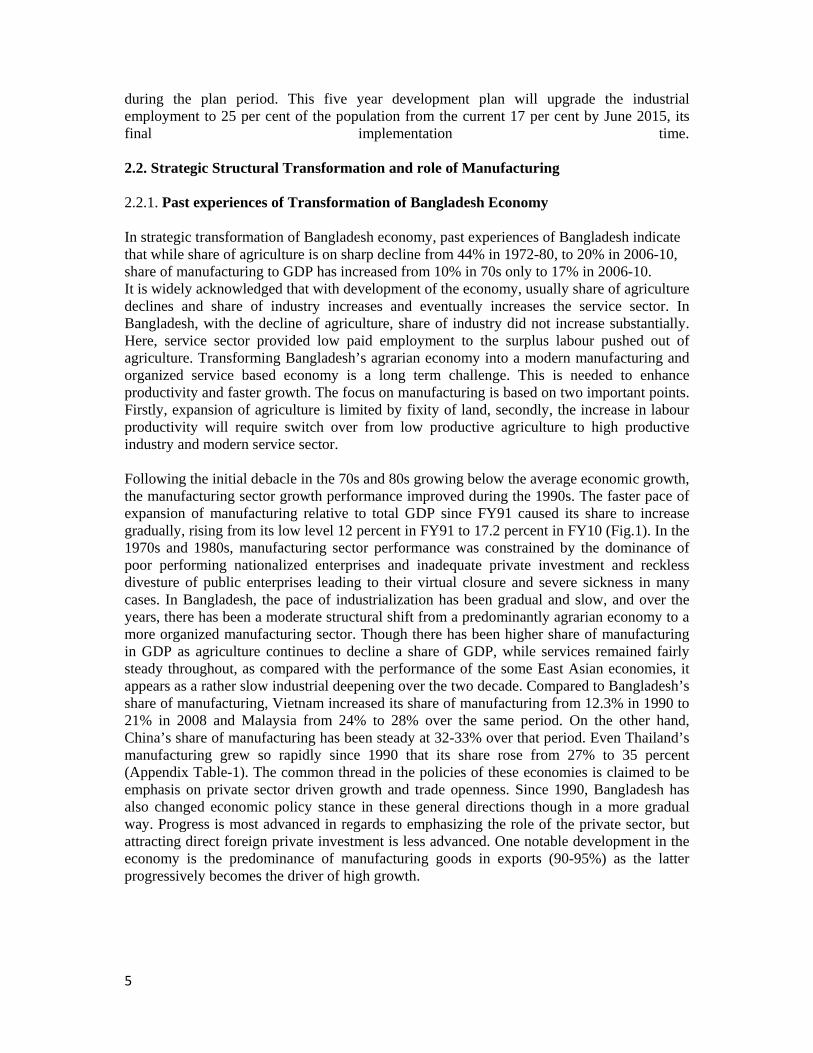
3.3. Subsectoral Sources of Manufacturing Growth and Identification of Potential products for future growth We have identified 30 products having high growth potentials for manufacturing development of Bangladesh. Three products like garments, pharmaceuticals and textiles constitute 65% of manufacturing growth (Table-3.1) Other important contributors to manufacturing growth are cement, food products, books and periodicals, re-rolling steel mills, leather footwear, perfumes and cosmetics, paints and varnishes, batteries, ceramics, glass products, wires and cables, wooden furniture, motor cycle and plumbing equipment. The important products with low positive contribution are machinery equipment, machinery parts and electrical appliances. The potential products with negative contribution to growth are jute textiles, tanning and finishing leather, fertilizer, rubber footwear and shipbuilding. Negative growth contribution of 17% of two big sectors - jute textiles and fertilizers carrying 25% weight has affected much the growth of manufacturing in the economy (Table-3.2). Negative growth of sugar and paper (5% Weight) is also another headache for the manufacturing development of the country. Out of top ten products, around 95% of growth of value added belongs to five products-ready made garments, pharmaceuticals, food products, cotton textiles and non-metallic mineral products. Around 23 products constituting 45% product categories at 4 digit level showed positively high growth potentials (Table-3.3). Important high growth products are garments, pharmaceuticals, and ceramic. Cement, electric machinery, plumbing equipment, wooden furniture, leather footwear, paints and varnishes, soaps & detergents, bricks & tiles , batteries, particle board, silk and synthetic textiles, motor cycles and printing. Another 7 Products constituting 14% of product categories experienced

15
shift to positive growth from negative growth .Here important products are re-rolling steel, Textile Machinery, Spirit & Alcohols, vegetable oil and soft drinks. Though we can pick up products with high positive contribution to manufacturing growth, there are potential products having lower and even negative contribution in the past as evidenced in the Tabular data. Thus not only past performance but also future prospects need to be reckoned with for assessing potential products. In the growth projections of subsectors, textiles, leather products, fertilizer and machinery sectors have been given topmost importance. Textiles and clothing have the capability to increase its share with higher growth because of growth of knitted and woven garments. Among other manufacturing, jute textiles tend to rebound to respond to demand for environment friendly products. Food processing also has high prospect for growth in the plan period. As the tabular analysis (Table-3.4) shows, four products have more than 80% share of manufacturing growth during sixth five year plan period and there is no much breakthrough for diversification of manufacturing growth base of the country. It is important to note that four important sectors of the economy jute textiles, fertilizer, paper and sugar having weight of 31% contributed negatively during the 1988-2010 affecting the manufacturing growth constituting 85% of negative growth contribution of all subsectors. These subsectors require urgent restructuring to foster manufacturing growth on sound footing. Table-3.1 Subsectoral (4-digit) Sources of manufacturing growth during 1988-2010
Compound Growth Rate
Weight 1988/89-2000/01
1988/9-94/5
1994/5-2000/01
1999/00-2009/10
1988/9-2009/10
Sources of Growth 1988-2010 in %
General mfg 100 7.13 8.52 5.75 7.51 7.33 100
Readymade Garments 9.13 19.06 23.51 14.77 7.93 14.26 33.15
Pharmaceuticals 7.01 10.74 16.82 4.98 12.97 11.98 21.39
Cotton Textiles 7.83 -0.11 -2.77 2.63 12.14 5.51 10.98
Bidies Manufacturing 3.85 12.52 19.35 6.08 8.61 11.04 10.82
Books & Periodicals 1.88 16.38 27.99 5.83 7.02 12.38 5.93
Silk & Synthetic Textiles 1.59 11.80 4.26 19.89 19.88 13.91 5.63
Black Tea and Blending Tea 7.87 2.08 2.05 2.11 1.63 1.71 3.43
Mfg of Cement products 1.17 11.74 -1.38 26.61 7.67 10.64 3.17
Leather Footwear 1.6 5.39 8.35 2.51 9.78 7.70 3.14
Process of Fish & Sea Food 1.81 5.57 9.36 1.90 6.58 6.15 2.84
Dyeing, Bleaching & Finishing 1.19 5.64 6.86 4.44 9.98 6.89 2.09
Iron & Steel Re-rolling Mills 1.91 6.12 11.85 0.70 1.96 3.91 1.90
Mfg of Bakery Products 0.96 7.49 7.63 7.36 7.36 7.09 1.73 Flour Milling (Grain Milling exc. Rice Mill) 1.18 3.23 4.81 1.69 7.91 5.37 1.61
Total of 14 Products 49 107.81 Other 26 Low Positive Contributor Products 14.55 13.39 Other 13 Negative Contributor Products 36.45 -21.2
Total 52 Products 100 100 Source: Calculated from the data of BBS of Several Years

16
Table-3.2 Distribution of Four Digit Industries by Weight and Growth Rate (1988/9-2009/10) contributing to overall Mfg growth Weight Annual Compound Growth Rate 10% &Above 5 to below 10% 2% to Below5% 0 to below 2% Negative 5+ Garments
Pharmaceuticals Cotton Textiles
Tea Jute Textiles Fertilizer
2 to below 5 Bidies Mfg Cigarettes Leather Tanning Sugar Paper
1 to below 2 Cement Books & Periodicals Silk and Synthetics textiles
Fish and Sea Food Dyeing & Bleaching (Printing) Leather Footwear Flour Milling
Re-Rolling Steel Soap & Detergents
Liquified Gas
0.5 to below 1
Bakery Products
Bricks & Tiles Electric Lamps Batteries Ceramic Products News Paper
Sprits and Alcohols Petroleum Products
Ship Building Rubber Footwear Motor Vehicles
0.25 to below 0.5
Edible Salt Perfumes and Cosmetics Cable Wires Particle Board
Television Utensils Electrical Appliances
Vegetables and Soya oil
Insecticides Matches Carpets and Rugs
Below 0.25 Paints and Varnishes Glass Products
Motor Cycles Plumbing Equipment Soft Drinks Wooden Furniture Electrical Machinery
Fabricated Metal Products Engines and Turbines
Source: Estimated from the Data of BBS Table-3.3 Distribution of Four Digit Industries by Weight and Annual Compound Growth Rate (1981/2-1988/9 and 1988/9-2009/10-comparison) Weight, 1988/9
High Growth All the time (5 % & Above)
Low to Higher Growth High growth to Lower Growth
Negative to Positive
Positive to Negative Growth
Always Negative
5+ Garments Pharmaceuticals Re-Rolling Steel Fertilizer Cotton Textiles
Jute Textiles
2 to below 5 Bidies Making Tea
Fish & Sea Food
Sugar
Paper
1 to below 2 Flour Milling
Cement Books & Periodicals Silk and Synthetics textiles Dyeing & Bleaching (Printing) Leather Footwear
News Paper Cigarettes
Leather Tanning Liquified Gas
0.5 to below 1 Ceramic
Soaps & Detergents Bricks & Tiles
Cable Wire Electric Lamp
Rubber Footwear Motor Vehicles
Insecticide Petroleum Products
0.25 to below 0.5
Edible Salt Batteries Particle Board Television
Utensils Textile Machinery Spirit & Alcohols Vegetable Oil
Matches
Shipbuilding Carpets & Rugs
Below 0.25 Electrical Machinery Plumbing Equipment Wooden Furniture
Motor Cycles Paints and Varnishes Glass Products
Soft Drink Fabricated Metal Products Engines and Turbines
Total=51 6 17 5 7 10 6 %Total 11.76 33.33 9.80 13.73 19.61 11.76
Source: Estimated from the Data of BBS
17
Table-3.4 Manufacturing Growth Projection for SFYP by subsectors of manufacturing
FY2010 FY2011 FY2012 FY2013 FY2014 FY2015 Annual growth rates % Manufacturing 6.5 9.5 9.8 10.1 10.7 11.7Food Processing 6.1 7.2 8.4 8.7 10.5 12.5Leather Products 7.7 8.5 9.4 10.5 11.2 12.2Textile & Clothing 7.6 14.4 13.5 13.8 14.2 15.1Chemical Fertilizer 5.3 6.1 6.7 6.8 7 7.4Machinery 5.9 6.2 6.6 6.7 7.2 7.9Petroleum Products 4.3 4.7 5.5 5.6 5.9 6.1Other manufacturing 8.2 8.4 8.9 9.1 9.2 9.3Share as % of Total GDP Manufacturing 17.9 18.4 19 19.7 20.5 21Food Processing 2.5 2.5 2.6 2.7 2.8 2.9Leather Products 0.8 0.8 0.8 0.9 0.9 0.9Textile & Clothing 7.1 7.2 7.5 8 8.4 8.7Chemical Fertilizer 1.9 1.8 1.9 1.9 1.9 1.9Machinery 4.8 5.2 5.4 5.3 5.5 5.5Petroleum products 0.8 0.8 0.8 0.9 0.9 0.9Other Manufacturing 0.8 0.9 0.8 0.9 1.0 1.1Sources of Growth in %Manufacturing 100.00 100.00 100.00 100.00 100.00 100.0Food Manufacturing 13.15 10.3 11.73 11.9 13.42 14.7Leather Products 5.29 3.89 4.04 4.75 4.60 4.47Textile & Clothing 46.38 59.31 54.38 55.49 54.38 53.47Chemical Fertilizer 8.65 6.28 6.84 6.49 6.06 5.72Machinery 24.34 18.44 19.14 17.85 18.05 17.68Total of 5 Products 97.82 98.2 96.12 96.48 96.51 96.03Other Manufacturing 2.18 1.8 3.88 3.52 3.49 3.97
Source: Adapted and Calculated from the data of BBS and SFYP Projections 3.4. Manufactured Exports to accelerate manufacturing growth For acceleration of manufacturing and economic growth, it is deemed necessary to ensure buoyant growth in export earnings and imports of capital goods and raw materials. Manufacture astoundingly constitutes 95% of Bangladesh exports in 2011. Plan document emphasized that main driver of manufacturing growth will be the export markets, although growing domestic demand from higher income generation will also provide impetus to it. Import substitution also needs serious attention in view of uncertainty of global market and scope of savings of foreign exchange for the goods which are possible to produce inside the country rather than to import. High manufacturing growth during the plan will hinge upon continuation and improvement on the superb export performance of the past two decades. The key is to produce competitive products in which Bangladesh has comparative advantage and formulate strategies to expand export markets. Export sector is planned to grow by 16% over the plan period which is the same rate as it was in the pre-global crisis period and is projected to grow to the level of 22% of GDP at the end of the period (Table-3.11). Data show that value of exports has been growing at the rate of 14% over the last five years. Much of the export growth was driven by the knitwear and woven garments sectors, which gained further momentum in the post MFA era. Exports from Bangladesh suffered during the global economic crisis although Bangladesh fared better than many global competitors. Exports

18
have strongly rebounded in 2011 due to stronger demand from both traditional markets ( EU and USA ) and non-traditional market for Bangladesh textile products. There has been surge in demand for jute and jute goods following years of steep decline. Manufactured exports growth has significantly positive impact on overall manufacturing growth, elasticity of manufacturing growth being 0.55 with respect to exports (Table-3.8). The result of regression indicates as well the need to look for domestic market expansion for manufacturing growth. Based on the recent performance, export sector under the Plan is projected to grow by 19.4% Per annum in US dollar terms, which is higher than usual because of the sharp increase in exports recorded in FY11 and need for acceleration of manufacturing growth induced by exports. The projection entails an increase in the share of exports in relation to GDP to rise by 7.7 percentage points to 23.9% of GDP by the end of the SFYP reflecting a leading role that export sector is envisaged to play in increasing domestic activity (Table-3.11). While clothing exports would continue to dominate the export outlook, some important non-traditional exports like footwear, other leather products and light engineering products (bicycle and electronic products), pharmaceuticals, and ship building are likely to grow at a much faster rate. Import payments are also likely to grow at a buoyant pace of 20.4% on average during the Plan period on account of an unusually strong growth in the first year of the Plan. The projected high import growth will address critical capacity constraints in the power and other infrastructure sectors along with capital machineries and raw materials for the industrial sector expansion. It is notable that exports growth should not be allowed to remain below imports growth for a long time to avoid balance of payment constrains to equilibrium growth. High proportion of manufactured exports to total exports to the extent of around 95%xiii implies the increased quality of exports (Fig.10). In absolute terms, both manufactured exports and imports were found to increase with resultant impact on manufactured trade balance to increase because of increased outstripping of exports by imports (Fig.11). Quality of total trade is on increase as evidenced by increased and high proportion of manufactured trade to total trade (fig.12).Again, proportion of manufactured exports to manufactured imports has been increasingly high over the years. As a result, proportion of manufactured trade balance to total trade has been on decline. Though proportion of primary products decreased during 2005-10, proportion of intermediate products or capital equipment or high tech products did not increase. Share of high tech products and capital equipment are stagnated at 0.2% and 0.3% respectively while share of intermediate products along with primary products has fallen considerably (Table-3.10). The result is that around 88% of export is composed of consumer goods in 2009 increased from 78% just five years back.. This may not be inconsistent with the technological background of the entrepreneurs and structure of the economy biased against technology oriented production. But positive aspect of structure of exports of Bangladesh is share of manufacture to the extent of 95% of total exports and this has been steadily increasing. One important structural change in manufacturing exports that has happened in Bangladesh is the emergence of a dynamic export-oriented readymade garments (RMG) sector (Table-3.7). The emergence and expansion of the RMG sector is the direct outcome of the global Multifibre Arrangement (MFA) regime, as well as conducive policies undertaken by the government to ensure global competitiveness of the industry. It was extremely good policy foresight that allowed the RMG industry not to be subjected to high tariffs, in terms of intermediate inputs and raw materials that have to be imported on upfront payment of duties. The RMG sector operates within a “free trade” enclave in that all imported inputs come in under a bonded system duty free. Had this not been the case, RMG exports would not have
19
reached the heights they have reached, given the economy’s import regime which is riddled with complex tariffs and other import restrictions. For the rest of exports and potential exports, getting world-priced imported inputs is a challenge. As a consequence, export diversification has not made much headway. It is notable that only five products including woven and knit garments constitute 87% of the total exports (Table-3.9). Manufacturing industries such as jute goods, leather and frozen foods, engineering products and pharmaceuticals have strong export potentials for driving the industry towards higher growth. But, unlike RMG, these industries are yet to become major contributors to the economy as can be seen from their export performance (Table 3.9). Thus export concentration in a single product group – RMG infuses an element of vulnerability to our export performance. For many decades prior to the emergence of RMG exports, jute and jute goods dominated the export sector making upto 70 percent of exports until 1981. By 1990, however, RMG exports had overtaken Bangladesh’s traditional exports and, by the close of the 1990s, export concentration emerged afresh, with RMG exports reaching a share of 77 percent. Share of RMG exports to manufactured exports constitute 30% in 2010 decreased from 69.3% in 1991(Table-3.7). While Bangladesh’s export growth for the last decade and a half could be characterized as robust, a sudden decline in demand for Bangladeshi garments would send shock waves throughout the economy. Such a prospect can be avoided through the creation of a diversified export basket. To promote export diversification, the Plan document mentioned that Government’s export policy has adopted a strategy of giving the highest priority to several emerging exports that demonstrate high potential (as follows). 1) Agro-products and agro-processing products; 2) Light engineering products (including auto-parts and bicycles); 3) Footwear and leather products; 4) Pharmaceutical products; 5) Software and ICT products; 6) Home textile; 7) Ocean-going Ship Building Industries; and 8) Toiletry Products. In order to increase the export potential as well as to diversify the export base, the Sixth Five Year Plan is set to seek further reduction of trade barriers within the context of the World Trade Organization (WTO) framework as well as seek more active cooperation with neighbours. Bangladesh will actively participate in concerned international and regional/sub-regional forums aimed at increasing Bangladesh’s access to international export markets, easing and eventually eliminating any non-trade barriers to Bangladeshi exports, encourage investments, increase trade in services including energy, promote regional connectivity, and establish best possible economic relations with all strategic countries. In addition, the Government is selectively giving bonded import facilities to more emerging exports (e.g. agro-processing, ship building). In future, this facility may not be limited to 100% export-oriented industries only but extended to industries producing for both domestic and export markets. Further, the Duty Drawback Scheme will be revamped to ensure world-priced inputs to exporting firms without long lags and high transaction costs for reimbursements. It is notable that RMG is yet to expand and diversify in several sub-product lines and market destinations, and the global competitiveness in these products needs to be used effectively.

20
Table 3.7 Dynamics of the Structure of Bangladesh Exports and structure of Manufactured exports, FY1981-FY2010 FY1981 FY1991 FY2001 FY2010 Exports as % GDP 4.1 6.8 10.6 17.2 Manufacturing share of Total Exports in %
65.5 78.9 92.1 90.9
Manufactured Exports as % of GDP 2.69 5.36 9.76 15.63 RMG (% of Total Exports) 0.1 38.9 56.1 77.1 RMG as % to Manufactured exports 0.07 30.7 51.67 70.1 Non-RMG as %Manufactured Exports 99.93 69.3 48.33 29.9 Source: Adapted from Bangladesh Bureau of Statistics (BBS) and BPC,
Table-3.8 Regression of Manufactured Exports on Manufactured Growth
Model
Unstandardized
Coefficients
Standardized
Coefficients
T Sig. B Std. Error Beta
1 (Constant) -1.046 5.693 -.184 .855
DIFF(manufacturing growth,1) .550 .268 .328 2.055 .047
A djusted R Squared=0.0882, F=4.22, DW=2.8
Fig.11: Trend of Manufactured Exports, Imports and Trade balance
Fig.10. Change of Manufacturing Share of Exports during 1981-2010

21
Fig.12: % Mfg trade to total trade,% mfg exports to mfg imports and mfg trade balance to Total Trade

22
Table-3.9 Recent Export Performance During 2006-10 Categories FY06 FY07 FY08 FY09 FY10 Average of 2006-10
As% of Total E t
Woven Garments 38.8 38.2 36.6 38.1 37 37.77 Knit Wear 36.3 37.4 39.2 41.4 40 38.86 Raw Jute 1.4 1.2 1.2 0.8 1.2 1.16Jute Goods 3.4 2.6 2.3 1.7 3.3 2.66Leather 2.4 2.2 2 1.1 1.4 1.82Frozen Food 4.4 4.2 3.8 2.9 2.7 3.6Others 13.3 14.2 14.9 14 14.4 14.16 Total Exports 100 100 100 100 100 100Annual Growth Woven Garments 13.3 14.1 10.9 14.5 1.6 10.88
Knitwear 35.3 19.3 21.5 16.2 0.8 18.62 Raw Jute 54.2 -0.7 12.3 -21.9 52.3 19.24 Jute Goods 17.6 -11 -0.8 -15.3 100 18.10 Leather 16.3 3.5 6.9 -37.8 27.8 3.34Frozen 9 12.2 3.7 -15 -2 1.58Total 21.6 15.7 15.8 10.1 4.2 13.48
Source: Calculated from the Data of EPB Table-3.10 Structure of Exports By Stages of Processing
Source: Adapted and Calculated from the Data of UNCTAD Table-3.11 Export, Import and Balance of Payment Projections in the Sixth Five Year Plan Period
Components: FY10 FY11 FY12 FY13 FY14 FY15 Average Exports in Billion Dollars 16.2 22.4 25.7 29.4 33.8 38.8 30 (annual Percent Change) 4.2 38 14.5 14.5 14.5 15 19.4 Export as %GDP 16.2 20.3 21.2 22.1 23 23.9 22.1 Import in Billion Dollars 21.4 31 35.4 40.3 46.1 52.8 41.1 (annual Percent Change) 5.4 45 14 14 14.5 14.5 20.4 Import as % GDP 21.3 28.2 29.2 30.3 31.4 32.5 30.3 Current Account Balance in Billion Dollars 3.7 -0.3 -0.2 -0.2 -0.5 -0.7 -0.4(percent of GDP 3.7 -0.3 -0.2 -0.2 -0.3 -0.4 -0.3
Source: BBS, Bangladesh Bank, Ministry of Finance and SFYP
Indicators 2005 2006 2007 2008 2009
Exports in value in 000 Dollars 9331406 11696539 13142843 16773287 17074095 A. Share of Manufacture in % 92.5 92.7 90.6 94.9 95.2 Share of consumer goods (%) 78.1 75.3 75.8 86.4 88.8 Share of intermediates (%) 13.4 17.1 13 7.8 5.9 Share of capital (equipment) (%) 0.7 0.6 1.7 0.5 0.3 Share of high-tech products (%) 0.3 0.2 0.1 0.2 0.2
B. Share of Primary Goods 7.5 7.3 9.4 5.1 4.8
Total 100 100 100 100 100
23
IV. Manufacturing Employment as New conduit of Job creation and rebalancing of employment With labour force growing by 3.2% per year and the very high level of underemployment (around 24%) in the farm and informal services sectors, creation of new jobs in the productive formal sectors of the economy, particularly manufacturing will be a major challenge for Bangladesh. The growth strategy and the underlying sectoral shift projected in the Sixth Five Year Plan aim to address the employment issue by creating new jobs in the nonfarm sector and by a rebalancing of the composition of employment away from agriculture and into more productive sectors of the economy, namely manufacturing. Historically, over the period 1974-2010, there has been structural shift of employment from agriculture to service activities with industry slowly treading to absorb some surplus labour force. Share of agriculture during the period has declined by 33.8% while share of service employment has increased by 26.5% and share of industry by 7.3% (Fig.9). This trend is also visible in the data of recent Bangladesh Bureau of Statistics (BBS) survey of farm and nonfarm employment, which shows that in the four year period through 2010, more than 600,000 workers switched from agriculture to nonfarm sectors, in addition to another 3.6 million workers who joined various nonfarm activities during the same period. The share of the agricultural sector in the labor force has accordingly dropped by 4.6 percentage points during the 4-year period to 43.6% by 2010 (Table 4.1). There has been reduction of employment share of agriculture by 4.6% and increased employment in services by 3% and the rest 1.6% increased in industry: manufacturing employment by 0.7% and construction by 0.9% during 2006-10. Major absorbers of manufacturing employment are textile , garments. agro-processing, food and beverage and light engineering. These five products constitute 97.3% of total manufacturing employment in Bangladesh (Table-4.2). Accelerated growth in manufacturing, construction and services sectors projected under the Plan should help the creation of 10.4 million new jobs in these sectors of the economy, which should be sufficient to absorb all new entrants in the job market (about 9.2 million) and also enable a sizable numbers of workers to find jobs away from the agriculture sector (about 1.2 million). The changing pattern of projected employment is shown in Table 4.3. Total manufacturing employment is projected to increase from 11.6% in 2010 to 18.5% by 2015 with average of 15% share of the total. .Agricultural employment is projected to decline from 44.3% in 2010 to 35% by 2015.Service sector is projected to increase to 44.3% in 2015 from 43.8% in 2010. Construction sector is projected to increase to 4.7% by 2015 from 3.6% in 2010. Average growth of labour force is projected at 3.2% which is about the same for employment growth during plan period. Still there would be average unemployed per year to the extent of 2.3 million people in the country constituting around 4% unemployment rate. Manufacturing employment growth rate has been projected at 9.73% on average which is near to reality (Table-4.3). Manufacturing elasticity of employment is around 0.32 which need to be increased considerably with increased employment intensive and higher productive manufacturing in the country. It is understandable that investment and capacity utilization of manufacturing sector need to be geared upwards to maintain the manufacturing employment growth target under the plan. Employment expansion is going to be a major challenge, but with the accelerated growth in the nonfarm sectors projected under the Plan, the economy should be able to create the targeted level of new jobs in the nonfarm sector. With the continued migration of labor force away from the agriculture sector and into more productive sectors of the economy, the problem of underemployment will diminish significantly. The recent migration of workers

24
from the agriculture sector has already started to push up agricultural wages leading to higher income levels for the rural workers. If the Plan succeeds in its employment strategy and achievement of the projections as envisaged, there will be a visible reduction in the level of underemployment and a steady increase in real wages of the workers, which are essential for successful poverty reduction strategy in the country. Productivity enhancement, employment expansion and raising real wages are the three intertwined critical elements of employment strategy that will act simultaneously for addressing the growth acceleration and poverty reduction. The employment challenge in Bangladesh, as Sixth Five Year Plan documentxiv noted, is not just to create any job but to create high income jobs in the formal sectors. At present, as the plan document recognized, some 78 percent of the labor force is engaged in low-income, low productivity jobs in the informal sectors. The employment target for the Sixth Plan is to create adequate number of high productivity, high income jobs not only for new entrants but also to allow a substantial transfer of labor from the informal sector to the formal sector of manufacturing and services. In the circumstances that large part of the labor force is occupied in informal services with low productivity, the economic growth process in the Sixth Plan has been through creating more employment opportunities in the manufacturing and organized service sectors and allowing a transfer of a large number of workers engaged in low productive employment in agriculture and informal services sector of the economy to these higher income jobs. Therefore, much of the high productivity, high income jobs will need to come from a labour intensive manufacturing sector based on domestic and export markets and from organized services. Both large and small enterprises need to contribute to this growth. Emphasis would be placed on sub-contracting system in manufacturing and diversification into products dependent on imported contents but employing large labor force. Fig.9. Shift in the Structure of employment in the economy

25
Table 4.1 Shift in the Structure of Employment, 2005/6-10
FY06 FY10Sectors (In Millions) Agriculture 22.9 22.3
Manufacturing 5.3 6.0
Construction 1.5 2.0 Service 17.8 19.7 Total 47.4 51.0 Employment by Sector (In Percent)
Agriculture 48.3 43.7 Manufacturing 11.2 11.9 Construction 3.0 3.9 Services 37.5 40.5
Source: Adapted and Calculated from the data of Bangladesh Bureau of Statistics, Labor Force Surveys Table-4.2 Employment Status of major nine Manufacturing Sectors (95% of Total Mfg Value Added)
Industries
Manufacturing Employment in 2010 (Thousand) % Employment
Leather Footwear Industry 16.6 0.13 Food and Beverage 1340.1 10.27Light Engineering 718.4 5.51 Pharmaceuticals 69 0.53 RMG 3100 23.76 Jute Textiles 18.2 0.14 Shipbuilding 250 1.92 Textile Industry 6007.7 46.04 Agro-processing 1529.1 11.72 Total Nine Products 13049.1 100.00
Source: Adapted from BBS and BPC

26
Table-4.3 Projected Pattern of Employment in the SFYP (Millions)
Sector FY10 FY11 FY12 FY 13 FY14 FY15 Average SFYP
Agriculture 23.2 23 22.8 22.6 22.3 22 22.54
Manufacturing 6.1 6.7 7.4 8 8.7 9.7 8.1
Construction 1.9 2.1 2.3 2.5 2.7 2.9 2.5
Services 21.2 22.3 23.2 24.6 25.8 27 24.58
Total Employment 52.4 54.1 55.8 57.7 59.5 61.6 57.74
% Agricultural Employment 44.27 42.51 40.86 39.17 37.48 35.71 39.04 % Manufacturing Employment to total Employment 11.64 12.79 14.12 15.27 16.6 18.51
15.46
% Construction Employment 3.63 4.01 4.39 4.77 5.15 5.53 4.77
% Service Employment 40.46 42.56 44.27 46.95 49.24 51.53 46.91
Employment Growth (%) 4 3.2 3.1 3.3 3.2 3.2 3.2
Agri employment growth -0.86 -0.87 -0.88 -1.33 -1.35 -1.06
Mfg employment Growth 9.84 10.45 8.11 8.75 11.49 9.73
Construction Employment Growth 10.53 9.52 8.70 8.00 7.41 8.83 Service Employment Growth 5.19 4.04 6.03 4.88 4.65 4.96 % Agri Contribution -10.41 -10.69 -8.29 -13.20 -10.79 -10.67 % Mfg Contribution 35.73 44.38 29.89 38.54 47.76 39.26 % Construction 11.98 12.57 10.01 10.94 9.21 10.94 % Service Contribution 62.70 53.74 68.39 63.72 53.82 60.47 % Total Growth 100.00 100.00 100.00 100.00 100.00 100.00 Additional Employment in Million 1.7 1.7 1.8 1.9 1.78 Unemployment Rate (%) 4 4.1 4 4 4 3.7 3.96 Labor Force 54.5 56.2 58 59.9 61.8 63.7 59.92
Growth of Labour Force 3.12 3.2 3.28 3.17 3.07 3.17 Source: Adapted and calculated from the data of SFYP Projections, BPC,GOB
V. Factor Intensities, Scale of Operation and Productivities in Manufacturing 5.1. Factor Intensities and Productivities in organized manufacturing As observed from historical data of Bangladesh economy, capital intensiveness has increased considerably from o.012 to o.273 Million constant Taka during 1972-2005. Size of capital and value added per enterprise also increased by nearly 10 times from 1970s to 2000s. Similarly, labour productivity has also increased manifold. Capital productivity has not increased, rather decreased. Interestingly, value added to output ratio remained steady at near about 25% with slight increase in 2006-10 (Table-5.1). Manufacturing sector of Bangladesh experienced increased capital labour ratio , increased scale of operation in terms of capital , value added and gross output per enterprise, increased factor productivities( labour productivity and Capital Productivity) and value added output ratio. There has been increased profitability from 36.3% to 45.6% during 1998-2006(Table-5.2). Productivity with respect to wage level was 338.5% in 2006 increased from 239.7% in 1998. Output capital ratio was 2.07 in 2006 declined from 2.62 in 2000.Growth of fixed assets and value added was spectacularly high of 175% and 202% in 2006 as compared to 14% and 17% respectively in 2000. Growth of total productivity was 2.39% in 2006 increased from 1.73 % in 2000. Thus growth of factors-capital and labour and outcome-value added and positive total productivity

27
growth and stable profitability have contributed to manufacturing growth of manufacturing in Bangladesh. Table-5.1 Capital Labour Ratio and Productivities
Economic Phases
Percent of Value added
to output
Average value added constant million taka per enterprise
Capital labour ratio in Million Taka per person
Capital Productivi
ty
Average Fixed
Assets per enterprise
Output in Constant
Million Taka per
enterprise 1996
Labour Productivi
ty in Million
Taka per Person
1972-80 25.349 1.696 0.012 0.824 1.879 6.145 0.012 1981-85 25.360 3.033 0.035 0.741 4.185 11.953 0.025 1986-90 25.289 2.463 0.064 0.590 4.058 9.522 0.037 1991-95 25.417 2.734 0.089 0.618 4.405 10.703 0.056 1996-00 23.780 5.916 0.114 0.631 9.353 24.762 0.072
2001-05 26.680 16.173 0.273 0.619 25.592 57.247 0.172
Source: Estimated from the data of BBS Table-5.2 Longitudinal Status of Indicators of Profitability and Total Productivity growth of Organised Mfg sector of Bangladesh during 1998-2006 Indicators of Performance 1997-98 1999-2000 2001-2002 2005-06 Profitability in % 36.28 39.83 35.85 45.63 Productivity wage ratio in % 239.63 265.42 254.18 338.53 Output capital Ratio
2 692.62 2.68 2.07
Growth of Fixed Assets 13.55 37.87 175.24 Growth of Labour 7.39 9.12 35.26 Growth of Value Added 16.56 27.49 201.58 Growth of Total Productivity 1.73 1.43 2.39
Source: Calculated from the data of CMI Statistics of several years. 5.2. State of subsectoral factor intensities and Productivities and their Link in manufacturing One of the critical observations on link between capital intensiveness and labour productivity is that (as revealed from the data analysis of SMEF Survey of Six Sectors) xv, different sectors show different pattern of capital intensiveness and labour productivity by size of manufacturing (Table-5.2). Highest capital labour ratio belongs to small enterprise followed by large enterprise. Lowest capital labour ratio is in micro enterprise followed by medium enterprise . In general, relatively more labour intensive subsectors are agro-processing, light engineering and electrical & electronics. Capital labour ratio is the lowest in electrical and electronics sub-sector followed by light engineering and agro-processing. Highest capital labour ratio is found in plastics followed by designer goods and leather and footwear. In light engineering, lowest capital labour ratio is in medium size followed by micro enterprise. In electrical and electronics, lowest capital labour ratio is in large enterprise followed by small enterprise. In agro-processing, lowest capital labour ratio is in micro enterprise followed by small enterprise. In plastics, lowest capital labour ratio is in micro enterprise followed by medium enterprise. In leather and footwear, smallest capital labour ratio is in large enterprise followed by small enterprise. In respect of labour productivity, medium enterprise ranks first followed by small enterprise. Subsector with the highest labour productivity is plastics followed by leather sector , which

28
are highly capital intensive. Lowest labour productivity is in designer goods followed by agro-processing. Light engineering with low capital labour ratio has reasonably high productivity. Electrical and electronics with lowest capital labour ratio has reasonably high labour productivity. Same is the case with agro-processing. Thus though some conformity is there between capital labour ratio and labour productivity, such relation is not so straight forward. High labour intensiveness does not imply always low labour productivity. This might be because of involvement of special skill needed in many labour intensive works like light engineering, electronics and agro-processing. However, labour productivity is associated with capital intensiveness in plastics and leather and footwear. Estimate shows that share of gross value added to output is on average 43% with the highest 48.5% in micro enterprise followed by large enterprise with 45%. Lowest value added to output is in small enterprise group. Highest value added to output is in designer goods followed by agro processing and leather and footwear. Here also there is no definite pattern of relation with size or sector. In agro-processing, capital intensiveness increases with size of enterprise while labour productivity is the highest in small size followed by micro enterprise..In leather, capital labour ratio is the lowest in large enterprise followed by small enterprise while labour productivity is the highest in medium enterprise followed by small enterprises. Thus there is visibly no any definite pattern of relationship between size and capital intensiveness and labour productivity and proportion of value added to output, and there is a large variation in between the sectors in such relationships. All these mean that scale of operation and desirable factor proportion in Bangladesh manufacturing are yet to be settled with more detailed investigation. Table-5. 2 Capital Labour Ratio and Labour Productivity in Different sizes of Selected Manufacturing enterprises (000 Taka) Firm Sizes Agro &
Food Processing
Leather & Footwear
Designer Goods
Electrical & Electronics
Plastics Light Engineering
All
Capital labour Ratio Micro 53.5 283.5 63.5 38.58 229 69.97 123.0 Small 80.12 248.8 93.7 27.99 2543 75.99 511.6 Medium 160.5 289.1 284.6 30.37 458 63.12 214.3 Large 217.3 52.7 988.5 22.31 542 77.36 316.7 All 127.8 218.53 357.58 29.81 943.00 71.61 291.4 Labour Productivity Micro 830 3081.89 78.6 1635 6812 2000 2406.3 Small 967.6 3543.86 138 1076 7853 4110 2948.1 Medium 396 6045.96 164.8 457 10636 2490 3364.9 Large 784.7 3502.24 57.6 587 8501 2350 2630.4 All 744.6 4043.49 109.75 938.75 8450.5 2737.50 2837.4 Value Added to Output Micro 40.4 47.3 74.1 38.8 32 58.4 48.5 Small 44.3 22.6 59.4 36.8 32.4 34.8 38.4 Medium 52.2 45.3 46.8 29.6 30.4 36.7 40.2 Large 51 57 60 34.6 35 31 44.8 All 46.98 43.05 60.08 34.95 32.45 40.23 43.0 Source: Adapted and calculated from the SMEF Survey of Six Sectors,2006.07 Note: Micro, small, medium and large enterprises are those employing 1-9,10-49 workers,50-99 w3orkers and 100 and more workers respectively as per BBS Definition.

29
5.3. Status of Major Nine Manufacturing Subsectors As visible from the data analysis, only nine products constitute 95% of Gross Value Added. Among them, four products- textile, RMG, food processing and agro processing absorb 91% of employment and constitute 92% Gross value added and 94% exports (Table-5.3). All these belong to low technology products. Thus manufacturing sector is narrowly concentrated in low technology based products. Jute textiles, garments, light engineering, leather and footwear and food and beverage have relatively higher export intensiveness. Emerging export industries are pharmaceuticals and textiles. Among the labour intensive industries, light engineering, textiles, food and beverage stand prominent. Labour productivity is relatively higher in leather and footwear, pharmaceuticals, jute textiles, RMG and agro-processing. Table-5.3 Employment, Value Added and Exports of Key Manufacturing Subsectors
Industries
Employment in 2010 (000) % Employment
Gross Value Added in % total Mfg
Exports in Million Dollars in 2010
% Exports to total
Labour intensiveness
Relative Productivity level
Relative Export intensiveness
Export per Labour
Leather and Footwear 16.6 0.13 0.8 204.1 1.3 0.16 6.15 1.63 12295.Food and Beverage 1340.1 10.27 4.1 687.5 4.38 2.50 0.40 1.07 513.0 Light Engineering 718.4 5.51 0.5 190 1.21 11.02 0.09 2.42 264.5Pharmaceuticals 69 0.53 1 40.97 0.26 0.53 1.89 0.26 593.8RMG 3100 23.76 36.7 12497 79.65 0.65 1.54 2.17 4031.3Jute Textiles 18.2 0.14 0.8 540 3.44 0.18 5.71 4.30 29670.Shipbuilding 250 1.92 9.34 0.06 37.4Textile Industry 6007.7 46.04 13.1 598.1 3.81 3.51 0.28 0.29 99.6Agro-processing 1529.1 11.72 38.2 921.9 5.88 0.31 3.26 0.15 602.9Total Nine Products 13049.1 100 95.2 15688.9 100 1.05 0.95 1.05 1202.3
Source: Adapted and Calculated from the Data of BPC 5.4.Regression Results regarding link between factor intensities and productivities We have made two types regression exercises; one for time series and another for cross sectional relations taking 225 samples. Time series regression exercise shows significant positive impact of capital labour ratio and capital productivity on labour productivity which is consistent with theoretical expectation (Table-5.3). Second exercise with cross sectional data shows that while capital productivity has significant positive impact, capital labour ratio has insignificant positive impact on labour productivity (Table-5.4). Similarly, regression of profitability using cross sectional data (Table-5.5) shows that while size and capital productivity have significant positive impact on profitability, capital intensiveness in terms of capital labour ratio showed insignificant impact implying that more capital intensive firms are not necessarily more profitable ones. This means that capital intensive technology may not increase productivity always in all sectors. Thus appropriate technology choice of the sectors depending upon its characteristics would become major strategic concern for the enterprises. Table-5.3 Regression of First Difference of Labour Productivity in Manufacturing sector of Bangladesh
Model
Unstandardized Coefficients Standardized Coefficients
T Sig. B Std. Error Beta
1 (Constant) -279.560 1403.862 -.199 .845
DIFF(capital productivity) 47441.997 8199.397 .649 5.786 .000
DIFF(Capital labour ratio) .875 .152 .647 5.766 .000Adjusted R Squared=0.774, F=31.4, DW=2.16

30
Table-5.4 Regression of First Difference of Capital Productivity
Model
Unstandardized Coefficients Standardized Coefficients
T Sig. B Std. Error Beta
1 (Constant) -0.030 0.030 -..997 .333
Difference of Lab Productivity,1 0.0000085 0.000 0.618 3.242 0.005
Adjusted R Squared=0.35,F=10.5,DW=2.9.
Table-5.5
Regression of Profitability on Size of enterprises, Capital Labour Ratio and Capital Productivity: Subsectoral Coefficientsa
Model
Unstandardized Coefficients Standardized Coefficients
T Sig. B Std. Error Beta 1.000000
(Constant) -97.429217 24.284918 -4.011923 0.000085
Enterprise Size in Output 0.000124 0.000044 0.032580 2.836473 0.005026
Capital Labour Ratio 0.006646 0.012733 0.004258 0.521967 0.602265
Capital Productivity in % 0.961327 0.011373 0.970256 84.525686 0.000000
Adjusted R Squared=0.987, F=5005 (0)
VI. Status of Competitive Industrial Performance of Bangladesh 6.1. Longitudinal Status of Indicators of Industrial Performance of Bangladesh (at Country Level) Industrial capacity and manufactured export capacity (as shown in fig.14) have increased tremendously (19.3 times and 29.9 times respectively in 2006-10 as compared to 1973-78). Astoundingly, export quality in terms of percentage of manufacture as % exports has increased considerably (from 61% in 1973-78 to 95% in 2006-10). However, industrialization intensity in Bangladesh has increased over the years albeit at a snail pace ((1.6 times in 2006-10 as compared to 1973-78). Fig.14:Indicators of Competitive Industrial Performance of Bangladesh
31
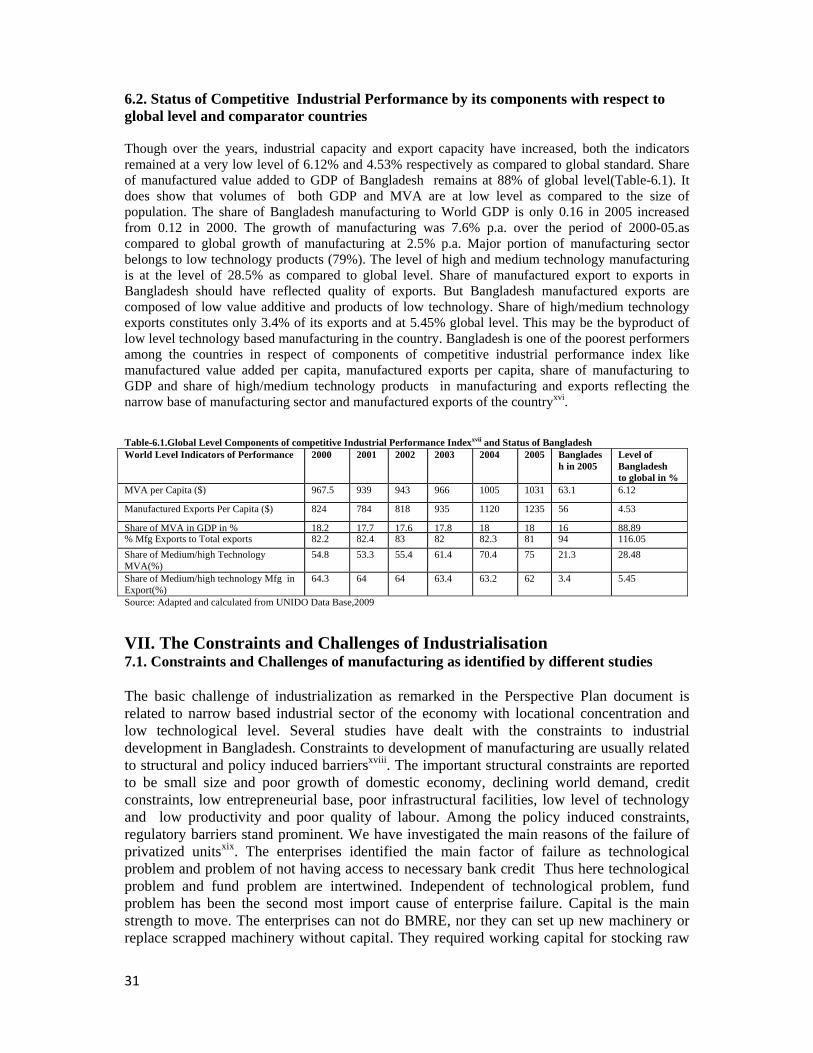
6.2. Status of Competitive Industrial Performance by its components with respect to global level and comparator countries Though over the years, industrial capacity and export capacity have increased, both the indicators remained at a very low level of 6.12% and 4.53% respectively as compared to global standard. Share of manufactured value added to GDP of Bangladesh remains at 88% of global level(Table-6.1). It does show that volumes of both GDP and MVA are at low level as compared to the size of population. The share of Bangladesh manufacturing to World GDP is only 0.16 in 2005 increased from 0.12 in 2000. The growth of manufacturing was 7.6% p.a. over the period of 2000-05.as compared to global growth of manufacturing at 2.5% p.a. Major portion of manufacturing sector belongs to low technology products (79%). The level of high and medium technology manufacturing is at the level of 28.5% as compared to global level. Share of manufactured export to exports in Bangladesh should have reflected quality of exports. But Bangladesh manufactured exports are composed of low value additive and products of low technology. Share of high/medium technology exports constitutes only 3.4% of its exports and at 5.45% global level. This may be the byproduct of low level technology based manufacturing in the country. Bangladesh is one of the poorest performers among the countries in respect of components of competitive industrial performance index like manufactured value added per capita, manufactured exports per capita, share of manufacturing to GDP and share of high/medium technology products in manufacturing and exports reflecting the narrow base of manufacturing sector and manufactured exports of the countryxvi. Table-6.1.Global Level Components of competitive Industrial Performance Indexxvii and Status of Bangladesh World Level Indicators of Performance 2000 2001 2002 2003 2004 2005 Banglades
h in 2005 Level of Bangladesh to global in %
MVA per Capita ($) 967.5 939 943 966 1005 1031 63.1 6.12
Manufactured Exports Per Capita ($) 824 784 818 935 1120 1235 56 4.53
Share of MVA in GDP in % 18.2 17.7 17.6 17.8 18 18 16 88.89 % Mfg Exports to Total exports 82.2 82.4 83 82 82.3 81 94 116.05 Share of Medium/high Technology MVA(%)
54.8 53.3 55.4 61.4 70.4 75 21.3 28.48
Share of Medium/high technology Mfg in Export(%)
64.3 64 64 63.4 63.2 62 3.4 5.45
Source: Adapted and calculated from UNIDO Data Base,2009
VII. The Constraints and Challenges of Industrialisation 7.1. Constraints and Challenges of manufacturing as identified by different studies The basic challenge of industrialization as remarked in the Perspective Plan document is related to narrow based industrial sector of the economy with locational concentration and low technological level. Several studies have dealt with the constraints to industrial development in Bangladesh. Constraints to development of manufacturing are usually related to structural and policy induced barriersxviii. The important structural constraints are reported to be small size and poor growth of domestic economy, declining world demand, credit constraints, low entrepreneurial base, poor infrastructural facilities, low level of technology and low productivity and poor quality of labour. Among the policy induced constraints, regulatory barriers stand prominent. We have investigated the main reasons of the failure of privatized unitsxix. The enterprises identified the main factor of failure as technological problem and problem of not having access to necessary bank credit Thus here technological problem and fund problem are intertwined. Independent of technological problem, fund problem has been the second most import cause of enterprise failure. Capital is the main strength to move. The enterprises can not do BMRE, nor they can set up new machinery or replace scrapped machinery without capital. They required working capital for stocking raw
32
materials for smooth running of the enterprise through out the year. In the competitive market, they require credit sale , they require keeping inventory for good price in future. All these could be done if they could manage good amount of capital. Lack of capital in many cases befell the enterprise into critical crisis and made it a failure case. Once failed , more would be the problem of capital to manage. Thus capital shortage is the cause of failure and failure becomes the cause of capital shortage for the enterprise successively. Next serious reason of enterprise failure is the problem of electricity supply. Related to this problem is the problem of lack of gas connection for the generator. In the situation of load shedding, in those areas, the capacity remains heavily underutilized and the production becomes unpredictable frustrating both the workers and the entrepreneur. Such situation causes ground for failure of the enterprise. Next important cause of failure is related to marketing problem which arises because of high cost of production not commensurate with sale price, tough competition from imports and domestic manufacturers, high cost of raw materials and mismatch between increased cost of imported raw materials and government determined price of the product. All these contribute to lowering profit margin and eventually loss making situation and failure of the enterprise. Negative trade union ship has been a reason for failure not only of public enterprises but also private enterprises. Another important reason for failure is long term closure of factory affecting the productive capacity of the machines and raising the cost of BMRE and maintenance cost .Among the other reasons, looting and extortion by miscreants, high interest on loan, natural disaster, high cost of transport, low level of management, lack of policy support from the government stood prominent causing failure of the privatized units. In another study we have pinpointed the problems and challenges of manufacturing xx. Mozammel Huq (1996)xxi in a survey on Leather manufacturing has identified several constraints of manufacturing. In his study , all the respondents complained about adverse effects of load shedding on cost of production. They talked of other poor infrastructural facilities including shortages of gas supplies, badly maintained and congested roads, and the poor communication systems. Of the various non-physical infrastructural facilities,, absence of adequate and properly trained technical personnel was found to have affected the development of manufacturing activities. Along with infrastructural bottlenecks and poor governance he has mentioned about the market failure and government failure for technology capacity building involving technology learning through human capital development and R&D. Besides, there is a weakness in making investment so as to maximize linkage effects. Bhattacharya(1996)xxii in his study found that in 48.5% cases, unsatisfactory shipment facilities acted as major constraint for development of export oriented apparel sector. Sixth Five Year Plan document pinpointed such constraints as weak investment climate, power shortages, anti-export bias of the trade regime, difficulty having access to suitable land for manufacturing, inadequate credit access, low labour productivity and low level of technology, gender bias in giving to the female workers, weak research and development. Among the constraint of government regulations and enforcements, problems of complex taxation rules, red tape, delay in getting verdict of the court are considered important. The Plan document also pinpoints the problem of slow privatization process due to incomplete and complicated proceduresxxiii. In the SMEF survey of six sectors,2006/07, some general constraints and sector specific constraints have been revealed. The major general constraints are related to inability to market products, inability to maintain product quality, poor fixed and working capital, lack of skilled technicians and workers, poor management skill of entrepreneurs, lack of information, non-tariff barriers in world trade regimes, poor enabling environment, insufficient infrastructure support, widespread tariff anomalies, low level of technology, low productivity, lack of Research and development and low level of education of entrepreneurs.

33
We have identified problems of manufacturing as follows. i. Irregular and Inadequate Supply of Power and Energy ii. Marketing Problem specifically related to global market uncertainty and
financial crisis iii. Difficulty of access to finance specially for the Small enterprises iv. High Interest Rate v. Backward Infrastructure vi. High cost of doing business and high trade transaction cost vii. Environmental Hazards and adverse effect of climate change viii. Poor testing facilities and of certification ix. High Cost of Raw materials x. Scarcity of Skilled Manpower xi. Technological Problem xii. Poor Labour management relation xiii. Low level of research and development hampering product development and
product quality xiv. Locational Problems xv. Lack of Confidence of the investors xvi. Security Problem and Problem of extortion xvii. Poor quality governance and inadequate institutional facilities in the delivery
of utility services xviii. Competition from imports and domestic producers at home and suppliers in
global market xix. Limited domestic demand because of low purchasing power of the People
We have pinpointed the emerging challenges of manufacturing investment as i. Problem of protecting domestic industries from import pressure in the context of global economic crisis and challenges for import substitution in the neoliberal policy framework of the government; ii. Facing tougher competition in the global market amidst more protected trade regimes and greater stimulus package in the buying countries and competing exporting countries; iii. Coping with crisis in power and energy sectors; iv. Coping with hazards of climate change; v. Strengthening competitiveness by increasing productivity leading to reduced cost of production and reducing time of delivery and trade transaction cost and increasing quality of the products; vi. Ensuring easier market access in buying countries; vii. Increasing quality of public spending and implementation of Annual Development Programme; viii. Liquidity problem in money market and capital market; ix. Productive use of remittance money to translate them into productive investment; x. Diversification of markets and products for exports; and xi. Compliance with WTO rules and Uncertainty of WTO Negotiations and regulations. 7.2. Sector Specific Constraints and Challenges for manufacturing development identified by Plan document The SFYP document identified ten medium and large industries (RMG, non-RMG textiles, Jute industry, footwear and leather , light engineering, agro-processing, ship building,

34
pharmaceuticals, steel and engineering, electronics and chemical industries) for analysis and attempted to identify their constraints and emerging challenges. RMG is reported to face four major challenges, linkage expansion for speedy supply, ensuring social compliance and bettering working conditions, shift to qualitative improvement and product upgradation and product and market diversification and improvement of infrastructure and logistic support service, development of skilled manpower. Challenges faced by jute industry are :inadequate quality seeds and rotting facilities hampering productivity of raw-jute cultivation, high cost of production due to excess labour in public enterprises, power shortage, lack of aggressive marketing drive for entering into overseas market and lack of legal compulsion to use jute in the domestic economy. The challenges faced by Footwear industry are lack of comprehensive policy with proper inputs, shortage of adequately trained and skilled human resources, lack of training institute and inadequate facilities for skill development, absence of supportive linkage industries, low awareness of international buyers about the capability to produce quality shoes in this country, nor there is enough number of factories to draw attention, poor representation in international fairs, inadequate facilities for design and product development, low awareness of international quality standards such as eco-labeling and packaging, lack of suitable enabling environment in the customs facilities, inadequate working capital finance, lack of access to local market making the enterprises vulnerable to the perils stock lot or order cancellations and political instability. The challenges faced by light engineering are occasional price hike of raw-materials, high duties on quality raw-materials needed for specialized products, lack of education and training of the entrepreneurs for high quality products, low level R&D works, inadequate access to working capital, cumbersome bank loan procedure, limited financial support for technological upgradation, lack of metal and heat testing facility, lack of skilled manpower for quality products, power cuts, poor marketing techniques and poor designing ability. The key challenges of pharmaceutical industry are related to poor image of the country affecting the image of enterprises, lack of promotion capacity of Bangladesh Missions abroad, negligence of new drug policy to deal with export of medicine, poor quality of government documents. limit of samples for sending to the imports, lack of local testing facilities, cumbersome documentation procedure for certain export destinations, limitation in foreign currency transactions to maintain marketing offices abroad. The key challenges of agro-processing industry are related to improving the quality of inputs, products, technology, business services and environment, increasing production efficiency and product quality to better meet consumer and export demands, limited number of products, lack of information about compliance requirements for export items at various destinations, lack of adequate information on food safety and agricultural food standards, weak supply chains and lack of information about Bangladeshi agro-processing produce in countries where Bangladesh is not currently exporting to. The ship building industry is reported to face challenges of import dependence of almost all raw materials, ranging from engines to steel, electronics, furnishings, cabling and piping, low standard of local component and service suppliers and low volume of local produce of components (10%), facing higher interest and service charges from local banks, poor quality

35
public utilities, problem of red tape, especially when trying to obtain licenses and exporting and importing goods, shortage of qualified mid management professionals and skilled workers and high cost of doing business discouraging joint venture with foreign companies. Main factors to act as barriers to ship building industry are related to non-availability of large tracts of land adjacent to deep water, lack of significant funding, lack of skilled manpower and requirement of certification of meeting international standard. VIII. Strategic Options for Manufacturing Development of Bangladesh 8.1. Review of Broad Strategies and key areas of intervention needed for development of Manufacturing sector On strategic front of manufacturing development, our independent views may be expressed as follows. i. Strategy on Market Orientation In the context of uncertainty and instability of global market and in the situation of large emerging domestic market needs, strategy of import substitution or manufacturing for domestic market need more emphasis for domestic capability building as a precedence for effective global integration and export expansion. One can’t ignore the fact that one dollar saved is one dollar earned. It is important more in the situation of uncertainty and instability of global market and for small countries to deal with complexities of international trade. There is a need for emphasis on complementarity and balance between export expansion , domestic demand expansion and import substitution for broad based and sustainable development of manufacturing. The country need to revisit industrial strategies to pursue parallel growth mechanism of giving due weights to both import substitution and domestic demand expansion along with export expansion for accelerating growth of manufacturing and for broad based industrial development as done by East Asia in their earlier stage of development. The pragmatic approach of industrial strategy is to enhance industrial competitiveness to strengthen the ability of exporters and import substituting industries to compete in the global market. ii. Strategy on Size of Manufacturing There is a concern regarding which size need to be emphasized for development of manufacturing. Since there is a huge number of micro and small enterprises and large number of people engaged there as shown in our earlier analysis, the country need to address the problems of micro and small enterprises for their productivity enhancement oriented to poverty alleviation. In the efforts making, micro, small, medium and large enterprises need to be well demarcated for separate treatment to each considering their individual characteristics and problems across the sectors, and their definition should be uniform across the regulatory authorities . There has been concern for choice between large and small size of enterprising for investment strategy by the government. Results of data analysis suggest that though in the seventies, proportion of both sizes was near to each other, divergence grew in course of time to such an extent that now only thirty percent of manufacturing is from small sized manufacturing. Though share of large scale manufacturing has grown from 5.55% to GDP to 12.3% GDP, share of small manufacturing to GDP has remained at 5% in 2006-10 as was in the seventies. Growth remains steady in both sizes and contribution or large and small size to growth of manufacturing remains 70% and 30% respectively. Again, labour productivity, capital productivity and profitability are higher in small and medium enterprises. Thus both size categories deserve attention for accelerating manufacturing growth in the economy.
36
Small manufacturing units need special attention because of more flexibility and labour absorptive capacity. All the sizes should be taken care of simultaneously in giving incentive package considering their respective importance in different location and communities and sectors. Initiatives will be needed to strengthen small and medium scale enterprises as well as to identify large scale manufacturing industries that can compete in global market and compete imports in the domestic market as outlined by Perspective Plan.
iii. Strategy on Factor Intensity for Manufacturing Development
Another area of strategic option relates to factor intensity of production i.e. labour
intensiveness versus capital intensiveness of manufacturing . There is a need to work out
appropriate factor intensities and technology for each individual sector to strengthen its
competitiveness and to duly participate in the value chain of international production
networks. One of the specific strategies to be pursued as per Perspective Plan includes taking
initiative to further strengthen existing labour intensive manufacturing subsectors by
promoting product diversification and stimulating an up market move in these traditional
sectors in view of emerging opportunities in the global market. The plan emphasized on
nurturing agro-processing and labour intensive industries. Though labour intensiveness as a
strategy need to be emphasized in Bangladesh because of abundance of cheap labour in the
economy, capital and skill intensiveness may be needed in any sector and be allowed to
pursue to cope with global demand for competitiveness. Appropriateness of factor intensity
depends thus upon the characteristics of individual sector and demand of the competitive
market. It is very difficult to deny that manufacturing sector in Bangladesh need to pursue
dynamic shift of path from lower technology to higher technology level in pursuance of
raising productivity and competitive edge of the sector and its enterprises. There should be an
appropriate mix of labour intensive and capital intensive technology to be pursued
simultaneously for dynamic development of manufacturing in consonance with quality
requirements of market demand.
iv. Price and Non-Price Competitiveness with gradual shift to the latter
While price competitiveness was the main focus of Bangladesh over the years, time has
come to emphasise non-price competitiveness along with price competitiveness to
consolidate the global market and to increase credibility of the country for supply. Thus
there is a need for parallel stress on price and non-price competitiveness with emphasis on
the laterxxiv.There should be parallel strategies of lowering price by lowering cost of
production through enhancement of productivity and quality, reduction of delivery time and
trade transaction cost and ensuring safety and health.

37
Despite the reductions and elimination of tariffs and quotas which are decisive in the trade liberalization process, the growth of exports to developed country markets and the associated developmental impact has been narrow and limitedxxv. The problem arises from two related weaknesses specific to Bangladesh, first is the lack of a competitive supply capability of industrial goods to be traded and the second is related to the serious technological and quality problems faced in having access to international markets. Products have to comply with a mix of technical standards and health, safety and environmental requirements set by importing countries.
Bangladesh as exporting country need to comply with the requirements of the technical barriers to trade (TBT) and sanitary and phyto-sanitary measures (SPS) agreements under WTO, and must have the ability both to produce according to the standards and technical regulations set by the client countries, and prove conformity. Standards and conformity procedures often effectively restrict market entry, even in the absence of tariffs and quota restrictions. The country therefore need to ensure that potential exporters have the necessary supply capacity in place, and that they are provided with critical support services in the area of standards, metrology, testing certification and conformity assessment to meet the export criteria. Thus, there is a need for two broad categories of interventions: capacity building in the area of standards, metrology, testing and accreditation to overcome TBT/SPS constraints, and enhancing the competitiveness of the enterprises through quality and productivity improvements, and supporting the development of mechanisms to assist the enterprises in accessing global subcontracting and supply chains and networks in appropriate product categories. The Plan has emphasized on ensuring environmentally sound industrialization in compliant with health and safety norms as provided by WTO rules.
v. Shift from Low Wage to Productivity Enhancement There is a crucial need of shift from low wage strategy to productivity enhancement and higher value additive strategy for long term approach in increasing global competitiveness of manufacturing and for industrial development of Bangladesh. vi. Shift from low technology to higher technology level and thrust on R&D efforts
There is a need to be shift from low technology and low value added product to higher
technology and higher value added product; technology for industrial development need to
be core component of strategy of industrial development. Strategies for sub-sectoral
development are yet to be streamlined and to be linked with technology upgradation, human
resource development and market - at home and abroad, and there is a crying need for
greater investment on Research and Development to use opportunities of globalization. The
Plan talked of taking measures to meet growing demand for skilled managers and technology
and technical workers, a deep and broad pool of venture capital to support firms with
innovative technologies, providing support to private sector industries in searching,
acquisition and adaptation of best practice technologies in foreign countries, a comprehensive
approach to the development of small, medium, micro, cottage and IT industries with wide
ranging fiscal incentives ,preferential access to finance and favourable trade policy, fostering
exports as dominant steak and giving special emphasis to import substitution.
38
vii. Trajectory of diversification of industrial Structure by Products and Locations
Trajectory of diversification of industrial structure for long term growth to achieve the
visionary goal of perspective plan and Industrial Policy 2010 need to be translated into
detailed action plan and realized with proactive government support and intervention. There
should be parallel encouragement of diversification among existing product categories and
exploring and developing new products and markets with emphasis on aggressive marketing
and branding. Product development and diversification initiatives should be continuous ones
with appropriate policies, institutional arrangement and development of skilled manpower.
There may be product concentration but with technological sophistication .
There should be parallel encouragement of economic zoning and geographical diversification
through proper consultation with stakeholders. Policy support is needed to set up industries
outside traditional centres and for geographical diversification to reduce regional disparity
which may need support for deeper infrastructural development. The Plan emphasized on
Special Economic zones and Industrial Parks for both export oriented and domestic market
oriented industries following cluster principle of collection, continuation of fiscal and non-
fiscal incentives for EPZs to attract domestic and foreign investment. viii. Adequate address to Global Trade Regimes and Opportunities . There are enough global opportunities for using labour surplus of the country to increase its competitiveness in the global m Global trade regimes need to be adequately addressed to use opportunities of global environment arket, and further efforts are needed to find out areas where Bangladesh has relative competitive advantage and can make massive efforts for the successful entry into the global market. The Plan has emphasized on trade policy reforms to reduce the bias against exports by lowering trade protection arising from quantitative restrictions, tariff rates and supplementary duties and streamlining legal and regulatory framework and simplification of procedures and laws. ix. Address to Sick units and Privatised units There should be more proactive measures to deal with the problems of privatized units and sick units which require to be addressed case by case to salvage huge productive resources through proactive government intervention. xi. Facilitating and Supplementary role of government and Public-Private Partnership One of the strategies over the years was to encourage private sector investment for the development of manufacturing. But undermining the role of government may prove to be dangerous and may lead to failure of manufacturing sub-sectors because of lack of adequate support services for the development of the sector. The Plan has emphasized on facilitating role of government in making enabling environment for increased private investment in areas of dynamic comparative advantage, Government investment to complement private investment or in the areas of security or social objective meeting and for creating alternative employment, giving priority to infrastructural facilities like electricity, gas, port facilities ,transport and communication .Stronger positive Government action is felt necessary for

39
facilitating private investment and streamlining public private partnership. There should be clear cut modus operandi for strengthening private-public partnership in the development of manufacturing in the country. Perspective Plan outlined that rationalisation and restructuring of SOEs will be continued so that strategically placed SOEs can run profitably on a commercial basis, and others are handed over to the private sector. xii. Thrust Sectors Number of thrust sectors need to be smaller and more focused to be picked up among the prospective ones. There is a need for putting in place policy support and promotional initiatives to realize emerging opportunities in new sectors identified as thrust and potential sectors. xiii. Integrated Manufacturing and Trade in Tasks There should be parallel encouragement of integrated manufacturing within domestic economy and trade in Tasks in the global production and trading networks. We can go for integrated manufacturing through vertical integration within the country and we may also go parallel for trade in tasks with multinationals as per our competitive advantage depending upon country’s background experiences in the individual sectors.
xiv. FDI related Strategy
FDI need to be encouraged to have access to technology, global capital and frontier know
how and to have access to global market opportunities.
xv. Increased Work Shift
Incentive Policy arrangements are needed to increase the work regime to around three shift
to utilize the surplus labour force and productive capacity more effectively and to increase
profitability of the manufacturing enterprises with given investment level. xvi. Industrial Finance
There is a need for revisiting long term industrial finance through DFIs or commercial banks
and deepening the capital market for raising equity for industrial development. The Plan
emphasized on intensification of on-going campaign of streamlining and strengthening
capital market, reorganising and strengthening existing regime of industrial finance, The SFYP document has talked about so many strategies, it is difficult to rank them in order
of importance or sequence of application. Nothing was clear cut about the mutual
exclusiveness of opposing strategies. The plan appreciably elaborated and detailed out
general strategies of manufacturing development though not in any definite frame for
coherent policy formulation. It is appreciable that the plan document has stressed on
restructuring of two most important industries-cotton textiles and jute industries. The SFYP
like the previous plans is emphatic on facilitating role of government in making enabling
environment for increased private investment in areas of dynamic comparative advantage.
40
8.2. Review of Sector Specific Strategies for manufacturing development under the SFYP Great efforts have been made in the Sixth Five Year Plan to detail out sector specific strategies which need to be examined for streamlining strategic thinking on the development of these sectors. The Plan outlined strategies for RMG, textiles, jute industry, footwear, pharmaceuticals, shipbuilding, agro‐processing, steel and engineering products. Individual sectors have specificities to be reckoned with in addressing the generic problems of technology, quality, infrastructure, power, finance, marketing, testing facilities, environment, entrepreneurship and skill development. Outlining specific sectoral strategies, in Plan document has been a good attempt to give insights on the sectoral strategic needs. However, it is felt that deeper analysis of the problems (from both demand and supply sides) with rigorous research studies and deeper consultation with the stakeholders may be necessary for formulating well thought specific strategies of individual sectors. Role of government in providing facilities for R&D, training, technological upgradation, standardization and testing of the products, strengthening accreditation and product certification system of BSTI in line with international standards and international marketing is yet to be adequately detailed out. Specific subsectoral strategies mentioned in the Plan document in many cases appear to lack wide coverage of the problems faced by the sector, and more thorough analysis is required for formulating strategies for strengthening competitiveness and diversification of different product categories. Specific strategies need to be formulated considering different sizes, types of product lines, geographical locations of the subsectors and considering both supply and demand side problems. 8.4. Key areas of Desirable Intervention
Key areas of desirable interventions relate to i. Access to reliable power and energy supply ii. Raising technology level and Productivity and Product Development through
increased Investment and efforts in Research and Development. iii. Assistance in aggressive marketing in the global arena iv. Improved Infrastructural facilities and Appropriate Institutional Development v. Cluster development and economic zoning and at the same time initiatives for
geographical diversification of manufacturing vi. Appropriate package of Fiscal incentives and monetary incentives for
manufacturing sector development viii. Skill Development training facilities ix. Healthy Labour Management Relations x. Trade Facilitation Measures and reduction of trade transaction costs xi. Diversification of industrial structure for domestic and for export markets
xii. Exploring Market potentials in different countries and Export restructuring in a globalised economy for strategic use of cross national production networks xiii. Economic Cooperation with regional powers and multinationals for domestic manufacturing capacity building xiv. Trade related diagnostic study and formulation of Policy matrix and its effective execution for manufacturing development at subsectoral level.
XI. Conclusion

41
Manufacturing sector has a critical role in the economic transformation of Bangladesh, for making break-through into backwardness of the economy by enhancing economy wide productivity and diversifying the economic activities and increasing scale economies. Achieving the macroeconomic performance target of 8% growth target by 2015 and 10% growth by 2021 for achievement of Vision 2021 requires enhancement of contribution of manufacturing to GDP to 30% over the next decade. In course of strategic structural transformation in the economy, agriculture’s share is projected to decline from 22% in 2009 to 16% at the end of Sixth Five Year Plan and 15% by the end of Seventh five year Plan and share of manufacturing will grow from 18.5% in 2010 to 22% in 2015 and 30% in 2021. Past experiences of Bangladesh indicate that while share of agriculture is on sharp decline from 44% in 1972-80, to 20% in 2006-10, share of manufacturing has increased from 10% in 70s only to 17% 2006-10. Thus five year plan target of manufacturing share of 21% is challenging though not unachievable if power and other infrastructure obstacles are removed and political stability is ensured. Sixth Five year plan has recognized importance of manufacturing as a vehicle for enhancement of productivity and employment expansion and projected that the manufacturing sector will outface both the agricultural and service sectors and follow a smooth upward trajectory. In order to achieve the planned target, the manufacturing sector needs to be set to perform consistently and follow an upward trend from annual growth of 6.5% in FY 2010 to 11.5% in FY 2015 with average annual growth of 10% during the plan period. Calculation shows that elasticity of manufacturing to GDP growth is around 0.78 which means that 10% manufacturing growth is a must for achieving economic growth of 7.5% p.a. during the plan period. Sixth Five Year Plan has targeted alleviating poverty to 26 per cent from the present 31.5 per cent, and upgrading the manufacturing employment to 25 per cent of the population from the current 17 per cent by June 2015, which is not backed by past records and challenging though not unachievable. Export elasticity of manufacturing is around 0.55 implying that for achieving targeted average manufacturing growth of 10.0 % export must grow by 18.0% p.a. on average during 2011-15, which is achievable though challenging. Size wise share of large scale manufacturing is 12.3% and while share of small ones is only 5% of GDP. Manufacturing growth has been 7.8% p.a. during 2001-2010. Growth remains steady at nearly 8% in both the sizes. However, contribution of large size is around 70% and small ones is 30%.It is notable that 93.3% manufacturing enterprises belong to micro and small enterprises providing 47% manufacturing employment while 6.7% manufacturing establishments belong to medium and large size enterprises providing 47% manufacturing employment. Thus size wise, Bangladesh manufacturing is characterized by dualistic pattern. However, concentration of fixed assets remains in the large size enterprises. From the point of view of market orientation, main contributory factors are export expansion and domestic demand expansion with increasing contribution of the former with increased trade liberalization. Import substitution has remained negative in all the economic phases. Import substitution need to be addressed adequately for preparations for effective global integration and in the situation of uncertainty and instability of global market and increased size of domestic market. As subsectoral sources, garments, pharmaceuticals, textiles, cement, food products, leather footwear, wooden furniture, re-rolling steel, wooden furniture and ceramics have high growth potentials contributing significantly to manufacturing growth. Double digit growth in manufacturing is a long cherished goal for the country though it did not yet reach the goal and dynamic role of manufacturing is yet to be seen in the growth process. The share of manufacturing in the growth process has increased from 15% in the early eighties to 22.5% in 2006-10.The manufacturing sector is, narrow based; only five
42
industries, namely garments and textiles, fish and sea food, leather, cement and pharmaceuticals account for over 80% growth achieved in the manufacturing sector. Two broad sectors-food processing and textiles have dominated the overall manufacturing sector for a long time. It is important to note that four important sectors of the economy jute textiles, fertilizer, paper and sugar having weight of 31% contributed negatively during the 1988-2010 affecting the manufacturing growth constituting 85% of negative growth contribution of all subsectors. The basic challenge of manufacturing development is related to narrow manufacturing base with product and locational concentration, low level of technology and low share of manufacturing in the economy. Accelerated growth of manufacturing will be necessary in the coming years to absorb the incremental labour force, strengthen backward and forward linkages with agriculture and services sectors, cater to the growing domestic demand for industrial goods, and take advantage of emerging opportunities in the global market. Initiatives will be needed to strengthen small and medium scale enterprises as well as to identify large scale manufacturing industries that can compete in global market and compete imports in the domestic market. Rationalisation and restructuring of SOEs may need to be continued and privatized units require to be monitored prudently and necessary support be given to the privatized units for effective use of their resources.
Desirable strategies for industrial development to our mind should be parallel strategies of i. Export orientation and Import Substitution, ii. Integrated manufacturing and trade in tasks and horizontal manufacturing in consonance with competitive advantage, iii. Small scale manufacturing and large and medium scale manufacturing for generation of income and employment, and reduction of poverty, iv. Capital intensive mfg and labour and skill intensive manufacturing in view of competitiveness, v. Price and non-price competitiveness strengthening in all products whether for export or to substitute imports v. Economic zoning and Geographical diversification, vi. Diversification among existing Product Categories and Exploring and Developing New Products and Markets with emphasis on Aggressive Marketing and Branding. Emphasis need to be on technological sophistication and quality improvement across the subsectors of manufacturing. The Government must create enabling environment and facilitate private investment. There is a need for investment on research to explore and use opportunities of globalisation. It is felt that further work is needed to make definite strategic options considering domestic and global situation, the specificity of the sectors and future needs of the country. Import substitution and domestic market orientation need to be more seriously addressed and the export orientation strategy as a prime mover of industrial development need to be cautiously reformulated. Technology capacity building and trajectory of diversification of industrial structure need to be prudently planned. Subsectoral strategies need to be clearer cut in consonance with the problems they face and the potentials they possess, and with care to more potential subsectors. There should be massive drive for solving the power problem for encouraging investment in the manufacturing sector. Clear cut modus operandi is yet to be developed for private-public partnership in manufacturing. There is a felt need for more investment in research and development, infrastructure, technological capacity building, trade related diagnostic study, detailed policy matrix for industrial development and appropriate institutional development for implementing policies and strategies.

43
REFERENCES i GOB, Plan Documents of First Five Year Plan 1973‐78, Two Year Plan 1978‐80, Second Five Year Plan 1980‐85, Third Five Year Plan 1985‐1990,Fourth Five Year Plan 1990‐1995, Fifth Five Year Plan 1997‐2002.Bangladesh Planning Commission. ii Weiss,J.(1988),Industry in developing countries, Theory, Policy and Evidence, London: CroomHelm. iii GOB (1973),First Five Year Plan Fy1973‐F1978, , General Economics Division. Planning Commission. iv Prebisch, R.(1950).The Economic Problem of Latin America and its Principal Problems, UN Economic Commission for Latin America, New York. ‐‐‐‐‐‐‐‐‐‐‐‐(1984), “Five Stages in My Thinking in Development”, in G.M.Meir and D.Seers (eds), Pioneers in Development, Oxford University Press, New York. v Singer, H.(1950), “The Distribution of Gains between Investing and Developing Countries”, American Economic Review, Vol.40, May,pp.473‐85. vi GOB (2009),” Perspective Plan of Bangladesh 2010‐21”, Bangladesh Planning Commission. vii GOB (2010), “Industrial Policy of Bangladesh 2010”, Ministry of Industries. viiiGOB (2009),” Perspective Plan of Bangladesh 2010‐21”, Bangladesh Planning Commission. ix World Bank (2011),World Development Indicators. x Economic Census , 2002, BBS,2007. xi CMI,2001‐02,2005‐06, BBS xii Chenery, H.B., Patterns of Industrial Growth, The American Economic Review, Vol 50, No.4, Sept 1960, PP.624‐654. xiii GOB,EPB, Ministry of Commerce. xiv Ibid. xv SME Foundation (2008), SMEF Survey of Six Sectors, Dhaka. xvi UNIDO (2009) xvii UNIDO (2009), Data Base of Individual Countries. xviii Mashiur Rahman and Zaid Bakht (1997) “,Constraints to Industrial Development, Recent Reforms and Future Directions”,in the book,M.G.Quibria edited The Bangladesh in Transition, UPL xix. Narayan C. Nath (2010), Industrial Policy‐Issue of Privatisation in Bangladesh: Analysis on the basis of Micro Survey on Privatised Units” Paper presented at BEA Biennial Conference, 8‐10 April, 2010, Dhaka xx Narayan C. Nath (2010) ,”Status and Determinants of Investment of Bangladesh Economy and Options for Development”, Presented at BEA Biennial Conference, 8-10 April, 2010, Dhaka. xxi Muzammel Huq(1996), “Export Competitiveness of Bangladesh Leather Manufacturing: Reflections on emerging dynamics”, paper presented at the National Seminar on “Export Competitiveness of Bangladesh Industries: Achievements and Policy Agenda”, organized by BIDS, Dhaka. xxii Bhattacharya,D.(1996),”Climbing Up the Value Chain in the RMG sector in Bangladesh”, paper presented at the National Seminar on “Export Competitiveness of Bangladesh Industries: Achievements and Policy Agenda”, organized by BIDS,Dhaka. xxiii GOB (2011), Sixth Five Year Plan FY2011‐FY2015,Part‐2,Sectoral Strategies, Programmes and Policies. xxv UNIDO,2011. Appendix Table-1 Comparison of Bangladesh with countries in Asia during 1980-2010 in respect of % Manufacturing to GDP Countries 1980 1990 2000 2008 Malayasia 21.5 24.2 30.9 28.0 Thailand 21 27 34 35.0 Vietnam 10.5 12.3 18.6 21.1 S. Korea 25 27 28 28.0 China 30.2 32.7 32.1 32.9 Bangladesh 10.8 12.7 14.7 17.2 Source: World Development Indicators, World Bank