Embed Size (px)
Citation preview
General rights Copyright and moral rights for the publications made accessible in the public portal are retained by the authors and/or other copyright owners and it is a condition of accessing publications that users recognise and abide by the legal requirements associated with these rights.
Users may download and print one copy of any publication from the public portal for the purpose of private study or research.
You may not further distribute the material or use it for any profit-making activity or commercial gain
You may freely distribute the URL identifying the publication in the public portal If you believe that this document breaches copyright please contact us providing details, and we will remove access to the work immediately and investigate your claim.
Downloaded from orbit.dtu.dk on: Dec 11, 2021
Comprehensive characterization and material modeling for ceramic injection moldingsimulation performance validations
Tosello, Guido; Marhöfer, David Maximilian; Islam, Aminul; Müller, Tobias; Plewa, Klaus; Piotter, Volker
Published in:International Journal of Advanced Manufacturing Technology
Link to article, DOI:10.1007/s00170-018-03251-3
Publication date:2019
Document VersionPeer reviewed version
Link back to DTU Orbit
Citation (APA):Tosello, G., Marhöfer, D. M., Islam, A., Müller, T., Plewa, K., & Piotter, V. (2019). Comprehensivecharacterization and material modeling for ceramic injection molding simulation performance validations.International Journal of Advanced Manufacturing Technology, 102, 225-240. https://doi.org/10.1007/s00170-018-03251-3
1
Comprehensive characterization and material modelling for ceramic injection molding simulation performance validations Guido Tosello1 (*) [email protected] David Maximilian Marhöfer2 [email protected] Aminul Islam1 [email protected] Tobias Müller3 [email protected] Klaus Plewa4 [email protected] Volker Piotter4 [email protected] (*) Corresponding Author 1 Technical University of Denmark, Department for Mechanical Engineering Produktionstorvet, Building 427A, 2800 Kongens Lyngby, Denmark 2 University of Applied Sciences Northwestern Switzerland FHNW School of Engineering, Institute of Polymer Nanotechnology Klosterzelgstrasse 2, 5210 Windisch, Switzerland 3 Karlsruhe Institute of Technology, Institute for Automation and Applied Informatics (IAI) Hermann‐von‐Helmholtz‐Platz 1, 76344 Eggenstein‐Leopoldshafen, Germany 4 Karlsruhe Institute of Technology, Institute for Applied Materials ‐ Materials Process Technology (IAM‐WK) Hermann‐von‐Helmholtz‐Platz 1, 76344 Eggenstein‐Leopoldshafen, Germany
2
ABSTRACT
Powder injection molding is like the process of plastics injection molding capable of the mass production of
highly functional complex 3D parts, just in ceramics and metals. The market for products made by powder
injection molding is constantly growing. With this growth, the need for reliable process simulations arises.
Simulation tools are widely used in the development of new products and are applied in powder and
polymer injection molding to support the product design, shorten the development time, avoid errors, and
help to optimize the mold and process design. However, material data for feedstocks and thus simulations
of the powder injection molding process are hardly available yet. The present work introduces the
necessary material data for establishing a material model for simulations. An extensive material
characterization of ceramic feedstocks was conducted. The material investigations comprised the
determination of basic, thermal, and rheological material properties to collect a comprehensive data set.
The necessary measurements and tools are outlined and their results are discussed in detail with regards
to powder content and in comparison to pure plastics. The gained data enabled to successfully create a
material model for mold filling simulations. Powder injection molding experiments were carried out with a
spiral test geometry. The mold was equipped with a sensor array for the process monitoring during
injection. Furthermore, a simulation model of the test geometry was established. Finally, the results of the
experiments and simulations are discussed and are compared to validate the performance of the
simulations. The results showed the potential and limitations of process simulations and standard
software applied in conventional and micro powder injection molding.
Keywords: powder injection molding, simulations, feedstocks, material characterization, rheology.
3
1. INTRODUCTIONThe process of ceramic injection molding emerged almost simultaneously with the well‐
known process of plastic injection molding in the 1930s, the metal variant later in the
1970s [1]. Powder molding combines the superior properties of ceramics and metals
compared to plastics like material strength, maximum service temperature with the
advantages of injection molding such as medium to large‐scale production, automation,
and low costs. The process enables the fabrication of geometrically complex, three‐
dimensional, and highly functional parts in ceramics and metals. Typical application
fields of products made by powder injection molding are the automotive and aerospace
industry, mechanical parts, the medical industry and health care, or consumer and
industrial electronics. [1–4]
The used raw material, the so‐called feedstock, is a mixture of an organic binder and the
fine metal or ceramic powder. The binder provides the viscous properties and enables
the feedstock to be used in injection molding. In addition, it is designed to maintain
structural integrity of the solid part after the molding. The powder is made of the
material from which the final product should actually be produced. [1,5,6]
The powder molding process is very similar to plastics injection molding, but the post‐
processing steps of debinding and sintering are necessary to yield the final product. The
process chain from raw material to final product can be described by the following
phases [1,2,7]:

4
compounding of the feedstock
powder injection molding
thermal, catalytic, or solvent‐based debinding,
sintering,
possibly further post‐processing for finishing or densification, e.g. polishing, hot
isostatic pressing, annealing, or hardening.
Simulation tools are widely used in the development process of new products in the
industry. Process simulations are an effective and important tool in order to assist and
optimize the design of the new product or the actual manufacturing process. Also in the
area of injection molding, simulations are proven to be precious tools. Hence, they are
widely applied to accompany the product development from the first design of the
plastic part to the finally fabricated mold [1,8,9]. In detail, the simulations are carried out
for the same reasons as in other areas of engineering like [10–16]:
to assist the product design at an early stage when molds are not available yet,
to avoid costly design errors and necessary re‐engineering,
to shorten the development time and the time‐to‐market for a new product,
to eliminate the need or reduce the amount of physical prototyping and experiments,
to optimize the part and mold design as well as the parameter settings of the
manufacturing process,
to assist the material selection,
to predict and improve the part quality (e.g. morphology and properties),
5
to gain a better understanding of the process characteristics especially the occurring
shear rates which are the main reason for powder‐binder‐segregation which again
cause dimensional inaccuracies and deformations.
Similar to many other engineering disciplines, process simulations of plastic and powder
injection molding are based on the method of finite element analysis (FEA). Different
software packages such as Autodesk Moldflow®, Moldex3D®, or Sigmasoft® are
commercially available on the market. Due to the complexity of the injection molding
cycle and equipment, the increasing requirements on the part quality, and the quickly
and steadily growing market for powder injection molding products, process simulations
gain increasing importance.
However, there are two major problems with the simulation of powder injection
molding. Firstly, the commercially available simulation software originates from the area
of plastic injection molding. Yet, the feedstocks show significantly different properties
than pure or even filled plastics [3,17,18]. The extensive powder content and the heavy
powder weight compared to the lightweight polymer binder leads to a serious increase
in inertia of the material flow. As a result, the powder feedstocks tend to jetting and
wall slip. Moreover, powder‐binder separation due to high shear rates can be
sometimes observed leading to local differences in viscosity, powder content and hence
shrinkage behavior while sintering. In addition, feedstocks exhibit significantly increased
heat conductivity due to the metal and ceramic filler, but at the same time generally
6
lower heat capacity than plastics. The different thermal properties lead to an increase of
the heat loss, faster solidification of the melt which negatively influences filling and
replication performance. Besides, the feedstocks have lower compressibility and lower
temperature‐dependent change in density. All the aforementioned effects are still
subject to research and are usually not or insufficiently accounted for by commercial
simulation tools. Continuous development and validation of the software is therefore
crucial. [3,5,18,19]
Secondly, there is almost no material data and no material models of feedstocks
available up till now. Additionally, guidelines or standards for the acquisition of such
material data or for the application of simulations do not exist yet. Some material
studies on feedstocks were reported within the last couple of years. Still, the
investigations focus almost exclusively only on parts of all relevant material properties—
mostly either on the rheological or thermal aspects. [8,18]
This work is motivated by these problems. First, the lack of material data is tackled by
running an extensive material characterization of two ceramic feedstocks. Basic
properties like the density and powder content of the feedstocks and thermal
properties such as the specific heat capacity and thermal conductivity were
investigated. The rheological evaluation included the determination of the viscosity and
pvT data. The aim was to outline all the necessary data. The collected material data was
employed in creating a new material model. Moreover, this material model could be
7
applied in the simulation of the powder injection molding process in order to conduct an
assessment of the performance of state‐of‐the‐art simulation software.
2. THEORETICALBACKGROUND
2.1 Necessary material data for simulations
For the proper simulation of the injection molding process, a comprehensive set of
material properties must be known. However, the required material properties depend
on the type of simulation that is applied. The filling, packing, and cooling phase are
governed by the flow of the plastic or feedstock. Therefore, the following properties are
required [20]:
viscosity,
specific heat capacity,
thermal conductivity,
no‐flow temperature, glass transition, or melt temperature,
pvT data.
Simulations of the shrinkage and warpage of the molded part are governed by the
mechanics of the material. Hence, the following properties are additionally required [20]
elastic modulus,
shear modulus,
Poisson's ration,
coefficient of thermal expansion.
8
2.2 Viscosity measurements
Viscosity models
The advanced Cross model, default in many simulation software packages, is often used
for mathematically describing the viscosity and the shear thinning effect of polymers.
This model describes the shear rate dependency of the viscosity over a wide range of
shear rates very well, because it combines a Newtonian region at low shear rates with a
power law shear thinning region at higher shear rates [20]. The viscosity is
mathematically given by the Cross model as a function of the shear rate as
1 (1)
where is the zero shear rate viscosity, is the shear stress, and the power‐law
index of the polymer. The term 1 describes the slope of the viscosity curve in the
power law region, when logarithmically plotted versus the shear rate.
In order to understand and simulate the flow of the polymer during the filling phase, the
applied viscosity model must also account for the temperature changes happening
during injection molding. The concept of time‐temperature superposition can be applied
to the viscosity. The core of the concept is to shift the known viscosity curve at a
reference temperature along the time axis in order to gain the viscosity curve at any
temperature different from the reference temperature. The shift factor is given by the
Williams‐Landel‐Ferry (WLF) equation which can be also applied to the zero shear rate
9
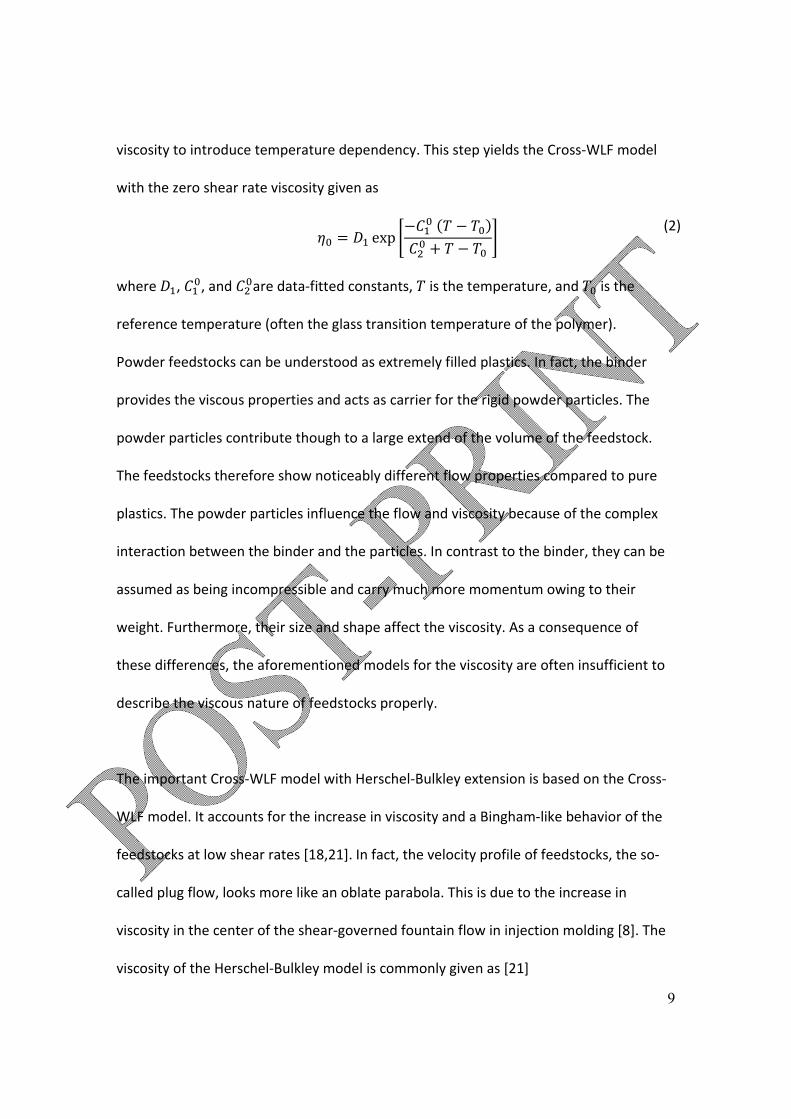
viscosity to introduce temperature dependency. This step yields the Cross‐WLF model
with the zero shear rate viscosity given as
exp
(2)
where , , and are data‐fitted constants, is the temperature, and is the
reference temperature (often the glass transition temperature of the polymer).
Powder feedstocks can be understood as extremely filled plastics. In fact, the binder
provides the viscous properties and acts as carrier for the rigid powder particles. The
powder particles contribute though to a large extend of the volume of the feedstock.
The feedstocks therefore show noticeably different flow properties compared to pure
plastics. The powder particles influence the flow and viscosity because of the complex
interaction between the binder and the particles. In contrast to the binder, they can be
assumed as being incompressible and carry much more momentum owing to their
weight. Furthermore, their size and shape affect the viscosity. As a consequence of
these differences, the aforementioned models for the viscosity are often insufficient to
describe the viscous nature of feedstocks properly.
The important Cross‐WLF model with Herschel‐Bulkley extension is based on the Cross‐
WLF model. It accounts for the increase in viscosity and a Bingham‐like behavior of the
feedstocks at low shear rates [18,21]. In fact, the velocity profile of feedstocks, the so‐
called plug flow, looks more like an oblate parabola. This is due to the increase in
viscosity in the center of the shear‐governed fountain flow in injection molding [8]. The
viscosity of the Herschel‐Bulkley model is commonly given as [21]
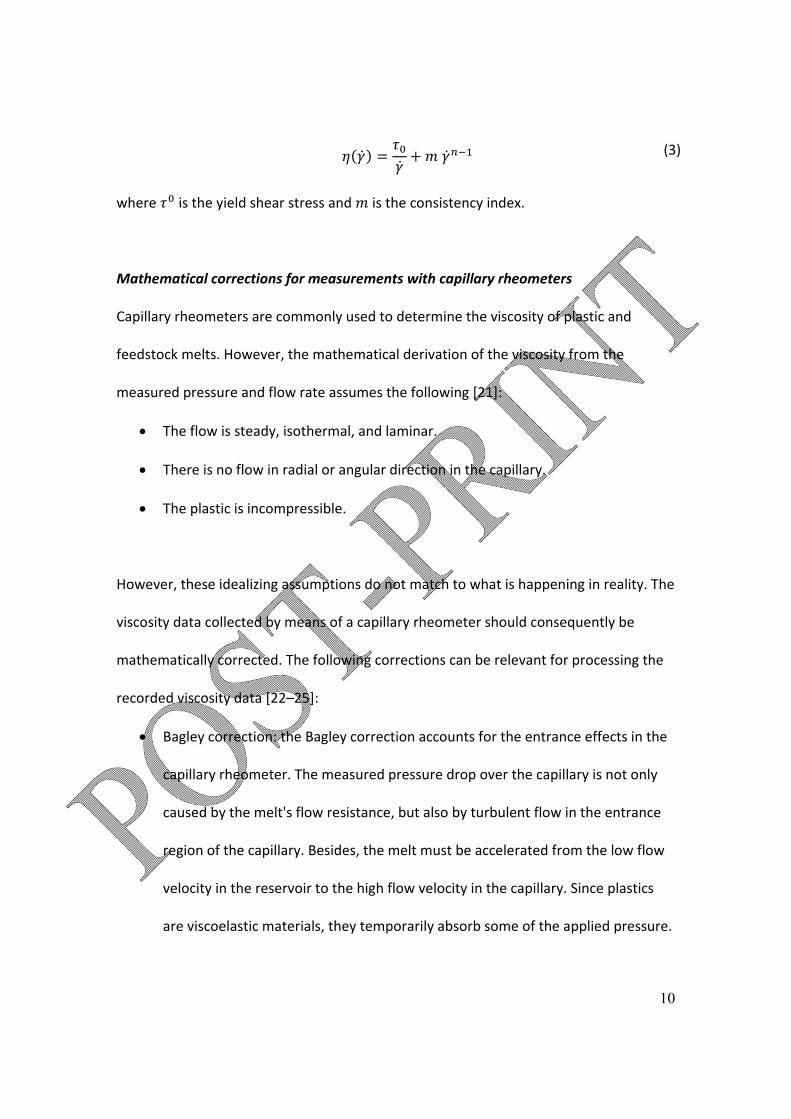
10
(3)
where is the yield shear stress and is the consistency index.
Mathematical corrections for measurements with capillary rheometers
Capillary rheometers are commonly used to determine the viscosity of plastic and
feedstock melts. However, the mathematical derivation of the viscosity from the
measured pressure and flow rate assumes the following [21]:
The flow is steady, isothermal, and laminar.
There is no flow in radial or angular direction in the capillary.
The plastic is incompressible.
However, these idealizing assumptions do not match to what is happening in reality. The
viscosity data collected by means of a capillary rheometer should consequently be
mathematically corrected. The following corrections can be relevant for processing the
recorded viscosity data [22–25]:
Bagley correction: the Bagley correction accounts for the entrance effects in the
capillary rheometer. The measured pressure drop over the capillary is not only
caused by the melt's flow resistance, but also by turbulent flow in the entrance
region of the capillary. Besides, the melt must be accelerated from the low flow
velocity in the reservoir to the high flow velocity in the capillary. Since plastics
are viscoelastic materials, they temporarily absorb some of the applied pressure.
11
This energy is again recovered after leaving the capillary and appears as an
expansion of the material, the so‐called die swell of the extrudate.
Weissenberg‐Rabinowitsch correction: the Weissenberg‐Rabinowitsch correction
compensates for the non‐Newtonian (shear thinning) behavior of the plastics
and computes the “real” shear stress at the wall of the capillary out of the
“apparent” shear stress.
Mooney correction: the Mooney correction is used to correct the velocity of the
melt. Plastic melts do not always fulfill the assumption of no wall slip inside the
capillary. In this case, the wall slip speed thus contributes apart from the melt
velocity to the total flow rate.
Dissipation correction: the dissipation correction is used, if the assumption of
isothermal flow inside the capillary is not true anymore. At high shear rates, the
melt might heat up due to internal friction and the resulting dissipative heating.
2.3 Thermodynamics
Besides the viscosity, information about the thermodynamic properties of the
feedstocks is necessary for computer simulations of the injection molding process.
These can be derived from the equation of state of the material which links the
pressure, the specific volume, and the temperature. It is therefore also called pvT
data [20]. This data is usually provided as pvT diagrams which show the specific volume
as a function of pressure and the absolute temperature . The commonly used
12
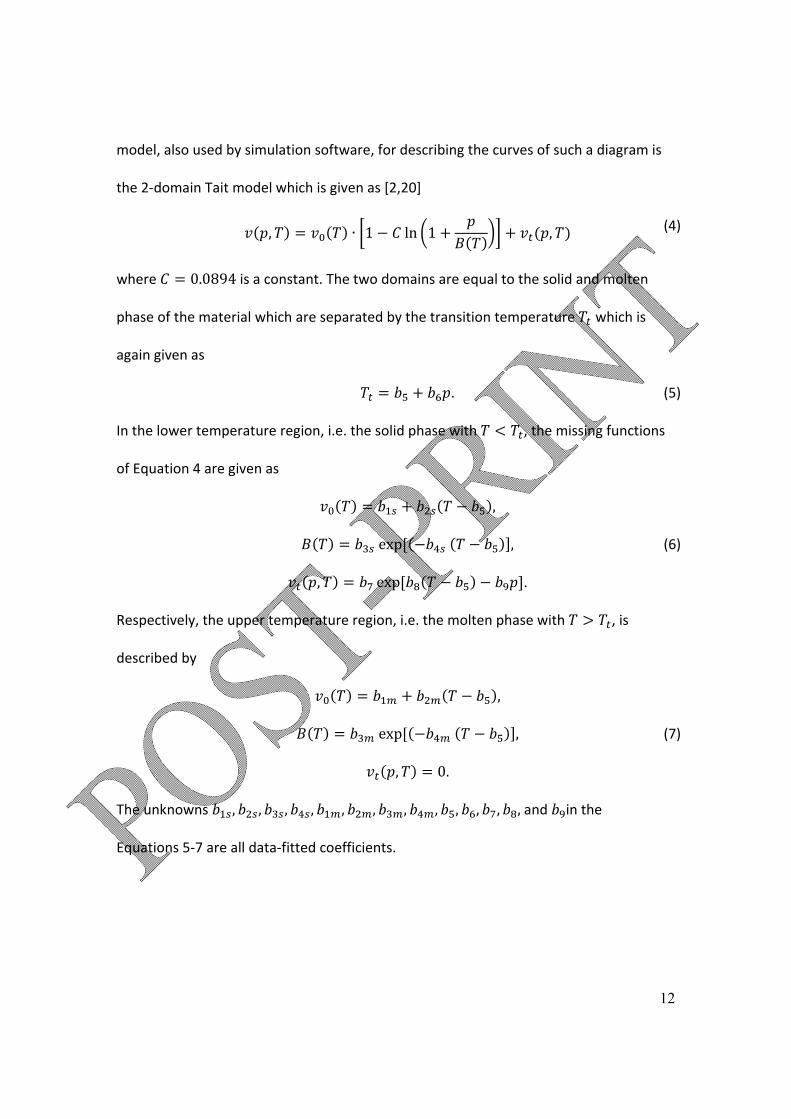
model, also used by simulation software, for describing the curves of such a diagram is
the 2‐domain Tait model which is given as [2,20]
, ∙ 1 ln 1 , (4)
where 0.0894 is a constant. The two domains are equal to the solid and molten
phase of the material which are separated by the transition temperature which is
again given as
. (5)
In the lower temperature region, i.e. the solid phase with , the missing functions
of Equation 4 are given as
,
exp , (6)
, exp .
Respectively, the upper temperature region, i.e. the molten phase with , is
described by
,
exp , (7)
, 0.
The unknowns , , , , , , , , , , , , and in the
Equations 5‐7 are all data‐fitted coefficients.
13
3. FEEDSTOCKCHARACTERIZATION
3.1 Feedstocks
Two ceramic powder feedstocks, one commercial and one custom‐made, were used and
characterized in this work. The key properties of the commercial Catamold® TZP‐A
supplied by BASF, Ludwigshafen, Germany are shown in Table 1. The feedstock is based
on a polyacetal binder, and the debinding happens catalytically by exposing it to a nitric
acid atmosphere. As a result, the binder is decomposed in its monomers below its actual
melt temperature. The efficient debinding and the good dimensional control are the
main advantages claimed by the supplier. The compounds was used, because zirconium
dioxide (ZrO2) is among the most widely ceramic powders [5].
The custom‐made feedstock “GoMikro ZrO2”, the research equivalent of the Catamold®
feedstock, was compounded on‐site at the Karlsruhe Institute of Technology (KIT),
Eggenstein‐Leopoldshafen, Germany. Its key properties are also shown in Table 1. The
feedstock is based on a mixture of polyethylene (PE) and wax as the binder system. The
debinding happens usually thermally or in a solvent. The major advantage is the easy
setup and low investment for debinding. The feedstocks from KIT are actually made for
micro powder injection molding and the GoMikro ZrO2 should therefore provide good
flow properties. The powder content was 50 vol% (87 wt%). The density and powder
content were therefore not measured as outlined for the commercial feedstock in the
following sections.
14
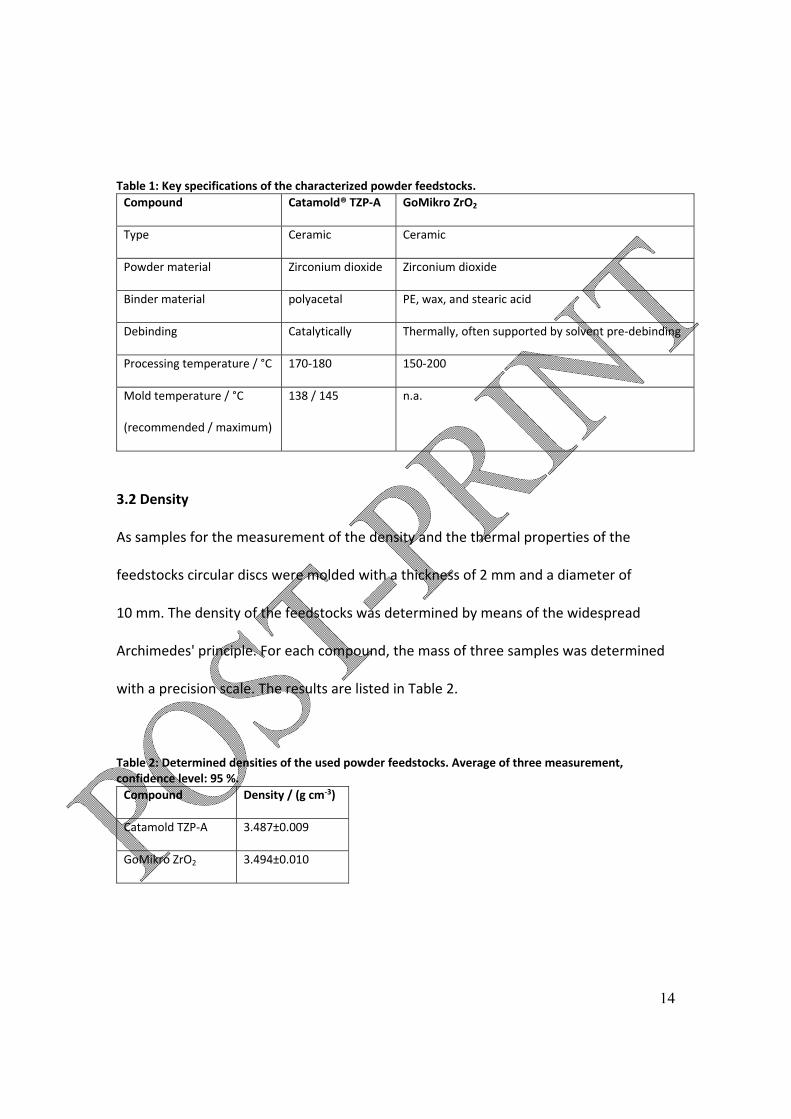
Table 1: Key specifications of the characterized powder feedstocks.
Compound Catamold® TZP‐A GoMikro ZrO2
Type Ceramic Ceramic
Powder material Zirconium dioxide Zirconium dioxide
Binder material polyacetal PE, wax, and stearic acid
Debinding Catalytically Thermally, often supported by solvent pre‐debinding
Processing temperature / °C 170‐180 150‐200
Mold temperature / °C
(recommended / maximum)
138 / 145 n.a.
3.2 Density
As samples for the measurement of the density and the thermal properties of the
feedstocks circular discs were molded with a thickness of 2 mm and a diameter of
10 mm. The density of the feedstocks was determined by means of the widespread
Archimedes' principle. For each compound, the mass of three samples was determined
with a precision scale. The results are listed in Table 2.
Table 2: Determined densities of the used powder feedstocks. Average of three measurement, confidence level: 95 %.
Compound Density / (g cm‐3)
Catamold TZP‐A 3.487±0.009
GoMikro ZrO2 3.494±0.010
15
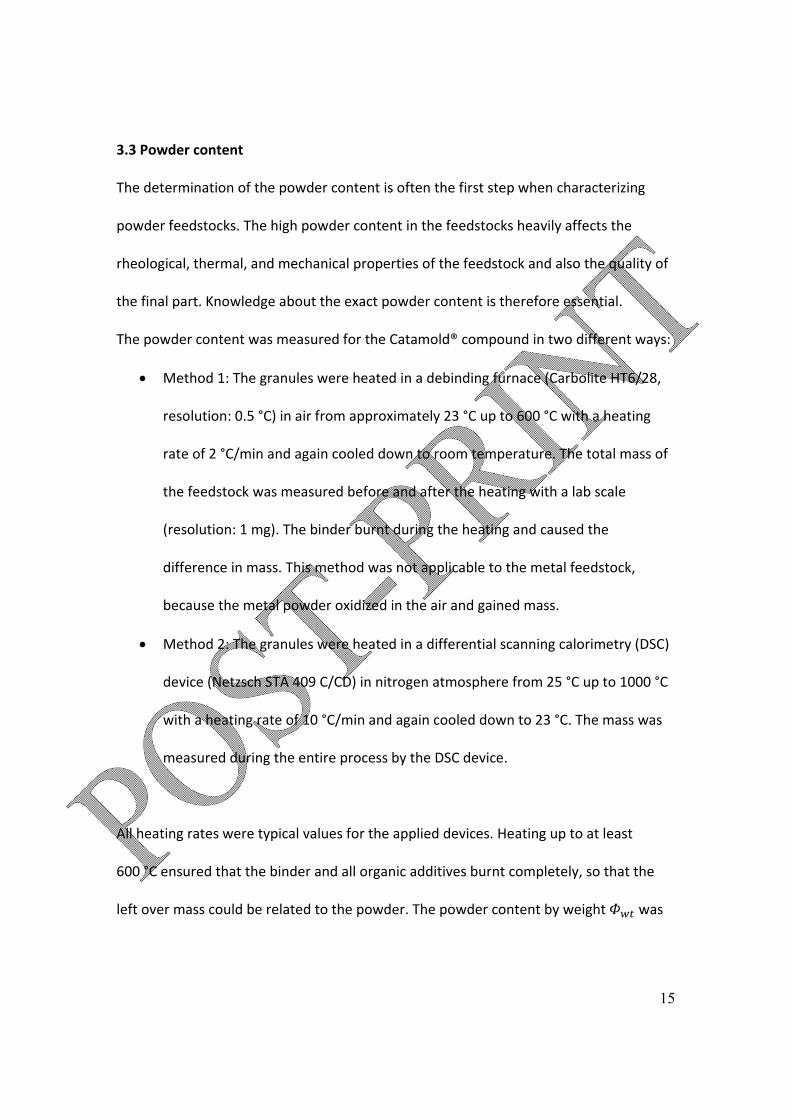
3.3 Powder content
The determination of the powder content is often the first step when characterizing
powder feedstocks. The high powder content in the feedstocks heavily affects the
rheological, thermal, and mechanical properties of the feedstock and also the quality of
the final part. Knowledge about the exact powder content is therefore essential.
The powder content was measured for the Catamold® compound in two different ways:
Method 1: The granules were heated in a debinding furnace (Carbolite HT6/28,
resolution: 0.5 °C) in air from approximately 23 °C up to 600 °C with a heating
rate of 2 °C/min and again cooled down to room temperature. The total mass of
the feedstock was measured before and after the heating with a lab scale
(resolution: 1 mg). The binder burnt during the heating and caused the
difference in mass. This method was not applicable to the metal feedstock,
because the metal powder oxidized in the air and gained mass.
Method 2: The granules were heated in a differential scanning calorimetry (DSC)
device (Netzsch STA 409 C/CD) in nitrogen atmosphere from 25 °C up to 1000 °C
with a heating rate of 10 °C/min and again cooled down to 23 °C. The mass was
measured during the entire process by the DSC device.
All heating rates were typical values for the applied devices. Heating up to at least
600 °C ensured that the binder and all organic additives burnt completely, so that the
left over mass could be related to the powder. The powder content by weight was
16
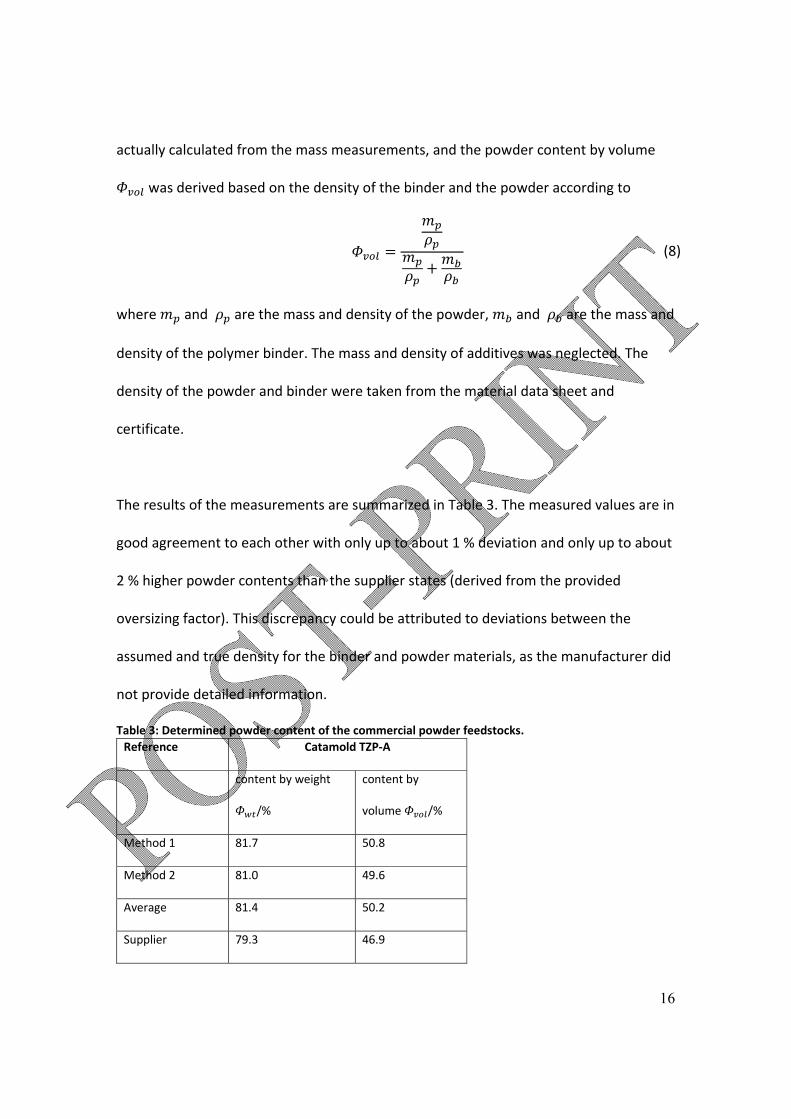
actually calculated from the mass measurements, and the powder content by volume
was derived based on the density of the binder and the powder according to
(8)
where and are the mass and density of the powder, and are the mass and
density of the polymer binder. The mass and density of additives was neglected. The
density of the powder and binder were taken from the material data sheet and
certificate.
The results of the measurements are summarized in Table 3. The measured values are in
good agreement to each other with only up to about 1 % deviation and only up to about
2 % higher powder contents than the supplier states (derived from the provided
oversizing factor). This discrepancy could be attributed to deviations between the
assumed and true density for the binder and powder materials, as the manufacturer did
not provide detailed information.
Table 3: Determined powder content of the commercial powder feedstocks.
Reference Catamold TZP‐A
content by weight
/%
content by
volume /%
Method 1 81.7 50.8
Method 2 81.0 49.6
Average 81.4 50.2
Supplier 79.3 46.9
17
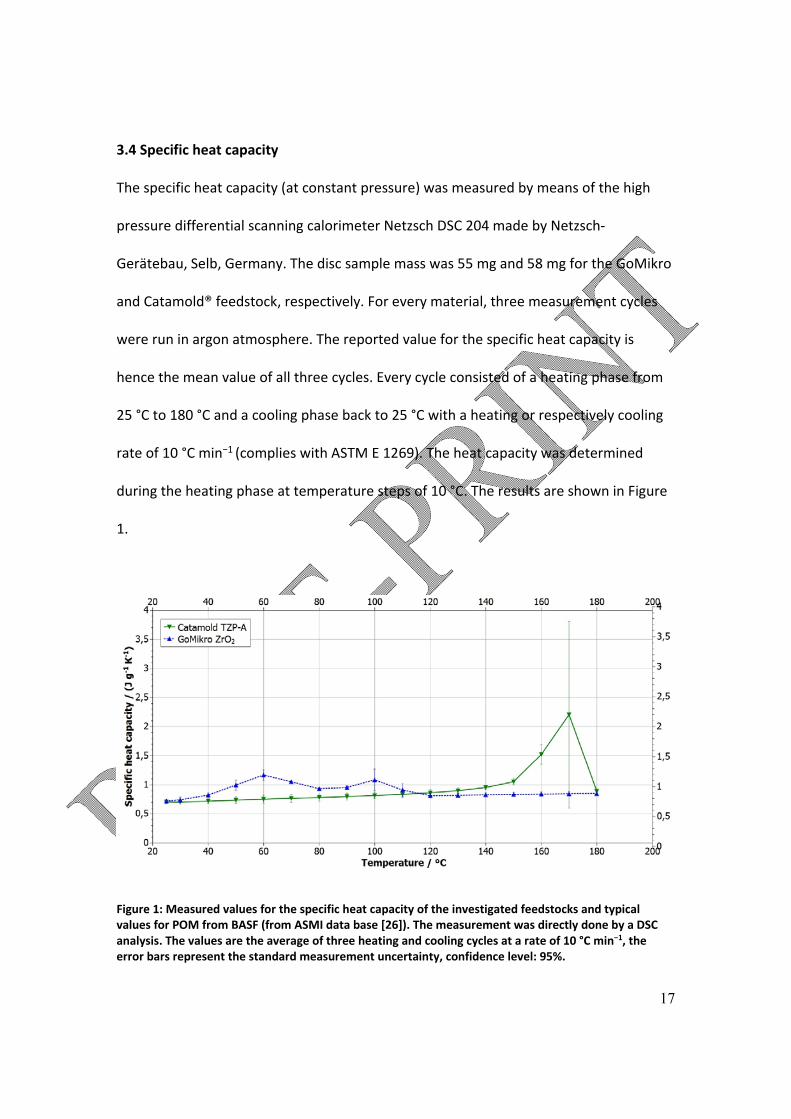
3.4 Specific heat capacity
The specific heat capacity (at constant pressure) was measured by means of the high
pressure differential scanning calorimeter Netzsch DSC 204 made by Netzsch‐
Gerätebau, Selb, Germany. The disc sample mass was 55 mg and 58 mg for the GoMikro
and Catamold® feedstock, respectively. For every material, three measurement cycles
were run in argon atmosphere. The reported value for the specific heat capacity is
hence the mean value of all three cycles. Every cycle consisted of a heating phase from
25 °C to 180 °C and a cooling phase back to 25 °C with a heating or respectively cooling
rate of 10 °C min−1 (complies with ASTM E 1269). The heat capacity was determined
during the heating phase at temperature steps of 10 °C. The results are shown in Figure
1.
Figure 1: Measured values for the specific heat capacity of the investigated feedstocks and typical values for POM from BASF (from ASMI data base [26]). The measurement was directly done by a DSC analysis. The values are the average of three heating and cooling cycles at a rate of 10 °C min−1, the error bars represent the standard measurement uncertainty, confidence level: 95%.
18
As expected, the heat capacity is a function of temperature. It must also be kept in mind
that the heating rate influences the results of heat capacity measurements [27]. The
specific heat capacity of the Catamold® compound varies from 0.7 J g−1 K−1 to
2.2 J g−1 K−1, i.e. by a factor three within the investigated temperature range. The heat
capacity and the measurement uncertainty show a significant increase in the
temperature range of 160 °C to 180 °C. This correlates to the melting of the crystalline
areas in the POM binder at its melting temperature of about 170 °C.
The specific heat capacities of the GoMikro feedstock vary in the range from
0.7 J g−1 K−1 to 1.2 J g−1 K−1, i.e. approximately by a factor two. The compound shows a
noticeable, but less pronounced increase in heat capacity and measurement
uncertainty, namely at about 60 °C and at about 100 °C. Likewise, these peaks correlate
to the melting temperatures of the wax and the PE in the binder system, respectively.
The difference between the commercial and non‐commercial compounds are caused by
the different binder systems with their varying specific heat capacity and the varying
powder load.
The dependency of the heat capacity on the temperature is much less pronounced for
the feedstocks compared to plastics. A reference curve for the specific heat capacity of
pure POM from BASF is included in Figure 1, where the heat capacity shows a much
more volatile behavior and varies from about 1.4 J g−1 K−1 to 10.1 J g−1 K−1, i.e. by a factor
of roughly seven. In general, the heat capacity of the feedstocks is much lower
compared to pure plastics.

19
The investigated compounds exhibit typical values and qualitatively similar variations
compared to other powder feedstocks. In literature, values of 0.7 J g−1 K−1 to 0.9 J g−1 K−1
for mullite‐zirconia, 0.8 J g−1 K−1 to 1.2 J g−1 K−1 for silicon nitride, 0.9 J g−1 K−1 to
1.5 J g−1 K−1 for aluminum nitride feedstocks are reported [27–31].
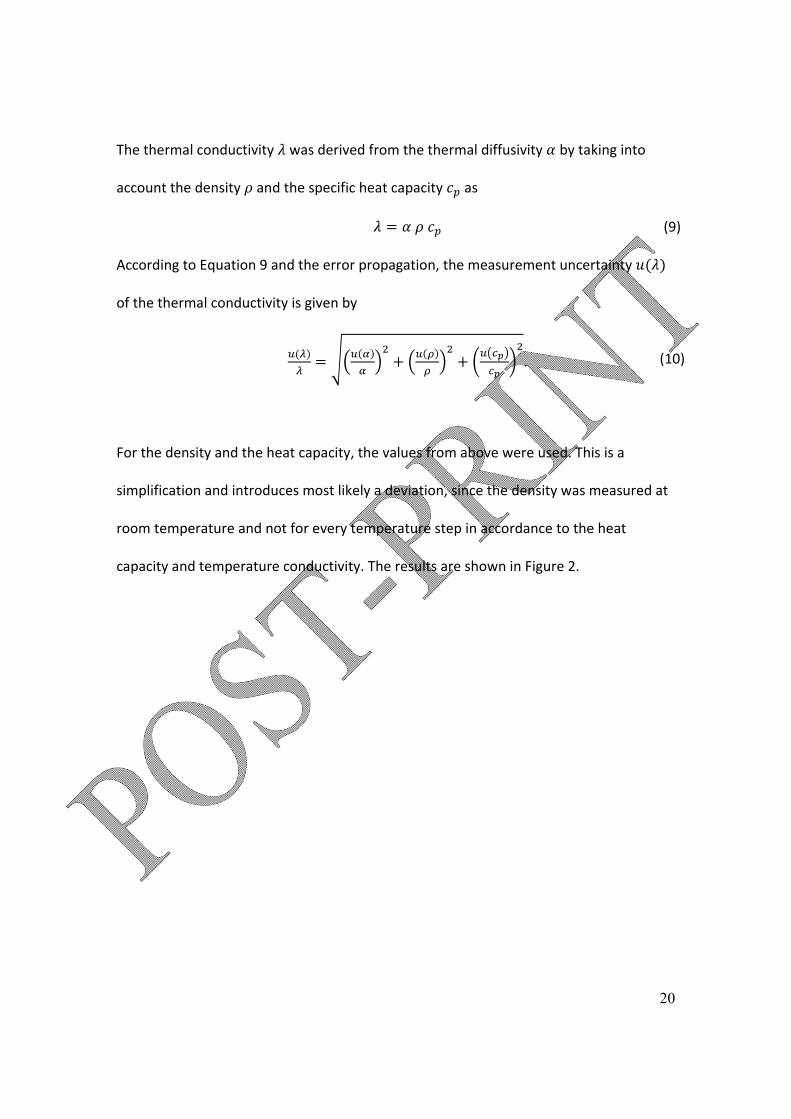
3.5 Measurement of the thermal conductivity
The thermal conductivity of the feedstocks was determined indirectly by the
measurement of the thermal diffusivity in a laser flash analysis. The thermal diffusivity
was measured by means of the laser flash apparatus Netzsch LFA 427. In the laser flash
analysis, the top surface of the sample was heated up with a short laser flash and the
introduced heat spread over the specimen. An infrared sensor monitored the time‐
dependent temperature distribution on the lower surface of the sample from which the
thermal diffusivity could be inferred. The instrument operated in accordance to
ISO 22007‐4 for the determination of the thermal conductivity [35,36].
For each material, the laser flash analysis was conducted with one of the molded disc
samples from the density measurements. The temperature range was 25 °C to 180 °C
with temperature steps of 10 °C. The reported value of the thermal diffusivity is the
average of five measurements at every temperature step.
20
The thermal conductivity was derived from the thermal diffusivity by taking into
account the density and the specific heat capacity as
(9)
According to Equation 9 and the error propagation, the measurement uncertainty
of the thermal conductivity is given by
. (10)
For the density and the heat capacity, the values from above were used. This is a
simplification and introduces most likely a deviation, since the density was measured at
room temperature and not for every temperature step in accordance to the heat
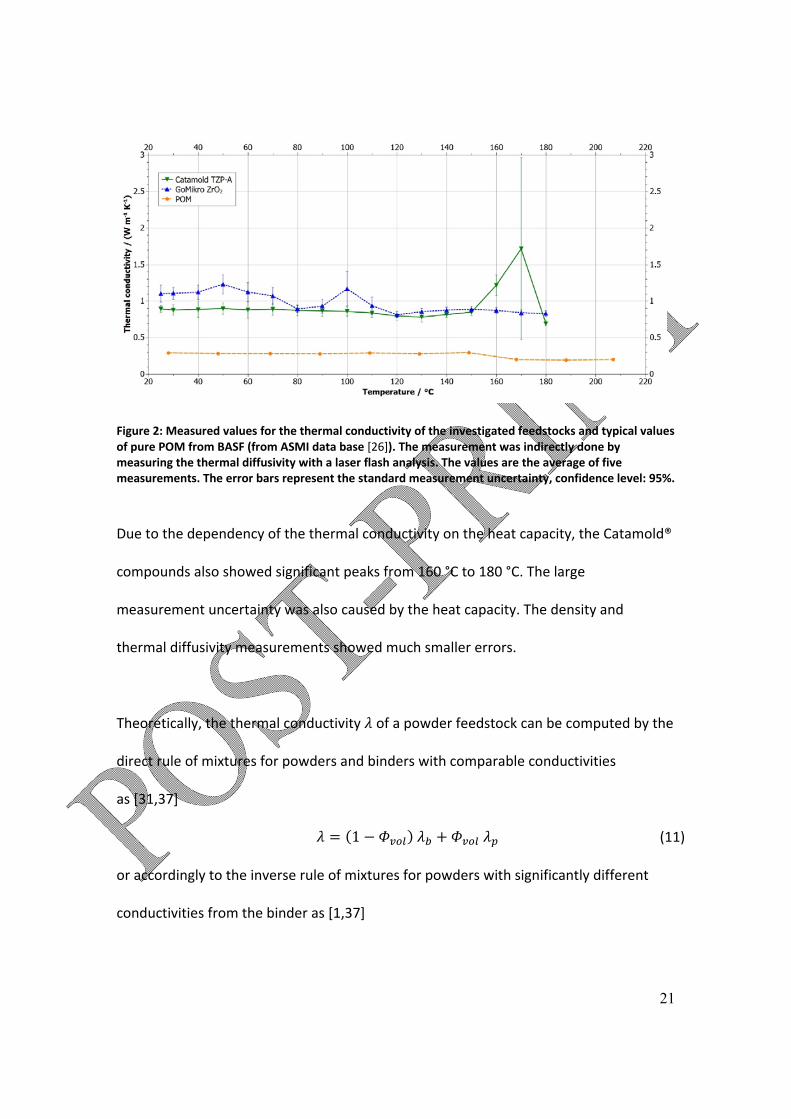
capacity and temperature conductivity. The results are shown in Figure 2.
21
Figure 2: Measured values for the thermal conductivity of the investigated feedstocks and typical values of pure POM from BASF (from ASMI data base [26]). The measurement was indirectly done by measuring the thermal diffusivity with a laser flash analysis. The values are the average of five measurements. The error bars represent the standard measurement uncertainty, confidence level: 95%.
Due to the dependency of the thermal conductivity on the heat capacity, the Catamold®
compounds also showed significant peaks from 160 °C to 180 °C. The large
measurement uncertainty was also caused by the heat capacity. The density and
thermal diffusivity measurements showed much smaller errors.
Theoretically, the thermal conductivity of a powder feedstock can be computed by the
direct rule of mixtures for powders and binders with comparable conductivities
as [31,37]
1 (11)
or accordingly to the inverse rule of mixtures for powders with significantly different
conductivities from the binder as [1,37]
22
1 1 (12)
with the powder volume fraction and the thermal conductivities and of the
binder and powder, respectively.
The theoretical conductivity of the feedstocks was determined according to Equation 11
as about 1‐2 W m‐1 K‐1). Except for the characteristic peaks of both materials, the two
ceramic feedstocks show very similar thermal conductivity of about 1 W m‐1 K‐1. Thus,
the measured values are in good agreement with the theoretical value. The thermal
conductivity of the ceramic feedstocks is hence situated at the lower end of the typical
range of zirconium oxide of about 1‐3 W m‐1 K‐1 [38,39], but noticeably higher than for
the pure binder of typically about 0.3 W m‐1 K‐1 [1]. Discrepancies are also introduced
by the measurement uncertainties of density and heat capacity.
3.6 Measurement of the viscosity
The viscosity data of the feedstocks was measured using the high pressure capillary
rheometer Göttfert Rheograph 25 made by Göttfert Werkstoff‐Prüfmaschinen, Buchen,
Germany. The rheometer determined the wall shear rate and wall shear stress based on
the measurement of the pressure drop over the capillary and a given flow rate. For
every material, the measurement procedure was conducted for three differently long
capillaries (diameters of 10mm , 20mm, and 30mm ) and three different temperature
levels (low, medium, high) in the recommended processing window of each individual
material (Catamold TZP‐A: 170, 175, 180 °C; GoMikro ZrO2: 150, 160, 170 °C). The
23
viscosity was measured at shear rates in the order of approximately 1 s−1 to 104 s−1. The
measurement and data processing procedure was established in accordance to ASTM
D 3835. Afterwards, the data was processed with Göttfert WinRheo II. The software
applied the Weissenberg‐Rabinowitsch and Bagley correction to the recorded viscosity
data to calculate the true viscosity data by consideration of the different capillary
lengths and temperature levels. Finally, the data was fitted to the Cross‐WLF viscosity
model and the parameters were extracted using Autodesk Simulation Moldflow Insight
2015® (ASMI) made by Autodesk, San Rafael, CA, USA and SigmaSoft®, developed by
SIGMA Engineering, Aachen, Germany.
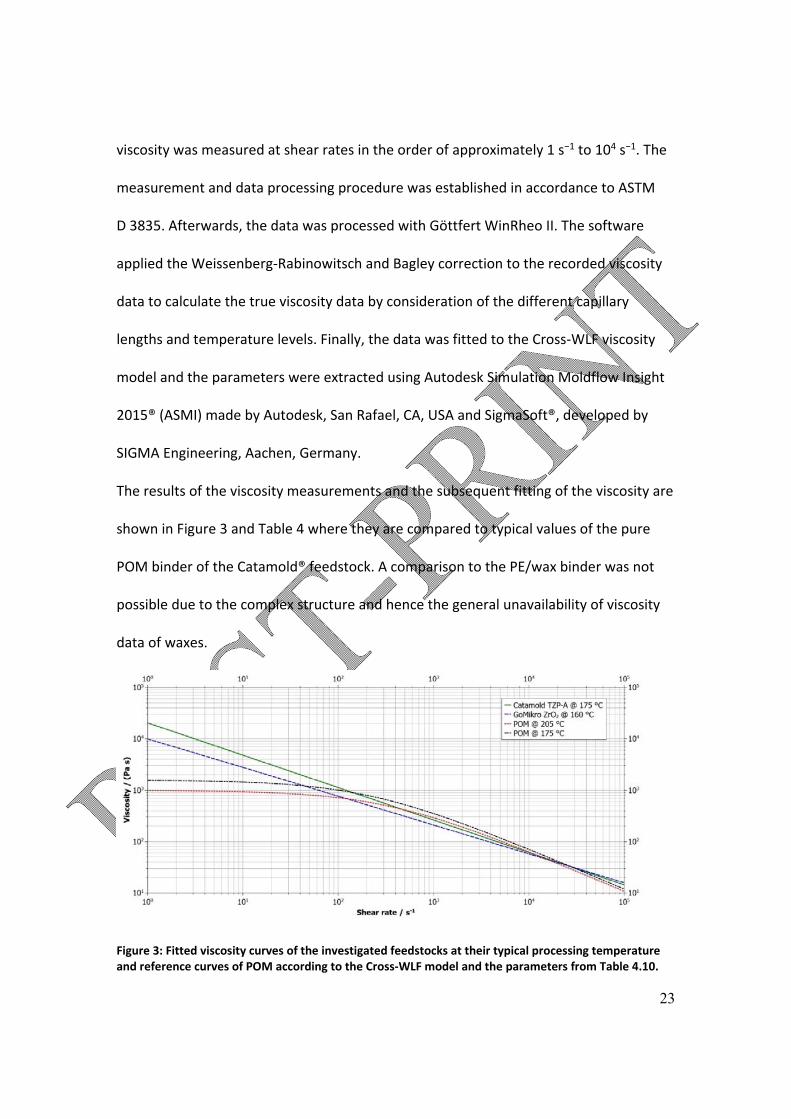
The results of the viscosity measurements and the subsequent fitting of the viscosity are
shown in Figure 3 and Table 4 where they are compared to typical values of the pure
POM binder of the Catamold® feedstock. A comparison to the PE/wax binder was not
possible due to the complex structure and hence the general unavailability of viscosity
data of waxes.
Figure 3: Fitted viscosity curves of the investigated feedstocks at their typical processing temperature and reference curves of POM according to the Cross‐WLF model and the parameters from Table 4.10.
24
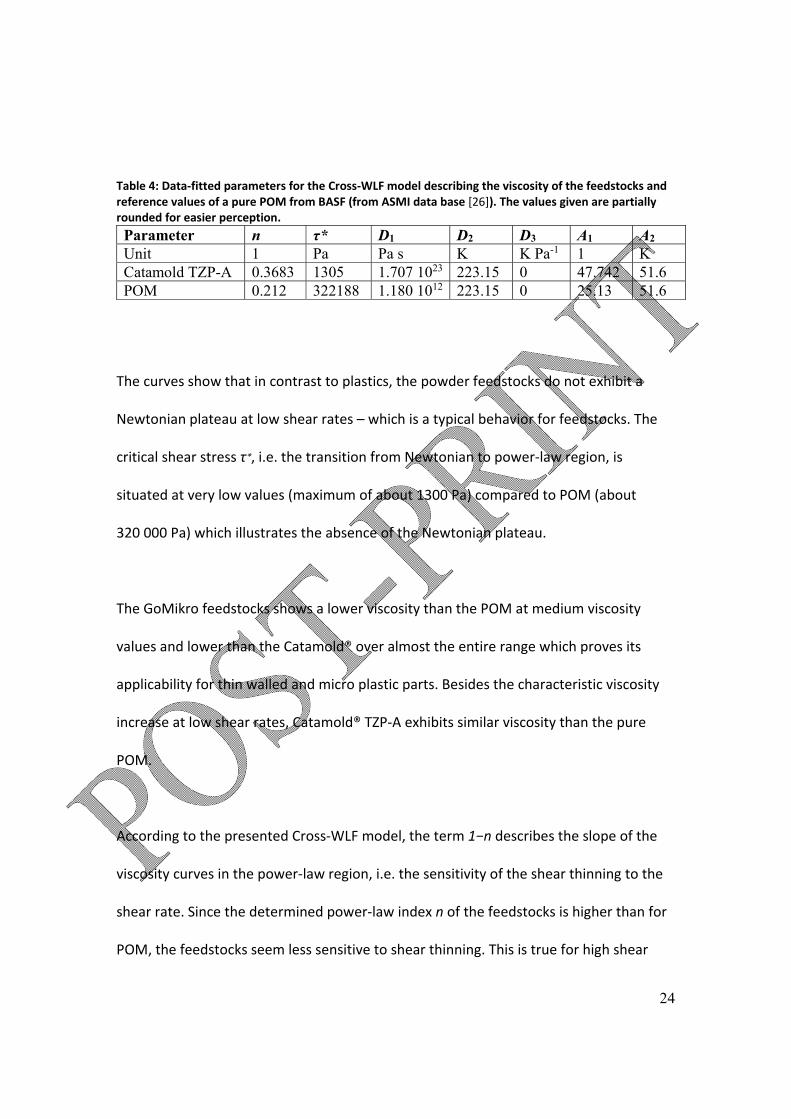
Table 4: Data‐fitted parameters for the Cross‐WLF model describing the viscosity of the feedstocks and reference values of a pure POM from BASF (from ASMI data base [26]). The values given are partially rounded for easier perception.
Parameter n τ* D1 D2 D3 A1 A2 Unit 1 Pa Pa s K K Pa-1 1 K Catamold TZP-A 0.3683 1305 1.707 1023 223.15 0 47.742 51.6 POM 0.212 322188 1.180 1012 223.15 0 25.13 51.6
The curves show that in contrast to plastics, the powder feedstocks do not exhibit a
Newtonian plateau at low shear rates – which is a typical behavior for feedstocks. The
critical shear stress τ∗, i.e. the transition from Newtonian to power‐law region, is
situated at very low values (maximum of about 1300 Pa) compared to POM (about
320 000 Pa) which illustrates the absence of the Newtonian plateau.
The GoMikro feedstocks shows a lower viscosity than the POM at medium viscosity
values and lower than the Catamold® over almost the entire range which proves its
applicability for thin walled and micro plastic parts. Besides the characteristic viscosity
increase at low shear rates, Catamold® TZP‐A exhibits similar viscosity than the pure
POM.
According to the presented Cross‐WLF model, the term 1−n describes the slope of the
viscosity curves in the power‐law region, i.e. the sensitivity of the shear thinning to the
shear rate. Since the determined power‐law index n of the feedstocks is higher than for
POM, the feedstocks seem less sensitive to shear thinning. This is true for high shear
25
rates (> 5000s−1) where the power‐law region of POM is fully developed. At low shear
rates though, the feedstocks show stronger shear thinning tendency, but also much
higher absolute viscosity values owing to the missing Newtonian plateau.
3.7 Measurement of the pvT data
The pvT data of the feedstocks was also measured using the Göttfert Rheograph 25. The
measurements were carried out starting at the maximum individual allowed processing
temperature for each feedstock and then sweeping the temperature down to 40 °C to
cover the entire processing and cooling window of the materials. The chosen
temperature steps were different for each feedstock in order to have good resolution of
the acquired data in the process window and at the transition temperature.
At each temperature level, the rheometer applied a force accordingly to the
investigated pressure level to the finite material sample. The contraction of the sample
with temperature was measured from which the sample volume could be derived.
Before acquiring data at any temperature, the material was allowed to rest and settle to
prevent from any influence of possible material relaxation.
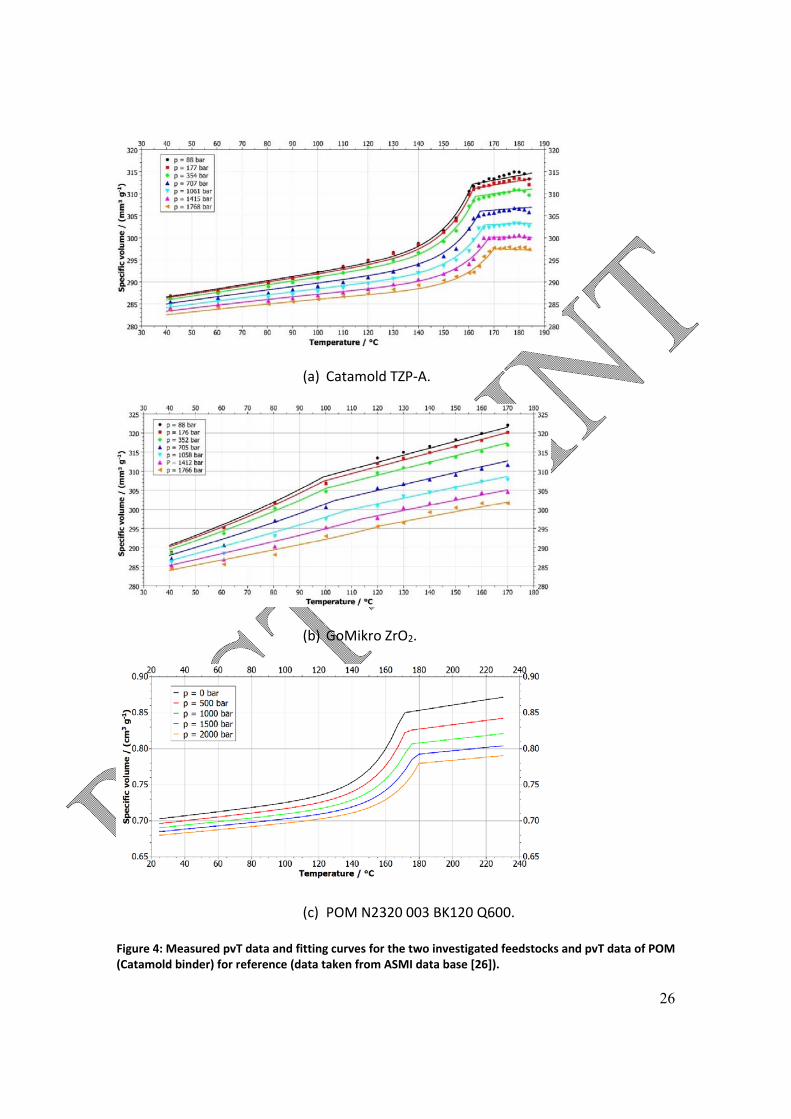
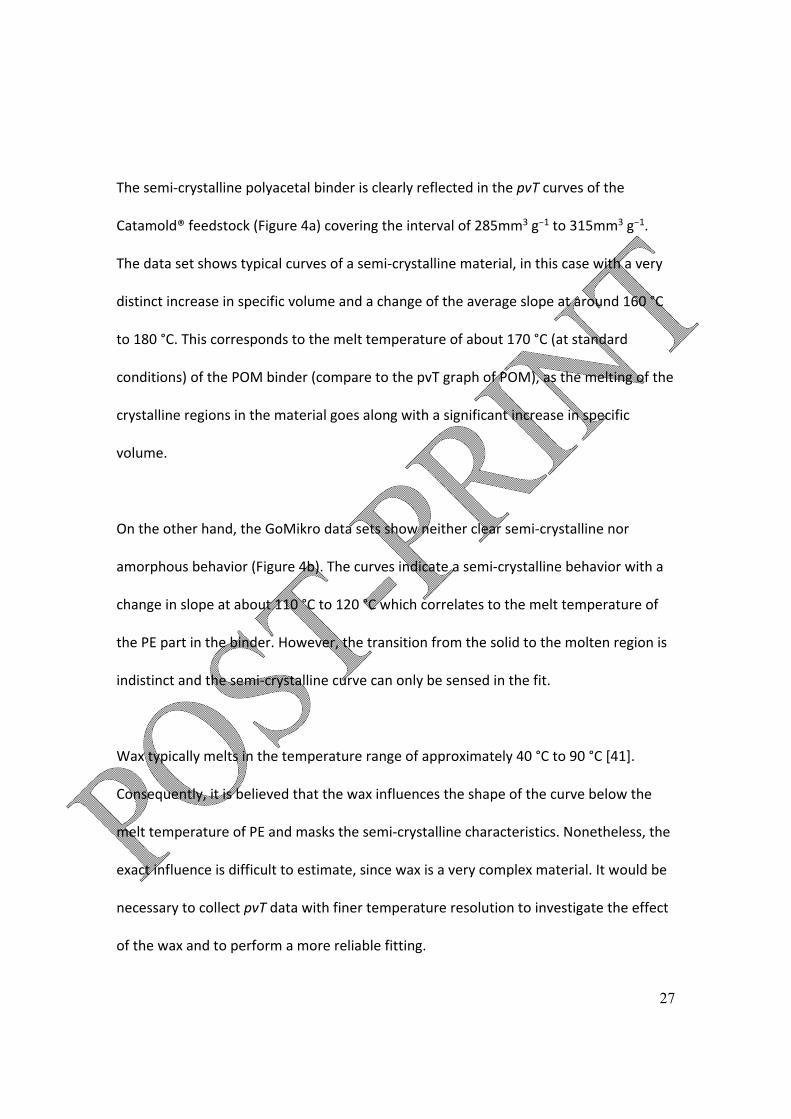
The measured data and the fits for all four tested feedstocks are shown in Figure 4.
Additionally, it provides also the pvT data of the Catamold® binder POM for comparison.
POM shows much higher values for the specific volume because of the missing powder.
The main contributor to the increase in specific volume of the feedstocks is the binder.
The thermal expansion of the metal and ceramic powders only reaches < 1% for a
temperature difference of 160 °C (at standard pressure). The increase in specific volume
of the feedstocks nonetheless reaches values of more than 12%.
26
(a) Catamold TZP‐A.
(b) GoMikro ZrO2.
(c) POM N2320 003 BK120 Q600.
Figure 4: Measured pvT data and fitting curves for the two investigated feedstocks and pvT data of POM (Catamold binder) for reference (data taken from ASMI data base [26]).
27
The semi‐crystalline polyacetal binder is clearly reflected in the pvT curves of the
Catamold® feedstock (Figure 4a) covering the interval of 285mm3 g−1 to 315mm3 g−1.
The data set shows typical curves of a semi‐crystalline material, in this case with a very
distinct increase in specific volume and a change of the average slope at around 160 °C
to 180 °C. This corresponds to the melt temperature of about 170 °C (at standard
conditions) of the POM binder (compare to the pvT graph of POM), as the melting of the
crystalline regions in the material goes along with a significant increase in specific
volume.
On the other hand, the GoMikro data sets show neither clear semi‐crystalline nor
amorphous behavior (Figure 4b). The curves indicate a semi‐crystalline behavior with a
change in slope at about 110 °C to 120 °C which correlates to the melt temperature of
the PE part in the binder. However, the transition from the solid to the molten region is
indistinct and the semi‐crystalline curve can only be sensed in the fit.
Wax typically melts in the temperature range of approximately 40 °C to 90 °C [41].
Consequently, it is believed that the wax influences the shape of the curve below the
melt temperature of PE and masks the semi‐crystalline characteristics. Nonetheless, the
exact influence is difficult to estimate, since wax is a very complex material. It would be
necessary to collect pvT data with finer temperature resolution to investigate the effect
of the wax and to perform a more reliable fitting.
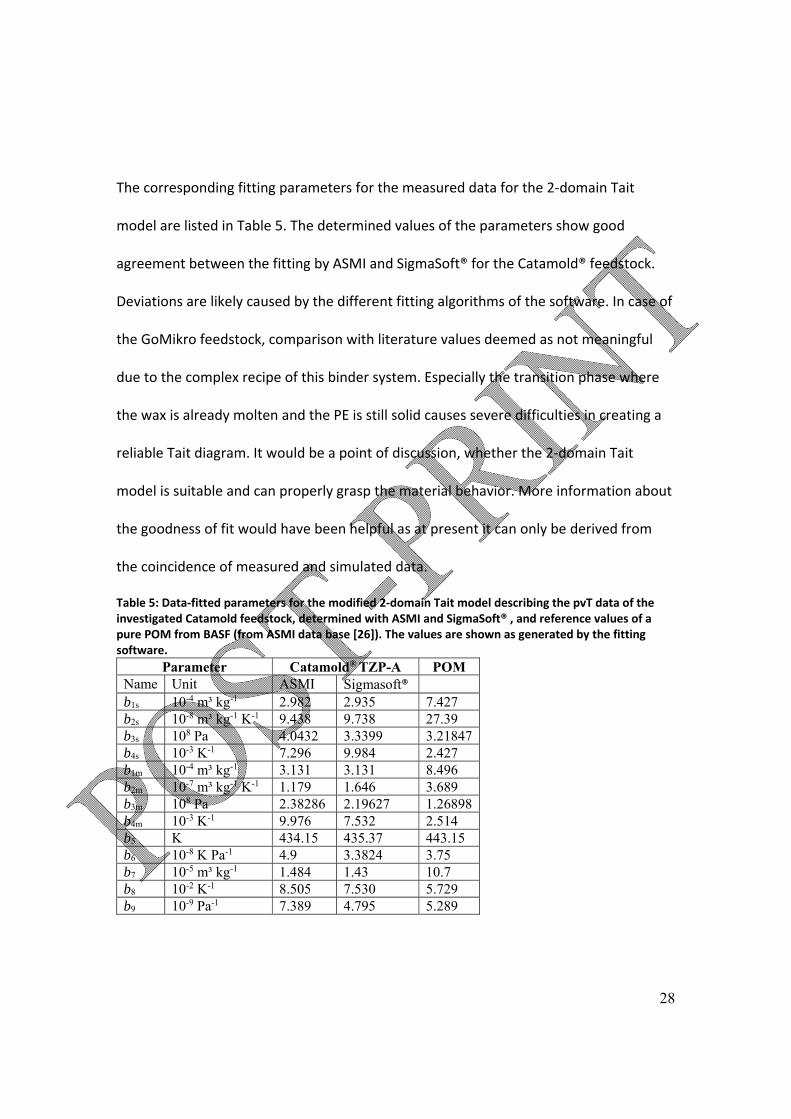
28
The corresponding fitting parameters for the measured data for the 2‐domain Tait
model are listed in Table 5. The determined values of the parameters show good
agreement between the fitting by ASMI and SigmaSoft® for the Catamold® feedstock.
Deviations are likely caused by the different fitting algorithms of the software. In case of
the GoMikro feedstock, comparison with literature values deemed as not meaningful
due to the complex recipe of this binder system. Especially the transition phase where
the wax is already molten and the PE is still solid causes severe difficulties in creating a
reliable Tait diagram. It would be a point of discussion, whether the 2‐domain Tait
model is suitable and can properly grasp the material behavior. More information about
the goodness of fit would have been helpful as at present it can only be derived from
the coincidence of measured and simulated data.
Table 5: Data‐fitted parameters for the modified 2‐domain Tait model describing the pvT data of the investigated Catamold feedstock, determined with ASMI and SigmaSoft® , and reference values of a pure POM from BASF (from ASMI data base [26]). The values are shown as generated by the fitting software.
Parameter Catamold® TZP-A POMName Unit ASMI Sigmasoft® b1s 10-4 m³ kg-1 2.982 2.935 7.427 b2s 10-8 m³ kg-1 K-1 9.438 9.738 27.39 b3s 108 Pa 4.0432 3.3399 3.21847b4s 10-3 K-1 7.296 9.984 2.427 b1m 10-4 m³ kg-1 3.131 3.131 8.496 b2m 10-7 m³ kg-1 K-1 1.179 1.646 3.689 b3m 108 Pa 2.38286 2.19627 1.26898b4m 10-3 K-1 9.976 7.532 2.514 b5 K 434.15 435.37 443.15 b6 10-8 K Pa-1 4.9 3.3824 3.75 b7 10-5 m³ kg-1 1.484 1.43 10.7 b8 10-2 K-1 8.505 7.530 5.729 b9 10-9 Pa-1 7.389 4.795 5.289
29
4. INJECTIONMOLDINGEXPERIMENTS
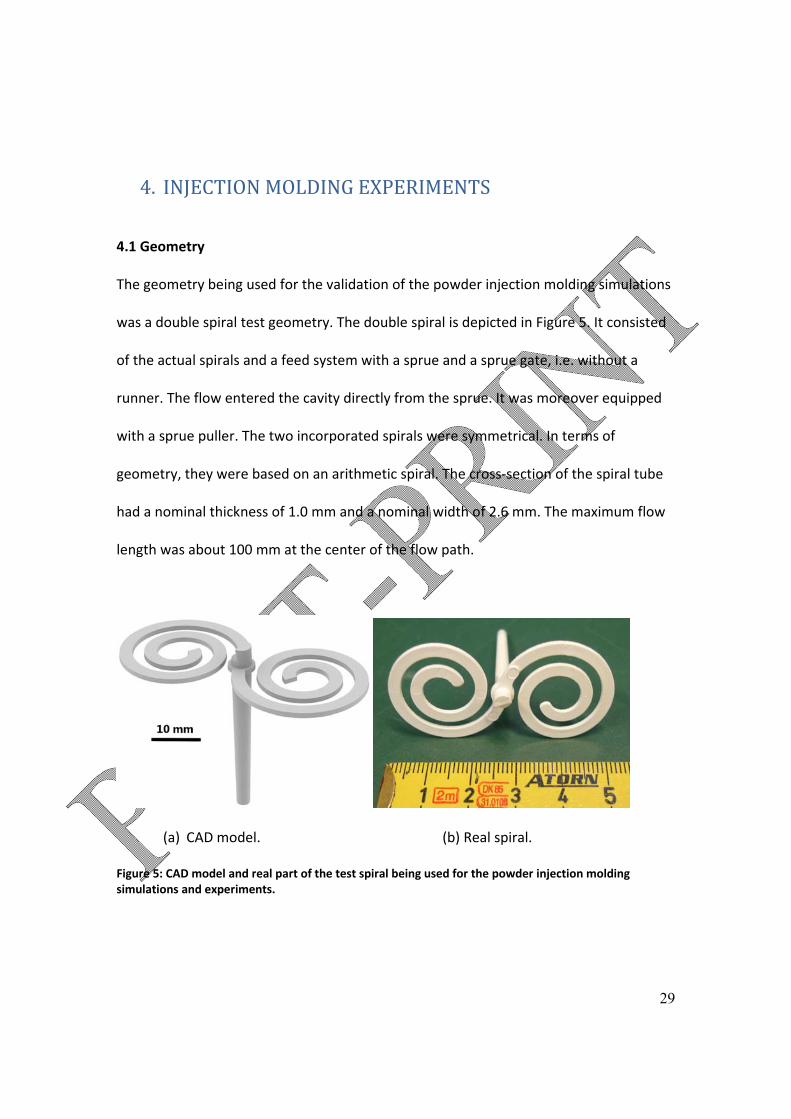
4.1 Geometry
The geometry being used for the validation of the powder injection molding simulations
was a double spiral test geometry. The double spiral is depicted in Figure 5. It consisted
of the actual spirals and a feed system with a sprue and a sprue gate, i.e. without a
runner. The flow entered the cavity directly from the sprue. It was moreover equipped
with a sprue puller. The two incorporated spirals were symmetrical. In terms of
geometry, they were based on an arithmetic spiral. The cross‐section of the spiral tube
had a nominal thickness of 1.0 mm and a nominal width of 2.6 mm. The maximum flow
length was about 100 mm at the center of the flow path.
(a) CAD model. (b) Real spiral.
Figure 5: CAD model and real part of the test spiral being used for the powder injection molding simulations and experiments.
30
The flow spiral could be classified as micro precision part, because of the tight
tolerances in the micrometer range. The part was selected because of the advanced
mold with a sensor array (described in the next section) allowing for in‐process
monitoring and characterization. The scientific value was the extensive data acquisition
which laid the foundation for the performance assessment of the powder feedstocks
regarding micro parts and for the process simulations of the injection molding process.
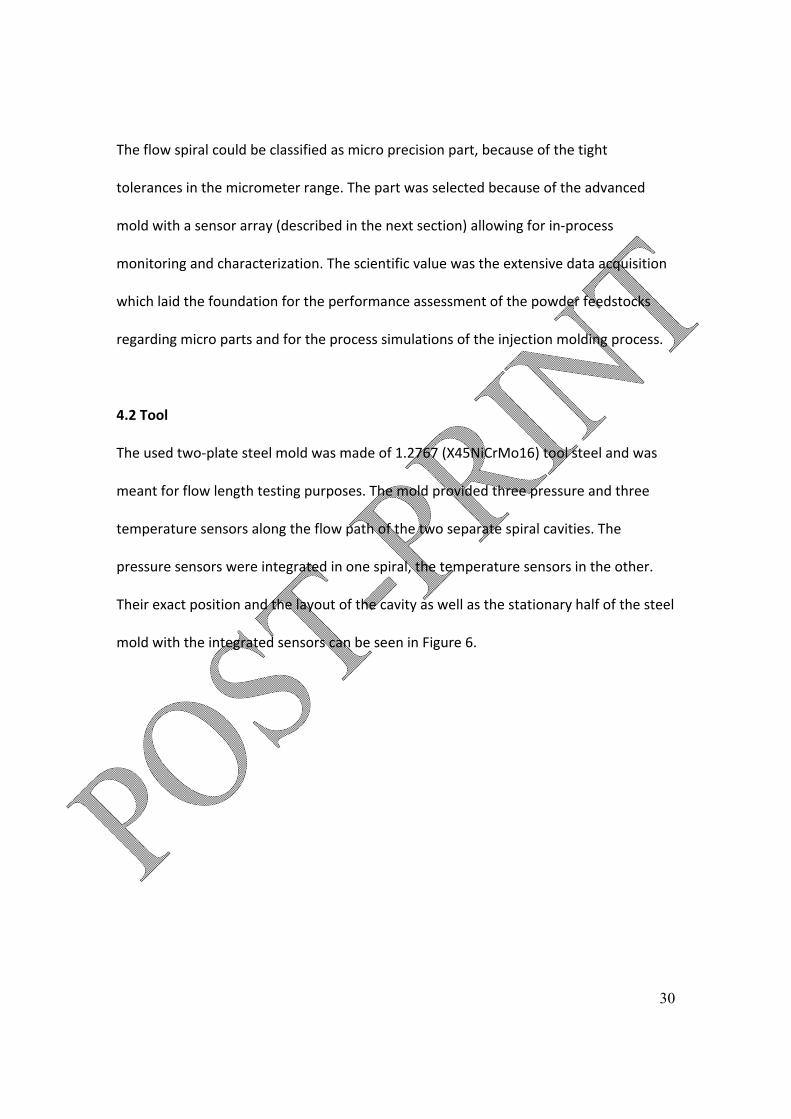
4.2 Tool
The used two‐plate steel mold was made of 1.2767 (X45NiCrMo16) tool steel and was
meant for flow length testing purposes. The mold provided three pressure and three
temperature sensors along the flow path of the two separate spiral cavities. The
pressure sensors were integrated in one spiral, the temperature sensors in the other.
Their exact position and the layout of the cavity as well as the stationary half of the steel
mold with the integrated sensors can be seen in Figure 6.
31
(a) Schematic with sensor positions. (b) Stationary half.
Figure 6: Drawing of the cavity layout of the double spiral with the positions of the temperature and pressure sensors (denoted with T and p, respectively) and picture of the stationary half of the double spiral test mold with pressure and temperature sensors (not visible) and their connections (cables on the right) used for the powder injection molding experiments.
The sensor array allowed to investigate the pressure and temperature evolution in the
cavity live during the filling phase of the injection molding process. The pressure sensors
were of type 6003B and the temperature sensors of type 4008B (type N thermocouple)
made by Priamus System Technologies, Schaffhausen, Switzerland. The sensors were
exposed to the melt on a diameter of 2.5 mm and 1.0 mm, respectively. The sampling
frequency of the sensors was 200 Hz. The signals of the pressure sensors are denoted in
the following sections as p1, p2, and p3; the temperature sensors were not used in this
investigation. In addition to the sensors, the injection molding machine also monitored
the applied injection pressure of the hydraulic drive which is denoted as pM in the
following.
32
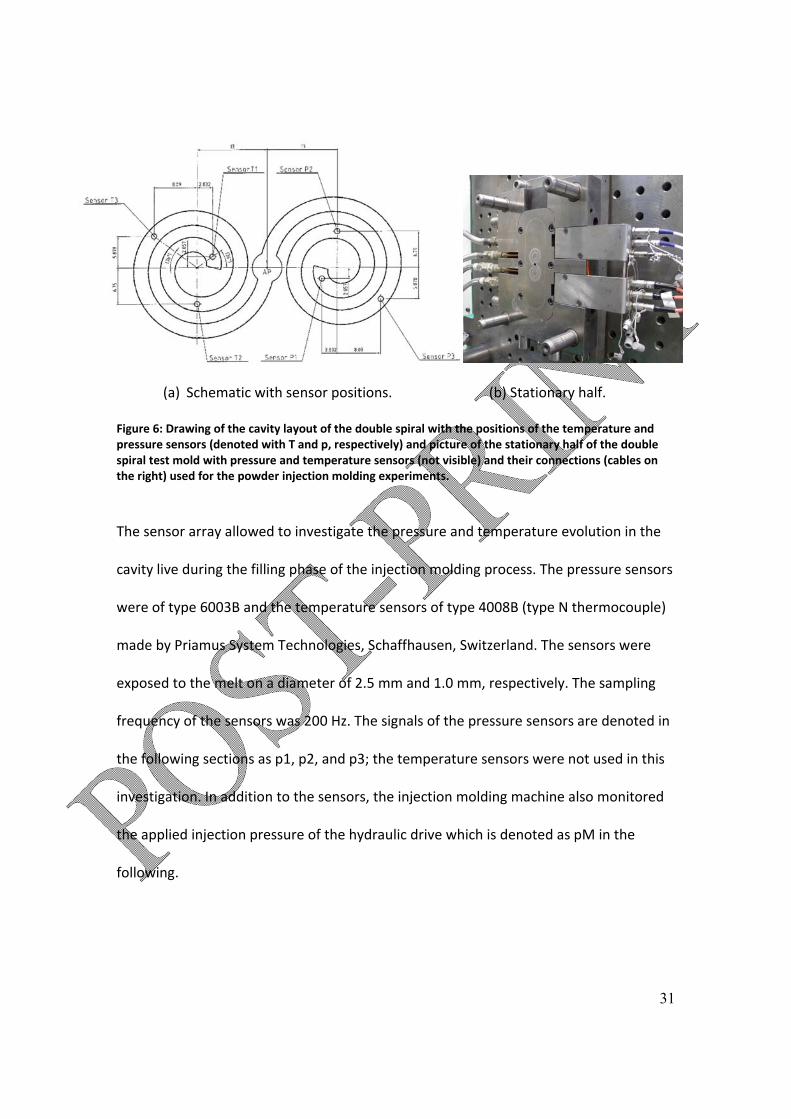
4.3 Experimental conditions
Full shots of the double spiral were molded with all four presented feedstocks. The goal
was to investigate the pressure development in the cavity as well as to evaluate the flow
length and thus the applicability of the feedstocks to micro structures. The flow length
was evaluated by an angular measurement of the spirals from which the spiral length
could be calculated. The process settings were chosen accordingly to the molded
material and are listed in Table 6. The used injection molding machine was an Arburg
Allrounder 420 C 600‐100 with a screw and nozzle diameter of 15 mm and 2.0 mm,
respectively, and made by Arburg, Loßburg, Germany. The experiments were carried out
at the Karlsruhe Institute of Technology (KIT), Eggenstein‐Leopoldshafen, Germany. The
melt and mold temperatures of the feedstocks were chosen as high as allowed to
achieve the best filling and largest flow length.
Table 6: Process settings for the molding of the double spiral geometry with the characterized feedstocks.
Parameter Catamold® TZP‐A GoMikro ZrO2
Nozzle temperature / °C 180 200
Barrel temperature / °C 172‐180 178‐200
Mold temperature / °C 145 51
Injection speed / mm/s 35 40
Packing time / s 2.7 2.7
Cooling time / s 35 35
33
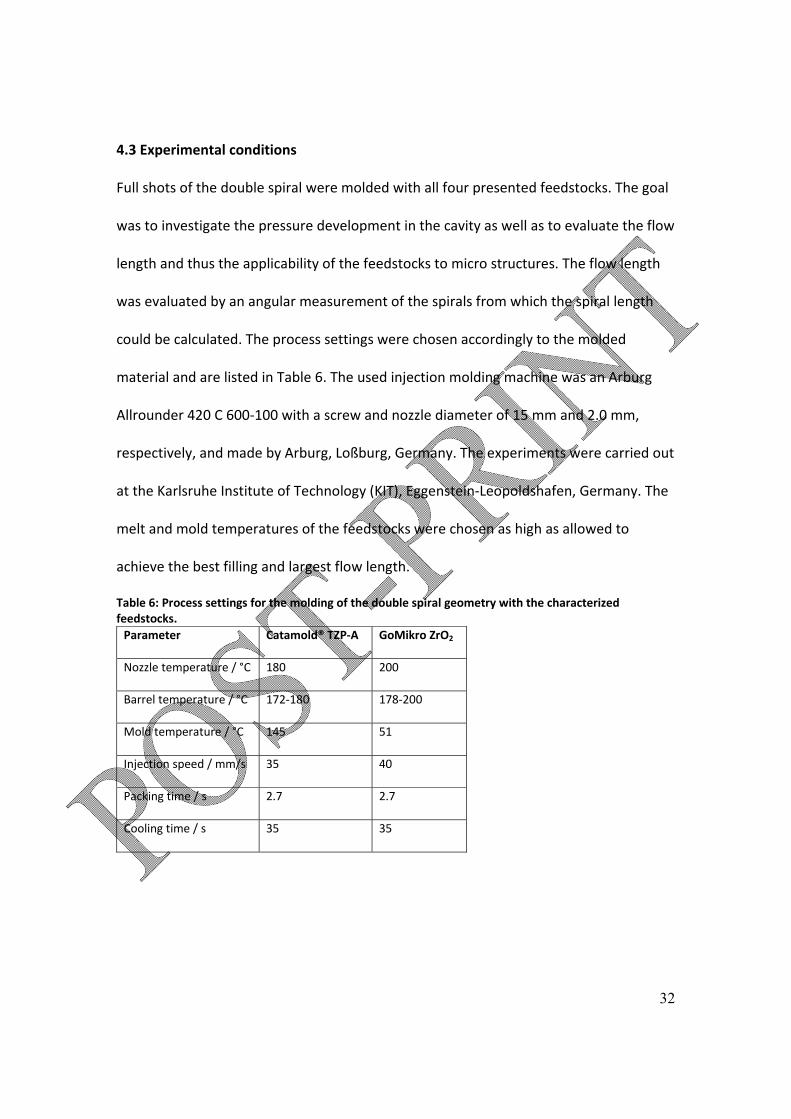
4.4 Experimental results
The injection time and pressure of the full shots are listed in Table 7. First, it can be
noticed that the necessary injection pressures to mold the parts were very high for both
feedstocks—exceeding for three materials in fact the nominal maximum injection
pressure of the machine of 250 MPa.
Table 7: Experimental results for the full shots of the molded test spirals. Reported pressure is the average of four and sixteen measurements for Catamold® TZP‐A and GoMikro ZrO2, respectively. Confidence level: 90 %.
Compound Fill time / s Fill pressure / MPa Flow length / mm
Catamold® TZP‐A 0.45 262.5±3.6 95
GoMikro ZrO2 0.42 263.3±1.2 100
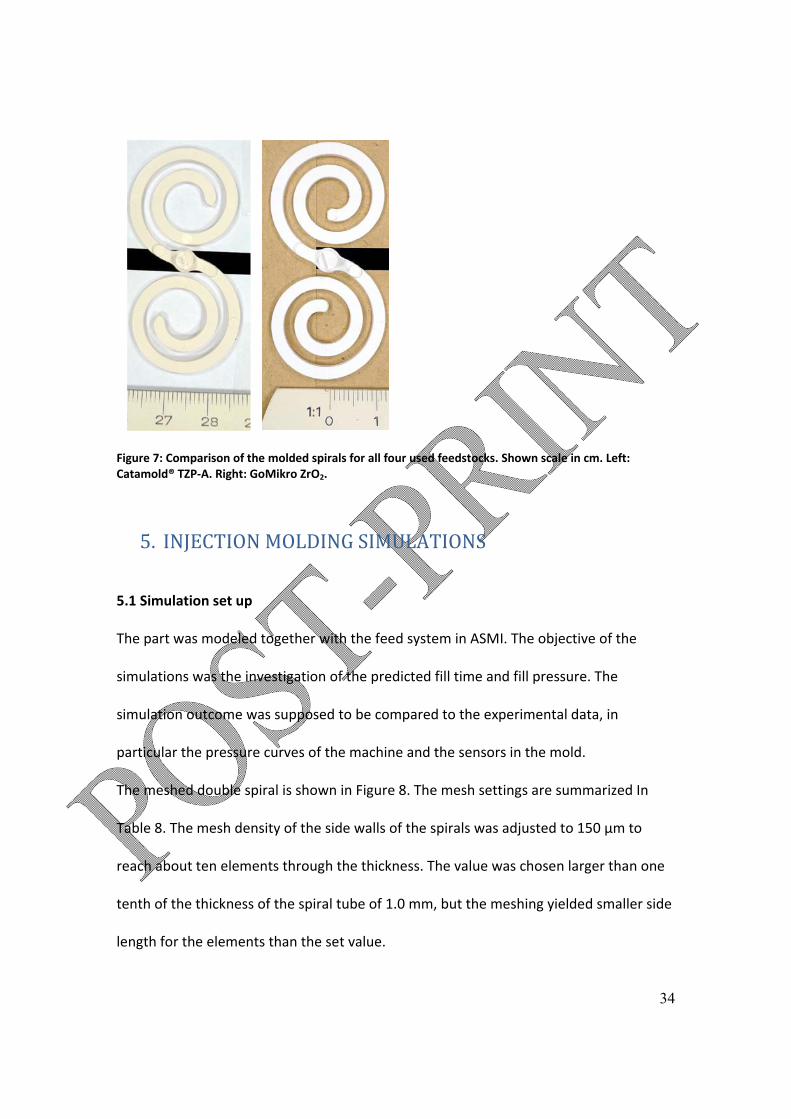
The resulting samples of the full shots of the double test spiral are shown in Figure 7.
The GoMikro feedstock is actually compounded especially for easy flow and the molding
of thin‐walled and micro parts. This property was indicated by the complete filling of the
cavity, whereas the Catamold® feedstock led to short shots; demonstrating that micro
injection molding with the Catamold® feedstock can therefore be evaluated as
challenging and very dependent on the aspect ratio and flow length of the molded part.
34
Figure 7: Comparison of the molded spirals for all four used feedstocks. Shown scale in cm. Left: Catamold® TZP‐A. Right: GoMikro ZrO2.
5. INJECTIONMOLDINGSIMULATIONS
5.1 Simulation set up
The part was modeled together with the feed system in ASMI. The objective of the
simulations was the investigation of the predicted fill time and fill pressure. The
simulation outcome was supposed to be compared to the experimental data, in
particular the pressure curves of the machine and the sensors in the mold.
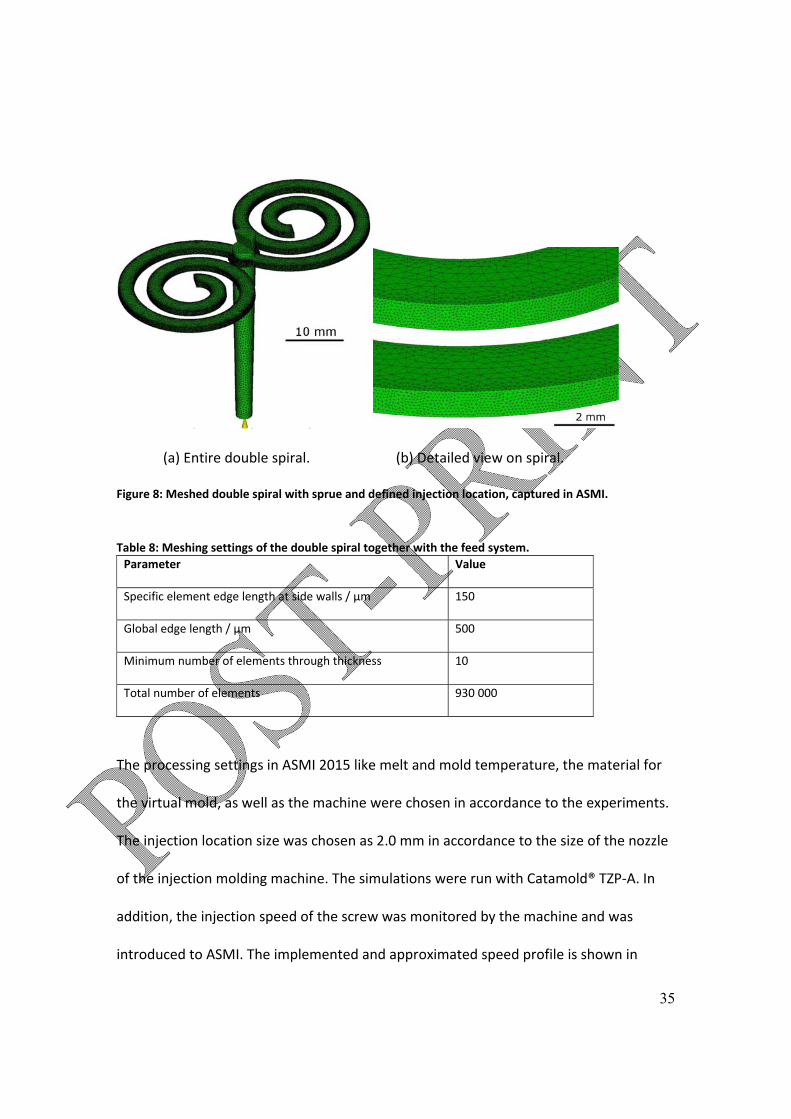
The meshed double spiral is shown in Figure 8. The mesh settings are summarized In
Table 8. The mesh density of the side walls of the spirals was adjusted to 150 µm to
reach about ten elements through the thickness. The value was chosen larger than one
tenth of the thickness of the spiral tube of 1.0 mm, but the meshing yielded smaller side
length for the elements than the set value.
35
(a) Entire double spiral. (b) Detailed view on spiral.
Figure 8: Meshed double spiral with sprue and defined injection location, captured in ASMI.
Table 8: Meshing settings of the double spiral together with the feed system.
Parameter Value
Specific element edge length at side walls / µm 150
Global edge length / µm 500
Minimum number of elements through thickness 10
Total number of elements 930 000
The processing settings in ASMI 2015 like melt and mold temperature, the material for
the virtual mold, as well as the machine were chosen in accordance to the experiments.
The injection location size was chosen as 2.0 mm in accordance to the size of the nozzle
of the injection molding machine. The simulations were run with Catamold® TZP‐A. In
addition, the injection speed of the screw was monitored by the machine and was
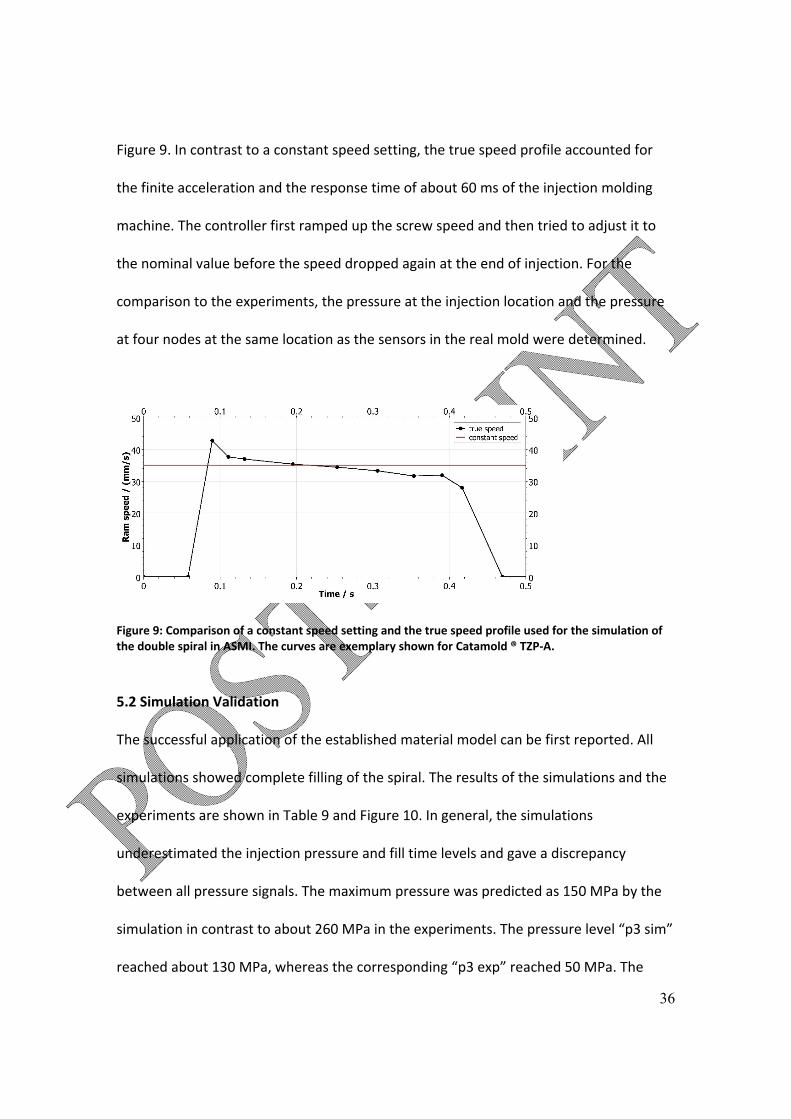
introduced to ASMI. The implemented and approximated speed profile is shown in
36
Figure 9. In contrast to a constant speed setting, the true speed profile accounted for
the finite acceleration and the response time of about 60 ms of the injection molding
machine. The controller first ramped up the screw speed and then tried to adjust it to
the nominal value before the speed dropped again at the end of injection. For the
comparison to the experiments, the pressure at the injection location and the pressure
at four nodes at the same location as the sensors in the real mold were determined.
Figure 9: Comparison of a constant speed setting and the true speed profile used for the simulation of the double spiral in ASMI. The curves are exemplary shown for Catamold ® TZP‐A.
5.2 Simulation Validation
The successful application of the established material model can be first reported. All
simulations showed complete filling of the spiral. The results of the simulations and the
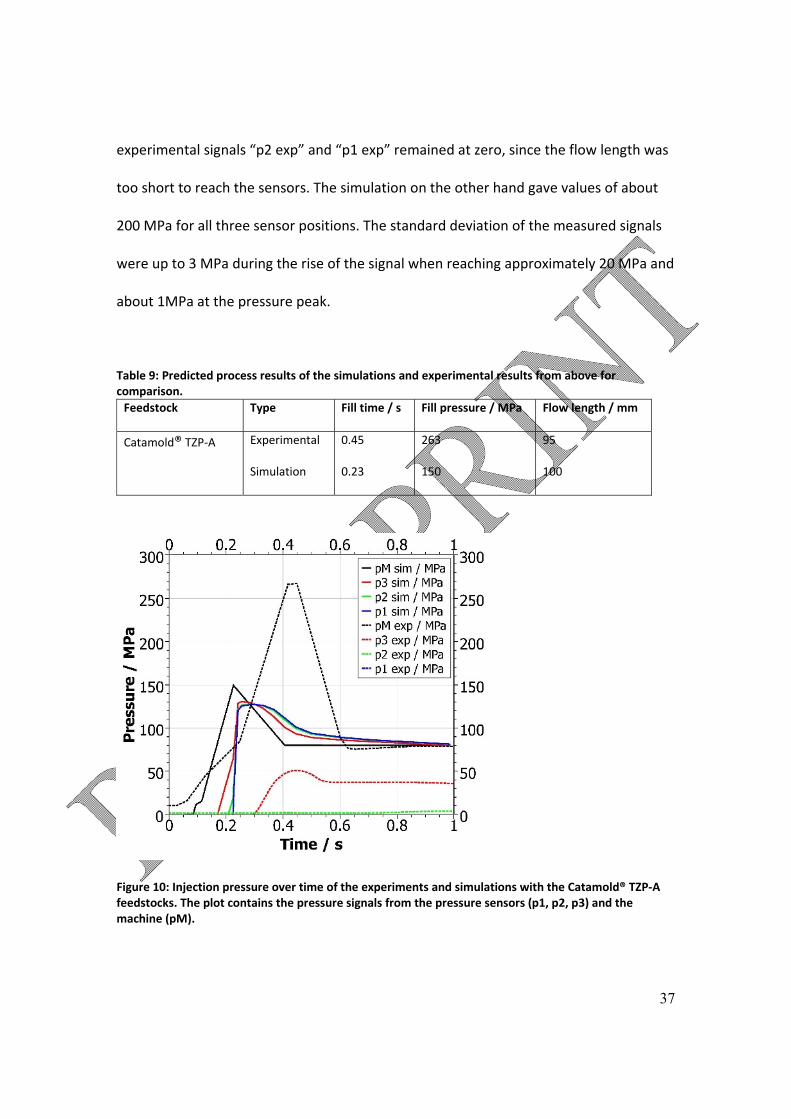
experiments are shown in Table 9 and Figure 10. In general, the simulations
underestimated the injection pressure and fill time levels and gave a discrepancy
between all pressure signals. The maximum pressure was predicted as 150 MPa by the
simulation in contrast to about 260 MPa in the experiments. The pressure level “p3 sim”
reached about 130 MPa, whereas the corresponding “p3 exp” reached 50 MPa. The
37
experimental signals “p2 exp” and “p1 exp” remained at zero, since the flow length was
too short to reach the sensors. The simulation on the other hand gave values of about
200 MPa for all three sensor positions. The standard deviation of the measured signals
were up to 3 MPa during the rise of the signal when reaching approximately 20 MPa and
about 1MPa at the pressure peak.
Table 9: Predicted process results of the simulations and experimental results from above for comparison.
Feedstock Type Fill time / s Fill pressure / MPa Flow length / mm
Catamold® TZP‐A Experimental
Simulation
0.45
0.23
263
150
95
100
Figure 10: Injection pressure over time of the experiments and simulations with the Catamold® TZP‐A feedstocks. The plot contains the pressure signals from the pressure sensors (p1, p2, p3) and the machine (pM).
38
The material data base was excellent and up‐to‐date because of the conducted
characterization. Furthermore, the spiral was not a micro part, so that deviations due to
software limitations regarding insufficiently implemented microscale effects could be
most likely ruled out.
Possible reasons causing the discrepancies are the influence of the particle size and
particle shape as well as the feedstock behavior which seemed to be not very well
described by the Cross‐WLF model – despite the viscosity curves’ similarity to power‐law
curves. The introduction of the Herschel‐Bulkley extension to the Cross‐WLF model is
recommended by some researchers [8,18].
The influence of the viscosity model could be investigated in future work by
incorporating the Herschel‐Bulkley extension in the simulation. The applicability of
current commercial simulation tools employing the regular Cross‐WLF model could be
evaluated as limited, but showing great potential for polymer resins containing no or
less fillers. Furthermore, the material model could be improved by additional, though
time‐consuming, measurements with a disc rheometer to cover also the viscosity at very
low shear rates, where the applicability of the capillary rheometer is limited.
39
6. SUMMARYANDCONCLUSION
This work comprises a broad and comprehensive material characterization of ceramic
powder feedstocks. The aim was to establish material data which can be used for
creating a material model for the simulation of the powder injection molding process
and to exemplarily describe the necessary material data.
The powder load of the Catamold® feedstock was determined as 81 wt% (50 vol%). The
specific heat capacity was measured by DSC with special attention to the temperature
dependency. The results of the two compounds were in the typical range for powder
feedstocks with distinct peaks attributed to the melting temperatures of the binder
components and in general lower than the heat capacity of the pure binder.
The thermal conductivity was measured indirectly by the determination of the thermal
diffusivity in a laser flash analysis. The thermal conductivity also showed significant
peaks and an increase in measurement uncertainty around the melting temperatures of
the binder components which was caused by the contribution of the heat capacity.
Compared to the pure plastic binder, it was found that the feedstocks show as expected
a greater thermal conductivity. The lower heat capacity and higher thermal conductivity
can both be an issue during the filling phase. The heat carried by the feedstock is less
than for plastics and in addition released more quickly. Both effects lead to an increased
risk of premature solidification and short shots as well as larger pressure drops.
40
The viscosity was successfully measured by means of a capillary rheometer and fitted by
the Cross‐WLF model for all feedstocks. The curves showed the typical behavior of
feedstocks with a missing Newtonian plateau. Literature discusses the necessity of
extended viscosity models like Herschel‐Bulkley to fully describe this behavior of
feedstocks. Regarding the model, the viscosity measurements could be subject of future
investigations. The resolution in shear rate should be significantly increased to identify a
possible Newtonian plateau. If the Newtonian plateau was absent or covered a small
negligible range, the viscosity might still be properly modeled by the Cross‐WLF
approach. This would facilitate the applicability of existent simulation tools to powder
injection molding.
The collected pvT data of the Catamold® feedstock reflected clearly their semi‐
crystalline polyacetal binder with a significant change in specific volume at the melting
temperature. The data was successfully fitted by the 2‐domain Tait model. In contrast,
the curves of the non‐commercial GoMikro feedstock resembled neither the typical
shape of semi‐crystalline nor amorphous materials. The curves were influenced by the
different melting points of the two binder components, PE and wax.
In conclusion, collecting and processing material data turned out as an extensive and
time‐consuming, but vital task for conducting injection molding simulations. Material
data base files might not be available or outdated, especially in case of powder
41
feedstocks. The necessary material properties for establishing a material data base file
were outlined and covered by the performed detailed characterization of two ceramic
feedstocks. The material characterization finally enabled to create material data files for
the process simulations.
The investigations on powder injection molding commenced with the presentation of
the study part: a double spiral test geometry in the millimeter range. The mold of the
double spiral was equipped with pressure and temperature sensors enabling the
monitoring of the pressure and temperature inside the cavity live during injection. A full
shot study was performed to investigate the molding and as basis for comparison to the
later conducted simulations. The experiments yielded full shots of the non‐commercial
feedstock from KIT and short shots of the commercial feedstock from BASF. All tested
feedstocks caused very high injection pressures near the machine’s nominal maximum
pressure. The KIT feedstock could be evaluated as presumably suitable for micro parts.
Micro molding with the Catamold® feedstocks on the other hand is expected to be
challenging because of the high viscosity and short flow length.
The simulations with Catamold® of the double spiral comprised the part and were
compared to the experiments. The speed profile monitored during the molding was
introduced to the simulations to gain better results in comparison to a simple constant
speed profile. Furthermore, the investigation of the injection pressure measured by the
machine and by the sensors revealed that the simulations underestimated both the
42
pressure levels and fill times for the Catamold® feedstock. This was also related to the
incorrect prediction of a full shot. The main reason for the reported discrepancies was
most likely the inadequate viscosity model, i.e. the regular Cross‐WLF model. The
simulation of powder injection molding had therefore to be evaluated as critical and not
entirely reliable with the used ASMI software. However, adapted viscosity models and
access to the core of the software provide the potential for enhancements and are
recommended as scope of future work. For example, the influence of the viscosity
model could be investigated by incorporating the Herschel‐Bulkley extension in the
simulation.
ACKNOWLEDGMENTS This paper reports work undertaken in a collaboration between the Technical University
of Denmark (DTU), Kongens Lyngby, Denmark and the Karlsruhe Institute of Technology
(KIT), Eggenstein‐Leopoldshafen, Germany. The financial and personnel aid of both
facilities is greatly acknowledged. Furthermore, the work and collaboration was
supported by the Karlsruhe Nano Micro Facilities (KNMF, www.knmf.kit.edu), the
Helmholtz Research Infrastructure at Karlsruhe Institute of Technology,(proposal ID:
2014‐012‐004392) which is also gratefully acknowledged and which made this research
possible.
43
REFERENCES [1] Heaney, D. F., 2012, Handbook of Metal Injection Molding, Woodhead Publishing, Cambridge, UK. [2] Wang, J., 2012, Some critical issues for injection molding, InTech, Rijeka, Croatia. [3] Attia, U. M., and Alcock, J. R., 2011, “A review of micro‐powder injection moulding as a microfabrication technique,” J. Micromechanics Microengineering, 21(4), p. 043001. [4] Attia, U. M., and Alcock, J. R., 2012, “Fabrication of ceramic micro‐scale hollow components by micro‐powder injection moulding,” J. Eur. Ceram. Soc., 32(6), pp. 1199–1204. [5] Piotter, V., 2011, “A review of the current status of MicroPIM,” Powder Inject. Molding Int., 5(3), pp. 27–42. [6] Löhe, D., and Haußelt, J., 2005, Microengineering of Metals and Ceramics. Part I: Design, Tooling and Injection Molding, Wiley‐VCH Verlag, Weinheim, Germany. [7] Urval, R., Lee, S., Atre, S. V., Park, S. J., and German, R. M., 2008, “Optimisation of process conditions in powder injection moulding of microsystem components using a robust design method: part I. primary design parameters,” Powder Metall., 51(2), pp. 133–142. [8] Thornagel, M., 2012, “Injection moulding simulation: New developments offer rewards for the PIM industry,” Powder Inject. Molding Int., 6(1), pp. 65–68. [9] SIGMA Engineering, 2013, “3D moulding simulation ‐ The ‘whole process’ approach,” Met. Powder Rep., 68(3), pp. 30–32. [10] Costa, F. S., Tosello, G., and Whiteside, B. R., 2009, “Best practice strategies for validation of micro moulding process simulation,” Proceedings of the Polymer Process Engineering 2009 Conference, University of Bradford, pp. 331–364. [11] Vietri, U., Sorrentino, A., Speranza, V., and Pantani, R., 2011, “Improving the predictions of injection molding simulation software,” Polym. Eng. Sci., 51(12), pp. 2542–2551. [12] Khalilian, S. A., Park, S. S., and Freiheit, T. I., 2013, “The Application of Commercial Injection Molding Software to Micro‐Component Design and Process Development,” Proceedings of the 8th Internation Conference on Micro Manufacturing (ICOMM 2013), pp. 50–56. [13] Marhöfer, D. M., Tosello, G., Hansen, H. N., and Islam, A., 2013, “Advancements on the Simulation of the Micro Injection Moulding Process,” Proceedings of the 10th International Conference on Multi‐Material Micro Manufacture (4M), Research Publishing Services, San Sebastian, Spain, pp. 77–81. [14] Tosello, G., Gava, A., Hansen, H. N., Reinecke, H., Lucchetta, G., and Schoth, A., 2009, “Experimental validation of micro molding simulations using different process setting conditions,” Proceedings of the 67th Annual Technical Conference of the Society of Plastics Engineers 2009 (ANTEC 2009), Society of Plastics Engineers (SPE), Chigago, IL, USA, pp. 1787–1793. [15] Nguyen‐Chung, T., Loser, C., Jüttner, G., Pham, T., Obadal, M., and Gehde, M., 2011, “Simulation of the micro‐injection moulding process: effect of the thermo‐
44
rheological status on the morphology,” Proc. Inst. Mech. Eng. Part E J. Process Mech. Eng., 225(4), pp. 224–238. [16] Chen, L., Kietzmann, C., Astbury, D., and Shao, L., 2014, “Advanced cooling simulation technologies for the injection molding process,” p. 8. [17] Islam, A., Giannekas, N., Marhöfer, D. M., Tosello, G., and Hansen, H. N., 2016, “Experimental investigation of comparative process capabilities of metal and ceramic injection moulding for precision applications,” J. Micro Nano‐Manufacturing, 4(September), p. 031003. [18] Drummer, D., and Messingschlager, S., 2014, “Ceramic injection molding material analysis, modeling and injection molding simulation,” Proceedings of the 29th International Conference of the Polymer Processing Society (PPS‐29), AIP Publishing, pp. 582–586. [19] Yunn, H. S., Muhamad, N., and Sulong, A. B., 2011, “Micro Powder Injection Molding (µPIM): Review,” Appl. Mech. Mater., 52‐54, pp. 91–96. [20] Kennedy, P., and Zheng, R., 2013, Flow Analysis of Injection Molds, Carl Hanser Verlag, Munich. [21] Osswald, T. A., and Rudolph, N., 2014, Polymer Rheology, Carl Hanser Verlag, Munich. [22] Schramm, G., 1994, A Practical Approach to Rheology and Rheometry, Gebrueder HAAKE, Karlsruhe, Germany. [23] Reher, E.‐O., 2000, “Zur Rheologie von Polymerschmelzen,” Sitzungsberichte der Leibniz‐Sozietät, 43, pp. 5–23. [24] Dealy, J. M., and Wang, J., 2013, Melt Rheology and its Applications in the Plastics Industry, Springer Science+Business Media, Dordrecht, The Netherlands. [25] Göttfert, A., Reher, E.‐O., and Balagula, I. M., 2000, “Kapillarrheometer für die Kunststoffverarbeitung. Simulation rheologischer Prozesse,” KGK Kautschuk Gummi Kunststoffe, 53(9), pp. 512–517. [26] Autodesk, 2015, “Autodesk Simulation Moldflow Insight®.” [27] Kowalski, L., and Duszczyk, J., 1999, “Specific heat of metal powder‐polymer feedstock for powder injection molding,” J. Mater. Sci. Lett., 18, pp. 1417–1420. [28] Kate, K. H., Onbattuvelli, V. P., Enneti, R. K., Lee, S. W., Park, S. J., and Atre, S. V., 2012, “Measurements of Powder–Polymer Mixture Properties and Their Use in Powder Injection Molding Simulations for Aluminum Nitride,” JOM (The J. Miner. Met. Mater. Soc., 64(9), pp. 1048–1058. [29] Martin, R., Vick, M., Kelly, M., de Souza, J. P., Enneti, R. K., and Atre, S. V., 2013, “Powder injection molding of a mullite–zirconia composite,” J. Mater. Res. Technol., 2(3), pp. 263–268. [30] Lenz, J., Enneti, R. K., Onbattuvelli, V. P., Kate, K. H., Martin, R., and Atre, S. V., 2012, “Powder Injection Molding of Ceramic Engine Components for Transportation,” JOM (The J. Miner. Met. Mater. Soc., 64(3), pp. 388–392. [31] Kate, K. H., Enneti, R. K., Onbattuvelli, V. P., and Atre, S. V., 2013, “Feedstock properties and injection molding simulations of bimodal mixtures of nanoscale and microscale aluminum nitride,” Ceram. Int., 39(6), pp. 6887–6897.
45
[32] AMETEK Specialty Metal Products, “17‐4 PH: The Workhorse of Precipitation‐Hardening Stainless Steels.” [33] Maxon Motor, 2010, “Innovative CIM / MIM Komponenten,” p. 5. [34] Deutsche Edelstahlwerke, 2015, “Acidur 4542 – Werkstoffdatenblatt X5CrNiCuNb16‐4 1.4542,” p. 6. [35] International Organization for Standardization, 2008, “ISO 22007‐2:2008 — Plastics — Determination of thermal conductivity and thermal diffusivity — Part 2: Transient plane heat source (hot disc) method.” [36] Netzsch‐Gerätebau, 2013, “Laser Flash Analysis ‐‐ LFA (LFA427).” [37] Lobo, H., and Cohen, C., 1990, “Measurement of thermal conductivity of polymer melts by the line‐source method,” Polym. Eng. Sci., 30(2), pp. 65–70. [38] Roos, E., and Maile, K., 2008, Werkstoffkunde für Ingenieure – Grundlagen, Anwendung, Prüfung, Springer‐Verlag, Berlin. [39] BASF SE, 2008, “Catamold® TZP‐A – Data sheet, Processing Instructions, Product Specification.” [40] Lü, L., Fuh, J. Y. H., and Wong, Y.‐S., 2013, Laser‐Induced Materials and Processes for Rapid Prototyping, Springer Science+Business Media, New York. [41] Wolfmeier, U., Schmidt, H., Heinrichs, F.‐L., Michalczyk, G., Payer, W., Dietsche, W., Boehlke, K., Hohner, G., and Wildgruber, J., 2012, “Waxes,” Ullmann’s Encyclopedia of Industrial Chemistry, Wiley‐VCH Verlag, Weinheim, Germany, pp. 111–172.