Embed Size (px)
Citation preview
Manuscript Non-linear relationship between financial development, economic growth and
growth volatility: evidence from Nigeria. By
1. Oro Ufuo Oro; Wits Business School, University of the Witwatersrand, Johannesburg, South Africa, [email protected]; and
2. Paul Alagidede; Wits Business School, University of the Witwatersrand, Johannesburg, South Africa. [email protected]
2.1 Introduction
This study investigates the nature of the relationship between financial development
(FD), economic growth (EG) and growth volatility (EGV). Currently, literature has seen
this relationship as being monotonic, non-monotonic, U-shaped, or inverted U-shaped.
Extant literature maintains that the relationship between the variables depends on the
level of economic development while others are living in denial of the fact that
relationships do exist between the variables. In providing insight into the nature of the
relationship between the variables, many relevant questions have been asked and
answered. For example (King & Levine, 1993a; 1993b and Levine, 1997; 2002; 2005) believe
and empirically demonstrate that financial system or more precisely financial
development positively influence economic growth. Yeh & Lin (2013) and Demirgüç-
Kunt, Feyen, & Levine (2013) answered some questions pertaining to the relationship that
exist between financial structure and economic growth. However, some relevant
questions are yet to be answered.
Preprints (www.preprints.org) | NOT PEER-REVIEWED | Posted: 5 July 2018 doi:10.20944/preprints201807.0087.v1
© 2018 by the author(s). Distributed under a Creative Commons CC BY license.
Incidentally, research has not so far dealt conclusively with why these relationships move
from positive(negative) to zero and from zero to negative(positive) over time.
Additionally, although a good chunk of research has investigated the link between FD
and EG in the advance economies, far less is known about these relationships in
developing countries. The research gap in establishing the nature of the relationship
between these important macroeconomic variables is keeping researchers and
policymakers from knowing how to influence policy reforms to bring about sustainable
economic growth in developing economies. Developed economies are markedly different
from the economies of developing countries in structure, institutions and the way they
respond to various shocks. While the financial markets in the advanced countries are big,
developed, liquid and complete, those of the developing economies are small,
developing, illiquid and largely incomplete. Financial intermediation therefore, in the
advanced and the developing economies is expected to be different and the effect of FD
on growth is also expected to be more impactful in the advanced economies than in
developing countries.
Unfortunately, there is dearth of research investigating finance-growth relationships in
developing economies. Where such research exists, their conclusions are inconsistent and
ambiguous. For example, Atindehou, Gueyie and Amenounve (2005) studied West
African countries and found that neither finance explains growth nor growth explains
finance. They attributed such phenomenon to the existence of a very large informal
Preprints (www.preprints.org) | NOT PEER-REVIEWED | Posted: 5 July 2018 doi:10.20944/preprints201807.0087.v1
economic sector in the region. In the other studies, where data are taken from Nigeria,
Akpan, Nwosu and Eweke (2017) found a positive relationship between finance and
growth but Nkoro and Uko (2013) reported a negative relationship between the two
variables. This inconsistency suggests the need to re-examine the relationship between
finance and growth in the context of developing countries with the aim of reaching a
more stable conclusion. Besides, most of the research on finance/growth relationship in
developing countries use cross-countries and panel data. This study avoids heterogeneity
problems in cross-country and panel data parameters and adjustment dynamics
uncovered by Luintel et al. (2008) and Arestis et al. (2010) by using time series data of
Nigeria.
This study intends to fill the gaps of inconsistent conclusions and inappropriate data
type by investigating the nature of the relationship between measures of financial
development, first with economic growth, and then with growth volatility. Then how
important is our research intervention? Knowing how FD relates with EG and EGV
provides critical inputs to policy makers on reforms capable of answering growth
questions. For example, if the relationship is found to be linear, policy effort could be to
increase the finance sector while maintaining the existing financial structure. If the
relationship is inverted U-shaped, and financial deepening is isolated as the cause of the
threshold as reported by Sahay et al (2015), then policy effort could be to improve
financial market efficiency and access to the market services. Doing these would
Preprints (www.preprints.org) | NOT PEER-REVIEWED | Posted: 5 July 2018 doi:10.20944/preprints201807.0087.v1
complement the already confirmed high financial deepening and its positive influence
on growth or growth volatility. Knowing therefore, the nature of the relationship between
the two variables is important.
This study will also attempt to identify channels or sources of non-linearity effects in the
two relationships. Identifying these channels is important because of their economic
policy relevance. Research conclusions that throw light on the role of finance in economic
growth could shape future policy-oriented research. Furthermore, information on the
nature of the relationship between finance and growth would influence the priority that
policy makers attach to growth-oriented financial sector policies (Levine, Loayza, & Beck,
2000). Additionally, empirically-supported research evidence that financial development
supports long-term economic growth will provoke urgent need to research on various
determinants of financial development. These issues, in addition, underscore the
motivation for this study.
The remainder of this paper continues first with the background to the study. This will
be followed by a brief review of literature on what has been done to see what still needs
to be done in this area of investigation. Next section examines data, variables and
methodologies to be adopted in the study. This will be followed by the discussion of the
results of the empirical analysis. The paper will end with the conclusions drawn based
on the findings and recommendations for policy consideration.
Preprints (www.preprints.org) | NOT PEER-REVIEWED | Posted: 5 July 2018 doi:10.20944/preprints201807.0087.v1
2.1.1 Background
This study is a part of a long search for theories to explain both the determinants of
economic growth and the differences in growth rates among nations. Academic
investigation to explain growth and growth differences among nations underscore the
activities of even the classical economists. In the early 1990s these enquiries took a
different turn with the work of King and Levine (1993b). In this epoch-making
publication, Levine (1993b), standing on the shoulders of the then renown economists
such as Schumpeter (1911), Gurley and Shaw (1955), Goldsmith (1969) and McKinnon
(1973), postulated that various measures of financial development strongly associate with
GDP growth. These early research including those of Bencivenga and Smith (1991) ;
Greenwood and Jovanovic (1990); King & Levine (1993a), modeled FD – growth as linear
relationship. The linear FD/growth relationship became the dominant view in the subject
area in the past three decades.
Things were soon to change, no thanks to the global financial crisis of 2008. Researchers
(Arcand, Berkes, & Panizza, 2015; Cecchetti & Kharroubi, 2012b); Rousseau and Wachtel
(2011) began to see the possibility of a limit of influence of FD on the economic growth.
This commenced the era of modeling FD – growth relationship as a non-monotonic
function and the birth of the phrase “too much finance” and the “vanishing effect of
finance” on growth. Arcand, Berkes and Panizza (2015) and a few other after them
demonstrate that FD – growth relationship mediates a threshold, which is indicated by a
Preprints (www.preprints.org) | NOT PEER-REVIEWED | Posted: 5 July 2018 doi:10.20944/preprints201807.0087.v1
change in the sign of their elasticity from positive (negative) to negative (positive) making
it either an inverted U-shaped or a U-shaped function. This assertion has been confirmed
by recent research including Sahay, Cihak, N’Diaye, Barajas, Ayala, Gao, Kyobe, Nguyen,
Saborowski, Svirydzenka & Yousefi (2015).
In a similar line of thinking, Easterly et al (2001) show that FD also has a nonlinear
relationship with growth volatility. According to the authors, the relationship is a U-
shaped function, implying that increase in FD dampens growth volatility up to a point
then it begins to amplify it. This claim had been confirmed by Dabla-Norris and Srivisal
(2013) and Sahay et al (2015). These varying conclusions and the dearth of research in
verifying data from developing countries become the motivation for our study.
In summary, we want to establish the nature of the relationship between FD and
economic growth in Nigeria. Secondly, we want to confirm the direction in which FD
affect growth volatility. We want to examine the theoretical explanation for the “too much
finance” phenomenon. We also want to discuss the policy implications of these
relationships. In the following sections, we examine literature on the state of investigation
on the FD/growth/growth volatility relationships.
2.2 Literature review
This section reviews existing literature on issues relating to the questions to be addressed
in this study. The review has three broad objectives namely: to describe the research
Preprints (www.preprints.org) | NOT PEER-REVIEWED | Posted: 5 July 2018 doi:10.20944/preprints201807.0087.v1
context, to provide the insight necessary to understand the research questions or
hypothesis, and lastly to place the research questions or hypothesis in the context of the
past research findings and in theories. The section is organized as follows: the next
paragraphs discuss the theoretical framework linking finance to growth and growth
volatility; this is followed by the examination of the empirical literature that tested the
claims about these relationships.
2.2.1 The relationship between finance and growth: theoretical literature
Literature on the finance-growth relationship is traced back to the early twentieth century
with the initial influential paper of Schumpeter (1911). In his article, Schumpeter
highlighted the need for financial institutions to finance productive investments and
innovation to bring about economic growth. Patrick (1966) laid a foundation for
understanding the link between financial development and economic growth. Patrick
asserted that FD is connected to real output when financial assets and liabilities are
connected to the real capital stock – its optimal consumption, rate of growth, its efficient
allocation and utilization. He maintains that the relationship between capital stock and
real output is strong, direct and monotonic. Patrick’s research was supported by Gurley
and Shaw (1955) and Goldsmith (1969) who re-echoed that more developed financial
markets promote economic growth by mobilizing savings to finance the most profitable
investments.
Preprints (www.preprints.org) | NOT PEER-REVIEWED | Posted: 5 July 2018 doi:10.20944/preprints201807.0087.v1
McKinnon (1973) and Shaw (1973) in their contributions were concerned about financial
repression especially in the developing countries. They argued that pervasive financial
regulations involving interest rate ceilings and stringent reserve requirements would
impede intermediation and frustrate economic growth. The authors therefore,
recommend financial liberalization that would lead to increase in loanable funds and a
more efficient allocation of the available investible funds.
In the 1980s and early 1990s, there was a new wave of interest in the relationship between
FD and economic growth. This interest was driven by the emergence of endogenous
growth theory credited to Lucas Jr (1988) and Romer (1988). These authors posit that
financial development bolster economic growth through savings mobilization, efficient
allocation of resources, reduction in information, transaction and monitoring costs,
diversification of risks, and facilitation of exchanges of goods and services. They conclude
that these services of the financial sector would transmit into more rapid accumulation
of physical and human capital as well as faster technological progress that are needed to
boost economic growth. This position in the finance – growth argument was supported
by Greenwood and Jovanovic (1990) who argue that these services mentioned in the
Lucas (1988) and Romer (1986) are provided by financial intermediaries who promote
investment and growth by ensuring high rates of returns on capital. Greenwood and
Jovanovic (1990) also show that the financial intermediation/growth process is self-
sustaining because while intermediation spurs growth, growth also promotes the
Preprints (www.preprints.org) | NOT PEER-REVIEWED | Posted: 5 July 2018 doi:10.20944/preprints201807.0087.v1
development of financial institutions. Bencivenga and Smith (1991)’s contribution in the
argument was that the financial intermediaries do not only support investment and
growth, they also help individuals to hold diversified portfolios to manage risks and
bring their investment to the level of their liquidity preferences.
2.2.2 The relationship between finance and growth: empirical literature
Formal empirical work investigating the relationship between FD and economic growth
is associated with the works of King & Levine (1993a, b, c); Levine (1997); Levine and
Zervos (1998); Rajan and Zingales (1996); and Beck, Demirguc-Kunt, and Levine (2004).
These authors, influenced by the works of Schumpeter, and the endogenous growth
theory of Romer (1988) and Lucas (1988), empirically demonstrated that there is a positive
and long-run association between the indicators of financial development and economic
growth. They generally believe that a well-developed financial market is growth-
enhancing, and agree with the assertion of “more finance, more growth”. This linear-
function of FD/growth relationship dominated the thinking of researchers until after the
2008 financial crisis. After the crisis, researchers began to imagine the possibilities of
threshold(s) in the FD/economic growth relationship. This thinking drives a non-linear
modeling technique for FD/growth relationship which has gained popularity in the
recent literature.
However, a few studies on finance – growth nexus hold contrary opinions to those of the
linear paradigm. They believe that the relationship between finance and growth is non-
Preprints (www.preprints.org) | NOT PEER-REVIEWED | Posted: 5 July 2018 doi:10.20944/preprints201807.0087.v1
monotonic. Arcand, Berkes & Panizza (2015) and Cecchetti and Kharroubi (2012a) were
among the first to formally report their contrary views on the finance – growth
relationship. It is believed that their work may have been influenced by those of Minsky
(1974), De Gregorio and Guidotti (1995), Kindleberger (1978), Singh (1997) and Rousseau
& Wachtel (2011). In explaining the non-linearity, Minsky and Kindleberger were
concerned about the increase in macroeconomic volatility which they suspected was
caused by the overly extensive financial deepening. Tobin (1984) was worried about the
misallocation of human resources away from the real sector of the economy by the excess
financial deepening which affected economic growth. Tobin (1984) believes that
expanding financial system would takes talents from the real sector slowing down output
growth. De Gregorio & Guidotti (1995) empirically show that the advanced economies
may have reached a threshold where FD no longer increase investment efficiency and
therefore constitute a drag on economic growth. A more recent Rajan (2005)’s paper
warned that a large and complicated financial system could breed or make a system
vulnerable to financial crisis and therefore inimical to economic growth. This warning
appeared to have anticipated the financial crisis of 2008 that came from the heels of
complicated mortgage financing and its derivatives.
The new findings of non-linear relationship between finance and growth had been
supported by several recent studies. For example, Arcand, Berkes & Panizza (2015a)
employ quite different estimation methods and types of data – pure cross-section, cross
Preprints (www.preprints.org) | NOT PEER-REVIEWED | Posted: 5 July 2018 doi:10.20944/preprints201807.0087.v1
country panels and industry-level data – and find that the relationship between FD and
economic growth is non-linear. Their estimated point of inflection on the Finance-growth
function is where credit to private sector reaches 80-100% of GDP. Law and Singh (2014)
using dynamic panel threshold methods on data from 87 countries over a period 1980-
2010, found that the threshold beyond which private credit no longer contribute to
growth is 88% of GDP. Panizza (2014) confirms that FD-growth relationship is non-
monotone. The author further noted that the “too much finance” result was not driven
by poor institutions, financial crisis or microeconomic volatility as were claimed by extant
research. Panizza’s comment implies that the relationship between FD and EG could be
non-linear in any economic setting notwithstanding the stage of the country’s economic
development.
In a similar argument, Sahay et al (2015) confirm that the relationship between FD and
economic growth is non-linear but the point of inflection, contrary to the conclusions of
the other researchers, is not unique. The inflection point, according Sahay et al (2015),
depends on the country’s institutions and the methods used in the analysis. This
uncertainty in the level institutional factors affecting the point of inflexion in the
FD/EG/EGV relationship has not yet been further investigated. It remains hypothetical
until empirical examination explicates the claims.
The non-monotonic function of finance/growth relationship attracted a few critics. First
is Cline (2015). Cline sees the introduction of quadratic terms in the finance-growth model
Preprints (www.preprints.org) | NOT PEER-REVIEWED | Posted: 5 July 2018 doi:10.20944/preprints201807.0087.v1
as spurious. He demonstrates that the quadratic term in the function was not unique.
According to the author, it is possible for any variable to behave the way FD does if the
variable was made a polynomial. Cournède, Denk, and Hoeller (2015) responded to
Cline’s argument by reporting a non-linear regression function of FD and growth where
quadratic term was not used in the function. The second critic has been Beck (2015). Beck
is concerned with the use of credit to private sector as a percentage of GDP to proxy FD.
According to the author, not all private credit affect investment and therefore growth as
could be assumed. Beck further argues that in the lower-middle-income countries, banks’
balance sheets are dominated by government bonds and short-term corporate loans
(recorded as credits) with a limited amount of credit going to SMEs. In the upper-middle-
income countries, another authors explain that private credit is dominated by consumer
credit in the Credit cards and as mortgage finance with only a small fraction of it going
to private firms for investment (Langfield & Pagano, 2016).
Another significant critic of the non-linear relationship of FD and growth comes from
Ketteni, Mamuneas, Stengos, and Savvides (2007). These authors see the non-linearity
conclusion of various other authors in the FD/EG/EGV relationships as spurious.
According to the Ketteni et al (2007), these authors reached their conclusions the way they
did because they never considered the conclusions of extant publications on the subject
matter. Kalaitzidakis, Mamuneas, Savvides, and Stengos (2001) and Mamuneas,
Savvides, and Stengos (2006) had demonstrated that the nonlinear relationship exists
Preprints (www.preprints.org) | NOT PEER-REVIEWED | Posted: 5 July 2018 doi:10.20944/preprints201807.0087.v1
between economic growth and two of growth’s determinants – initial income and human
capital. They further argue that when these nonlinearities between growth, initial income
and human capital are accounted for, FD and growth will exhibit linear relationship. Our
independent empirical examination of these assertions shows that growth does relate
non-linearly with FD without any influence of human capital or initial income. Further
research in this area would be very helpful.
2.2.3 The nature of finance-growth volatility relationship
The pioneering work on the nonlinear function of the FD-growth volatility is credited to
Easterly et al (2001). In their work titled “shaken and stirred: explaining growth
volatility”, the authors show that FD could dampen growth volatility up to a point and
thereafter, a further increase in FD will amplify the volatility creating a U-shaped
relationship between FD and growth volatility. A group of authors – Denizer, Iyigun, and
Owen (2002) in their contribution, analyzed a panel of 70 countries from 1956 -1998 and
found that countries with highly developed financial sector experience less fluctuation in
their real per capita output, consumption and investment growth. These authors also
assert that the way financial sector develops is important to how it dampens growth
volatility. They highlight that relative share of banks in the financial structure of the
economy and the proportion of credit to the private sector would affect the system’s
effectiveness in dampening the volatility of consumption and outputs. Other authors,
including Raddatz (2006) who contributed to the argument, explains that the financial
Preprints (www.preprints.org) | NOT PEER-REVIEWED | Posted: 5 July 2018 doi:10.20944/preprints201807.0087.v1
depth of intermediaries is important in how much FD can do. Raddatz (2006) analyses
industry data in 48 countries and found that FD dampens a large proportion of volatility
of outputs in the economic sectors that have a high liquidity needs in their operations. In
other words, if the economic sector’s operation is not liquidity dependent, FD may not be
successful in dampening growth volatility. Again, this assertion requires further
independent investigation which is outside the objects of this study.
More recently, Dabla-Norris & Srivisal (2013) using data from 110 countries from 1974-
2008 confirm the relationship between FD and growth volatility and added that the
relationship is a U-shaped function. These assertions were supported by Sahay et al (2015)
who explain that FD initially dampens growth volatility by expanding opportunities for
economic agents to effectively manage their risks; however, as financial depth intensifies,
risk increases and volatility is amplified. They conclude that financial stability of a
country depends on the depth of financial intermediation and the pace of financial
deepening. They believe that if financial intermediation intensifies, financial stability
risks would be lower; and that the faster the pace of financial deepening, the greater the
risk of financial crisis. These authors also accept the notion of “too much finance” in the
finance – volatility relationship but add that the point of inflection in the relationship
differs from country to country depending on the country’s income level, quality of
institutions, financial regulation and supervision. We conclude this section by arguing
that FD dampens volatility by smoothening consumption and investment in the initial
Preprints (www.preprints.org) | NOT PEER-REVIEWED | Posted: 5 July 2018 doi:10.20944/preprints201807.0087.v1
stage, as finance deepens, leverage is increased, risk and uncertainty crop in and output
volatility returns, making the relationship a U-shaped function. This argument is
consistent with Easterly et al (2001).
2.2.4 Explaining nonlinearity in the FD, growth and volatility relationships
The preponderance of evidence so far reviewed proves that the relationships between
financial development, economic growth and growth volatility are nonlinear. The finance
– growth relationship observed to be inverted U-shaped while finance – volatility like the
FD/EG relationship, is observed to be symmetric U-shaped function. There are two
exceptions to these conclusions of nonlinearity: first, is the argument in Ketteni et al (2007)
who believe that the relationship between FD and economic growth is linear only if the
nonlinearity in the relationships between economic growth and the initial income and
human capital are considered. Secondly, Adeniyi, Oyinlola, Omisakin & Egwaikhide
(2015), using data from Nigeria from 1960-2010, found that the actual relationship
between FD and economic growth is U-shaped.
Theoretical explanation for these nonlinear FD-growth-volatility relationships is still
evolving. This section examines the latest attempts in the literature to account for them.
Tobin (1984) is associated with the earliest thought on the “to much finance” dilemma.
Tobin highlighted the issue of resources misallocation that results from an oversize
financial sector. According to Tobin, skill labor would be attracted away from the real
production sector by finance sector as it expands in depth and complexity. He
Preprints (www.preprints.org) | NOT PEER-REVIEWED | Posted: 5 July 2018 doi:10.20944/preprints201807.0087.v1
recommended transaction tax that came to be known as “Tobin tax” to discourage
investors from using financial instruments for pure speculation. Tobin’s argument was
upheld in Dabla-Norris & Srivisal (2013) and Cecchetti & Kharroubi (2013). In their paper,
Cecchetti and Kharroubi (2013) empirically demonstrate that growth of financial sector
causes skilled manpower to be moved from the real sector to finance, reducing aggregate
productivity of the sector and therefore growth. The authors further explain that financial
sector’s growth disproportionally hurts liquidity-dependent and R & D1 intensive
industries. Cecchetti and Kharroubi also link increase in the financial sector to decrease
in total factor productivity in the real sector. According to the authors, financial sector
expansion tends to benefit high collateral but low productivity projects, and this affects
growth.
In another spirited argument, Beck, Degryse, and Kneer (2014) demonstrate that the
expansion in finance does not necessarily amount to expansion of intermediation. They
tested economic growth against the size of FD and against intermediation measured by
credit to private sector enterprises. The authors conclude that the size of FD does not
correlate with growth when intermediation in accounted for in the model. They further
argue that it is only the part of financial development devoted to intermediation that
promote economic growth, the other part of the FD that goes to providing public services
1 Research and development
Preprints (www.preprints.org) | NOT PEER-REVIEWED | Posted: 5 July 2018 doi:10.20944/preprints201807.0087.v1
such as the provision of access to basic payment and transaction services does not affect
growth. These authors report that financial institutions, because they focus increasingly
on proprietary trading, market making, and the provision of advisory services, insurance,
and other non-interest income - generating activities do less of intermediation. These non-
intermediation activities support a little or no economic growth. In another argument,
Beck (2015) show that credit to private sector used as proxy for FD has less impact on
growth because part of these credit goes to finance consumption rather than investment.
Private credit, according to the author, consist of mortgage finance, in some countries,
and mortgage finance is principally consumer- finance and has very little impact on
growth.
Another credible explanation to the nonlinear relationship between finance and growth
is that of Gong, Greiner, and Semmler (2015). These authors, using a neoclassical growth
model with externality made popular by Paul Michael Romer (1989), argue that increase
in physical capital that comes with new technology, is associated with positive externality
in the form of new knowledge stock. Such investment, according to Paul M Romer (1986),
will raise production possibilities function for the investors and still leave positive effects
on the aggregate economic variables. The argument of positive externality of investment
is supported by Jorgenson, Gollop, and Fraumeni (2016), and Greenwood, Hercowitz,
and Krusell (1997). Jorgenson and Greenwood and their friends maintain that investment
in physical capital has a larger influence on economic growth than is suggested by the
Preprints (www.preprints.org) | NOT PEER-REVIEWED | Posted: 5 July 2018 doi:10.20944/preprints201807.0087.v1
factor share. The investment, according to the authors, does not only affect the stock of
physical capital but raises intangible capital stock (new knowledge) such that the social
returns of the investment become larger than the private returns.
Gong et al (2015) provided a link between the externality argument and zero or negative
growth by highlighting the concept of social capabilities which is credited to Abramovitz
(1994). Abramovitz summarized his argument under social capabilities and concludes
that without it countries would be unable to experience economic growth even if there is
positive investment stock. He defines social capabilities as the technical competence that
enables countries to adopt new technologies, modern production methods and operate
them to achieve economic growth. The social capabilities are accumulated through
formal education and the evolution of technologies (Gong et al (2015).
In the same line of argument, Jorgenson, Gollop & Fraumeni (2016) demonstrate that
countries with a low stock of physical capital but a relatively large stock of knowledge
capital would experience a very large marginal product of physical capital and therefore
economic growth. Japan and Germany were cited as an example of countries with such
credentials. These countries lost large amount of their physical capital during the world
wars (Kusago,2007; Carlin,1996), but had a tremendous stock of knowledge that help
their economies to grow back at an average of 9% between 1955 and 1975. In summary,
Gong et al (2015) believe that increase in investment in physical capital that does not
generate knowledge capital, and where this knowledge is generated and there are no
Preprints (www.preprints.org) | NOT PEER-REVIEWED | Posted: 5 July 2018 doi:10.20944/preprints201807.0087.v1
social capabilities to adopt them, will result in diminishing returns to physical capital and
therefore decrease or stagnation in economic growth.
2.3 Data and methodology
2.3.1 Data description
This study uses time-series data of Nigeria from 1970 to 2015. Nigeria is important here
because it is a good example of resource-dependent and undiversified - developing
economy. A resource-dependent economy without effective macroeconomic
management policies is expected to experience volatile growth. The choice of the period
– 1970 to 2015 allows us to examine the behavior of the finance/growth relationship in
both the period of increased oil prices of 1973 (OPEC, and Suez-canal closure related) and
the oil price collapse of 1980s. It also allows us to see the influence of finance on growth
subject to political instabilities in the country. There had been military take-over of
government in 1975, political transition in 1979, military coup in 1983 and 1985, political
disturbance in 1993 after election cancellation, and several turbulent democratic political
transitions before 2015.
To examine the dynamic relationship between financial development and economic
growth in one hand and financial development and growth volatility on the other, the
dependent variables are economic growth and economic growth volatility. Economic
growth is measured by the growth rate of per capita GDP. Economic growth volatility is
Preprints (www.preprints.org) | NOT PEER-REVIEWED | Posted: 5 July 2018 doi:10.20944/preprints201807.0087.v1
measured by exponential weighted moving average (EWMA) of the growth rate of per
capita GDP used in Koop and Korobilis (2014). We use EWMA because we believe that
countries’ economic output grows or declines exponentially over time (Pritchett, 2000).
Our per capital growth rate of GDP figure comes from the World Development Index
(WDI) and the GDP volatility is computed from that data.
For financial development, we use bank credit to private sector as a percentage of GDP
and the data comes from WDI. Additionally, we use the newly compiled composite index
of financial development (FD) from IMF databank for robust check. FD is made up of
market index (MI) and bank index (BI). MI is further divided into the market depth index,
market access index and market efficiency index. Similarly, BI is made up of bank and
other financial institutions depth index, access index and efficiency index. Our control
variables are the broad set of variables typically used in growth literature (Samargandi,
Fidrmuc, & Ghosh, 2015). They comprise gross fixed capital formation (GFCF), which
represents total investment in physical capital; population growth (POPG), which
indicates growth in the labor force; trade to GDP (TGDP), which represents trade
openness to international markets; government expenditure as percentage of GDP
(GEXGDP), which captures public spending and also a distortion through taxation;
consumer price index (cpi), which proxies macroeconomic policy management; initial
income per capita (INI); and school enrollment (SCH), which represents human capital
or social capability (Gong et al, 2015). These annual data for control variables are sourced
Preprints (www.preprints.org) | NOT PEER-REVIEWED | Posted: 5 July 2018 doi:10.20944/preprints201807.0087.v1
from WDI. Some of these variables were screened out because they added no effect on
the parameters of the variables of interest in the process of regression.
2.3.2 Methodology and model specification
Our methodology involves two steps. First, we investigate the potential nonlinearity in
the relationship between financial development and economic growth on one hand, and
financial development and growth volatility on the other. Where nonlinearity between
the variables are confirmed, we take a further step to investigate if the nonlinearity is
caused by FD or by the other determinants of growth such as the lag of GDP per capita
and human capital. This further investigation is informed by the argument in the Ketteni
et al (2007) to the effect that FD correlates linearly with economic growth when the
nonlinear relationships between growth and the initial GDP per capita and human capital
are accounted for.
To do the first step, we use quadratic polynomial of financial development in the model.
This technique had been used by Yeh, Huang & Lin (2013) and Arcand et al (2015).
Additionally, we use dynamic threshold estimator used in Kremer, Bick, and Nautz
(2013) to investigate the potential existence of a discrete shift in the framework. This
estimator is appropriate because macroeconomic variables such as GDP growth are
highly persistent. This is followed by testing for U and inverted U-shaped functions
technique by Lind and Mehlum (2010).
Preprints (www.preprints.org) | NOT PEER-REVIEWED | Posted: 5 July 2018 doi:10.20944/preprints201807.0087.v1
To do the second step we use semi-parametric partially linear (PLR) model. This model
is chosen because it allows for the additive semi-parametric components and the
graphical representation of the nonparametric components could be obtained which is
used to arrive at a more suitable model specification.
2.3.2.1 Quadratic polynomial of financial development
We specify the following model:
푔푑푝푔 = 푎퐹퐷 + 푏퐹퐷 + 푍 +휇 - - - - - - - - - - - - (1)
Where 푔푑푝푔 = rate of 푔푑푝 per capita growth; 퐹퐷 = financial development at time t; 퐹퐷
= quadratic term of financial development; Zt = vector of control variables; and µ = error
term 퐸( ) = 0,
Then we test the joint hypothesis:
퐻 : (푎 + 푏 퐹퐷 ≤ 0) ∪ (푎 + 푏 퐹퐷 ≥ 0) - - - - - - - - - - - - - - (2)
Against the alternative hypothesis:
퐻 :(푎 + 푏 퐹퐷 > 0) ∪ (푎 + 푏 퐹퐷 < 0) - - - - - - - - - - - - - - (3)
Where 퐹퐷 푎푛푑퐹퐷 represent the minimum and maximum values of financial
development, respectively. If the null hypothesis is rejected, it confirms the existence of
an inverted U-shape and the opposite for U-shaped is also true.
Preprints (www.preprints.org) | NOT PEER-REVIEWED | Posted: 5 July 2018 doi:10.20944/preprints201807.0087.v1
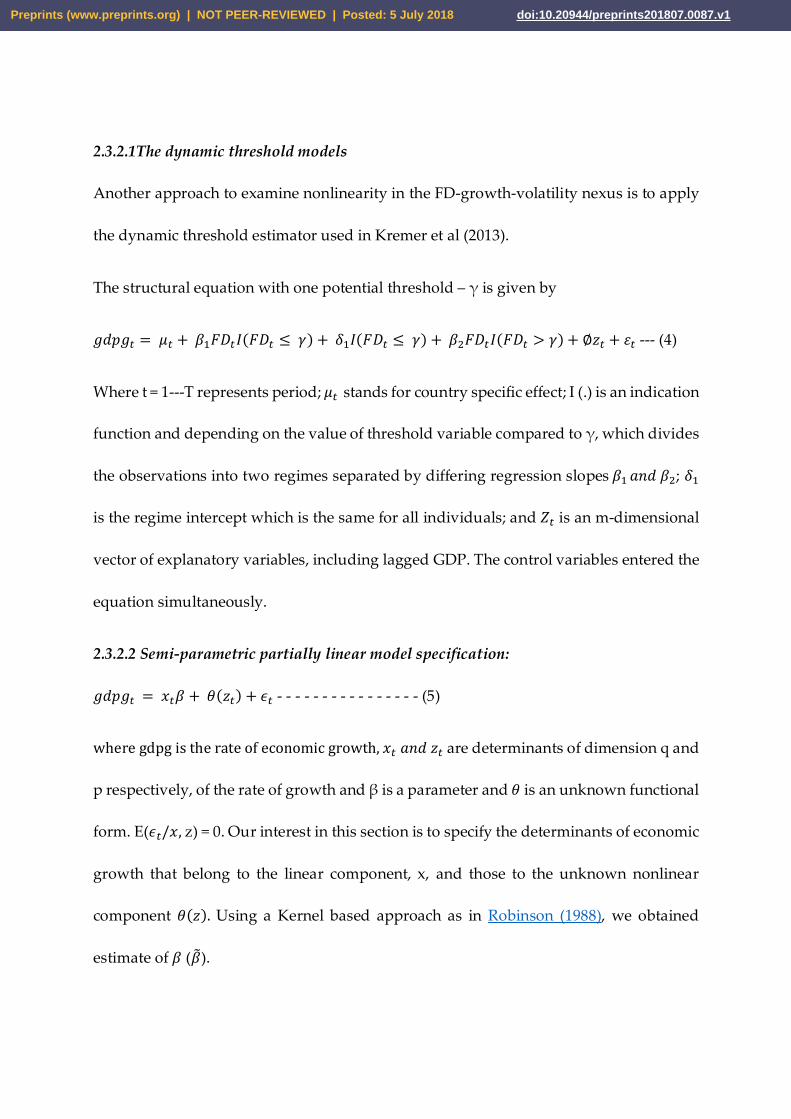
2.3.2.1The dynamic threshold models
Another approach to examine nonlinearity in the FD-growth-volatility nexus is to apply
the dynamic threshold estimator used in Kremer et al (2013).
The structural equation with one potential threshold – γ is given by
푔푑푝푔 = 휇 +훽 퐹퐷 퐼(퐹퐷 ≤ 훾) +훿 퐼(퐹퐷 ≤ 훾) +훽 퐹퐷 퐼(퐹퐷 > 훾) + ∅푧 + 휀 --- (4)
Where t = 1---T represents period; 휇 stands for country specific effect; I (.) is an indication
function and depending on the value of threshold variable compared to γ, which divides
the observations into two regimes separated by differing regression slopes훽 푎푛푑훽 ; 훿
is the regime intercept which is the same for all individuals; and 푍 is an m-dimensional
vector of explanatory variables, including lagged GDP. The control variables entered the
equation simultaneously.
2.3.2.2 Semi-parametric partially linear model specification:
푔푑푝푔 =푥 훽 + 휃(푧 ) + 휖 - - - - - - - - - - - - - - - - (5)
wheregdpgistherateofeconomicgrowth, 푥 푎푛푑푧 are determinants of dimension q and
p respectively, of the rate of growth and β is a parameter and 휃 is an unknown functional
form. E(휖 /푥,z) = 0. Our interest in this section is to specify the determinants of economic
growth that belong to the linear component, x, and those to the unknown nonlinear
component 휃(푧). Using a Kernel based approach as in Robinson (1988), we obtained
estimate of 훽 (훽).
Preprints (www.preprints.org) | NOT PEER-REVIEWED | Posted: 5 July 2018 doi:10.20944/preprints201807.0087.v1

By obtaining훽, the redefined variable 푔푑푝푔 − 푥훽 can be expressed on z
nonparametrically using kernel technique to obtain the estimate of the unknown function
θ(.). To obtain a graphical representation of the individual components of z to confirm
the non-linearity, we assume that the components of z have additive structure.
To estimate the model in (5), we allow several variables including FD, initial GDP per
capita and human capital to nonlinearly enter the model. This model is then specified
thus:
gdp푔 = 푥 훽 + 휃 푧 , 푧 ,. . . 푧 + 휀 = 푥 훽 +∑ 휃 (푧 ) +휀 - - - - - -(6)
The components of the model in (6) are estimated using marginal integration used in
Linton and Nielsen (1995).
Models analyzed for non-linearity include:
푔푑푝푝푐푔 = 푐 + {푝표푝푔 + 푔푖푛푑푒푥 } + {푐푟푒푑푝 } + ∈ - - - - - - - - - - - - - - (7)
퐸푞푢푎푡푖표푛7푐표푢푙푑푏푒푠푝푒푐푖푓푖푒푑푎푠푓표푙푙표푤푓표푟푝푢푟푝표푠푒표푓푡푒푠푡푖푛푔푓표푟푡ℎ푒푡ℎ푟푒푠ℎ표푙푑푠
Growth = ∈ + 훽 퐹퐷 퐼(퐹퐷퐷 ≤ 훾)+휕 퐼(퐹퐷 ≤ 훾) + 훽 퐹퐷 퐼(퐹퐷 > 훾)+∅푍 + 휇 - - (7a)
푔푑푝푣표푙푎 = 푏 + {푐푝푖 + 푔푖푛푑푒푥 + 푝표푝푔 }+{푙푖푓푒푥푝 + 푐푟푒푑푝 + 푔푑푝푣표푙푎(−1)}+푢 −
−− (8)
푔푑푝푝푐푔 = annual 푔푑푝per capita growth rate; 푝표푝푔 = annual growth rate of population;
푔푖푛푑푒푥 = index of political stability. It is a dummy of 0 for the years where there was civil
Preprints (www.preprints.org) | NOT PEER-REVIEWED | Posted: 5 July 2018 doi:10.20944/preprints201807.0087.v1
war, coup, national election, or political riots and 1 otherwise. 푙푖푓푒푥푝 = life expectancy
as a proxy for human capital development. Life expectancy is regularly used in growth
literature as proxy for human capital development (Lucas, 1988). 퐶푟푒푑푝 = credit by banks
to private enterprises as a percentage of gdp; 푙푖푓푒푥푝 and 퐶푟푒푑푝 are used as threshold
variables while푐푝푖 , 푔푖푛푑푒푥 , 푝표푝푔 are non-threshold variables. 퐶푝푖 = consumer price
index to proxy for inflation or macroeconomic stability and is expected have negative
relation with growth and positive relation with volatility; 푒 and 푢 represent
disturbance terms respectively in the equations. I(.) is an indicator function and
depending on the whether the threshold is greater or smaller than 훶. 훶 divides the
observations into two regimes distinguished by the changing values of
훽 푎푛푑훽 ;훿 푖푠푡ℎ푒푟푒푔푖푚푒푖푛푡푒푟푐푒푝푡푤ℎ푖푐ℎ푖푠푡ℎ푒푠푎푚푒푓표푟푎푙푙, 푎푛푑푍 is an m-
dimensional vector of explanatory variables.
2.4. Results of the empirical analysis
This section reports the descriptive statistics of the variables used in the analysis.
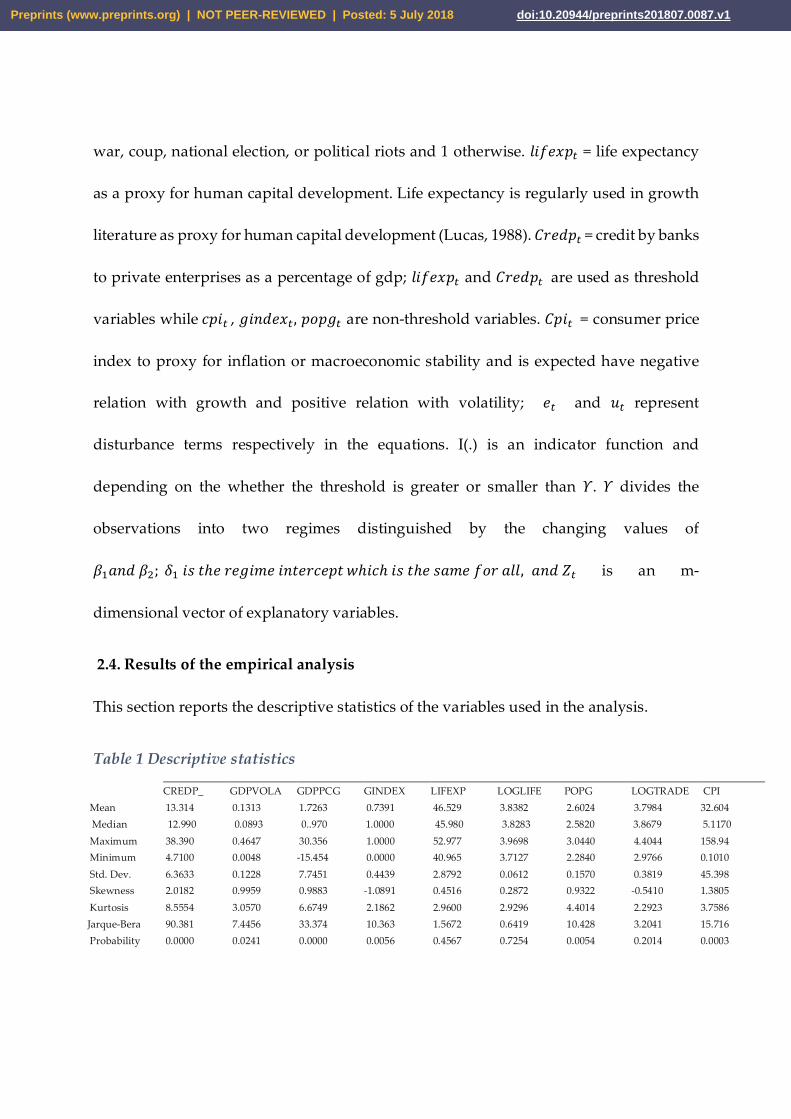
Table 1 Descriptive statistics
CREDP_ GDPVOLA GDPPCG GINDEX LIFEXP LOGLIFE POPG LOGTRADE CPI Mean 13.314 0.1313 1.7263 0.7391 46.529 3.8382 2.6024 3.7984 32.604
Median 12.990 0.0893 0..970 1.0000 45.980 3.8283 2.5820 3.8679 5.1170 Maximum 38.390 0.4647 30.356 1.0000 52.977 3.9698 3.0440 4.4044 158.94 Minimum 4.7100 0.0048 -15.454 0.0000 40.965 3.7127 2.2840 2.9766 0.1010 Std. Dev. 6.3633 0.1228 7.7451 0.4439 2.8792 0.0612 0.1570 0.3819 45.398 Skewness 2.0182 0.9959 0.9883 -1.0891 0.4516 0.2872 0.9322 -0.5410 1.3805 Kurtosis 8.5554 3.0570 6.6749 2.1862 2.9600 2.9296 4.4014 2.2923 3.7586 Jarque-Bera 90.381 7.4456 33.374 10.363 1.5672 0.6419 10.428 3.2041 15.716 Probability 0.0000 0.0241 0.0000 0.0056 0.4567 0.7254 0.0054 0.2014 0.0003
Preprints (www.preprints.org) | NOT PEER-REVIEWED | Posted: 5 July 2018 doi:10.20944/preprints201807.0087.v1
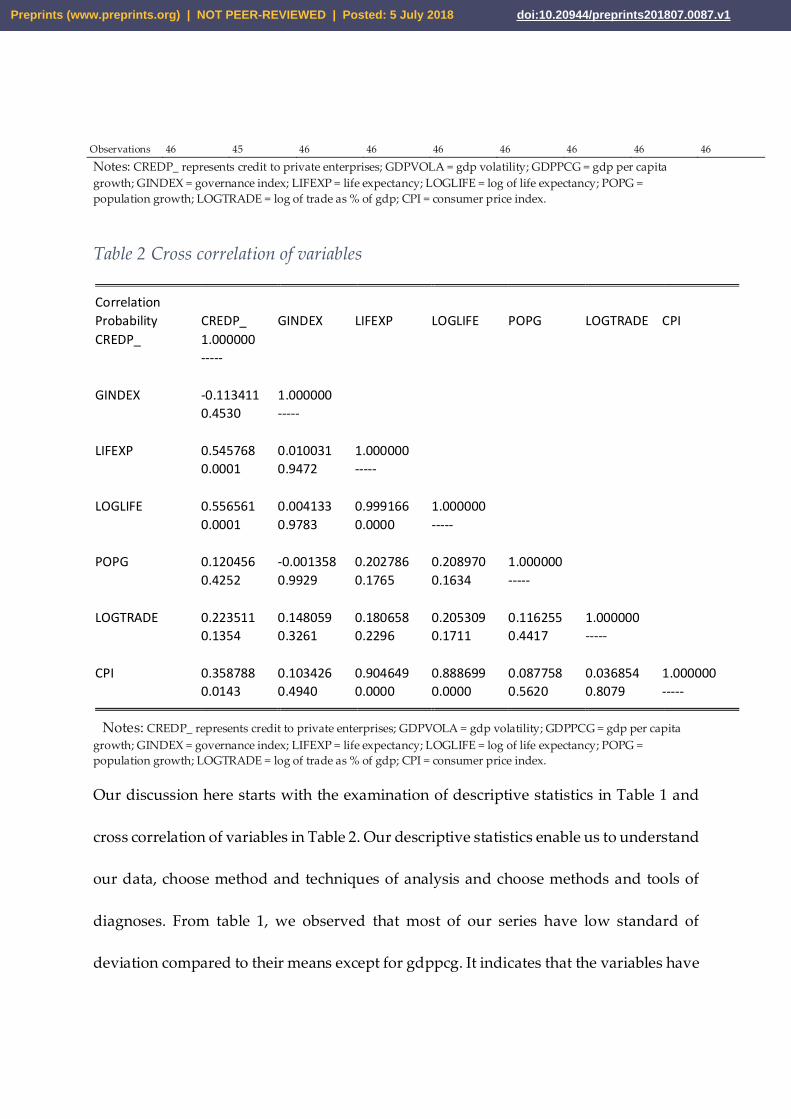
Observations 46 45 46 46 46 46 46 46 46
Notes: CREDP_ represents credit to private enterprises; GDPVOLA = gdp volatility; GDPPCG = gdp per capita growth; GINDEX = governance index; LIFEXP = life expectancy; LOGLIFE = log of life expectancy; POPG = population growth; LOGTRADE = log of trade as % of gdp; CPI = consumer price index.
Table 2 Cross correlation of variables
Correlation Probability CREDP_ GINDEX LIFEXP LOGLIFE POPG LOGTRADE CPI CREDP_ 1.000000 ----- GINDEX -0.113411 1.000000 0.4530 ----- LIFEXP 0.545768 0.010031 1.000000 0.0001 0.9472 ----- LOGLIFE 0.556561 0.004133 0.999166 1.000000 0.0001 0.9783 0.0000 ----- POPG 0.120456 -0.001358 0.202786 0.208970 1.000000 0.4252 0.9929 0.1765 0.1634 ----- LOGTRADE 0.223511 0.148059 0.180658 0.205309 0.116255 1.000000 0.1354 0.3261 0.2296 0.1711 0.4417 ----- CPI 0.358788 0.103426 0.904649 0.888699 0.087758 0.036854 1.000000 0.0143 0.4940 0.0000 0.0000 0.5620 0.8079 ----- Notes: CREDP_ represents credit to private enterprises; GDPVOLA = gdp volatility; GDPPCG = gdp per capita growth; GINDEX = governance index; LIFEXP = life expectancy; LOGLIFE = log of life expectancy; POPG = population growth; LOGTRADE = log of trade as % of gdp; CPI = consumer price index. Our discussion here starts with the examination of descriptive statistics in Table 1 and
cross correlation of variables in Table 2. Our descriptive statistics enable us to understand
our data, choose method and techniques of analysis and choose methods and tools of
diagnoses. From table 1, we observed that most of our series have low standard of
deviation compared to their means except for gdppcg. It indicates that the variables have
Preprints (www.preprints.org) | NOT PEER-REVIEWED | Posted: 5 July 2018 doi:10.20944/preprints201807.0087.v1
less than average volatility. It is also observed that most of our data are not normally
distributed judging from the value of the Jarque-Bera statistics. Linear regression would
therefore, not be suitable here. In table 2, life expectancy highly correlates with private
credit. To use the two variables in an equation simultaneously, we employ instrumental
variables.
2.4.1 Our regression results
Recall that equation 7 models the relationship between FD and economic growth. Here,
the idea is to examine the nature of the relationship between the two variables. The results
shown in Table 3 indicate that bank credit to private enterprises, used as a measure of
FD, has a U-shaped relationship with economic growth. The threshold value at the point
of inflexion in this relationship is 15.6199% which is the point of equilibrium or a point
where growth become zero even when finance was increasing. In the first regime,
financial development has a negative coefficient of -0.24092 with economic growth. In the
second regime, it has a positive coefficient of 0.5674*** and the coefficient is highly
significant at 1%. The changing signs of the coefficients from negative to positive at the
point of inflexion give us the idea of a U-shaped relationship. Governance index also
relates positively with economic growth with a coefficient of 5.1553*** and population
growth correlates negatively with a coefficient of -12.1297*** with growth.
In equation 8, we modeled the relationship between economic growth volatility and FD.
The results reported in table 4 indicate that the relationship is U-shaped. The interesting
Preprints (www.preprints.org) | NOT PEER-REVIEWED | Posted: 5 July 2018 doi:10.20944/preprints201807.0087.v1
thing in the results is that the first attempt of the analysis produced similar result as the
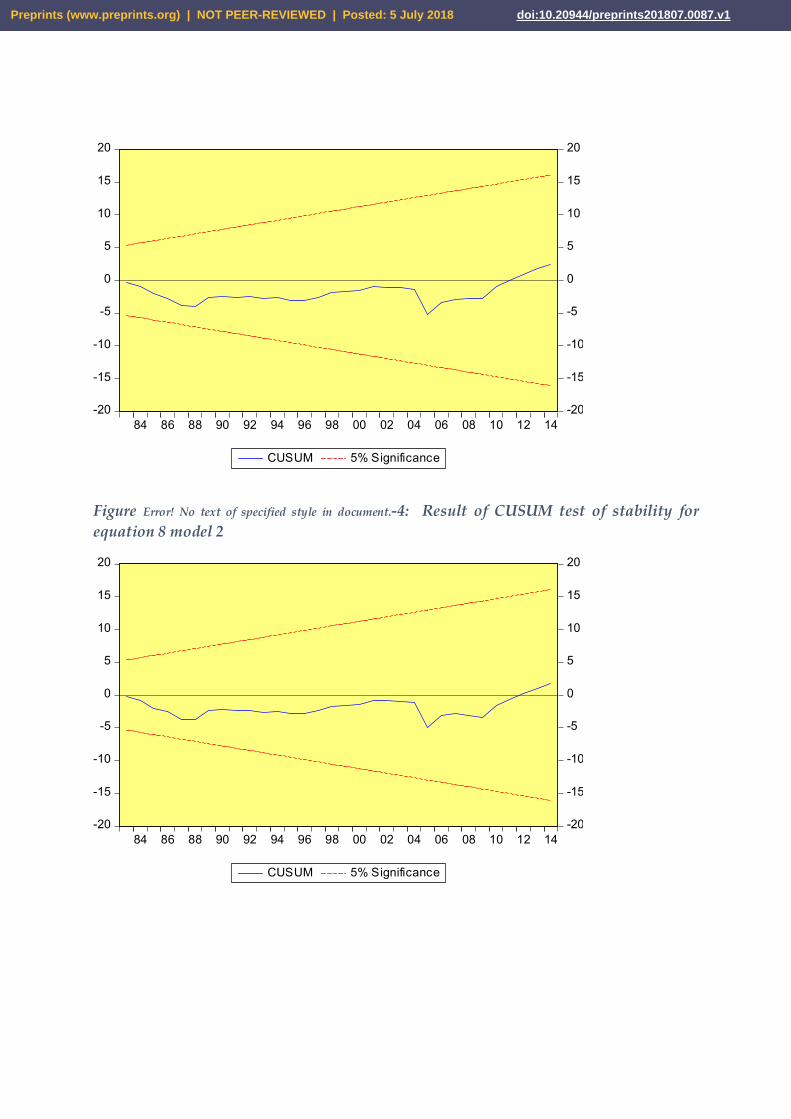
second with minor changes in the coefficients. Diagnosis of the first regression showed
that the model had endogeneity bias. We confirmed this by regressing our independent
variables against the error term. They were correlated and the model was unstable, as
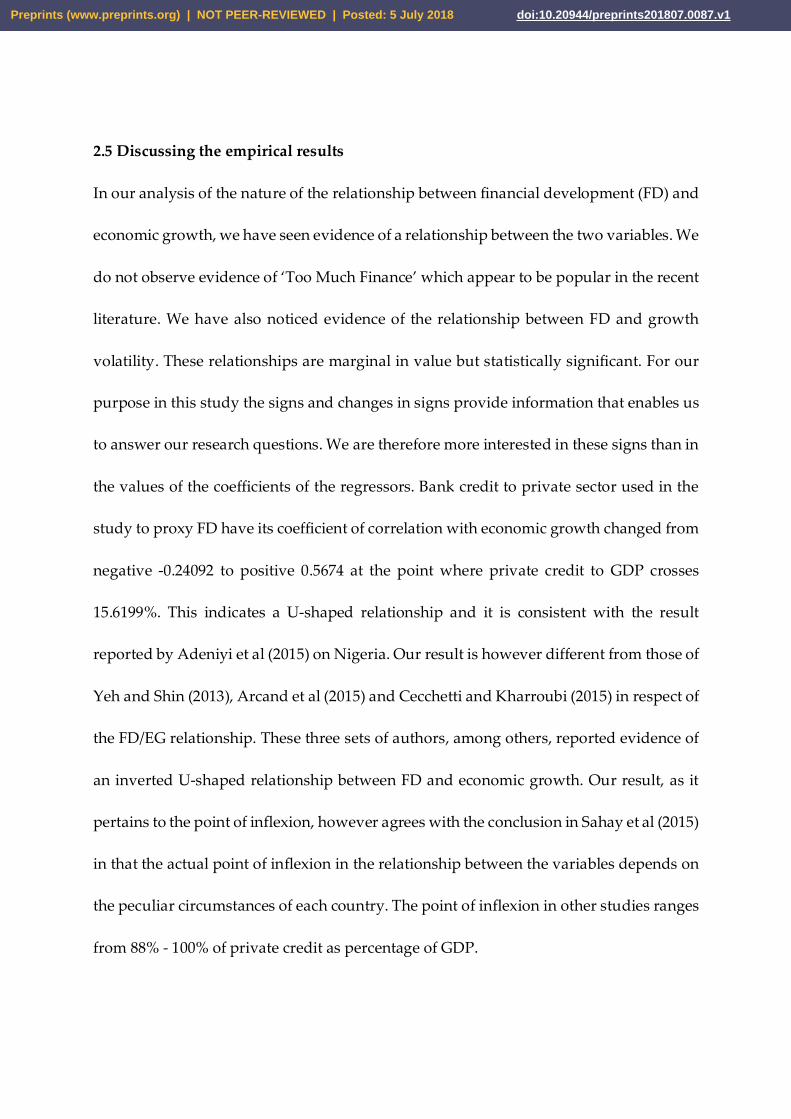
confirmed by CUSUM test. In the second regression, instrumental variable – lagged gdp
volatility was introduced. CUSUM test was done and it indicated that the model has
become stable. The result of our second attempt is recorded in table 4. According to the
results, private credit correlates negatively with gdp volatility in regime 1 with a
coefficient of -0.0045*** and with a positive coefficient of 0.000441 in regime 2. The
changing signs of the coefficients from negative to positive at the point of inflexion
indicate a U-shaped relationship.
In the same equation, log of life expectancy and the lag of gdp volatility correlate
negatively with gdp volatility with coefficients of -2.6815 and -0.0958 in regime 1
respectively. In regime 2, the lagged gdp volatility correlates positively and logged life
expectancy correlates negatively with coefficients of -0.0529 and 0.9296*** respectively
indicating that life expectancy has a U-shaped relationship with growth volatility.
2.4.2 Specification and diagnostic checks
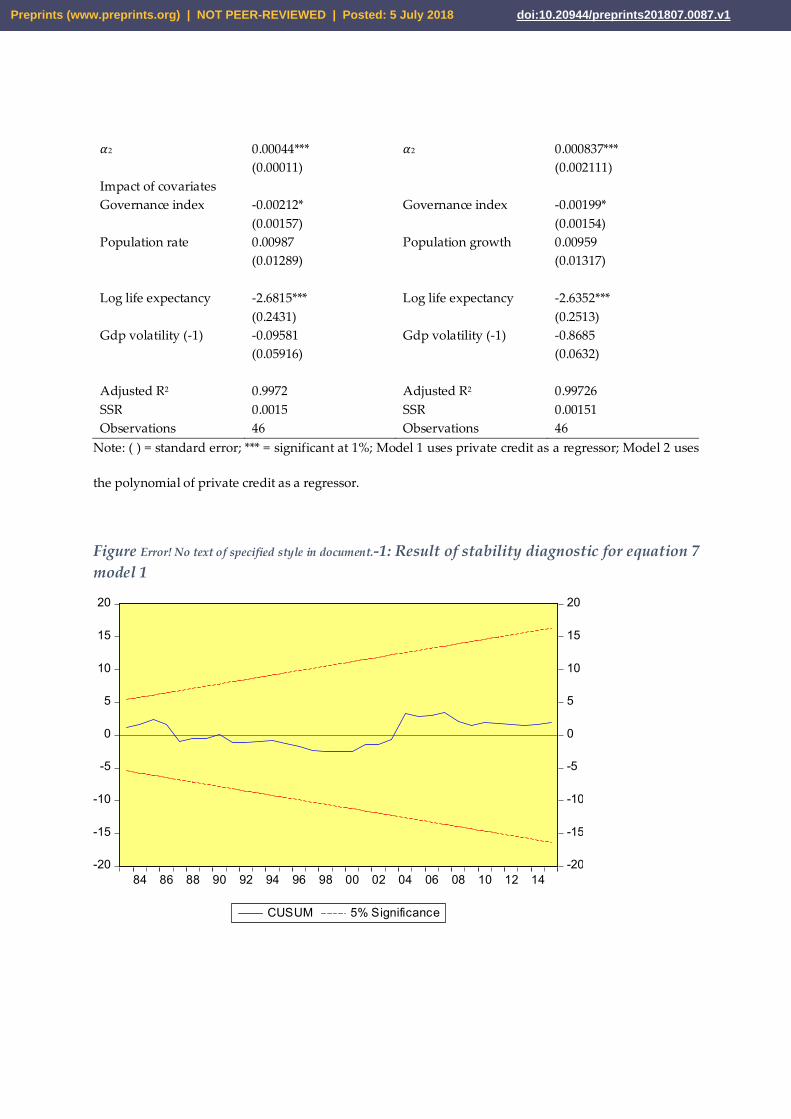
We used recursive estimation and CUSUM test to examine the stability of the models.
The results are in Figure 1 and 2 confirming that the models are stable. We tested for
serial correlation using L M test. The alternative hypothesis of serial correlation was
Preprints (www.preprints.org) | NOT PEER-REVIEWED | Posted: 5 July 2018 doi:10.20944/preprints201807.0087.v1
rejected. Coefficient diagnostic was done using the dual tests of coefficient restriction
Wald – test and Variance Inflation Factors. The H0 in the Wald test was rejected and the
result of VIF test indicates that the coefficients were not abnormally loaded. The model
selection criteria in the FD/growth /growth volatility regressions confirmed 2 regimes
with the minimum sum of square residual of 0.0015.
Table 3 Results of threshold regression analysis of equation 7
Regressors Model 1 Regressors Model 2 Threshold Value: 훶 15.6199 Threshold Value: 훶 243.984 = (15.6199)2 Impact of FD 훽1 -0.2409 훽1 -0.00904 (0.3564) (0.0168) 훽2 0.5674*** 훽2 0.01001*** (0.1552) (0.00289) Impact of covariates
Governance index 5.1553*** Governance index 5.1123*** (1.8833) (1.9215) Population rate -12.1297*** Population growth -12.4103*** (4.6794) (4.9372) Adjusted R2 0.3384 Adjusted R2 0.3271 SSR 1232.943 SSR 1216.0015 Observations 46 Observations 46
Note: ( ) = standard error; *** = significant at 1%; Model 1 uses private credit as a regressor; Model 2 uses the polynomial of private credit as a regressor.
Table 4; Results of threshold regression analysis of equation 8
Regressors Model 1 Regressors Model 2 Threshold Value: 훶 8.7099 Threshold Value: 훶 75.864 = (8.7099)2 Impact of FD 훼1 -0.0045*** 훼1 -0.00037*** (0.0008) (0.00849)
Preprints (www.preprints.org) | NOT PEER-REVIEWED | Posted: 5 July 2018 doi:10.20944/preprints201807.0087.v1
훼2 0.00044*** 훼2 0.000837*** (0.00011) (0.002111) Impact of covariates Governance index -0.00212* Governance index -0.00199* (0.00157) (0.00154) Population rate 0.00987 Population growth 0.00959 (0.01289)
(0.01317)
Log life expectancy Gdp volatility (-1)
-2.6815*** (0.2431) -0.09581 (0.05916)
Log life expectancy Gdp volatility (-1)
-2.6352*** (0.2513) -0.8685 (0.0632)
Adjusted R2 0.9972 Adjusted R2 0.99726 SSR 0.0015 SSR 0.00151 Observations 46 Observations 46
Note: ( ) = standard error; *** = significant at 1%; Model 1 uses private credit as a regressor; Model 2 uses
the polynomial of private credit as a regressor.
Figure Error! No text of specified style in document.-1: Result of stability diagnostic for equation 7 model 1
-20
-15
-10
-5
0
5
10
15
20
-20
-15
-10
-5
0
5
10
15
20
84 86 88 90 92 94 96 98 00 02 04 06 08 10 12 14
CUSUM 5% Significance
Preprints (www.preprints.org) | NOT PEER-REVIEWED | Posted: 5 July 2018 doi:10.20944/preprints201807.0087.v1
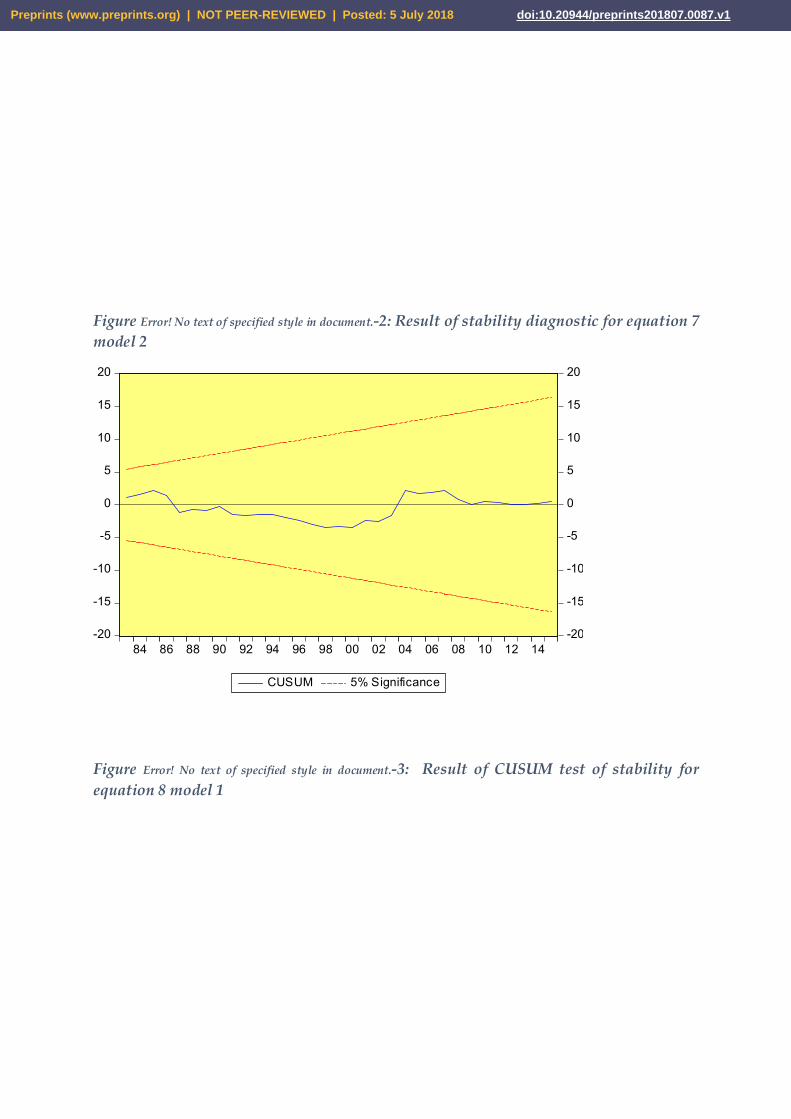
Figure Error! No text of specified style in document.-2: Result of stability diagnostic for equation 7 model 2
-20
-15
-10
-5
0
5
10
15
20
-20
-15
-10
-5
0
5
10
15
20
84 86 88 90 92 94 96 98 00 02 04 06 08 10 12 14
CUSUM 5% Significance
Figure Error! No text of specified style in document.-3: Result of CUSUM test of stability for equation 8 model 1
Preprints (www.preprints.org) | NOT PEER-REVIEWED | Posted: 5 July 2018 doi:10.20944/preprints201807.0087.v1
-20
-15
-10
-5
0
5
10
15
20
-20
-15
-10
-5
0
5
10
15
20
84 86 88 90 92 94 96 98 00 02 04 06 08 10 12 14
CUSUM 5% Significance
Figure Error! No text of specified style in document.-4: Result of CUSUM test of stability for equation 8 model 2
-20
-15
-10
-5
0
5
10
15
20
-20
-15
-10
-5
0
5
10
15
20
84 86 88 90 92 94 96 98 00 02 04 06 08 10 12 14
CUSUM 5% Significance
Preprints (www.preprints.org) | NOT PEER-REVIEWED | Posted: 5 July 2018 doi:10.20944/preprints201807.0087.v1
2.5 Discussing the empirical results
In our analysis of the nature of the relationship between financial development (FD) and
economic growth, we have seen evidence of a relationship between the two variables. We
do not observe evidence of ‘Too Much Finance’ which appear to be popular in the recent
literature. We have also noticed evidence of the relationship between FD and growth
volatility. These relationships are marginal in value but statistically significant. For our
purpose in this study the signs and changes in signs provide information that enables us
to answer our research questions. We are therefore more interested in these signs than in
the values of the coefficients of the regressors. Bank credit to private sector used in the
study to proxy FD have its coefficient of correlation with economic growth changed from
negative -0.24092 to positive 0.5674 at the point where private credit to GDP crosses
15.6199%. This indicates a U-shaped relationship and it is consistent with the result
reported by Adeniyi et al (2015) on Nigeria. Our result is however different from those of
Yeh and Shin (2013), Arcand et al (2015) and Cecchetti and Kharroubi (2015) in respect of
the FD/EG relationship. These three sets of authors, among others, reported evidence of
an inverted U-shaped relationship between FD and economic growth. Our result, as it
pertains to the point of inflexion, however agrees with the conclusion in Sahay et al (2015)
in that the actual point of inflexion in the relationship between the variables depends on
the peculiar circumstances of each country. The point of inflexion in other studies ranges
from 88% - 100% of private credit as percentage of GDP.
Preprints (www.preprints.org) | NOT PEER-REVIEWED | Posted: 5 July 2018 doi:10.20944/preprints201807.0087.v1

There appears to be a marked disparity between other countries’ average data at
inflection point (80% - 110%) and that of Nigeria (15.6199%). Consistent with the findings
in Sahay et al (2015), such disparity could be explained by the differences in institutional
and macroeconomic management qualities. According to the World Development Index
(2017), indices for the following governance measures for Nigeria for ten years up to 2015
are in most cases negative. The measures include the rule of law, governance
effectiveness, regulatory quality and political stability. Additionally, Nigeria according
to Karl (2004) is a rentier state. This is a state that lives on externally generated rents rather
than from the surplus production (through taxation) of its populace. From the above
description, a rentier state has no obligation or incentives to have in place credible
institutions and the rule of law (because it has no tax revenue expectation) which explains
why the point of inflexion in the finance/growth relationship is as low as about 16% as
compared to an average of 80 – 88% for other countries. The summary of what is unique
in Nigeria is the low quality of institutions.
It was observed that our result did not change so much after the polynomial of private
credit was used in the regression. The threshold value in the second regression was
243.984 which is approximately the square of 15.619. The signs of the coefficient changed
from -0.00904 in the first regime to 0.01008 in the second regime. In another check,
interestingly, the use of the composite index of FD in the regression did not return any
threshold effect in the relationship between the variables. The failure of the composite
Preprints (www.preprints.org) | NOT PEER-REVIEWED | Posted: 5 July 2018 doi:10.20944/preprints201807.0087.v1
index of FD to indicate any threshold effect in its relationship with economic growth most
likely signals the discrimination between financial deepening and the FD comprising
access, efficiency and depth. It confirms financial deepening as the candidate for the
threshold effect in the finance-growth relationship. Excess financial depth has severally
been reported as the source of reversal in growth after a given threshold value in Cole
(1974); Darrat (1999); Rousseau and Wachtel (2011); Cecchetti and Kharroubi (2012); and
Bhattarai (2015).
A few researches associate the negative impacts of the excess financial depth on growth
to excessive bank competition (Law and Singh, 2014). According to the authors, excessive
bank competition makes more credit available to firms but at the same time banks fail to
provide additional needed services to the firms resulting in high probability of
investment failing. Beck et al (2014) also attribute this negative effect of excess financial
deepening to a phenomenon where there is an increase in the size of financial sector with
no corresponding increase in financial intermediation. According to these authors, it is
the financial intermediation that positively influences economic growth and not just the
size of the financial sector.
The U-shaped relationship between FD and growth could be interpreted to mean that the
initial expansion in the financial sector did not seem to matter so much for growth until
FD got to a critical level and surpass it before there appear to be a positive, although
quantitatively marginal, growth effect. This quickly flags the idea that the level of FD is
Preprints (www.preprints.org) | NOT PEER-REVIEWED | Posted: 5 July 2018 doi:10.20944/preprints201807.0087.v1
important for growth. In the case of Nigeria, growth became evidenced only when FD
crosses 15.6199% of private credit to GDP. This understanding may also be useful to
explain the puzzle in the case of Fiji Island reported in (Sharma & Roca, 2012). The low
point of breaks (or equilibrium) in the FD/growth/growth volatility relationships implies
that the Nigerian economy is not able to draw maximum growth and volatility reduction
benefit from FD. Suspected reasons for this situation is a low quality of institutions earlier
identified.
Our result for equation 8 reported in Table 4 shows that FD also correlates in a U-shaped
fashion with economic growth volatility. The coefficients in this analysis change from a
negative -0.0045 to positive 0.00441 on each side of threshold value of 8.7099% of private
credit to GDP. Possible explanation for this low point of equilibrium in the case of Nigeria
as compared to other countries, and as explain elsewhere in this paper, is weak rule of
law, governance effectiveness, regulatory quality and political instability. The nature of
this relationship did not change even when we used the polynomial of credit to the
private sector in the regression. In this second regression, private credit (squared) relates
with growth volatility in a U-shaped fashion like the first regression. The coefficient of
correlation in the second regression changed from negative -0.00037 to a marginal
positive of 0.000873 around critical value of 75.864 which is the square of 8.7099. Like the
situation in equation 7, the introduction of the composite index of FD into equation 8 did
not return any threshold effect. Incidentally, our results agree with those of Easterly,
Preprints (www.preprints.org) | NOT PEER-REVIEWED | Posted: 5 July 2018 doi:10.20944/preprints201807.0087.v1
Islam, and Stiglitz (2001) and Sahay et al. (2015). According to Easterly et al (2001),
expansion in finance is connected to tempering growth volatility by smoothening
consumption and investment up to the threshold value. Beyond the threshold point, the
expansion in finance exacerbates risks and therefore growth volatility.
A further point that caught our attention in the analysis of equation 8 is that the threshold
value came too soon at 8.7099% of credit to private sector. It means that the economy is
prone to volatility as finance expands. Finance literature contains at least three
explanations to this early peak phenomenon of the threshold value in the
Finance/volatility relationship. First is the popular issue of the institutional and
regulatory weakness of the country which is believed to determine the point of inflection
in the relationship (Sahay et al, 2015). Second is what Sahay et al (2015) termed economic
fundamentals, which includes the effectiveness of macroeconomic management.
Research opines that inflation exacerbates volatility and dampens growth. In other
words, where macroeconomic policies are not effectively managed, FD may only do a
little to temper growth volatility. The third explanation for the early peak phenomenon
for threshold in the finance-growth volatility is the type of financial growth. Easterly et
al (2001) report that financial sector itself could exacerbates period of economic
downturns, particularly if debt increases relative to equity. The explanation of these
authors is that equity markets provide better risk diversification than do debt markets,
and thus make economy less vulnerable to economic downturns.
Preprints (www.preprints.org) | NOT PEER-REVIEWED | Posted: 5 July 2018 doi:10.20944/preprints201807.0087.v1
Explaining the low equilibrium in the finance/growth volatility using data from Nigeria,
the immediate call is the weak institutions. These weak institutions manifest in the low
financial market and institution efficiency and access indices published by IMF. Access
measures the opportunity for individuals and companies to access financial services
while efficiency measures the ability of financial institutions to provide services at low
cost without eroding the value of the assets. Financial market access index for Nigeria
stands at 0.006681 in 2014 from 0.000785 in 1980. This same index for Malaysia equals
0.702115 in 2014 up from 0.04584 in 1980 (Malaysia was chosen arbitrarily; Nigerian data
can be compared with any country). Similarly, the financial market efficiency index for
Nigeria stands at 0.08637 in 2014 up from 0.004011 in 1980. That of Malaysia is 0.280766
from 0.06977 in 1980 (Svirydzenka, 2016). These levels and growth rate of market access
and efficiency in Nigeria, appears to be a good reason for the low equilibrium in the
finance/growth/growth volatility relationships.
2.6 Conclusion and policy suggestions
We recall that our objectives in this study were to determine the nature of the relationship
between financial development and economic growth on one hand and FD and growth
volatility on the other. We used bank credit to private sector to proxy for FD and GDP
per capita growth for economic growth. Credit to private sector was selected to represent
FD for two reasons: it is widely used in the finance-growth literature and our research
was to confirm a few other researches on this subject using different parameters; secondly
Preprints (www.preprints.org) | NOT PEER-REVIEWED | Posted: 5 July 2018 doi:10.20944/preprints201807.0087.v1
other proxies were inadequate in giving us data that were more than thirty years. We
were interested in using a long data series. We estimated growth volatility using
exponential weighted moving average because of our understanding that most
macroeconomic variables fluctuate in exponential fashion. We used threshold model
estimator for our analysis because literature reviewed had been persuasive that finance-
growth relationship is non-monotonic. We used Nigerian data for a period between 1970
and 2015. This section concludes our study and proffer policy suggestions.
We have evidence that FD returns threshold effects with economic growth and growth
volatility in their relationships. Contrary to popular conclusions in the finance – growth
literature, our results show that FD has a U-shaped relationship with growth and a U-
shaped relationship with growth volatility. Our results in the case of finance – growth
relationship is consistent with Adeniyi et al (2015), a prior research that used Nigerian
data. In the case of finance – growth volatility relationship, our result is consistent with
both Easterly et al (2001) and Sahay et al (2015). Both results have several policy
implications.
Our result in the finance – growth analysis indicates that FD relates negatively with
growth initially until FD reaches the threshold point, and non-linearly but positively
thereafter. This signals a warning that policy-makers should not expect economic growth
from FD shocks in the initial stage of FD. Additionally, policy makers should accelerate
FD to catch up with the threshold value to experience economic growth. Next is the choice
Preprints (www.preprints.org) | NOT PEER-REVIEWED | Posted: 5 July 2018 doi:10.20944/preprints201807.0087.v1
of reforms needed to attain the desired volume of FD: Our results indicate that the
composite index of FD displays no threshold effect both with growth and growth
volatility. This shows that certain elements of the FD such as access and efficiency can
still be expanded to grow the financial sector and to reap economic growth even when
financial deepening hits the threshold. Additionally, developing countries need heavy
dosage of financial deepening in the initial stage of financial sector development to hit
the threshold quicker and begin the period of growth. For purpose of financial reforms,
effort should be made to balance financial deepening with policies to increase access to
finance and to improve the efficiency of financial products and services.
Access to financial services could be increased by a couple of ways. We discuss two of
those methods here. First is to make financial service available to small and medium
businesses (SMEs). This could be done by decentralizing capital and credit markets. The
current policy of locating capital market in a central business center of the country does
not appear to solve access to finance problem for SMEs. Several researchers have found
that stock exchange services are sensitive to spatial proximity to the locations of the
exchanges (Fafchamps and Schundeln, 2013). Independent and autonomous regional
exchange is recommended here to solve the problem. Secondly, financial innovation has
been reported as being correlated with improved access to financial services even in
developing countries (Beck, Senbet and Simbanegavi, 2015). Financial innovation is
defined here as an intentional restructuring of financial products, markets and the market
Preprints (www.preprints.org) | NOT PEER-REVIEWED | Posted: 5 July 2018 doi:10.20944/preprints201807.0087.v1

processes to make it suitable for a greater number of savers to hold financial assets and
liabilities (Allen and Santomero, 2001). Financial innovation also reduces perceived
market risks, transforms weak and non-existing markets sometimes by using
technologies (Beck, Chen, Lin and Song, 2016). The following facilities and innovations
have been found to increase access to finance in various parts of Africa. They are ATM,
M-pesa, Susu, internet banking, cell-phone banking, Islamic banking etc. In addition,
Nigeria needs to improve financial market efficiency by improving market regulation
and the rule of law. Improvement in the law regulating property rights and litigation
process will go a long way in this direction.
Policy should be adopted to address the quick peaking of threshold points in the finance
– growth and finance – growth volatility models. Taking cues from our results, capital
market development appears to be better than credit market because as explained in this
paper, equity market helps to diversify risks better than the debt counterpart. Capital
market also appears to be better in acting as circuit breaker than the bank in times of
financial crisis (Easterly et al, 2001). Furthermore, research should be extended to
identifying country specific determinants of financial sector development, and the impact
of institutions and regulations on the financial market development. Finally, this study
should be taken as an agenda-setting on the issues discussed. A more informed and
deeper analysis of issues using increased size of data, standard and emerging control
variables to ensure better results should be pursued.
Preprints (www.preprints.org) | NOT PEER-REVIEWED | Posted: 5 July 2018 doi:10.20944/preprints201807.0087.v1
2.7 References
Abramovitz, M. (1994). Catch-up and convergence in the postwar growth boom and after. Convergence of productivity: Cross-national Studies and Historical Evidence, 86-125.
Adeniyi, O., Oyinlola, A., Omisakin, O., & Egwaikhide, F. O. (2015). Financial
development and economic growth in Nigeria: Evidence from threshold modelling. Economic Analysis and Policy, 47, 11-21.
Akpan, E.S., Nwosu, E.C., and Eweke, G.O (2017). Causality between non-oil export,
financial sector development and economic growth: evidence from Nigeria. Journal of Mathematical Finance vol 7, 39-53.
Allen, F. and Santomero, A. M. (2001). What do financial intermediaries do? Journal of
Banking and Finance, 25(2), 271-294 Arcand, J. L., Berkes, E., & Panizza, U. (2015). Too much finance? Journal of Economic
Growth, 20(2), 105-148. Arestis, P.,Luintel, A.D., and Luintel K. B.(2010). Financial structure and economic
growth: evidence from time series analyses. Journal of Applied Financial Economics, 20(19), 1479-1492.
Atindehou, R. B., Gueyie, J.P.,and Amennounve, E.K. (2005). Financial intermediation
and economic growth: evidence from West Africa. Applied Financial Economics, 15(11), 777 - 790.
Beck, T. (2015). Finance and Growth–beware the measurement. VOXeu. org, Sept, www.tipnews.info/posts/3551/finance_and_Growth.
Beck, T., Degryse, H., & Kneer, C. (2014). Is more finance better? Disentangling
intermediation and size effects of financial systems. Journal of Financial Stability, 10, 50-64.
Beck, T., Demirguc-Kunt, A., & Levine, R. (2004). Law and firms' access to finance. American
Law and Economic Review, Vol 7(10. 211-252. Beck, T., Chen, T., Lin, C., and Song, F. M. (2016). Financial innovation: The bright and
and the dark sides. Journal of Banking and Finance, vol 72, 25-51
Preprints (www.preprints.org) | NOT PEER-REVIEWED | Posted: 5 July 2018 doi:10.20944/preprints201807.0087.v1
Beck, T., Senbet, L. and Simbanegavi, W.(2015). Financial inclusion and innovation in Africa: An overview. Journal of African Economies vol 24(AERC Supplement 1) 3-11
Bencivenga, V. R., & Smith, B. D. (1991). Financial intermediation and endogenous growth. The Review of Economic Studies, 58(2), 195-209. Bhattarai, K. (2015). Financial deepening and economic growth in advanced and
emerging economies. Review of Development Economics, 19(1), 178-195. Carlin, W. (1996). 15 West German growth and institutions, 1945-90. Economic growth in
Europe since 1945, Cambridge University Press, Cambridge 455. Cecchetti, S. G., & Kharroubi, E. (2012a). Reassessing the impact of finance on growth.
BIS Working Paper No.381. Cecchetti, S. G., & Kharroubi, E. (2012b). Reassessing the impact of finance on growth.
BIS Working paperNo. 381, Available at SSRM: https://ssrm.com/abstract=2117753. Cline, W. R. (2015). Too Much Finance, or Statistical Illusion? Peterson Institute for
International Economics Policy Briefs PB15-9. Cole, D. C. (1974). Financial deepening in economic development. Journal of Finance, Vol
29(4) PP 1345-1348. Cournède, B., Denk, O., & Hoeller, P. (2015). Finance and inclusive growth. OECD
Economic Policy Paper No. 14. Dabla-Norris, M. E., & Srivisal, M. N. (2013). Revisiting the link between finance and
macroeconomic volatility (Vol. working paper number wp/13/29): International Monetary Fund.
Darrat, A. F. (1999). Are financial deepening and economic growth causally related?
Another look at the evidence. International Economic Journal, 13(3), 19-35. De Gregorio, J., & Guidotti, P. E. (1995). Financial Development and Economic Growth.
World development, 23(3), 433-448. Demirgüç-Kunt, A., Feyen, E., & Levine, R. (2013). The evolving importance of banks and
securities markets. The World Bank Economic Review, 27(3), 476-490.
Preprints (www.preprints.org) | NOT PEER-REVIEWED | Posted: 5 July 2018 doi:10.20944/preprints201807.0087.v1
Denizer, C. A., Iyigun, M. F., & Owen, A. (2002). Finance and macroeconomic volatility. Contributions in Macroeconomics, 2(1), https://doi.org/10.2202/1534-6005.1048.
Easterly, W., Islam, R., & Stiglitz, J. E. (2001). Shaken and stirred: explaining growth volatility.
Paper presented at the Annual World Bank conference on development economics, Geneva Switzerland.
Goldsmith, R. W. (1969). Financial structure and development. Yale University Press, New
Haven. Gong, G., Greiner, A., & Semmler, W. (2015). The Force of Economic Growth: A Time Series
Perspective (Vol. 66). New Jersey: Princeton Press. Greenwood, J., Hercowitz, Z., & Krusell, P. (1997). Long-run implications of investment-
specific technological change. The American Economic Review, 342-362. Greenwood, J., & Jovanovic, B. (1990). Financial development, growth, and the
distribution of income. Journal of political economy, 98(5, Part 1), 1076-1107. Gurley, J. G., & Shaw, E. S. (1955). Financial aspects of economic development. The
American Economic Review, 45(4), 515-538. Jorgenson, D., Gollop, F. M., & Fraumeni, B. (2016). Productivity and US economic growth
(Vol. 169): Elsevier Science Publishing BV, North-Hollan, Amsterdam. Kalaitzidakis, P., Mamuneas, T. P., Savvides, A., & Stengos, T. (2001). Measures of human
capital and nonlinearities in economic growth. Journal of Economic Growth, 6(3), 229-254.
Ketteni, E., Mamuneas, T., Stengos, T., & Savvides, A. (2007). Is the financial development
and economic growth relationship nonlinear? Economic Buletin, Vol 15(14), PP 1-12
Kindleberger, C. P. (1978). Economic response: comparative studies in trade, finance, and
growth: Harvard University Press, Massachusetts. King, R. G., & Levine, R. (1993a). Finance and growth: Schumpeter might be right. The
Quarterly Journal of Economics, 717-737.
Preprints (www.preprints.org) | NOT PEER-REVIEWED | Posted: 5 July 2018 doi:10.20944/preprints201807.0087.v1
King, R. G., & Levine, R. (1993b). Finance, Entrepreneurship and Growth. Journal of Monetary Economics, 32(3), 513-542.
Koop, G., & Korobilis, D. (2014). A new index of financial conditions. European Economic
Review, 71, 101-116. Kremer, S., Bick, A., & Nautz, D. (2013). Inflation and growth: new evidence from a
dynamic panel threshold analysis. Empirical Economics, 44(2), 861-878. Kusago, T. (2007). Rethinking of economic growth and life satisfaction in post-WWII
Japan–A fresh approach. Social Indicators Research, 81(1), 79-102. Langfield, S., & Pagano, M. (2016). Bank bias in Europe: effects on systemic risk and
growth. Economic Policy, 31(85), 51-106. Law, S. H., & Singh, N. (2014). Does too much finance harm economic growth? Journal of
Banking & Finance, 41, 36-44. Levine, R. (1997). Financial Development and Economic Growth: Views and Agenda.
Journal of Economic Literature, 35(2), 688-726. Levine, R. (2002). Bank-based or market-based financial systems: which is better? Journal
of Financial Intermediation, 11(4), 398-428. Levine, R. (2005). Finance and growth: theory and evidence. Handbook of Economic Growth,
1, 865-934. Levine, R., Loayza, N., & Beck, T. (2000). Financial intermediation and growth: Causality
and causes. Journal of Monetary Economics, 46(1), 31-77. Levine, R., & Zervos, S. (1998). Stock markets, banks, and economic growth. American
Economic Review, 537-558. Lind, J. T., & Mehlum, H. (2010). With or without U? the Appropriate Test for a U-Shaped
Relationship. Oxford Bulletin of Economics and Statistics, 72(1), 109-118. Linton, O., & Nielsen, J. P. (1995). A kernel method of estimating structured
nonparametric regression based on marginal integration. Biometrika, 93-100.
Preprints (www.preprints.org) | NOT PEER-REVIEWED | Posted: 5 July 2018 doi:10.20944/preprints201807.0087.v1
Lucas Jr, R. E. (1988). On the mechanics of economic development. Journal of Monetary Economics, 22(1), 3-42.
Luintel, A. K., Khan, M., Arestis, P. and Theodoridis, K. (2008). Financial structure and
economic growth. Journal of Development Economics 86(1), 181-200. Mamuneas, T. P., Savvides, A., & Stengos, T. (2006). Economic development and the
return to human capital: a smooth coefficient semiparametric approach. Journal of Applied Econometrics, 21(1), 111-132.
McKinnon, R. (1973). Money and capital in Economic Development. International Journal
of Banking and Finance, 29(4), 649 - 651. Minsky, H. P. (1974). The modeling of financial instability: An introduction. Modelling and
Simulation, 5(1), 267-272. Nkoro, E and Uko, A. K (2013). Financial sector development-economic growth nexus:
empirical evidence from Nigeria. American International Journal of Contemporary Research 3(2), 87-94.
Panizza, U. (2014). Financial development and economic growth: Known knowns, known
unknowns, and unknown unknowns. Revue D'économie du Développement, 22(HS02), 35-65.
Patrick, H. T. (1966). Financial development and economic growth in underdeveloped
countries. Economic Development and Cultural Change, 14(2), 174-189. Pritchett, L. (2000). Understanding patterns of economic growth: searching for hills
among plateaus, mountains, and plains. The World Bank Economic Review, 14(2), 221-250.
Raddatz, C. (2006). Liquidity needs and vulnerability to financial underdevelopment.
Journal of Financial Economics, 80(3), 677-722. Rajan, R. G. (2005). Debt Relief and Growth. Finance and Development, 42(2), 56. Rajan, R. G., & Zingales, L. (1996). Financial dependence and growth, The American Economic
Review, 88 (3), 559 - 586
Preprints (www.preprints.org) | NOT PEER-REVIEWED | Posted: 5 July 2018 doi:10.20944/preprints201807.0087.v1
Robinson, P. M. (1988). Root-N-consistent semiparametric regression. Econometrica: Journal of the Econometric Society, 931-954.
Romer, P. M. (1986). Increasing returns and long-run growth. Journal of Political Economy,
94(5), 1002-1037. Romer, P. M. (1989). What determines the rate of growth and technological change? (Vol. 279):
World Bank Publications. Rousseau, P. L., & Wachtel, P. (2011). What is happening to the impact of financial
deepening on economic growth? Economic Inquiry, 49(1), 276-288. Sahay, R., Čihák, M., N'Diaye, P., & Barajas, A. (2015). Rethinking financial deepening:
Stability and growth in emerging markets. Revista de Economía Institucional, 17(33), 73-107.
Samargandi, N., Fidrmuc, J., & Ghosh, S. (2015). Is the relationship between financial
development and economic growth monotonic? Evidence from a sample of middle-income countries. World Development, 68, 66-81.
Schumpeter, J. A. (1911). The theory of economic development: An inquiry into profits, capital,
credit, interest, and the business cycle (Vol. 12(2)): Journal of Comparative Research in Anthropology and Sociology.
Sharma, P., & Roca, E. (2012). It is time to reexamine the role of stock markets in
developing economies. Journal of Asia-Pacific Business, 13(3), 206-228. Shaw, E. S. (1973). Financial Deepening in Economic Development. Oxford University
press, New York. Singh, A. (1997). Financial liberalisation, stockmarkets and economic development. The
Economic Journal, 107(442), 771-782. Svirydzenka, K (2016). Introducing a new-broadbase index of financial development. IMF
Working Paper 16/5. Tobin, J. (1984). On the Efficiency of Financial System, Lloyds Bank Review, julho. Yeh, C.-C., & Lin, P.-C. (2013). Financial structure on growth and volatility. Economic
Modelling, 35, 391-400.
Preprints (www.preprints.org) | NOT PEER-REVIEWED | Posted: 5 July 2018 doi:10.20944/preprints201807.0087.v1