Embed Size (px)
Citation preview
Mäori Providers: Primary health care
delivered by doctors and nurses
The National Primary Medical Care Survey (NatMedCa): 2001/02
Report 3
Sue Crengle1 Roy Lay-Yee2
Peter Davis3
with the assistance of: Alastair Scott
Peter Crampton Antony Raymont
Daniel Patrick Janet Pearson
and with the support of co-investigators: Gregor Coster
Phil Hider Marjan Kljakovic
Murray Tilyard Les Toop
1 Department of Mäori and Pacific Health, Faculty of Medical and Health
Sciences, University of Auckland 2 Centre for Health Services Research and Policy, School of Population
Health, Faculty of Medical and Health Sciences, University of Auckland 3 Department of Public Health and General Practice, Christchurch School of
Medicine and Health Sciences, University of Otago
Citation: Ministry of Health. 2004. Mäori Providers: Primary health care delivered by doctors and nurses:The National Primary Medical Care Survey (NatMedCa):
2001/02 Report 3. Wellington: Ministry of Health.
Published in June 2004 by the Ministry of Health
PO Box 5013, Wellington, New Zealand
ISBN 0-478-28277-X (Book) ISBN 0-478-28280-X (Internet)
HP 3853
This document is available on the Ministry of Health’s website: http://www.moh.govt.nz
iii
Disclaimer
The views expressed in this occasional paper are the personal views of the authors and should not be taken to represent the views or policy of the Ministry of Health or the Government. Although all reasonable steps have been taken to ensure the accuracy of the information, no responsibility is accepted for the reliance by any person on any information contained in this occasional paper, nor for any error in or omission from the occasional paper.
Acknowledgements
All participating Māori providers, and the practitioners working in and patients who attend those services, are thanked for their participation and the information they have shared with the research team.
The NatMedCa study was funded by the Health Research Council of New Zealand. Practical support from the academic Departments of General Practice and from the Royal New Zealand College of General Practitioners is also gratefully acknowledged.
We appreciate the financial support given by the Ministry of Health for the preparation and publication of this report.
We are grateful to the Advisory and Monitoring Committee chaired by Professor John Richards. Members are: Dr Jonathan Fox, Dr David Gollogly, Dr Ron Janes, Ms Vera Keefe-Ormsby, Ms Rose Lightfoot, Ms Arapera Ngaha, Dr Bhavani Pedinti, Mr Henri van Roon and Dr Matt Wildbore.
Dr Ashwin Patel developed key coding instruments and assisted with the coding of clinical information. Marijke Oed provided secretarial assistance, Andrew Sporle gave advice on Māori health issues, and Barry Gribben provided consultancy services. Sandra Johnson, Wendy Bingley and Lisa Fellowes all contributed substantially at earlier stages of the project. Dougal Thorburn carried out preliminary work on a summer studentship.
We also wish to thank our reviewers for their comments: Arapera Ngaha, John Richards and Paula Searle. Responsibility for the final product, however, rests ultimately with the authors.
iv
Contents
Executive Summary ix
1 Introduction 1 1.1 Māori providers 2 1.2 Use of primary health care services by Māori 4
2. Methodology 5 2.1 Organisation 5 2.2 Research design 5 2.3 Questionnaires 6 2.4 Ethnicity 6 2.5 Sampling 6 2.6 Timing 9 2.7 Sampling of visits 9 2.8 Recruitment and data collection process 10 2.9 Data 10 2.10 Grouping reasons-for-visit and problems, and drugs 12 2.11 Ethical issues 14
3. Recruitment and Data Collection 15 3.1 Characteristics of participating practitioners 15
4. Characteristics of Patients 18
5. Relationship with Practice 23
6. Visit Characteristics 25
7. Reasons-for-Visit 30
8. Problems Identified and Managed 33
9. Laboratory Tests and Other Investigations 41
v
10. Pharmacological Treatment 47 10.1 Nervous system drugs (Tables 10.7 and 10.8) 52 10.2 Infections: agents for systemic use (Tables 10.9 and 10.10) 53 10.3 Respiratory drugs (Tables 10.11 and 10.12) 54 10.4 Cardiovascular drugs (Tables 10.13 and 10.14) 55 10.5 Dermatological drugs (Tables 10.15 and 10.16) 55 10.6 Alimentary drugs (Tables 10.17 and 10.18) 56 10.7 Musculoskeletal drugs (Tables 10.19 and 10.20) 57 10.8 Genito-urinary drugs (Tables 10.21 and 10.22) 58 10.9 Blood / blood-forming organ drugs (Tables 10.23 and 10.24) 59 10.10 Systemic hormone drugs (Tables 10.25 and 10.26) 60
11. Non-drug Treatments 62
12. Disposition 65
13. Comparison of Māori, Community-governed, and Private GP Providers 72 13.1 Organisational and management characteristics 72
14. Discussion and Conclusions 87 14.1 Summary of results 87 14.2 Practice nurses 92 14.3 Policy implications 92 14.4 Strengths and limitations 93 14.5 Conclusions 94
References 95
Appendices Appendix A: Log of Visits 97 Appendix B: Visit Report 98 Appendix C: Practitioner Questionnaire 99 Appendix D: Nurse Questionnaire 100 Appendix E: Practice Nurse Survey 101 Appendix F: Practice Questionnaire 103
Glossary and List of Acronyms 109
vi
List of Tables Table 2.1: Practitioner population, by practice type and stratum 8 Table 2.2: Sample size and sampling percentage, all strata 9 Table 2.3: READ2 chapter headings 13 Table 2.4: List of level 1 categories (Pharmacodes/ATC system) 14 Table 3.1: Practice and practitioner response, by geographical area: number of log
and visit questionnaires 15 Table 3.2: Characteristics of participating practitioners working in Māori provider
services 17 Table 4.1: Distribution of patients, by age and gender, as percentage of all visits
(from log) 18 Table 4.2: Ratio of visits to national population, by age and gender (log data) 19 Table 4.3: Percentage distribution of all patients, by ethnicity and card (CSC and/or
HUC) status (from log) 19 Table 4.4: Social support, NZDep2001 of residence and fluency in English:
percentage of all patients 21 Table 4.5: Relationship between measures of deprivation, social support and
possession of Community Services Card 22 Table 5.1: Relationship with practice: three measures 23 Table 5.2: New patients: percentage of age group 23 Table 5.3: Patient-reported number of visits to practice in previous 12 months:
percentage distribution 24 Table 5.4: Practitioner-reported rapport: percentage distribution 24 Table 6.1: Source and type of payment cited, as percentage of visits 25 Table 6.2: Duration of visit: percentage distribution 26 Table 6.3: Practitioner assessment of urgency and severity of worst problem:
percentage distribution 27 Table 6.4: Level of disability associated with presenting problem: percentage
distribution 27 Table 6.5: Uncertainty as to appropriate action: percentage distribution 28 Table 6.6: Relationships between patient and visit characteristics 29 Table 7.1: Reasons-for-visit: age- and gender-specific rates (per 100 visits) 30 Table 7.2: Distribution of reasons-for-visit chapters 30 Table 7.3: Frequency of reasons-for-visit (by READ2 chapter) across practitioner
type, rate per 100 visits 31 Table 7.4: Comparison of reason-for-visit components across practitioner type, as
percentage of all reasons 32 Table 8.1: Percentage distribution of number of problems per visit 33 Table 8.2: Number of problems: age- and gender-specific rates(per 100 visits) 33 Table 8.3: Percentage of problem status, by practitioner type 34 Table 8.4: Distribution of problems managed, by READ2 chapter 35 Table 8.5: Comparison of frequency of problems (per 100 visits), by practitioner type 36 Table 8.6: Age and gender distribution of new problems (per 100 visits) 36 Table 8.7: Comparison of frequency of new problems (per 100 visits), by practitioner
type 37
vii
Table 8.8: Age- and gender-specific rates (per 100 visits) of common groups of problems 39
Table 8.9: Seasonal variation: common problems, as percentage of all problems 40 Table 9.1: Rate per 100 visits at which tests and investigations were ordered 41 Table 9.2: Frequency of tests and investigations (per 100 visits), by practitioner type 42 Table 9.3: Age- and gender-specific rates (per 100 visits) of tests and investigations 43 Table 9.4: Problems most frequently managed at visits that included an order for a
laboratory test 45 Table 9.5: Problems most frequently managed at visits that included an order for an
X-ray 46 Table 10.1: Percentage of visits at which treatment was given, by treatment modality
and practitioner type 48 Table 10.2: Number of treatment items, by practitioner type: rate per 100 visits and
per 100 problems 48 Table 10.3: Any prescriptions: age- and gender-specific rates (per 100 visits) 49 Table 10.4: Prescription items: age- and gender-specific rates (per 100 visits) 49 Table 10.5: Distribution of drugs, by group (level 1) and sub-group (level 2) 50 Table 10.6: Most frequently prescribed drug sub-groups 51 Table 10.7: Nervous system drugs: age- and gender-specific rates (per 100 visits) 52 Table 10.8: Most frequent problems managed by nervous system drugs 53 Table 10.9: Anti-infective drugs: age- and gender-specific rates (per 100 visits) 53 Table 10.10: Most frequent problems managed by anti-infective drugs 54 Table 10.11: Respiratory drugs: age- and gender-specific rates (per 100 visits) 54 Table 10.12: Most frequent problems managed by respiratory drugs 54 Table 10.13: Cardiovascular drugs: age- and gender-specific rates (per 100 visits) 55 Table 10.14: Most frequent problems managed by cardiovascular drugs 55 Table 10.15: Dermatological drugs: age- and gender-specific rates (per 100 visits) 56 Table 10.16: Most frequent problems managed by dermatological drugs 56 Table 10.17: Alimentary drugs: age- and gender-specific rates (per 100 visits) 56 Table 10.18: Most frequent problems managed by alimentary drugs 57 Table 10.19: Musculoskeletal drugs: age- and gender-specific rates (per 100 visits) 57 Table 10.20: Most frequent problems managed by musculoskeletal drugs 58 Table 10.21: Genito-urinary drugs: age- and gender-specific rates (per 100 visits) 58 Table 10.22: Most frequent problems managed by genito-urinary drugs 59 Table 10.23: Blood / blood-forming organ drugs: age- and gender-specific rates (per
100 visits) 59 Table 10.24: Most frequent problems managed by blood / blood-forming organ drugs 60 Table 10.25: Systemic hormone drugs: age- and gender-specific rates (per 100 visits) 60 Table 10.26: Most frequent problems managed by systemic hormone drugs 60 Table 10.27: Comparison of prescribing rates for different drug sub-groups, by
practitioner type (per 100 visits) 61 Table 11.1: Frequency of non-drug treatments 62 Table 11.2: Health advice: age- and gender-specific rates (per 100 visits) 63 Table 11.3: Minor surgery: age- and gender-specific rates (per 100 visits) 63 Table 11.4: Comparison of non-drug treatments, by practitioner type (per 100 visits) 64
viii
Table 12.1: Frequency of types of disposition, by practitioner type (percent of visits) 65 Table 12.2: Follow-up within three months: age- and gender-specific rates (per 100
visits) 66 Table 12.3: Rates of follow-up, by problem grouping 67 Table 12.4: Referral: age- and gender-specific rates (per 100 visits) 67 Table 12.5: Emergency referral: age- and gender-specific rates (per 100 visits) 67 Table 12.6: Rates of emergency referral, by problem grouping 68 Table 12.7: Elective medical/surgical referral: age- and gender-specific rates (per 100
visits) 69 Table 12.8: Rates of elective referral, by problem grouping 69 Table 12.9: Non-medical referral: age- and gender-specific rates (per 100 visits) 70 Table 12.10: Rate of non-medical referral, by problem grouping 70 Table 12.11: Destination of referrals: percentage distribution and frequency per 100
visits 71 Table 13.1: Characteristics of practices, by provider type 73 Table 13.2: Characteristics of participant GPs, by provider type 76 Table 13.3: Percentage distribution of visits, by patient gender and age group 78 Table 13.4: Percentage of patient age group who were new to practice, new to
practitioner, and for whom practice not usual source of care 78 Table 13.5: Mean duration of visit, by age group 79 Table 13.6: Mean duration of visit, by severity of worst problem 80 Table 13.7: Percentage distribution of number of problems per visit, by age group
and provider type 80 Table 13.8: Percentage of visits for age group at which any test/investigation was
ordered, by gender and provider type 81 Table 13.9: Number of treatment items, by practice type, per 100 visits and per 100
problems, by gender and age group 82 Table 13.10: Percentage of visits for age group at which patient referred on, by gender
and provider type 84 Table 13.11: Pattern of care for acute respiratory infection: percentage of problems
where any test/investigation ordered, drug prescribed or referral made 86
ix
Executive Summary
Aims. The National Primary Medical Care Survey was undertaken to describe primary health care in New Zealand, including the characteristics of providers and their practices, the patients they see, the problems presented and the management offered. The study covered private general practices (i.e. family doctors), community-governed organisations, and Accident and Medical (A&M) clinics and Hospital Emergency Departments. Māori providers were not explicitly sampled, but were derived through the sampling scheme; the Māori providers included in the study are likely to be a significant proportion of Māori providers nationally, based on evidence gathered via a follow-up survey of primary health care providers. Although, it must be noted that the sample of providers cannot be considered nationally representative, as a definitive and validated Māori primary medical care provider population is not known. It was intended to compare data across practice types as well as over time.
Subsidiary aims included gathering information on the activities of nurses in primary health care, trialling an electronic data collection tool and developing coding software.
This report describes the characteristics of practitioners, patients and patient visits for a sample of 14 primary health care practices classified as Māori primary medical care providers. Other reports in the series describe private family doctors, community-governed non-profits, after-hours activities and other types of practice, and will analyse differences in practice content that have occurred over time or that exist between practice settings.
Methods. A nationally representative, multi-stage sample of private general practitioners (GPs), stratified by place and practice type, was drawn. Each GP was asked to provide data on themselves and on their practice, and to report on a 25% sample of patients in each of two week-long periods. Over the same period, all community-governed primary health care practices in New Zealand were invited to participate, as were a 50% random sample of all A&M clinics, and four representative Hospital Emergency Departments.
Medical practitioners in private general practices, community-governed non-profit practices and A&M clinics completed questionnaires, as did the nurses associated with them. Patient and visit data were recorded on a purpose-designed form.
To qualify for inclusion in the study, Māori primary medical care providers, as well as employing GPs, had to meet all of the following four Ministry of Health criteria:
• is an independent Māori health provider • targets services towards Māori • has a Māori management structure
x
• has a Māori governance structure.
Results. The results presented here relate to 28 practitioners (21 doctors and seven practice nurses) employed at 14 Māori provider practices. The findings include the following.
• All Māori provider practices had separate or external management and the majority had community representation in governance/management. This finding was similar to that for the CGNP practices, but markedly different from private GPs.
• A high percentage of Māori provider practices had undertaken formal community needs assessments, and used locality service planning and inter-sectoral case management, in contrast to private GPs.
• When compared with private GP providers, a higher percentage of Māori providers had written policies on complaints and quality management and operated computerised patient records.
• The percentage of Māori patients was substantially higher in Māori providers (58.9%) than in the other two practice types (11.8% and 19.4%, private GPs and Community Governed Non-profit respectively). It is also worth noting that non- Māori patients also used Māori provider services.
• Compared with private GPs, higher proportions of Māori provider practices provided maternity care, group health promotion, and complementary/alternative care. However, fewer Māori provider practices offered independent practice nurse consultations.
• Doctors working in Māori provider practices tended to be young, relatively new to both general practice and to the Māori provider practice, and female, and a higher percentage had qualified outside New Zealand in contrast to other provider types.
• Males under five years (20.8%) accounted for a greater proportion of consultations than did females under five years (10.2%). Males 75 years and over (3.8%) accounted for somewhat fewer of the consultations than did their female counterparts (6.7%). Women between the ages of 15 and 44 years (38.9%) accounted for more consultations than men between these ages (26.9%). This is likely to reflect consultations for reproductive issues in women of these ages, but may also indicate the relative under-use by or depleted numbers of middle-aged men.
• Māori provider practices had similar numbers of medical and nursing staff compared with Community-governed Non-profit practices and “private” practices, but employed more community health workers.
• Māori providers served a young patient population, of whom a high proportion were Māori and a disproportionate number were drawn from the most deprived geographical areas.
xi
• Over 77% of the patients seen in this survey lived in households from high deprivation (deciles 8, 9 and 10) areas.
• Two-thirds of patients in the survey possessed a Community Services Card.
• Practice nurses saw a higher proportion of patients from high deprivation areas compared with doctors (58.4%). This suggests that Māori providers provide significant access to practice nurses for patients from high deprivation areas.
• Over 90% of patients regarded the practice as their usual source of care, slightly less than half were high users (had been to the GP at least six times in the previous year), and just over a tenth of visits lasted longer than 20 minutes.
• The number of reasons-for-visit was similar for males (1.35 per visit) and females (1.39 per visit). The four most common reasons noted were action, respiratory reasons, investigations and non-specific symptoms.
• About one-third of problems managed were newly identified. Practice nurses tended to see more long-term, follow-up and preventive care patient visits than doctors.
• A higher proportion of visits by the 25−44 years age group attending Māori providers involved three or four different problems compared with private GPs. This may reflect earlier onset of multiple pathologies in patients attending Māori providers.
• The total (all ages) number of treatment items per 100 problems was similar between Māori and private GP providers for “all treatment items” and “other treatment items”. However, the number of prescription items per 100 problems was slightly higher for Māori providers.
• Overall 27.1% of consultations included a test or investigation of some sort, 16% included a laboratory test, and imaging (such as X-rays and ultrasounds) was requested in 4% of consultations. Males had lower rates of investigation than females across all age groups.
• Just over 60% involved the writing of a prescription. Three-month follow-up was recommended in 62.3% of visits, and referrals were made in 17.9% of visits, and 1.7% of visits resulted in an emergency referral.
Conclusions. This is the first paper to report quantitative results on Māori providers of primary medical care. The results indicate that these practices are serving their intended populations and are demonstrating important characteristics of responsiveness to their needs. Care must be taken when interpreting the results of these analyses for two reasons. Firstly, the sampling framework used to enrol participants did not allow for a specific Māori sample and some Māori providers may have been missed. The sample cannot, therefore, be stated to be nationally representative of Māori providers; however it is expected that a reasonable cross-section are included. Secondly, tests of statistical significance have not been undertaken; any apparent differences have not been subjected to statistical scrutiny.
xii
The findings provided here lend support to the policy of Māori provider development. In addition, they suggest Māori providers are increasing access to care for those who live in high deprivation areas. With respect to alignment with government policy, addressing barriers to accessing care and fostering an environment that is conducive to achieving Mäori health gain Māori providers are out-performing other providers; the contributing areas are, for example, organisational/governance/management, ethnicity profile of staff, utilisation of community health workers, and the patient register profile. The proportion of Māori doctors working within Māori providers was higher than in other providers. However, this was far less than the proportion of Māori people in the general population, therefore supporting policies to assist Māori health workforce development.
1
1 Introduction
The National Medical Care Survey 2001/02 (NatMedCa) is a nationally representative survey of primary medical care services across Aotearoa / New Zealand. NatMedCa was carried out in 2001 and 2002. A number of Māori providers were included in the national sample. While the sample is nationally representative of GPs and thus likely to generate a reasonable cross-section of Māori providers who are registered medical practitioners in primary medical care, it cannot claim to be a representative sample of Māori health providers more broadly defined. This is due to the reality that Māori providers were not explicitly sampled, but rather derived through the sampling scheme, which aimed to be nationally representative of all GPs. Furthermore, it is difficult to ascertain representativeness due to the inability to accurately determine the total population of Māori providers; although there have been efforts to reliably enumerate the population retrospectively through a follow-up study, expert advice, and government agencies, the actual number is unknown. However, the research team intends to pursue this further.
Information about patients attending these providers, such as age and gender, was collected from every patient during the data collection period (N=3041). Detailed information about consultations during “office hours” (Monday to Friday, 8 am to 6 pm), such as problems seen, tests and investigations ordered and referrals made, was collected from one in every four consultations (N=705). Information about the practitioners and the services they worked in was also collected. The methodology used to undertake this survey is described in section 2.
The first three reports describe the initial findings collected from Māori service providers, community-governed non-profit practices, and private GPs (mostly affiliated with independent practitioner associations). These initial reports include information about:
• the practitioners (doctors and nurses) working in the services that participated in the survey
• the patients who visited practitioners during the survey
• the relationship of the patients to the practice and practitioner
• the characteristics of the visit
• components of the visit (reasons for, diagnoses made, investigations ordered, referrals made, etc).
2
This report presents information obtained from Māori providers and the practitioners working within these services. Throughout the report ‘Māori provider’ refers to the primary medical care service delivered by a Māori provider organisation. For the purposes of this survey, a provider was considered to be a ‘Māori health provider’ if it met the Ministry of Health’s criteria for Māori health provider funding (see below). Nine Māori provider organisations are included in this survey. Some of these providers operate more than one practice, so there are 14 practices associated with the nine Māori provider organisations. Twenty-one medical and seven nurse practitioners from these 14 practices participated in the survey.
It should be noted that this is the first release of Māori provider data from NatMedCa that is published. The information contained in this report is largely descriptive and few comparisons between Māori providers and other types of providers have been made. While it would have been preferable to include comparisons in this first release accompanied by a well-considered, theory-based analysis of these comparisons, time constraints in the production of this report meant we were not been able to complete that analysis for this report. However, this work will continue and be released in due course. No statistical tests are applied in this report, so any comparative judgements made are evaluative only.
1.1 Māori providers
Between 1984 and 1994 there was considerable development of Māori capacity and capability in the health sector. Prior to this, Māori involvement in health policy and programmes had been limited.1 Over the course of the decade Māori gained experience in providing and managing health programmes, particularly in the areas of health promotion, screening, health education, counselling, liaison and advocacy.1
Support within the Māori community for increased Māori involvement in the health sector was clearly documented in 1984 during Hui Whakaoranga. Recommendations from this hui included the establishment of marae-based community-initiated projects and programmes, the development of a Māori health workforce, and “improved cross-cultural understanding and communication skills” for health workers.2
Participants at Te Ara Ahu Whakamua (the Māori health decade hui held in 1994) identified key points and major themes, including Māori participation at all levels of the health sector, “by Māori, for Māori” control of resources and service delivery, holistic approaches to measuring health, and focusing on outcomes and the effectiveness of service delivery to Māori.3 During the mid-1990s Māori also expressed the belief that by Māori, for Māori health services would be more accessible, acceptable, appropriate and accountable to the Māori community.
3
The health sector reforms announced by the Minister of Health in 1991 provided Māori with opportunities to participate more fully in the health sector. These opportunities resulted in an increase in both the number of organisations involved in providing health services and in the range of services delivered.
Today there are about 240 Māori health providers. The majority of these providers became operational after the 1991/92 health sector reforms. They deliver a range of services, including:
• primary medical care (GP and nursing) • health promotion, screening and health education • dental health • mental health and counselling • disability support services • pregnancy-related care • traditional healing.4
However, only a small number of these Māori providers include primary medical care (general practice) within their services. Presently the exact number offering primary medical care is unknown.
Māori organisations involved in delivering health care have adopted a holistic basis to service provision, catering to other aspects of clients’ social and economic development as well as health issues.1 4 Furthermore, services utilise kaupapa and tikanga Māori, and whānau-based approaches to delivering care. Other key features include governance structures that emphasise accountability to the community, multiple sites for service delivery (base, satellite and mobile health clinics) and, where possible, the employment of Māori staff.4 More detailed information can be found in the National Health Committee’s background paper on Māori primary health care services and in a subsequent paper in Pacific Health Dialog.5 4
The majority of the Māori primary health care providers are still ‘young’, most having been developed within the last decade. Some qualitative descriptive information about the nature and scope of these services is available (e.g. Penney 1996; Crengle 1997, 1999, 2000).6 7 5 4 Detailed quantitative information about Māori providers has not been available to date.
4
1.2 Use of primary health care services by Māori
Some information on Māori use of primary health care has been published. Early work suggested that overall Māori use of GP services was slightly higher than that of non-Māori, but was still considered low when the poorer health status of Māori was taken into account.8 9 However, Māori utilisation rates were shown to vary by gender and age. Māori adult females had much lower rates and Māori adult men had slightly lower rates than expected. On the other hand, Māori children had similar rates of GP service use to what was expected.10 11 12
More recently, Malcolm indirectly investigated Māori utilisation of primary medical care and expenditure on primary medical care and related services.13 He concluded that patients of a number of Māori providers had lower rates of utilisation than the national average. He also found that expenditure on the general medical subsidy, ACC, laboratory services and pharmaceuticals for these patients was lower than the national average.
Davis et al published information about Māori patterns of contact, morbidity and resource use from the Waikato Medical Care Survey, a survey of GPs in the Waikato region undertaken over a 12-month period in 1991/92.14 The authors found that Māori rates of contact with a GP were slightly lower than those of non-Māori. They also found that Māori use of GP services was low when compared to measures of health need, such as public hospital discharge rates or mortality rates for certain conditions (Davis et al 1997).14
Finally, the New Zealand Health Survey 1996/97 found that similar percentages of Māori and New Zealand European adults had visited a GP at least once in the previous 12 months. Slightly more Māori (18.9%) than New Zealand European (8.9%) adults were high users of GP services (had six or more visits per year). Higher percentages of Māori (18.6%) reported unmet need4 compared to New Zealand European (11.6%). There were no statistically significant differences between Māori and New Zealand European children’s use of health services. In the New Zealand Health Survey more children (all ethnic groups combined) aged 0−4 years (28.3%) were high users of GPs than 5−9-year-olds (14.0%) and 10−14-year-olds (8.6%).15
In summary, previous research suggests that, overall and without taking health need into account, Māori utilise primary health care at rates similar to, or slightly lower than, New Zealand Europeans. When health need is taken into account, Māori utilise primary health care at lower rates than their New Zealand European peers.
4 Defined as a participant in the survey stating they did not visit a GP when they felt they needed to.
5
2. Methodology
This section documents the methodology used in the design and implementation of this project. The first three reports from the NatMedCa survey present the results for “private” providers (self-employed GPs), community-governed non-profit practices and Māori providers, respectively. Practices were included as Māori providers if they met government definitions and eligibility criteria for Māori provider development scheme funding (see below) and provided primary medical care services (had a GP). Nine Māori provider organisations are included in this survey. Some of these operate more than one practice, so there are 14 practices associated with the nine Māori provider organisations.
This section provides a synopsis of the methodology. A more detailed account is presented in the first report of this series.16
2.1 Organisation
The research, funded by the Health Research Council of New Zealand, was undertaken by a project team within the Centre for Health Services Research and Policy, School of Population Health, Faculty of Medical and Health Sciences, University of Auckland. Advice and support were provided by a research team representing the Departments of General Practice and/or Public Health at each of the four New Zealand Medical Schools.
2.2 Research design
The research followed the general methodology developed by the National Ambulatory Medical Care Survey (NAMCS) in the United States and previously used in New Zealand by Scott et al., the RNZCGP and McAvoy et al.17 18 19 Randomly selected practitioners were asked to complete reports on a quarter of all consultations for a period of one week. This data collection was repeated after an interval of six months. The survey covered the whole country and made provision for a comparison of practice types.
6
2.3 Questionnaires
Copies of the questionnaires are provided in the appendices. The log questionnaire (Appendix A), completed for all patients seen during the data collection period, recorded gender, date of birth, ethnicity and community card status. It also provided the means for recording the address of the fourth patient. The address was detached (at the practice) and sent to an independent agency for coding to the New Zealand Index of Deprivation (NZDep96/01), a measure of residential area deprivation.20
The visit questionnaire (Appendix B) recorded data about the patient, his or her problem(s) and the management recommended. Questions were added concerning the patient’s level of social support, the presence of a ‘hidden agenda’, and an evaluation of the urgency and gravity of the problem. The practitioner questionnaire (Appendix C) obtained data on practitioner background and current activities. The nurse questionnaire (used for independent practice nurses) captured data about IPNs and their training. The practice nurse questionnaire (Appendix E) gathered data on the nurses’ range of clinical responsibilities and other duties. The expanded practice questionnaire (Appendix F) was derived from the work of Crampton et al and covered access, services provided, equipment on site, personnel employed and various aspects of practice management.21 In particular, the history and the contractual arrangements within the practice were recorded.
2.4 Ethnicity
Previous studies of general practice have been criticised for inaccurate data on patient ethnicity.5 21 In the present study, copies of the ethnicity question used in the 2001 Census were provided for use with each patient. Multiple choices were allowed; in reporting, a single ethnicity was derived giving priority first to Māori affiliation and then to Pacific people affiliations. This formula corresponds to that used by Statistics New Zealand in providing summary data.
2.5 Sampling
Sampling practitioners. The goal of the practitioner sampling process was to achieve representation of all practice types, with adequate numbers in each category. At the same time it aimed to meet two partially opposed criteria: to ensure representation of the whole country and to recruit participants who had contributed to the WaiMedCa Study in 1991 so that changes over time could be better assessed.19
Sampling frame. For independent GPs and GPs associated with an independent practitioner association (IPA), a sampling frame of all active GPs was generated from telephone White Pages listings. Further details are presented in NatMedCa report 1.16
7
A random sample was drawn from the private GP population so that those GPs who worked for Māori providers had the same opportunity to be selected to participate in the survey. In addition to this sampling strategy for private GPs, all community-governed non-profit organisations in primary health care were listed and approached (see the second report in this series for a full description − Crampton et al).22 A good number of these organisations qualified as Māori providers. We believe this sampling process was able to generate a good cross section of Māori providers (see below).
Practices were defined as Māori providers if they met the following four Ministry of Health criteria: 1. Is the practice an independent Māori health provider? 2. Are your services targeted towards Māori? 3. Does the practice (primary health provider) have a Māori management
structure? 4. Does the practice have a Māori governance structure?
A follow-up postal survey of all participating practices in the full study (N=218) was carried out after data collection was completed in order to ascertain and confirm Māori provider status according to these four criteria. This was carried out in cumulative stages. Main groups of providers were identified and sampled first, i.e. those that were likely Māori providers and those that had not completed the question in the study instrument indicating whether they were or not. This was followed by examining all community-governed non-profits, and then the remainder of the NatMedCa population – whether participating or not. In addition, to establish the population of Māori providers, this survey was extended to all possible providers whose status was uncertain, as judged by expert opinion, that had not been included in the NatMedCa sampling frame. Thus, a search of telephone books, web pages and other sources was undertaken in an attempt to capture all likely Māori providers in the population. A response rate of 51% was achieved. The non-responders were reviewed and their Māori provider status was subsequently judged by expert teams as unlikely. This follow-up survey, did however, establish that many practices forming the population of Māori provider practices had been sampled in the course of the main survey. Of 25 enumerated Māori provider practices 15 were Health Care Aotearoa (HCA)-affiliated, all of which had been sampled, and there were 10 others, of which 9 had been sampled. About half of the participating Māori providers (8 of 14 practices) were also HCA-affiliated Māori organisations. Nevertheless, this follow-up survey has its limitations and was not validated. To validate this and ensure complete coverage of the Māori primary medical care provider population, a national survey of all practices whose organisational/ provider status was unknown would be required.
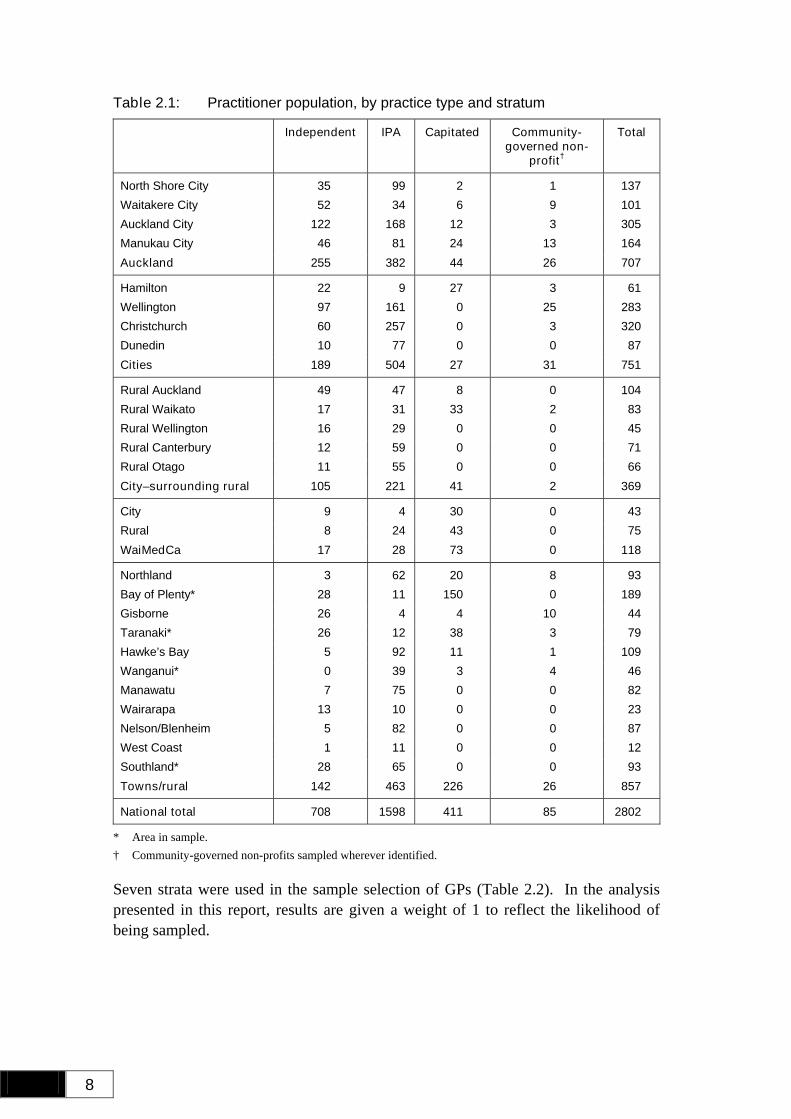
Sampling process. Table 2.1 provides a summary of the grid used for constructing the sampling frame for the different arms of the survey.
8
Table 2.1: Practitioner population, by practice type and stratum
Independent IPA Capitated Community-governed non-
profit†
Total
North Shore City 35 99 2 1 137 Waitakere City 52 34 6 9 101 Auckland City 122 168 12 3 305 Manukau City 46 81 24 13 164 Auckland 255 382 44 26 707
Hamilton 22 9 27 3 61 Wellington 97 161 0 25 283 Christchurch 60 257 0 3 320 Dunedin 10 77 0 0 87 Cities 189 504 27 31 751
Rural Auckland 49 47 8 0 104 Rural Waikato 17 31 33 2 83 Rural Wellington 16 29 0 0 45 Rural Canterbury 12 59 0 0 71 Rural Otago 11 55 0 0 66 City–surrounding rural 105 221 41 2 369
City 9 4 30 0 43 Rural 8 24 43 0 75 WaiMedCa 17 28 73 0 118
Northland 3 62 20 8 93 Bay of Plenty* 28 11 150 0 189 Gisborne 26 4 4 10 44 Taranaki* 26 12 38 3 79 Hawke’s Bay 5 92 11 1 109 Wanganui* 0 39 3 4 46 Manawatu 7 75 0 0 82 Wairarapa 13 10 0 0 23 Nelson/Blenheim 5 82 0 0 87 West Coast 1 11 0 0 12 Southland* 28 65 0 0 93 Towns/rural 142 463 226 26 857
National total 708 1598 411 85 2802
* Area in sample. † Community-governed non-profits sampled wherever identified.
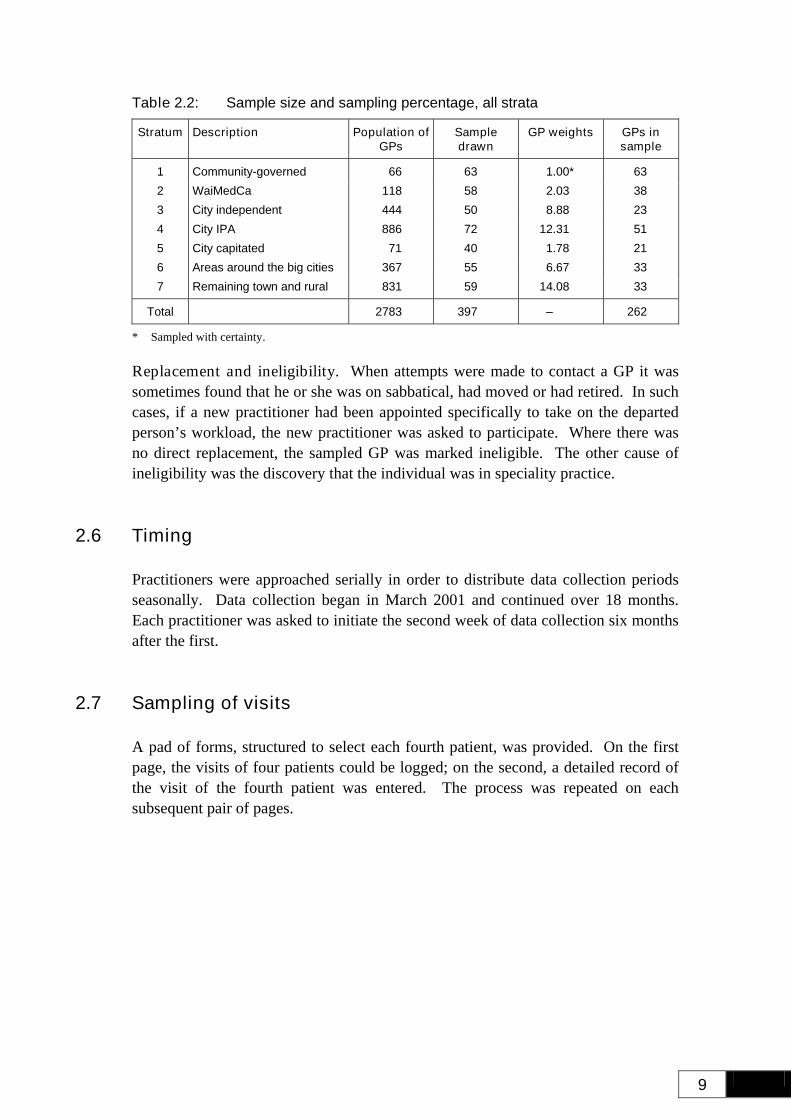
Seven strata were used in the sample selection of GPs (Table 2.2). In the analysis presented in this report, results are given a weight of 1 to reflect the likelihood of being sampled.
9
Table 2.2: Sample size and sampling percentage, all strata
Stratum Description Population of GPs
Sample drawn
GP weights GPs in sample
1 Community-governed 66 63 1.00* 63 2 WaiMedCa 118 58 2.03 38 3 City independent 444 50 8.88 23 4 City IPA 886 72 12.31 51 5 City capitated 71 40 1.78 21 6 Areas around the big cities 367 55 6.67 33 7 Remaining town and rural 831 59 14.08 33
Total 2783 397 – 262
* Sampled with certainty.
Replacement and ineligibility. When attempts were made to contact a GP it was sometimes found that he or she was on sabbatical, had moved or had retired. In such cases, if a new practitioner had been appointed specifically to take on the departed person’s workload, the new practitioner was asked to participate. Where there was no direct replacement, the sampled GP was marked ineligible. The other cause of ineligibility was the discovery that the individual was in speciality practice.
2.6 Timing
Practitioners were approached serially in order to distribute data collection periods seasonally. Data collection began in March 2001 and continued over 18 months. Each practitioner was asked to initiate the second week of data collection six months after the first.
2.7 Sampling of visits
A pad of forms, structured to select each fourth patient, was provided. On the first page, the visits of four patients could be logged; on the second, a detailed record of the visit of the fourth patient was entered. The process was repeated on each subsequent pair of pages.
10
2.8 Recruitment and data collection process
Recruitment of selected practitioners included the following steps:
1. a letter from the project team requesting participation, accompanied by a letter of support from the local Professor of General Practice
2. a phone call from the Clinical Director or the Project Manager requesting an interview
3. a practice visit, at which an information booklet was presented and, with agreement, a time for data collection was set; an estimate of weekly patient numbers was obtained and practitioners signed a consent form
4. delivery of the visit record pad and other questionnaires by courier
5. a phone call early in the week of data collection
6. follow-up phone call(s) if the data pack was not returned
7. a phone call prior to the second week of data collection
8. delivery of the visit record pad by courier
9. follow-up phone call(s) if the second data pack was not returned.
Note that a small payment was made to practitioners based on the number of completed visit forms. This was seen as recognition of the opportunity cost of contributing to research and was based on an hourly rate similar to the after-cost earnings of GPs. The Royal New Zealand College of General Practitioners recognised participation as a practice review activity able to be submitted for post-graduate education credit (MOPS).
2.9 Data
Data management and entry. Unique identifying numbers were assigned to each practice and each practitioner who agreed to participate. A separate number was assigned to the associated practice nurses. These numbers were entered on the questionnaires and visit report pad prior to dispatch. The practitioners and nurses returned the forms at the end of the week of data collection using a pre-addressed courier pack. The patients’ addresses were recorded and sent from the practice directly to an independent organisation for geo-coding and assignment of NZDep scores.
The progress of recruitment was entered on the master sheet. First, refusal, ineligibility or agreement to participate was recorded. Subsequently, dispatch and receipt of both phases of documents were logged. Data entry was undertaken by trained experienced individuals using pre-formatted electronic forms. A data manager checked entries for accuracy using predetermined processes.
11
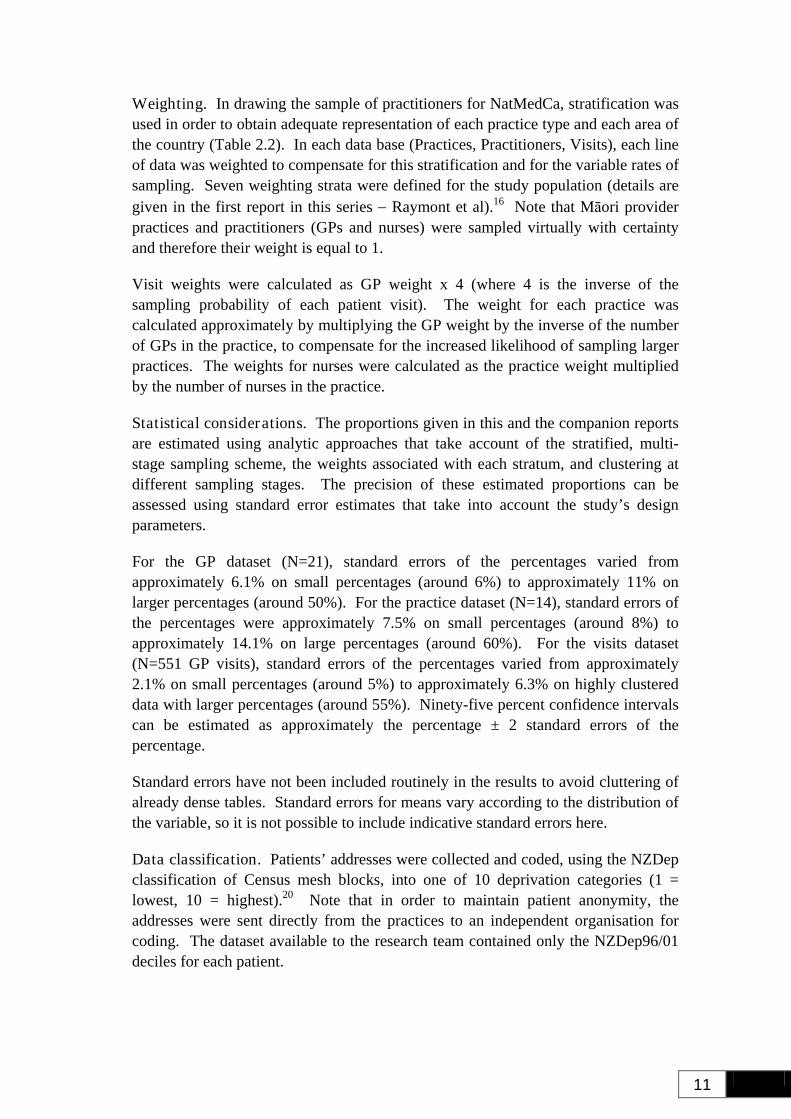
Weighting. In drawing the sample of practitioners for NatMedCa, stratification was used in order to obtain adequate representation of each practice type and each area of the country (Table 2.2). In each data base (Practices, Practitioners, Visits), each line of data was weighted to compensate for this stratification and for the variable rates of sampling. Seven weighting strata were defined for the study population (details are given in the first report in this series − Raymont et al).16 Note that Māori provider practices and practitioners (GPs and nurses) were sampled virtually with certainty and therefore their weight is equal to 1.
Visit weights were calculated as GP weight x 4 (where 4 is the inverse of the sampling probability of each patient visit). The weight for each practice was calculated approximately by multiplying the GP weight by the inverse of the number of GPs in the practice, to compensate for the increased likelihood of sampling larger practices. The weights for nurses were calculated as the practice weight multiplied by the number of nurses in the practice.
Statistical considerations. The proportions given in this and the companion reports are estimated using analytic approaches that take account of the stratified, multi-stage sampling scheme, the weights associated with each stratum, and clustering at different sampling stages. The precision of these estimated proportions can be assessed using standard error estimates that take into account the study’s design parameters.
For the GP dataset (N=21), standard errors of the percentages varied from approximately 6.1% on small percentages (around 6%) to approximately 11% on larger percentages (around 50%). For the practice dataset (N=14), standard errors of the percentages were approximately 7.5% on small percentages (around 8%) to approximately 14.1% on large percentages (around 60%). For the visits dataset (N=551 GP visits), standard errors of the percentages varied from approximately 2.1% on small percentages (around 5%) to approximately 6.3% on highly clustered data with larger percentages (around 55%). Ninety-five percent confidence intervals can be estimated as approximately the percentage ± 2 standard errors of the percentage.
Standard errors have not been included routinely in the results to avoid cluttering of already dense tables. Standard errors for means vary according to the distribution of the variable, so it is not possible to include indicative standard errors here.
Data classification. Patients’ addresses were collected and coded, using the NZDep classification of Census mesh blocks, into one of 10 deprivation categories (1 = lowest, 10 = highest).20 Note that in order to maintain patient anonymity, the addresses were sent directly from the practices to an independent organisation for coding. The dataset available to the research team contained only the NZDep96/01 deciles for each patient.
12
Reason-for-visit and diagnosis were also coded, using READ version 2 (READ2). A significant number of visits to GPs do not result in a clear pathological diagnosis, and READ makes provision for symptoms, administrative functions, intended actions, and other types of entry.23 Practitioners entered the variables as free text, and coding was performed electronically. The coding software assigned a READ code to each entry. When no fit was found, the software presented a set of options and the operator could choose an appropriate term. Once an entry had been manually coded any repeat would be coded in the same way. When a coding fit was questionable, medical personnel, who also undertook random checks of all coding, reviewed the entry. Drugs were coded (according to the Pharmacodes/ATC system) using similar software, as were other therapeutic actions.
2.10 Grouping reasons-for-visit and problems, and drugs
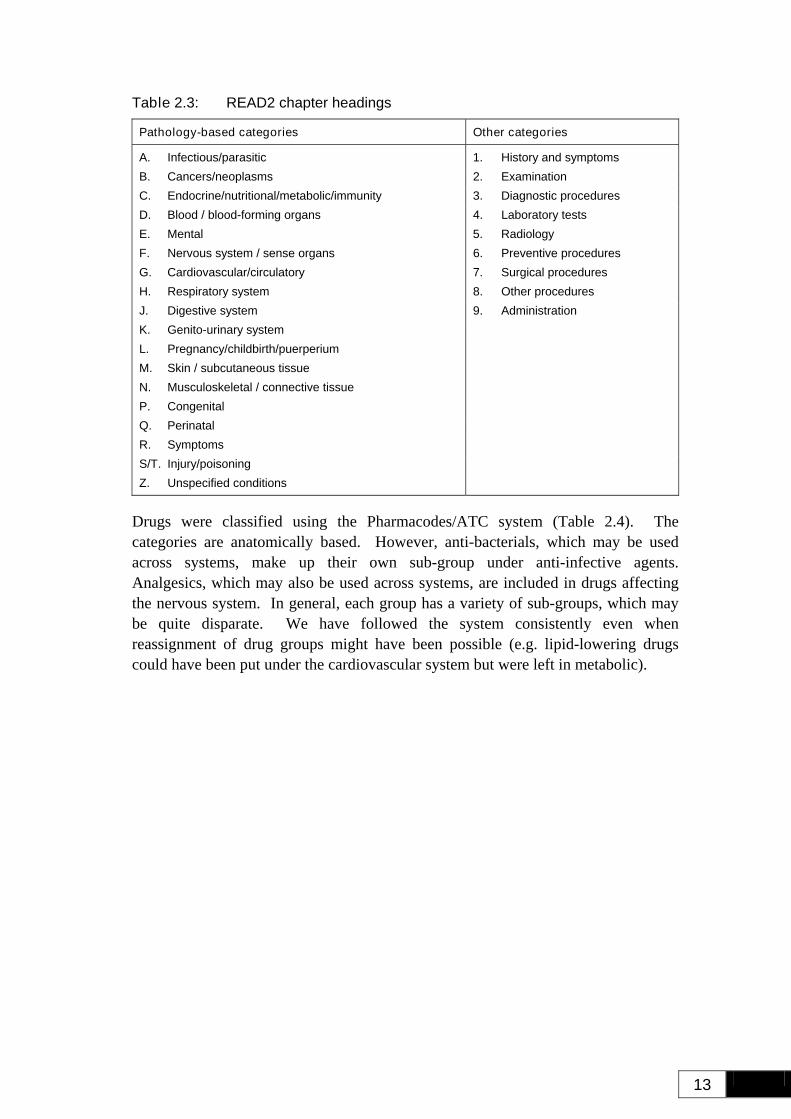
READ is a hierarchical system and classifies reasons-for-visit and diagnoses either into pathology-based groups identified by a letter or, when specific pathology has not been reported, into numbered categories which include symptoms and proposed actions. The primary (first digit) categories are given in Table 2.3. In reporting the frequency of the various categories, the first digit of the code was used as a grouper (e.g. H = respiratory). The more sizeable sub-groups of problems, indicated by the second digit (e.g. H3 = chronic obstructive airway disease) are also reported.
However, all the numbered action, investigation and administration categories are treated as a single category and the value of the number is used as the second-level grouper. Where a symptom was system-specific (e.g. cough), the case was assigned to the equivalent lettered category.
13
Table 2.3: READ2 chapter headings
Pathology-based categories Other categories
A. Infectious/parasitic 1. History and symptoms B. Cancers/neoplasms 2. Examination C. Endocrine/nutritional/metabolic/immunity 3. Diagnostic procedures D. Blood / blood-forming organs 4. Laboratory tests E. Mental 5. Radiology F. Nervous system / sense organs 6. Preventive procedures G. Cardiovascular/circulatory 7. Surgical procedures H. Respiratory system 8. Other procedures J. Digestive system 9. Administration K. Genito-urinary system L. Pregnancy/childbirth/puerperium M. Skin / subcutaneous tissue N. Musculoskeletal / connective tissue P. Congenital Q. Perinatal R. Symptoms S/T. Injury/poisoning Z. Unspecified conditions
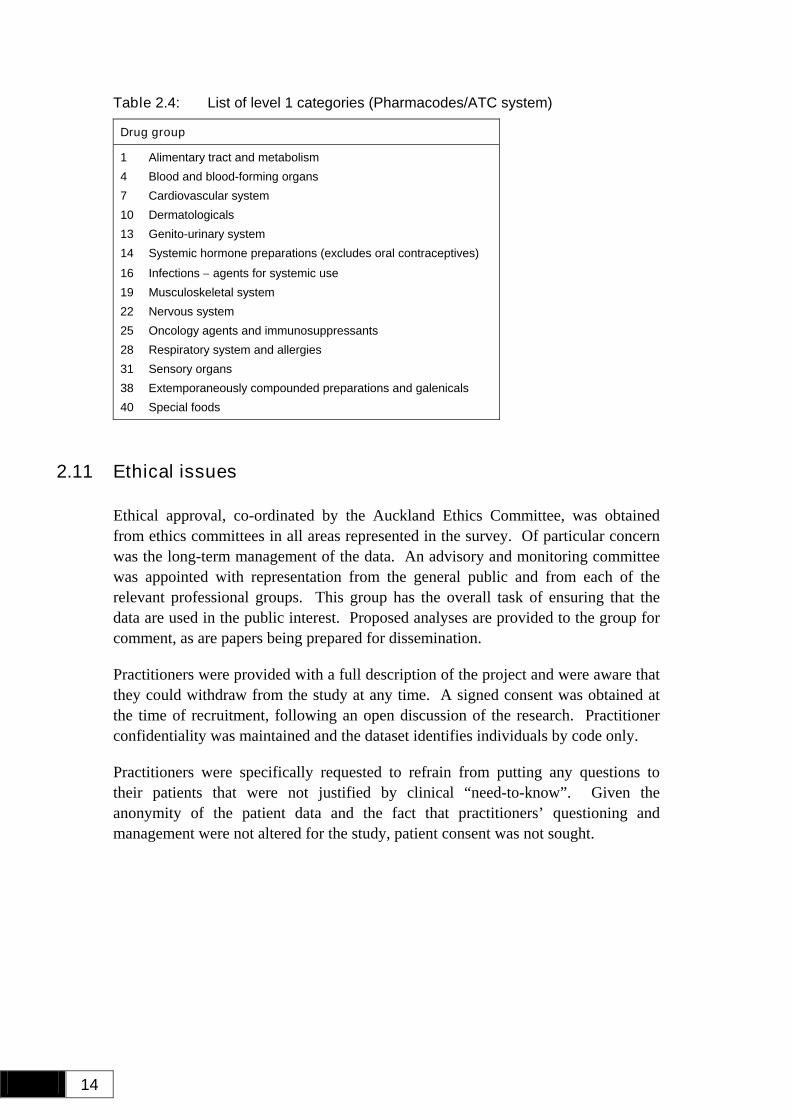
Drugs were classified using the Pharmacodes/ATC system (Table 2.4). The categories are anatomically based. However, anti-bacterials, which may be used across systems, make up their own sub-group under anti-infective agents. Analgesics, which may also be used across systems, are included in drugs affecting the nervous system. In general, each group has a variety of sub-groups, which may be quite disparate. We have followed the system consistently even when reassignment of drug groups might have been possible (e.g. lipid-lowering drugs could have been put under the cardiovascular system but were left in metabolic).
14
Table 2.4: List of level 1 categories (Pharmacodes/ATC system)
Drug group
1 Alimentary tract and metabolism 4 Blood and blood-forming organs 7 Cardiovascular system 10 Dermatologicals 13 Genito-urinary system 14 Systemic hormone preparations (excludes oral contraceptives) 16 Infections − agents for systemic use 19 Musculoskeletal system 22 Nervous system 25 Oncology agents and immunosuppressants 28 Respiratory system and allergies 31 Sensory organs 38 Extemporaneously compounded preparations and galenicals 40 Special foods
2.11 Ethical issues
Ethical approval, co-ordinated by the Auckland Ethics Committee, was obtained from ethics committees in all areas represented in the survey. Of particular concern was the long-term management of the data. An advisory and monitoring committee was appointed with representation from the general public and from each of the relevant professional groups. This group has the overall task of ensuring that the data are used in the public interest. Proposed analyses are provided to the group for comment, as are papers being prepared for dissemination.
Practitioners were provided with a full description of the project and were aware that they could withdraw from the study at any time. A signed consent was obtained at the time of recruitment, following an open discussion of the research. Practitioner confidentiality was maintained and the dataset identifies individuals by code only.
Practitioners were specifically requested to refrain from putting any questions to their patients that were not justified by clinical “need-to-know”. Given the anonymity of the patient data and the fact that practitioners’ questioning and management were not altered for the study, patient consent was not sought.
15
3. Recruitment and Data Collection
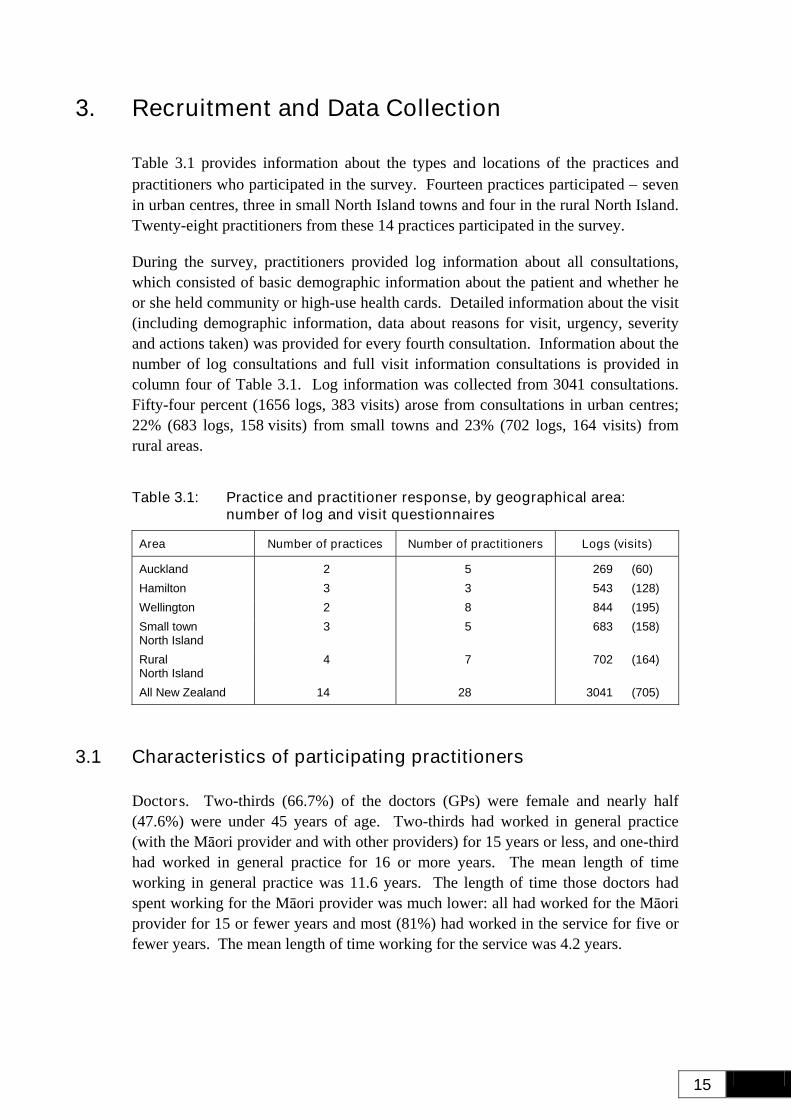
Table 3.1 provides information about the types and locations of the practices and practitioners who participated in the survey. Fourteen practices participated − seven in urban centres, three in small North Island towns and four in the rural North Island. Twenty-eight practitioners from these 14 practices participated in the survey.
During the survey, practitioners provided log information about all consultations, which consisted of basic demographic information about the patient and whether he or she held community or high-use health cards. Detailed information about the visit (including demographic information, data about reasons for visit, urgency, severity and actions taken) was provided for every fourth consultation. Information about the number of log consultations and full visit information consultations is provided in column four of Table 3.1. Log information was collected from 3041 consultations. Fifty-four percent (1656 logs, 383 visits) arose from consultations in urban centres; 22% (683 logs, 158 visits) from small towns and 23% (702 logs, 164 visits) from rural areas.
Table 3.1: Practice and practitioner response, by geographical area: number of log and visit questionnaires
Area Number of practices Number of practitioners Logs (visits)
Auckland 2 5 269 (60) Hamilton 3 3 543 (128) Wellington 2 8 844 (195) Small town North Island
3 5 683 (158)
Rural North Island
4 7 702 (164)
All New Zealand 14 28 3041 (705)
3.1 Characteristics of participating practitioners
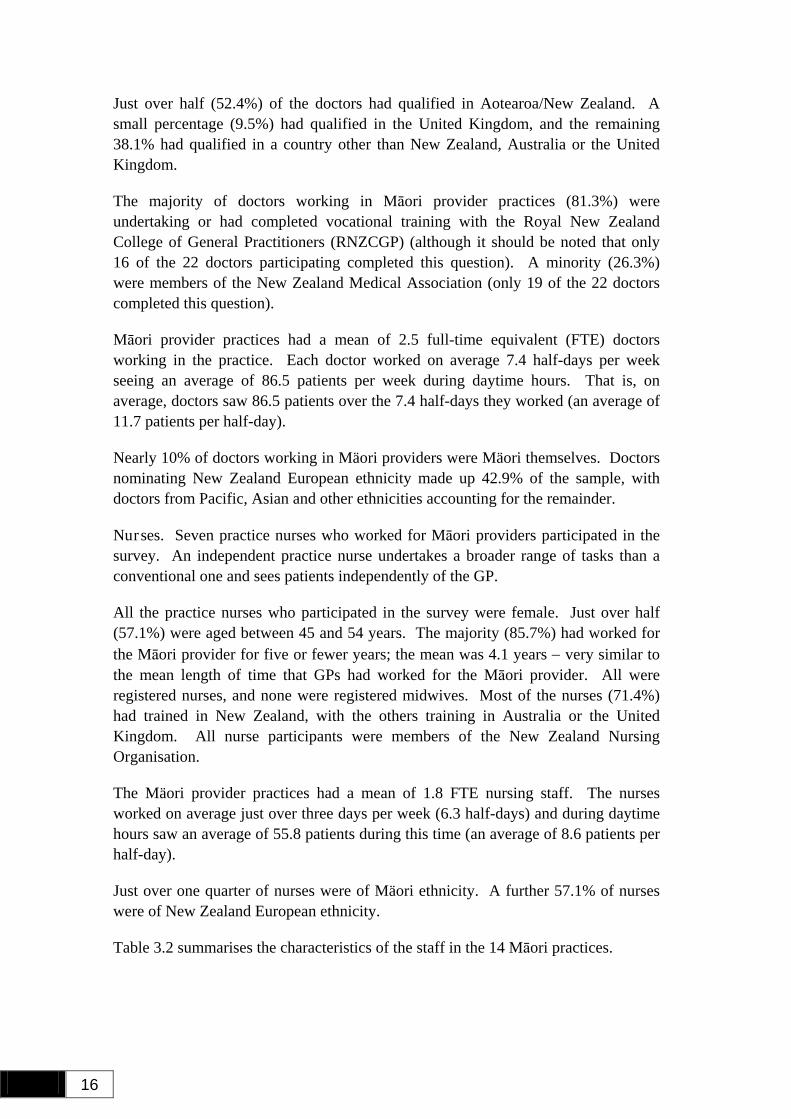
Doctors. Two-thirds (66.7%) of the doctors (GPs) were female and nearly half (47.6%) were under 45 years of age. Two-thirds had worked in general practice (with the Māori provider and with other providers) for 15 years or less, and one-third had worked in general practice for 16 or more years. The mean length of time working in general practice was 11.6 years. The length of time those doctors had spent working for the Māori provider was much lower: all had worked for the Māori provider for 15 or fewer years and most (81%) had worked in the service for five or fewer years. The mean length of time working for the service was 4.2 years.
16
Just over half (52.4%) of the doctors had qualified in Aotearoa/New Zealand. A small percentage (9.5%) had qualified in the United Kingdom, and the remaining 38.1% had qualified in a country other than New Zealand, Australia or the United Kingdom.
The majority of doctors working in Māori provider practices (81.3%) were undertaking or had completed vocational training with the Royal New Zealand College of General Practitioners (RNZCGP) (although it should be noted that only 16 of the 22 doctors participating completed this question). A minority (26.3%) were members of the New Zealand Medical Association (only 19 of the 22 doctors completed this question).
Māori provider practices had a mean of 2.5 full-time equivalent (FTE) doctors working in the practice. Each doctor worked on average 7.4 half-days per week seeing an average of 86.5 patients per week during daytime hours. That is, on average, doctors saw 86.5 patients over the 7.4 half-days they worked (an average of 11.7 patients per half-day).
Nearly 10% of doctors working in Mäori providers were Mäori themselves. Doctors nominating New Zealand European ethnicity made up 42.9% of the sample, with doctors from Pacific, Asian and other ethnicities accounting for the remainder.
Nurses. Seven practice nurses who worked for Māori providers participated in the survey. An independent practice nurse undertakes a broader range of tasks than a conventional one and sees patients independently of the GP.
All the practice nurses who participated in the survey were female. Just over half (57.1%) were aged between 45 and 54 years. The majority (85.7%) had worked for the Māori provider for five or fewer years; the mean was 4.1 years − very similar to the mean length of time that GPs had worked for the Māori provider. All were registered nurses, and none were registered midwives. Most of the nurses (71.4%) had trained in New Zealand, with the others training in Australia or the United Kingdom. All nurse participants were members of the New Zealand Nursing Organisation.
The Mäori provider practices had a mean of 1.8 FTE nursing staff. The nurses worked on average just over three days per week (6.3 half-days) and during daytime hours saw an average of 55.8 patients during this time (an average of 8.6 patients per half-day).
Just over one quarter of nurses were of Mäori ethnicity. A further 57.1% of nurses were of New Zealand European ethnicity.
Table 3.2 summarises the characteristics of the staff in the 14 Māori practices.
17
Table 3.2: Characteristics of participating practitioners working in Māori provider services
Participants*
Doctors (maximum N=21)
Nurses (maximum N=7)
Ethnicity % Mäori Pacific New Zealand European Asian Other Total
9.5 4.8
42.9 14.3 28.6 100%
28.6 0
57.1 0
14.3 100%
Gender % female 66.7 100
Age < 35 35–44 45–54 55–64 > 64 Total
19.0 28.6 23.8 19.0 9.5
100% Mean age = 45.0
0
28.6 57.1 14.3 0
100% Mean age = 48.7
Years in practice < 6 6–15 16−25 > 25 Total
38.1 28.6 14.3 19.0 100%
Mean = 11.6
-
-
-
-
-
Years this practice < 6 6–15 16−25 > 25 Total
81.0 19.0 0 0
100% Mean = 4.2
85.7 0
14.3 0
100% Mean = 4.1
Place of graduation New Zealand UK Other Total
52.4 9.5
38.1 100%
71.4 14.3 14.3
100%
% RNZCGP 81.3 College of Nursing: 14.3%
% NZMA 26.3 NZNO: 100%
Size of practice (FTE) 2.5 1.8
Mean daytime patients per week 86.5 55.8
Mean half-days worked per week 7.4 6.3
Mean daytime patients per half-day 11.7 8.9
* Practitioners who provided visits data.
18
4. Characteristics of Patients
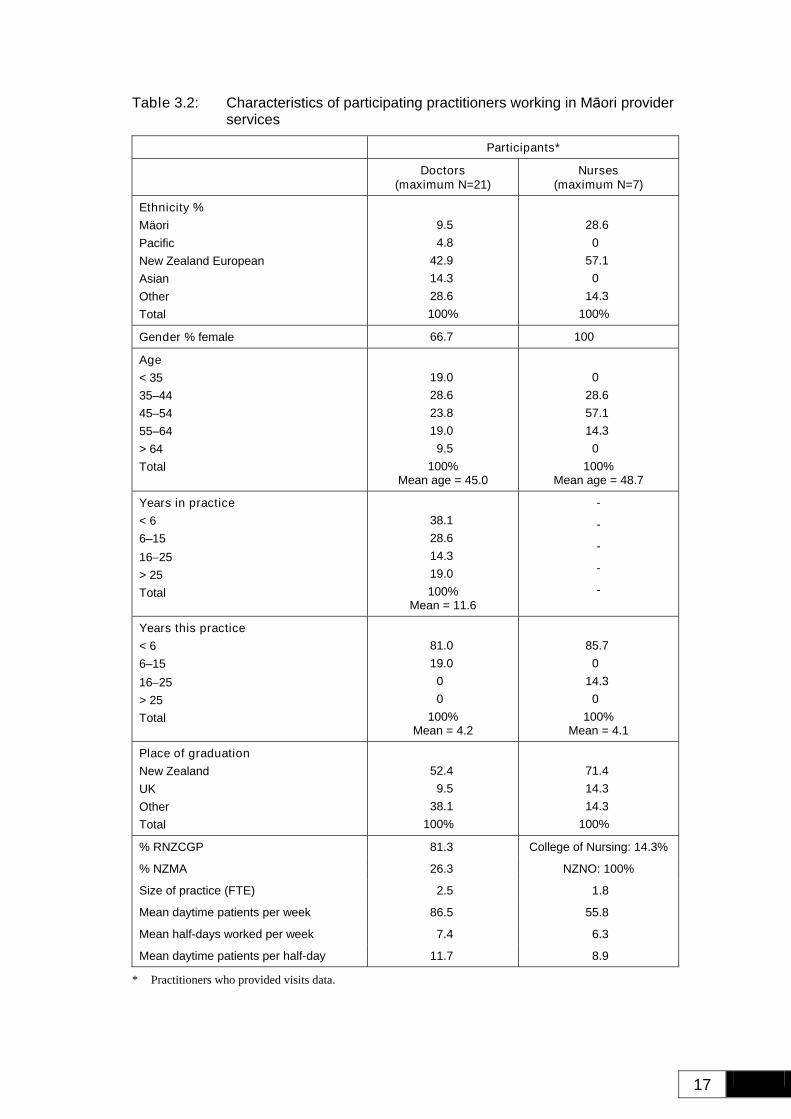
The information contained in Tables 4.1 to 4.3 was obtained for all patients who had consultations with the practitioners during the study period (3041 consultations). For the total patient population, children under the age of five years accounted for 14.7% of consultations and people 75 years and older accounted for 5.5% of consultations. Between these ages each 10-year age band accounted for similar percentages (between 9.6 and 12.7%).
There were differences in the age composition for male and female consultations. Males under five years (20.8%) accounted for a greater proportion of consultations than did females under five years (10.2%). Males 75 years and over (3.8%) accounted for somewhat fewer of the consultations than did their female counterparts (6.7%). Women between the ages of 15 and 44 years (38.9%) accounted for more consultations than males between these ages (26.9%). This is likely to reflect consultations for reproductive issues in women of these ages.
There were no major differences in the age structure of consultations between doctors and nurses.
Table 4.1: Distribution of patients, by age and gender, as percentage of all visits (from log)
Whole survey Doctors Practice nurses Age group
Missing Males Females All All All
75+ 1 3.8 6.7 5.5 5.6 5.0 65−74 2 10.5 9.8 10.1 10.2 9.7
55−64 0 10.2 11.1 10.7 10.3 12.2
45−54 1 11.2 12.6 12.0 12.3 11.2
35−44 0 9.1 13.7 11.8 11.6 12.4
25−34 3 10.6 13.7 12.5 13.1 10.3
15−24 1 7.2 11.5 9.7 9.2 11.6
5−14 0 16.3 10.2 12.7 12.9 11.8
1−4 2 13.0 7.1 9.6 9.6 9.5 < 1 0 7.8 3.1 5.1 4.7 6.3 Missing 0 0.2 0.5 0.3 0.4 0.2
Total (N)
(10)
100% (1250)
100% (1781)
100% (3041)
100% (2378)
100% (663)
19
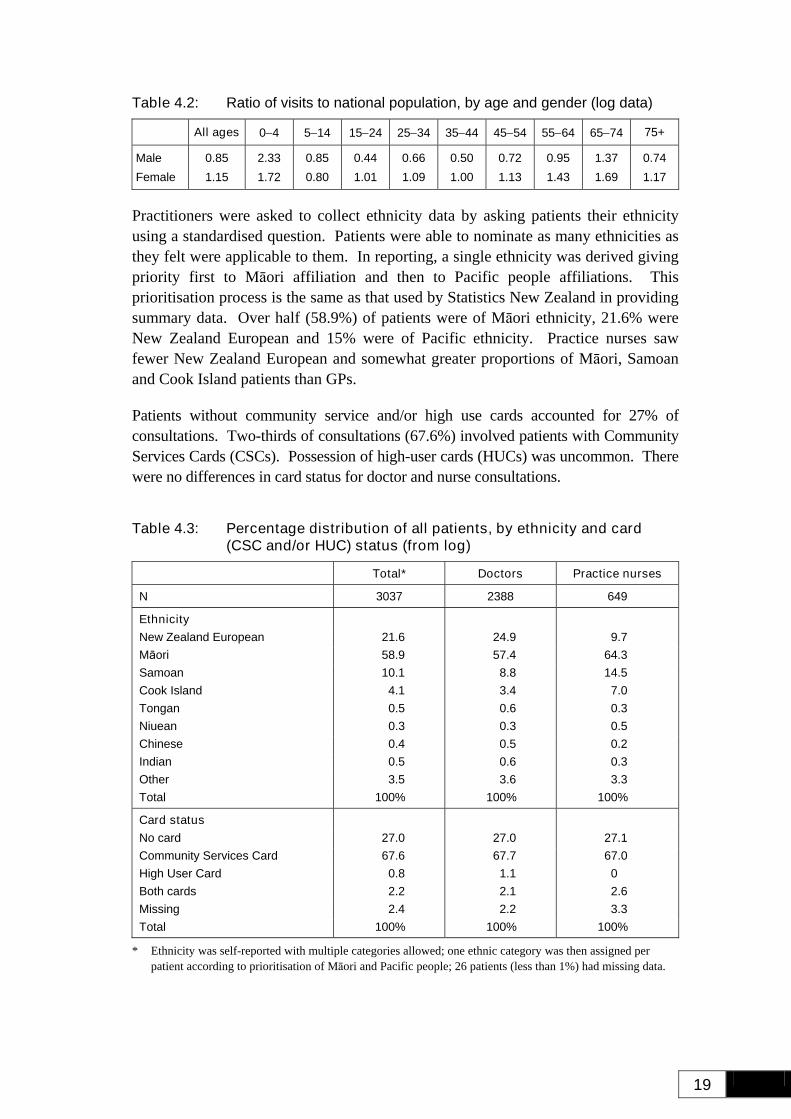
Table 4.2: Ratio of visits to national population, by age and gender (log data)
All ages 0−4 5−14 15−24 25−34 35−44 45−54 55−64 65−74 75+
Male 0.85 2.33 0.85 0.44 0.66 0.50 0.72 0.95 1.37 0.74 Female 1.15 1.72 0.80 1.01 1.09 1.00 1.13 1.43 1.69 1.17
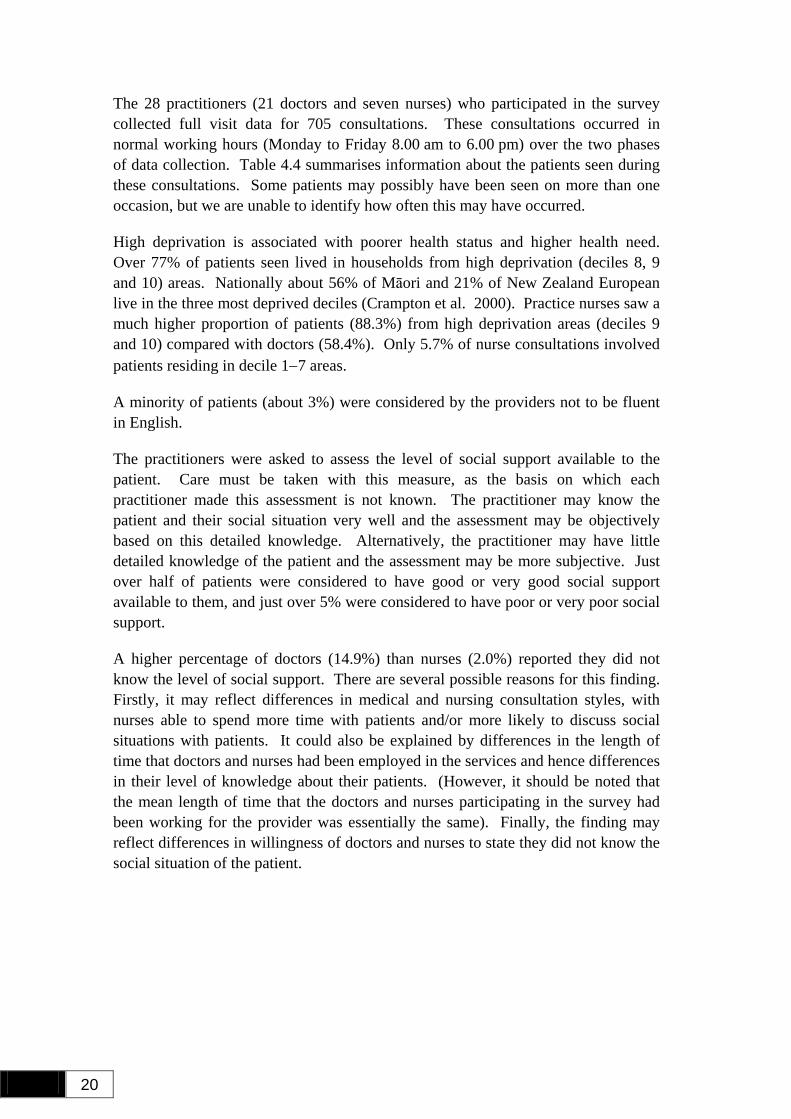
Practitioners were asked to collect ethnicity data by asking patients their ethnicity using a standardised question. Patients were able to nominate as many ethnicities as they felt were applicable to them. In reporting, a single ethnicity was derived giving priority first to Māori affiliation and then to Pacific people affiliations. This prioritisation process is the same as that used by Statistics New Zealand in providing summary data. Over half (58.9%) of patients were of Māori ethnicity, 21.6% were New Zealand European and 15% were of Pacific ethnicity. Practice nurses saw fewer New Zealand European and somewhat greater proportions of Māori, Samoan and Cook Island patients than GPs.
Patients without community service and/or high use cards accounted for 27% of consultations. Two-thirds of consultations (67.6%) involved patients with Community Services Cards (CSCs). Possession of high-user cards (HUCs) was uncommon. There were no differences in card status for doctor and nurse consultations.
Table 4.3: Percentage distribution of all patients, by ethnicity and card (CSC and/or HUC) status (from log)
Total* Doctors Practice nurses
N 3037 2388 649
Ethnicity New Zealand European 21.6 24.9 9.7 Māori 58.9 57.4 64.3 Samoan 10.1 8.8 14.5 Cook Island 4.1 3.4 7.0 Tongan 0.5 0.6 0.3 Niuean 0.3 0.3 0.5 Chinese 0.4 0.5 0.2 Indian 0.5 0.6 0.3 Other 3.5 3.6 3.3 Total 100% 100% 100%
Card status No card 27.0 27.0 27.1 Community Services Card 67.6 67.7 67.0 High User Card 0.8 1.1 0 Both cards 2.2 2.1 2.6 Missing 2.4 2.2 3.3 Total 100% 100% 100%
* Ethnicity was self-reported with multiple categories allowed; one ethnic category was then assigned per patient according to prioritisation of Māori and Pacific people; 26 patients (less than 1%) had missing data.
20
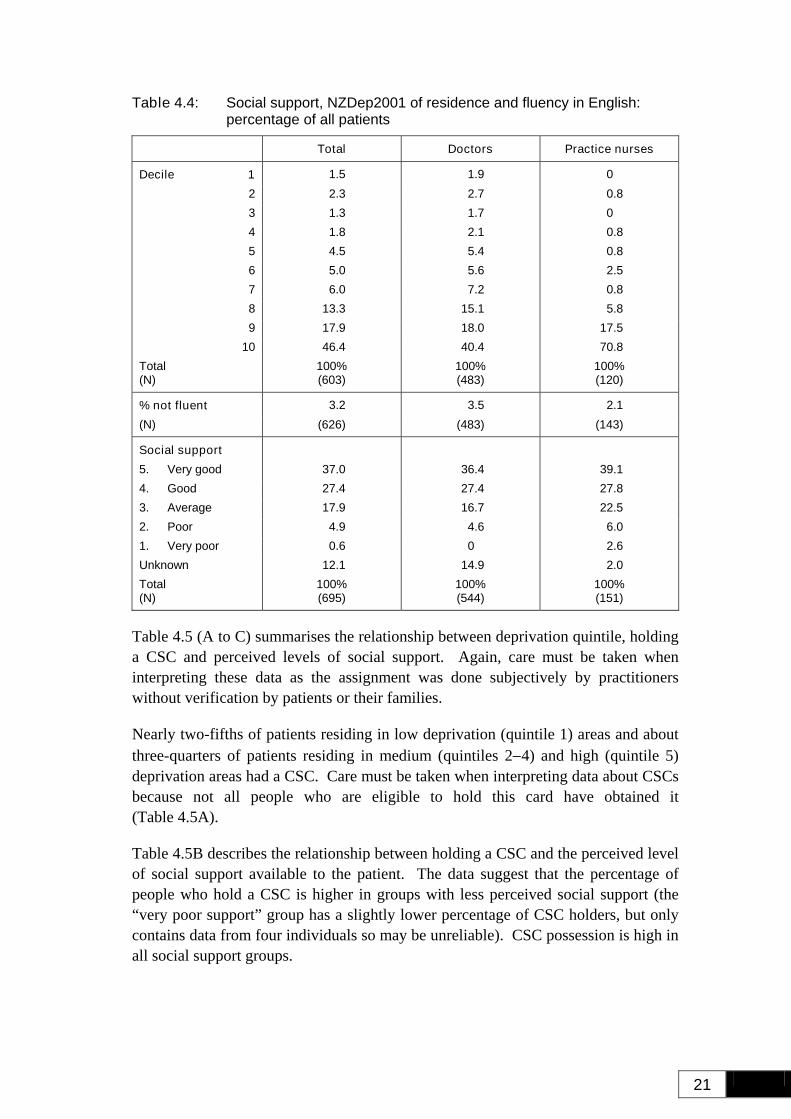
The 28 practitioners (21 doctors and seven nurses) who participated in the survey collected full visit data for 705 consultations. These consultations occurred in normal working hours (Monday to Friday 8.00 am to 6.00 pm) over the two phases of data collection. Table 4.4 summarises information about the patients seen during these consultations. Some patients may possibly have been seen on more than one occasion, but we are unable to identify how often this may have occurred.
High deprivation is associated with poorer health status and higher health need. Over 77% of patients seen lived in households from high deprivation (deciles 8, 9 and 10) areas. Nationally about 56% of Māori and 21% of New Zealand European live in the three most deprived deciles (Crampton et al. 2000). Practice nurses saw a much higher proportion of patients (88.3%) from high deprivation areas (deciles 9 and 10) compared with doctors (58.4%). Only 5.7% of nurse consultations involved patients residing in decile 1−7 areas.
A minority of patients (about 3%) were considered by the providers not to be fluent in English.
The practitioners were asked to assess the level of social support available to the patient. Care must be taken with this measure, as the basis on which each practitioner made this assessment is not known. The practitioner may know the patient and their social situation very well and the assessment may be objectively based on this detailed knowledge. Alternatively, the practitioner may have little detailed knowledge of the patient and the assessment may be more subjective. Just over half of patients were considered to have good or very good social support available to them, and just over 5% were considered to have poor or very poor social support.
A higher percentage of doctors (14.9%) than nurses (2.0%) reported they did not know the level of social support. There are several possible reasons for this finding. Firstly, it may reflect differences in medical and nursing consultation styles, with nurses able to spend more time with patients and/or more likely to discuss social situations with patients. It could also be explained by differences in the length of time that doctors and nurses had been employed in the services and hence differences in their level of knowledge about their patients. (However, it should be noted that the mean length of time that the doctors and nurses participating in the survey had been working for the provider was essentially the same). Finally, the finding may reflect differences in willingness of doctors and nurses to state they did not know the social situation of the patient.
21
Table 4.4: Social support, NZDep2001 of residence and fluency in English: percentage of all patients
Total Doctors Practice nurses
Decile 1 1.5 1.9 0 2 2.3 2.7 0.8 3 1.3 1.7 0 4 1.8 2.1 0.8 5 4.5 5.4 0.8 6 5.0 5.6 2.5 7 6.0 7.2 0.8 8 13.3 15.1 5.8 9 17.9 18.0 17.5
10 46.4 40.4 70.8 Total (N)
100% (603)
100% (483)
100% (120)
% not fluent 3.2 3.5 2.1 (N) (626) (483) (143)
Social support 5. Very good 37.0 36.4 39.1 4. Good 27.4 27.4 27.8 3. Average 17.9 16.7 22.5 2. Poor 4.9 4.6 6.0 1. Very poor 0.6 0 2.6 Unknown 12.1 14.9 2.0 Total (N)
100% (695)
100% (544)
100% (151)
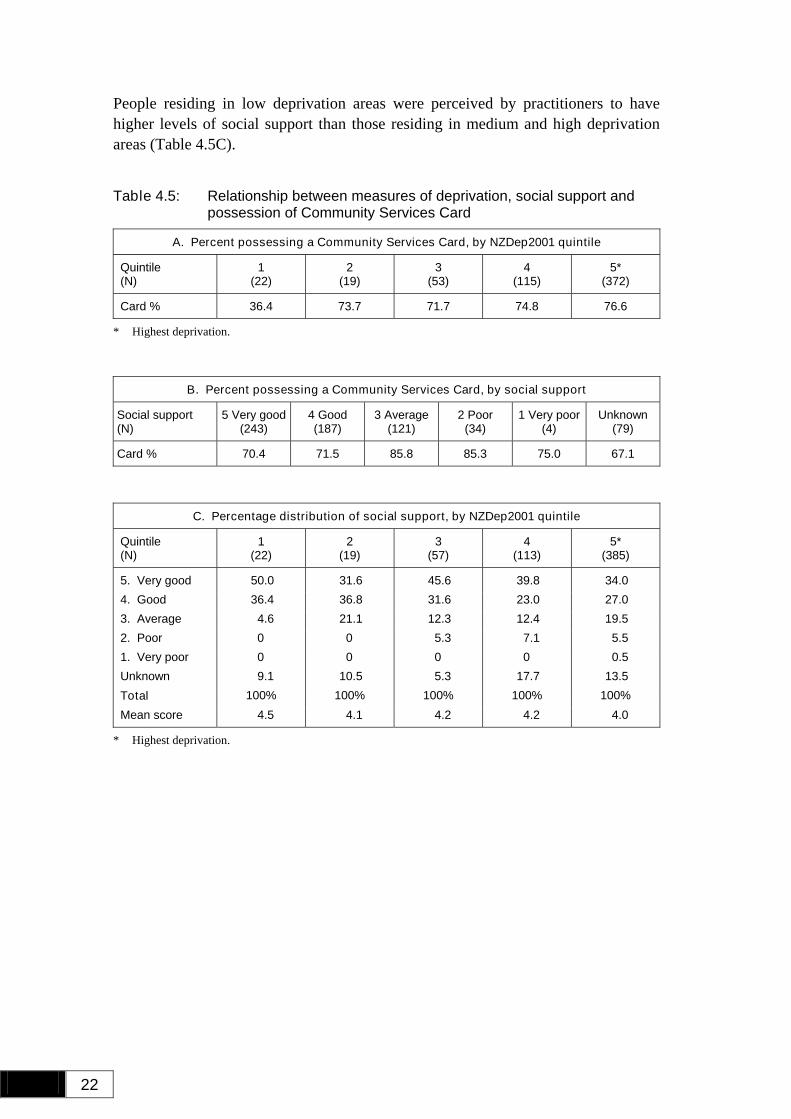
Table 4.5 (A to C) summarises the relationship between deprivation quintile, holding a CSC and perceived levels of social support. Again, care must be taken when interpreting these data as the assignment was done subjectively by practitioners without verification by patients or their families.
Nearly two-fifths of patients residing in low deprivation (quintile 1) areas and about three-quarters of patients residing in medium (quintiles 2−4) and high (quintile 5) deprivation areas had a CSC. Care must be taken when interpreting data about CSCs because not all people who are eligible to hold this card have obtained it (Table 4.5A).
Table 4.5B describes the relationship between holding a CSC and the perceived level of social support available to the patient. The data suggest that the percentage of people who hold a CSC is higher in groups with less perceived social support (the “very poor support” group has a slightly lower percentage of CSC holders, but only contains data from four individuals so may be unreliable). CSC possession is high in all social support groups.
22
People residing in low deprivation areas were perceived by practitioners to have higher levels of social support than those residing in medium and high deprivation areas (Table 4.5C).
Table 4.5: Relationship between measures of deprivation, social support and possession of Community Services Card
A. Percent possessing a Community Services Card, by NZDep2001 quintile Quintile (N)
1 (22)
2 (19)
3 (53)
4 (115)
5* (372)
Card % 36.4 73.7 71.7 74.8 76.6
* Highest deprivation.
B. Percent possessing a Community Services Card, by social support
Social support (N)
5 Very good (243)
4 Good (187)
3 Average(121)
2 Poor (34)
1 Very poor (4)
Unknown (79)
Card % 70.4 71.5 85.8 85.3 75.0 67.1
C. Percentage distribution of social support, by NZDep2001 quintile
Quintile (N)
1 (22)
2 (19)
3 (57)
4 (113)
5* (385)
5. Very good 50.0 31.6 45.6 39.8 34.0 4. Good 36.4 36.8 31.6 23.0 27.0 3. Average 4.6 21.1 12.3 12.4 19.5 2. Poor 0 0 5.3 7.1 5.5 1. Very poor 0 0 0 0 0.5 Unknown 9.1 10.5 5.3 17.7 13.5 Total 100% 100% 100% 100% 100% Mean score 4.5 4.1 4.2 4.2 4.0
* Highest deprivation.
23
5. Relationship with Practice
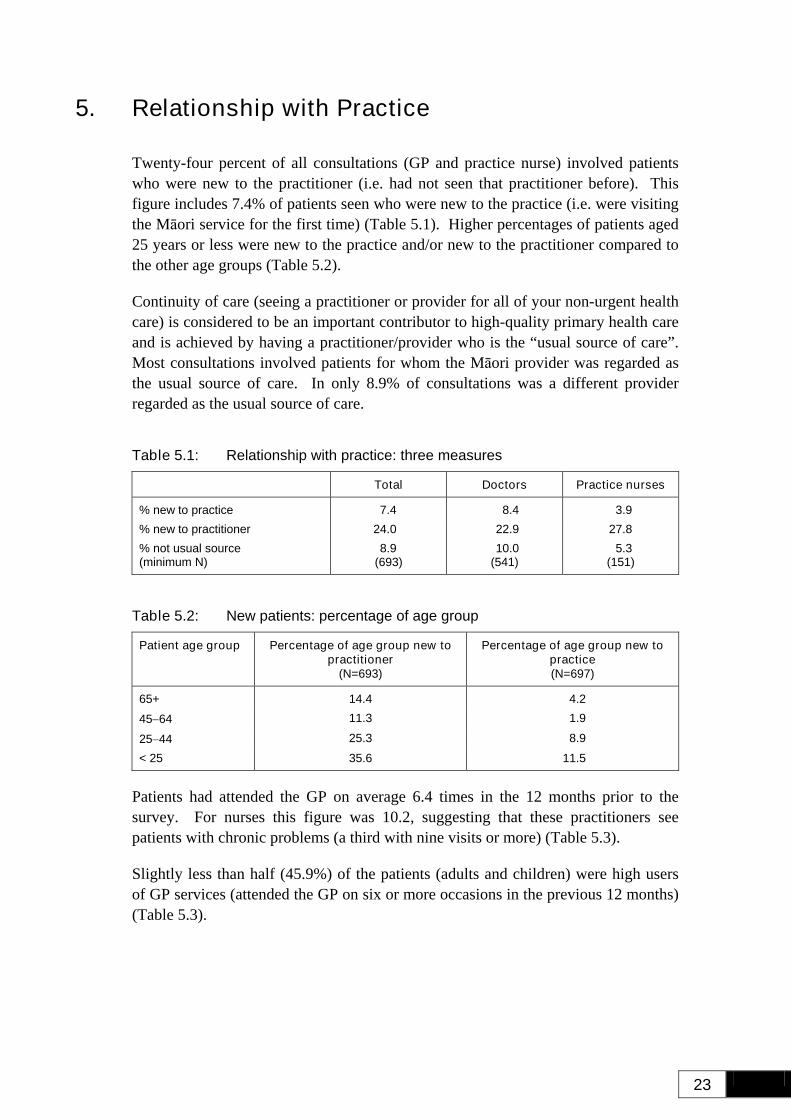
Twenty-four percent of all consultations (GP and practice nurse) involved patients who were new to the practitioner (i.e. had not seen that practitioner before). This figure includes 7.4% of patients seen who were new to the practice (i.e. were visiting the Māori service for the first time) (Table 5.1). Higher percentages of patients aged 25 years or less were new to the practice and/or new to the practitioner compared to the other age groups (Table 5.2).
Continuity of care (seeing a practitioner or provider for all of your non-urgent health care) is considered to be an important contributor to high-quality primary health care and is achieved by having a practitioner/provider who is the “usual source of care”. Most consultations involved patients for whom the Māori provider was regarded as the usual source of care. In only 8.9% of consultations was a different provider regarded as the usual source of care.
Table 5.1: Relationship with practice: three measures
Total Doctors Practice nurses
% new to practice 7.4 8.4 3.9 % new to practitioner 24.0 22.9 27.8 % not usual source (minimum N)
8.9 (693)
10.0 (541)
5.3 (151)
Table 5.2: New patients: percentage of age group
Patient age group Percentage of age group new to practitioner
(N=693)
Percentage of age group new to practice (N=697)
65+ 14.4 4.2 45−64 11.3 1.9
25−44 25.3 8.9 < 25 35.6 11.5
Patients had attended the GP on average 6.4 times in the 12 months prior to the survey. For nurses this figure was 10.2, suggesting that these practitioners see patients with chronic problems (a third with nine visits or more) (Table 5.3).
Slightly less than half (45.9%) of the patients (adults and children) were high users of GP services (attended the GP on six or more occasions in the previous 12 months) (Table 5.3).
24
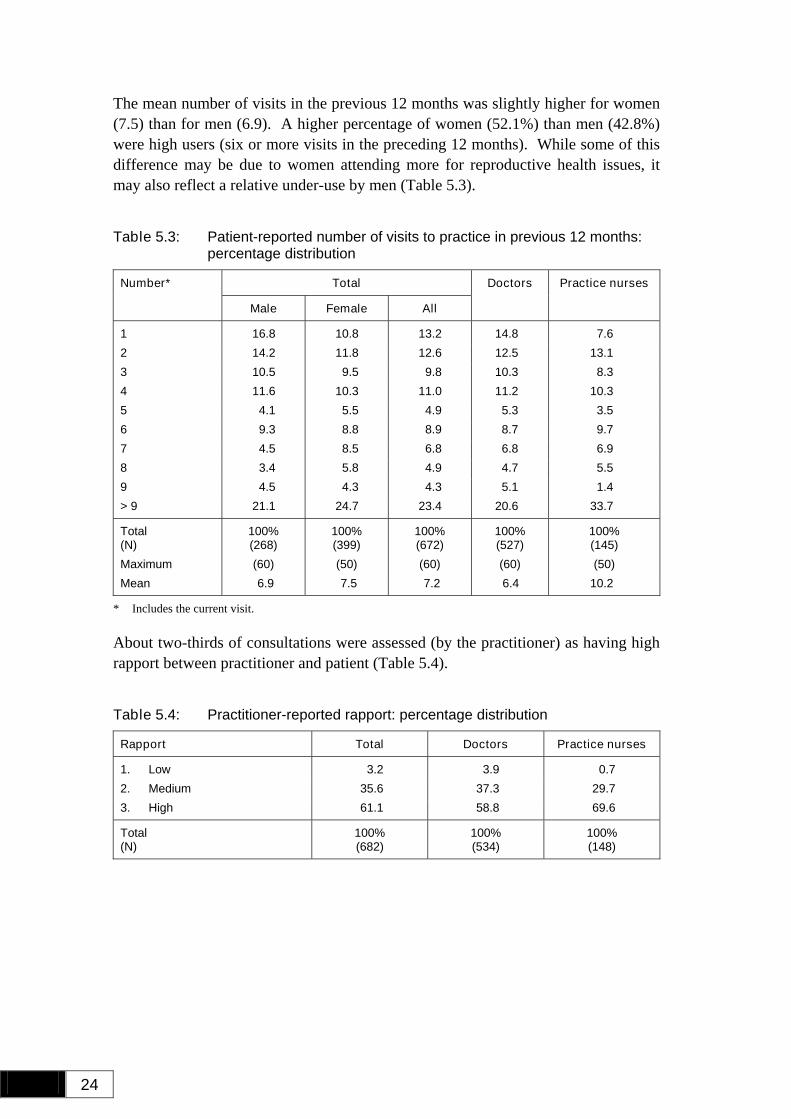
The mean number of visits in the previous 12 months was slightly higher for women (7.5) than for men (6.9). A higher percentage of women (52.1%) than men (42.8%) were high users (six or more visits in the preceding 12 months). While some of this difference may be due to women attending more for reproductive health issues, it may also reflect a relative under-use by men (Table 5.3).
Table 5.3: Patient-reported number of visits to practice in previous 12 months: percentage distribution
Total Number*
Male Female All
Doctors Practice nurses
1 16.8 10.8 13.2 14.8 7.6 2 14.2 11.8 12.6 12.5 13.1 3 10.5 9.5 9.8 10.3 8.3 4 11.6 10.3 11.0 11.2 10.3 5 4.1 5.5 4.9 5.3 3.5 6 9.3 8.8 8.9 8.7 9.7 7 4.5 8.5 6.8 6.8 6.9 8 3.4 5.8 4.9 4.7 5.5 9 4.5 4.3 4.3 5.1 1.4 > 9 21.1 24.7 23.4 20.6 33.7
Total (N)
100% (268)
100% (399)
100% (672)
100% (527)
100% (145)
Maximum (60) (50) (60) (60) (50) Mean 6.9 7.5 7.2 6.4 10.2
* Includes the current visit.
About two-thirds of consultations were assessed (by the practitioner) as having high rapport between practitioner and patient (Table 5.4).
Table 5.4: Practitioner-reported rapport: percentage distribution
Rapport Total Doctors Practice nurses
1. Low 3.2 3.9 0.7 2. Medium 35.6 37.3 29.7 3. High 61.1 58.8 69.6
Total (N)
100% (682)
100% (534)
100% (148)
25
6. Visit Characteristics
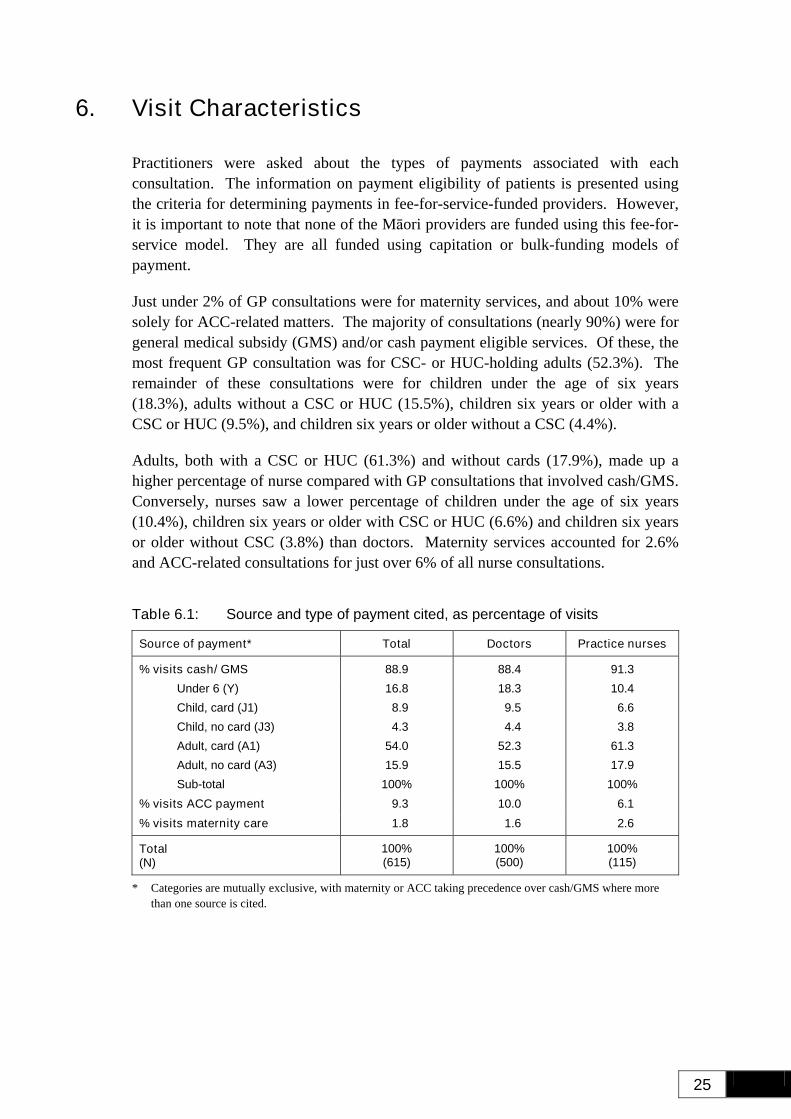
Practitioners were asked about the types of payments associated with each consultation. The information on payment eligibility of patients is presented using the criteria for determining payments in fee-for-service-funded providers. However, it is important to note that none of the Māori providers are funded using this fee-for-service model. They are all funded using capitation or bulk-funding models of payment.
Just under 2% of GP consultations were for maternity services, and about 10% were solely for ACC-related matters. The majority of consultations (nearly 90%) were for general medical subsidy (GMS) and/or cash payment eligible services. Of these, the most frequent GP consultation was for CSC- or HUC-holding adults (52.3%). The remainder of these consultations were for children under the age of six years (18.3%), adults without a CSC or HUC (15.5%), children six years or older with a CSC or HUC (9.5%), and children six years or older without a CSC (4.4%).
Adults, both with a CSC or HUC (61.3%) and without cards (17.9%), made up a higher percentage of nurse compared with GP consultations that involved cash/GMS. Conversely, nurses saw a lower percentage of children under the age of six years (10.4%), children six years or older with CSC or HUC (6.6%) and children six years or older without CSC (3.8%) than doctors. Maternity services accounted for 2.6% and ACC-related consultations for just over 6% of all nurse consultations.
Table 6.1: Source and type of payment cited, as percentage of visits
Source of payment* Total Doctors Practice nurses
% visits cash/ GMS 88.9 88.4 91.3 Under 6 (Y) Child, card (J1) Child, no card (J3) Adult, card (A1) Adult, no card (A3) Sub-total
16.8 8.9 4.3
54.0 15.9
100%
18.3 9.5 4.4
52.3 15.5
100%
10.4 6.6 3.8
61.3 17.9
100% % visits ACC payment 9.3 10.0 6.1 % visits maternity care 1.8 1.6 2.6
Total (N)
100% (615)
100% (500)
100% (115)
* Categories are mutually exclusive, with maternity or ACC taking precedence over cash/GMS where more than one source is cited.
26
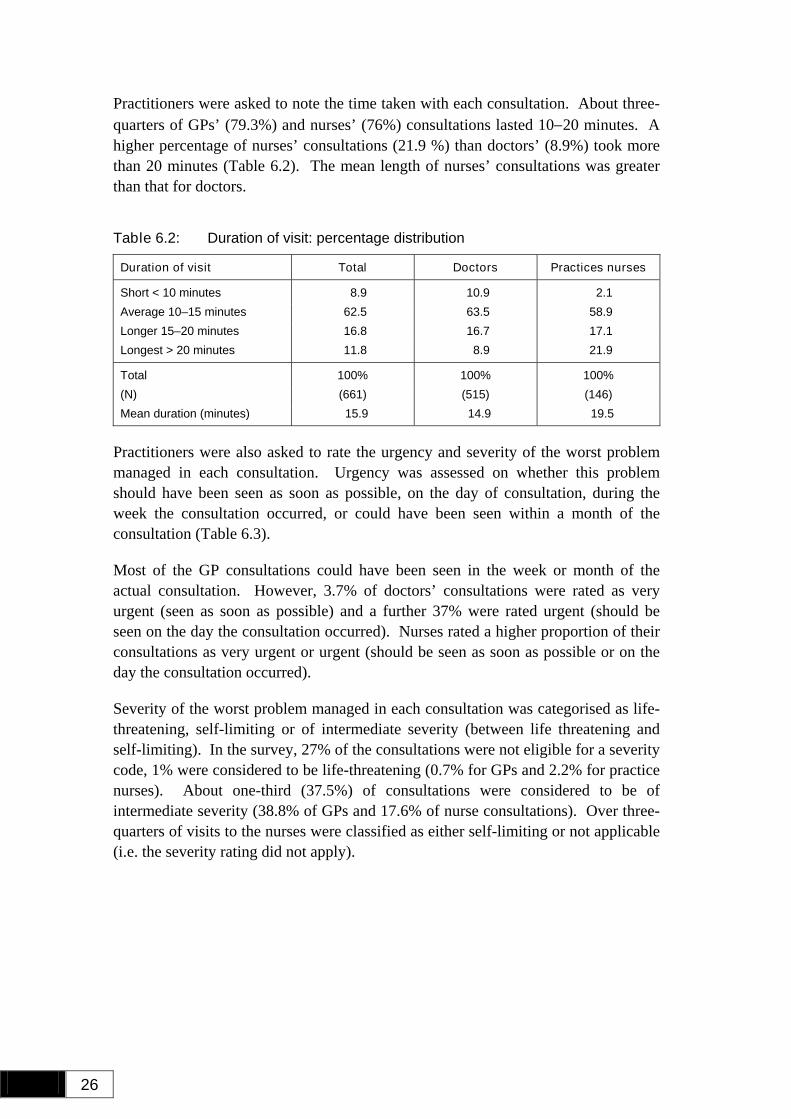
Practitioners were asked to note the time taken with each consultation. About three-quarters of GPs’ (79.3%) and nurses’ (76%) consultations lasted 10−20 minutes. A higher percentage of nurses’ consultations (21.9 %) than doctors’ (8.9%) took more than 20 minutes (Table 6.2). The mean length of nurses’ consultations was greater than that for doctors.
Table 6.2: Duration of visit: percentage distribution
Duration of visit Total Doctors Practices nurses
Short < 10 minutes 8.9 10.9 2.1 Average 10–15 minutes 62.5 63.5 58.9 Longer 15–20 minutes 16.8 16.7 17.1 Longest > 20 minutes 11.8 8.9 21.9
Total 100% 100% 100% (N) (661) (515) (146) Mean duration (minutes) 15.9 14.9 19.5
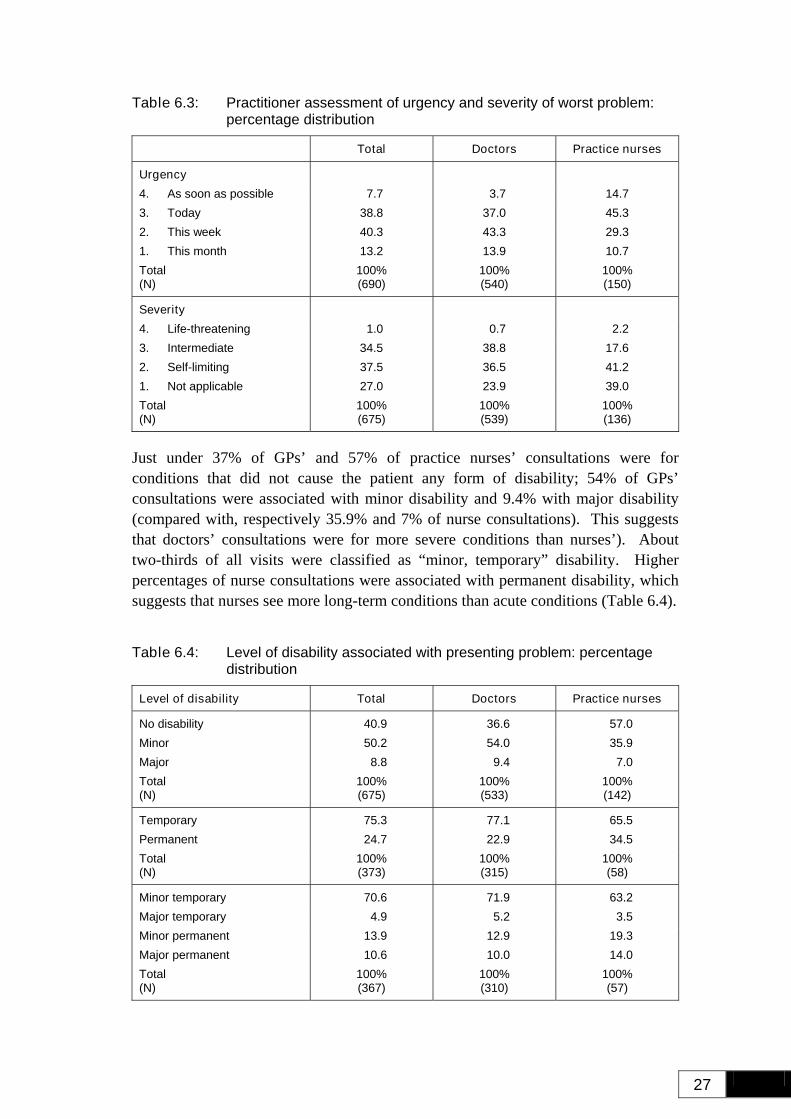
Practitioners were also asked to rate the urgency and severity of the worst problem managed in each consultation. Urgency was assessed on whether this problem should have been seen as soon as possible, on the day of consultation, during the week the consultation occurred, or could have been seen within a month of the consultation (Table 6.3).
Most of the GP consultations could have been seen in the week or month of the actual consultation. However, 3.7% of doctors’ consultations were rated as very urgent (seen as soon as possible) and a further 37% were rated urgent (should be seen on the day the consultation occurred). Nurses rated a higher proportion of their consultations as very urgent or urgent (should be seen as soon as possible or on the day the consultation occurred).
Severity of the worst problem managed in each consultation was categorised as life-threatening, self-limiting or of intermediate severity (between life threatening and self-limiting). In the survey, 27% of the consultations were not eligible for a severity code, 1% were considered to be life-threatening (0.7% for GPs and 2.2% for practice nurses). About one-third (37.5%) of consultations were considered to be of intermediate severity (38.8% of GPs and 17.6% of nurse consultations). Over three-quarters of visits to the nurses were classified as either self-limiting or not applicable (i.e. the severity rating did not apply).
27
Table 6.3: Practitioner assessment of urgency and severity of worst problem: percentage distribution
Total Doctors Practice nurses
Urgency 4. As soon as possible 7.7 3.7 14.7 3. Today 38.8 37.0 45.3 2. This week 40.3 43.3 29.3 1. This month 13.2 13.9 10.7 Total (N)
100% (690)
100% (540)
100% (150)
Severity 4. Life-threatening 1.0 0.7 2.2 3. Intermediate 34.5 38.8 17.6 2. Self-limiting 37.5 36.5 41.2 1. Not applicable 27.0 23.9 39.0 Total (N)
100% (675)
100% (539)
100% (136)
Just under 37% of GPs’ and 57% of practice nurses’ consultations were for conditions that did not cause the patient any form of disability; 54% of GPs’ consultations were associated with minor disability and 9.4% with major disability (compared with, respectively 35.9% and 7% of nurse consultations). This suggests that doctors’ consultations were for more severe conditions than nurses’). About two-thirds of all visits were classified as “minor, temporary” disability. Higher percentages of nurse consultations were associated with permanent disability, which suggests that nurses see more long-term conditions than acute conditions (Table 6.4).
Table 6.4: Level of disability associated with presenting problem: percentage distribution
Level of disability Total Doctors Practice nurses
No disability 40.9 36.6 57.0 Minor 50.2 54.0 35.9 Major 8.8 9.4 7.0 Total (N)
100% (675)
100% (533)
100% (142)
Temporary 75.3 77.1 65.5 Permanent 24.7 22.9 34.5 Total (N)
100% (373)
100% (315)
100% (58)
Minor temporary 70.6 71.9 63.2 Major temporary 4.9 5.2 3.5 Minor permanent 13.9 12.9 19.3 Major permanent 10.6 10.0 14.0 Total (N)
100% (367)
100% (310)
100% (57)
28
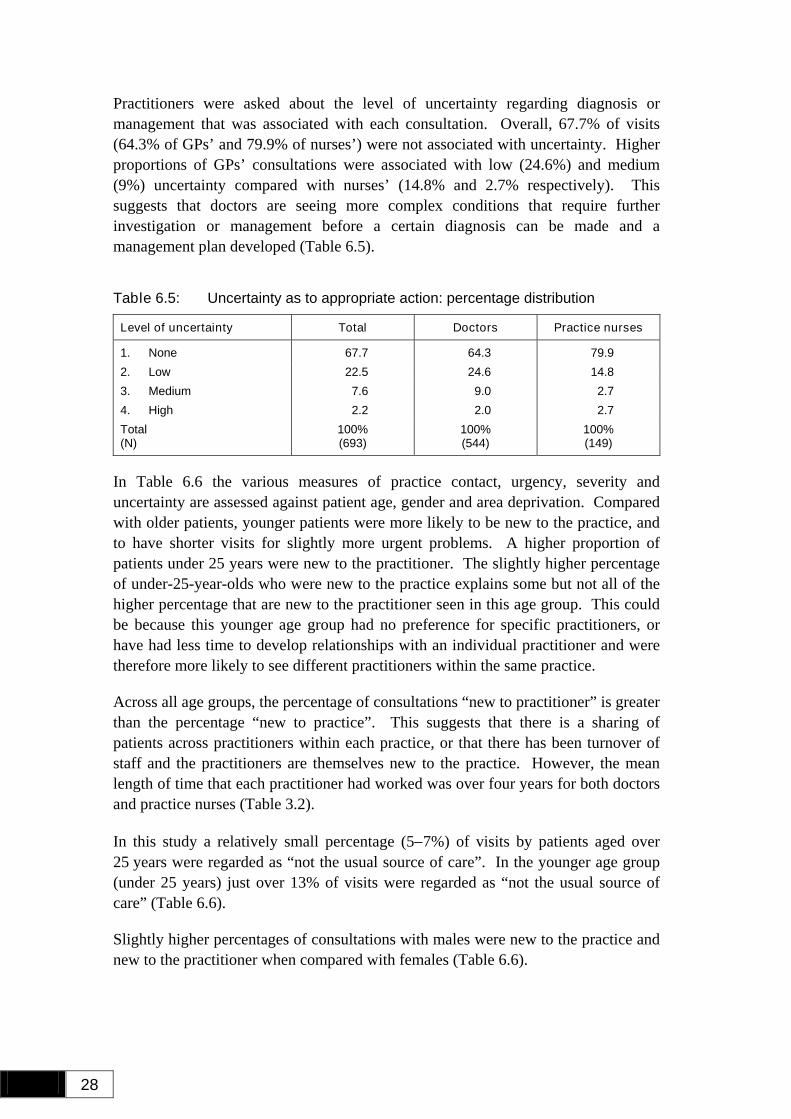
Practitioners were asked about the level of uncertainty regarding diagnosis or management that was associated with each consultation. Overall, 67.7% of visits (64.3% of GPs’ and 79.9% of nurses’) were not associated with uncertainty. Higher proportions of GPs’ consultations were associated with low (24.6%) and medium (9%) uncertainty compared with nurses’ (14.8% and 2.7% respectively). This suggests that doctors are seeing more complex conditions that require further investigation or management before a certain diagnosis can be made and a management plan developed (Table 6.5).
Table 6.5: Uncertainty as to appropriate action: percentage distribution
Level of uncertainty Total Doctors Practice nurses
1. None 67.7 64.3 79.9 2. Low 22.5 24.6 14.8 3. Medium 7.6 9.0 2.7 4. High 2.2 2.0 2.7 Total (N)
100% (693)
100% (544)
100% (149)
In Table 6.6 the various measures of practice contact, urgency, severity and uncertainty are assessed against patient age, gender and area deprivation. Compared with older patients, younger patients were more likely to be new to the practice, and to have shorter visits for slightly more urgent problems. A higher proportion of patients under 25 years were new to the practitioner. The slightly higher percentage of under-25-year-olds who were new to the practice explains some but not all of the higher percentage that are new to the practitioner seen in this age group. This could be because this younger age group had no preference for specific practitioners, or have had less time to develop relationships with an individual practitioner and were therefore more likely to see different practitioners within the same practice.
Across all age groups, the percentage of consultations “new to practitioner” is greater than the percentage “new to practice”. This suggests that there is a sharing of patients across practitioners within each practice, or that there has been turnover of staff and the practitioners are themselves new to the practice. However, the mean length of time that each practitioner had worked was over four years for both doctors and practice nurses (Table 3.2).
In this study a relatively small percentage (5−7%) of visits by patients aged over 25 years were regarded as “not the usual source of care”. In the younger age group (under 25 years) just over 13% of visits were regarded as “not the usual source of care” (Table 6.6).
Slightly higher percentages of consultations with males were new to the practice and new to the practitioner when compared with females (Table 6.6).
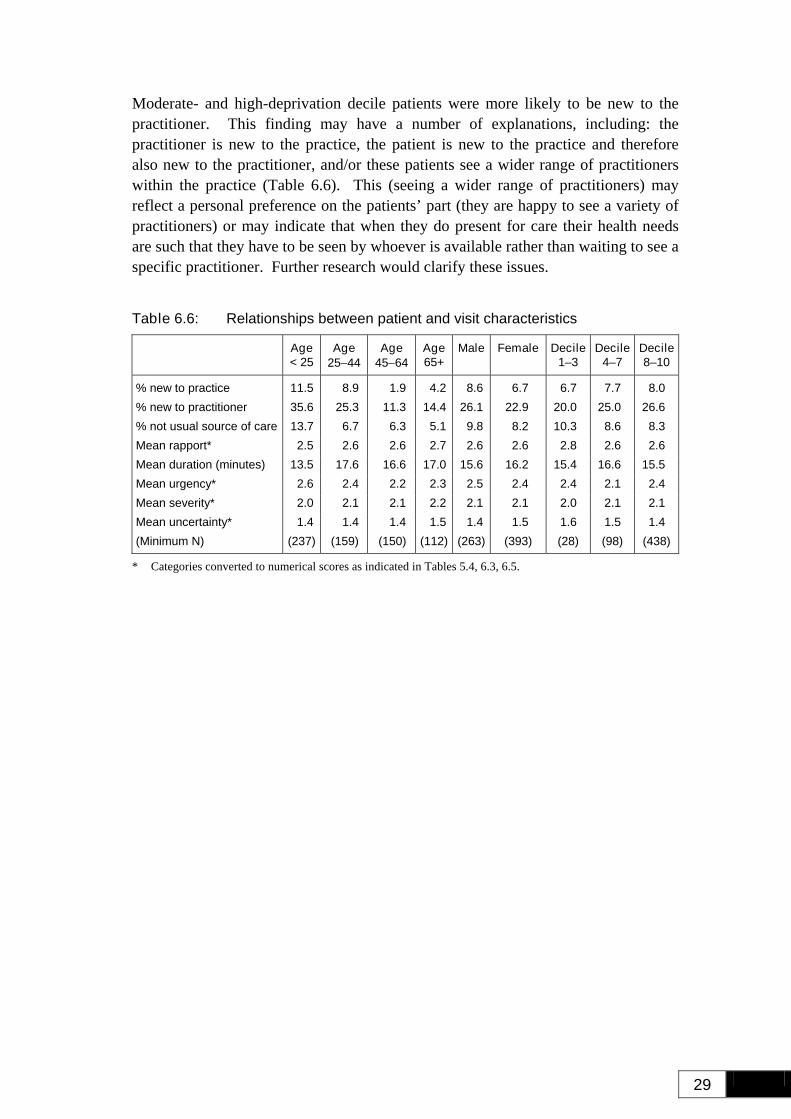
29
Moderate- and high-deprivation decile patients were more likely to be new to the practitioner. This finding may have a number of explanations, including: the practitioner is new to the practice, the patient is new to the practice and therefore also new to the practitioner, and/or these patients see a wider range of practitioners within the practice (Table 6.6). This (seeing a wider range of practitioners) may reflect a personal preference on the patients’ part (they are happy to see a variety of practitioners) or may indicate that when they do present for care their health needs are such that they have to be seen by whoever is available rather than waiting to see a specific practitioner. Further research would clarify these issues.
Table 6.6: Relationships between patient and visit characteristics
Age < 25
Age 25−44
Age 45−64
Age65+
Male Female Decile 1–3
Decile 4–7
Decile8–10
% new to practice 11.5 8.9 1.9 4.2 8.6 6.7 6.7 7.7 8.0 % new to practitioner 35.6 25.3 11.3 14.4 26.1 22.9 20.0 25.0 26.6 % not usual source of care 13.7 6.7 6.3 5.1 9.8 8.2 10.3 8.6 8.3 Mean rapport* 2.5 2.6 2.6 2.7 2.6 2.6 2.8 2.6 2.6 Mean duration (minutes) 13.5 17.6 16.6 17.0 15.6 16.2 15.4 16.6 15.5 Mean urgency* 2.6 2.4 2.2 2.3 2.5 2.4 2.4 2.1 2.4 Mean severity* 2.0 2.1 2.1 2.2 2.1 2.1 2.0 2.1 2.1 Mean uncertainty* 1.4 1.4 1.4 1.5 1.4 1.5 1.6 1.5 1.4 (Minimum N) (237) (159) (150) (112) (263) (393) (28) (98) (438)
* Categories converted to numerical scores as indicated in Tables 5.4, 6.3, 6.5.
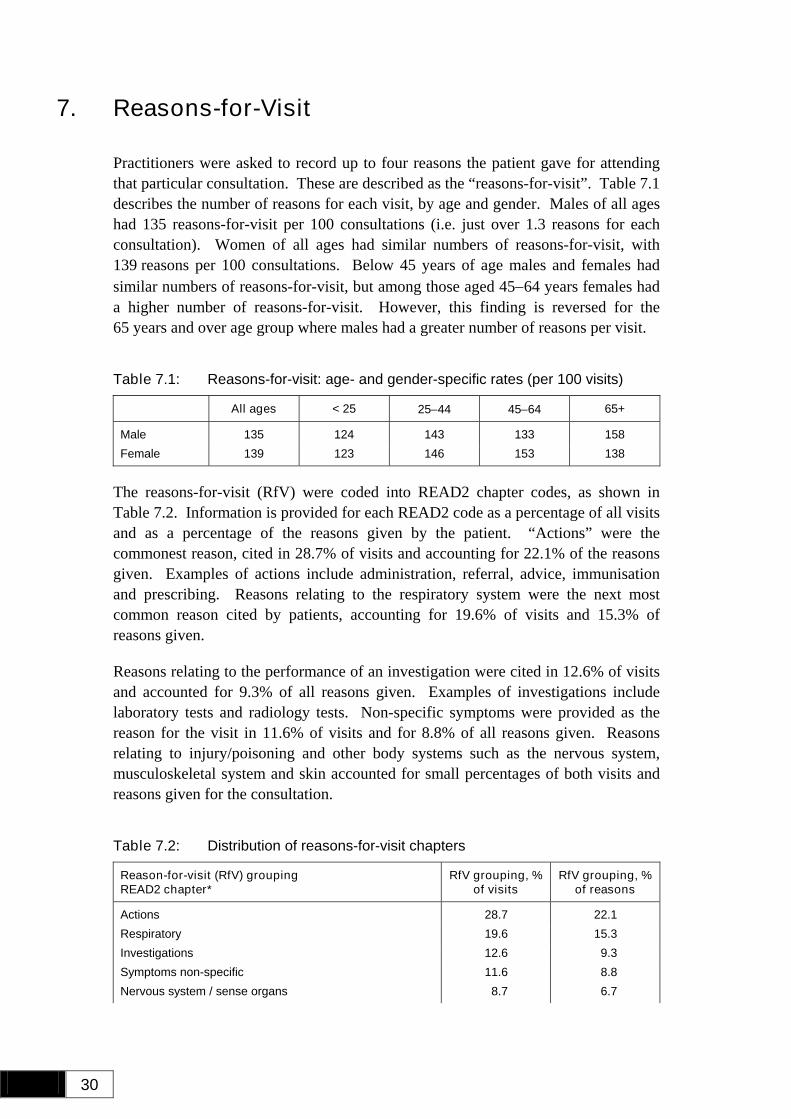
30
7. Reasons-for-Visit
Practitioners were asked to record up to four reasons the patient gave for attending that particular consultation. These are described as the “reasons-for-visit”. Table 7.1 describes the number of reasons for each visit, by age and gender. Males of all ages had 135 reasons-for-visit per 100 consultations (i.e. just over 1.3 reasons for each consultation). Women of all ages had similar numbers of reasons-for-visit, with 139 reasons per 100 consultations. Below 45 years of age males and females had similar numbers of reasons-for-visit, but among those aged 45−64 years females had a higher number of reasons-for-visit. However, this finding is reversed for the 65 years and over age group where males had a greater number of reasons per visit.
Table 7.1: Reasons-for-visit: age- and gender-specific rates (per 100 visits)
All ages < 25 25−44 45−64 65+
Male 135 124 143 133 158 Female 139 123 146 153 138
The reasons-for-visit (RfV) were coded into READ2 chapter codes, as shown in Table 7.2. Information is provided for each READ2 code as a percentage of all visits and as a percentage of the reasons given by the patient. “Actions” were the commonest reason, cited in 28.7% of visits and accounting for 22.1% of the reasons given. Examples of actions include administration, referral, advice, immunisation and prescribing. Reasons relating to the respiratory system were the next most common reason cited by patients, accounting for 19.6% of visits and 15.3% of reasons given.
Reasons relating to the performance of an investigation were cited in 12.6% of visits and accounted for 9.3% of all reasons given. Examples of investigations include laboratory tests and radiology tests. Non-specific symptoms were provided as the reason for the visit in 11.6% of visits and for 8.8% of all reasons given. Reasons relating to injury/poisoning and other body systems such as the nervous system, musculoskeletal system and skin accounted for small percentages of both visits and reasons given for the consultation.
Table 7.2: Distribution of reasons-for-visit chapters
Reason-for-visit (RfV) grouping READ2 chapter*
RfV grouping, % of visits
RfV grouping, % of reasons
Actions 28.7 22.1 Respiratory 19.6 15.3 Investigations 12.6 9.3 Symptoms non-specific 11.6 8.8 Nervous system / sense organs 8.7 6.7
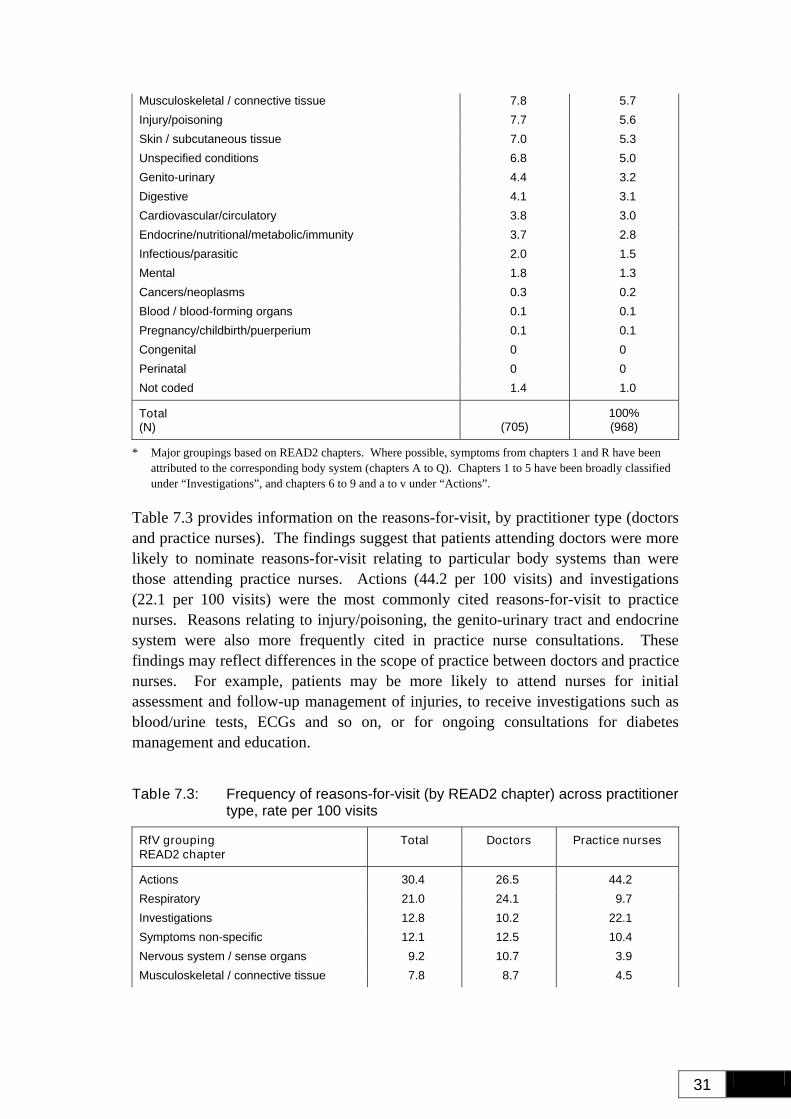
31
Musculoskeletal / connective tissue 7.8 5.7 Injury/poisoning 7.7 5.6 Skin / subcutaneous tissue 7.0 5.3 Unspecified conditions 6.8 5.0 Genito-urinary 4.4 3.2 Digestive 4.1 3.1 Cardiovascular/circulatory 3.8 3.0 Endocrine/nutritional/metabolic/immunity 3.7 2.8 Infectious/parasitic 2.0 1.5 Mental 1.8 1.3 Cancers/neoplasms 0.3 0.2 Blood / blood-forming organs 0.1 0.1 Pregnancy/childbirth/puerperium 0.1 0.1 Congenital 0 0 Perinatal 0 0 Not coded 1.4 1.0
Total (N)
(705)
100% (968)
* Major groupings based on READ2 chapters. Where possible, symptoms from chapters 1 and R have been attributed to the corresponding body system (chapters A to Q). Chapters 1 to 5 have been broadly classified under “Investigations”, and chapters 6 to 9 and a to v under “Actions”.
Table 7.3 provides information on the reasons-for-visit, by practitioner type (doctors and practice nurses). The findings suggest that patients attending doctors were more likely to nominate reasons-for-visit relating to particular body systems than were those attending practice nurses. Actions (44.2 per 100 visits) and investigations (22.1 per 100 visits) were the most commonly cited reasons-for-visit to practice nurses. Reasons relating to injury/poisoning, the genito-urinary tract and endocrine system were also more frequently cited in practice nurse consultations. These findings may reflect differences in the scope of practice between doctors and practice nurses. For example, patients may be more likely to attend nurses for initial assessment and follow-up management of injuries, to receive investigations such as blood/urine tests, ECGs and so on, or for ongoing consultations for diabetes management and education.
Table 7.3: Frequency of reasons-for-visit (by READ2 chapter) across practitioner type, rate per 100 visits
RfV grouping READ2 chapter
Total Doctors Practice nurses
Actions 30.4 26.5 44.2 Respiratory 21.0 24.1 9.7 Investigations 12.8 10.2 22.1 Symptoms non-specific 12.1 12.5 10.4 Nervous system / sense organs 9.2 10.7 3.9 Musculoskeletal / connective tissue 7.8 8.7 4.5
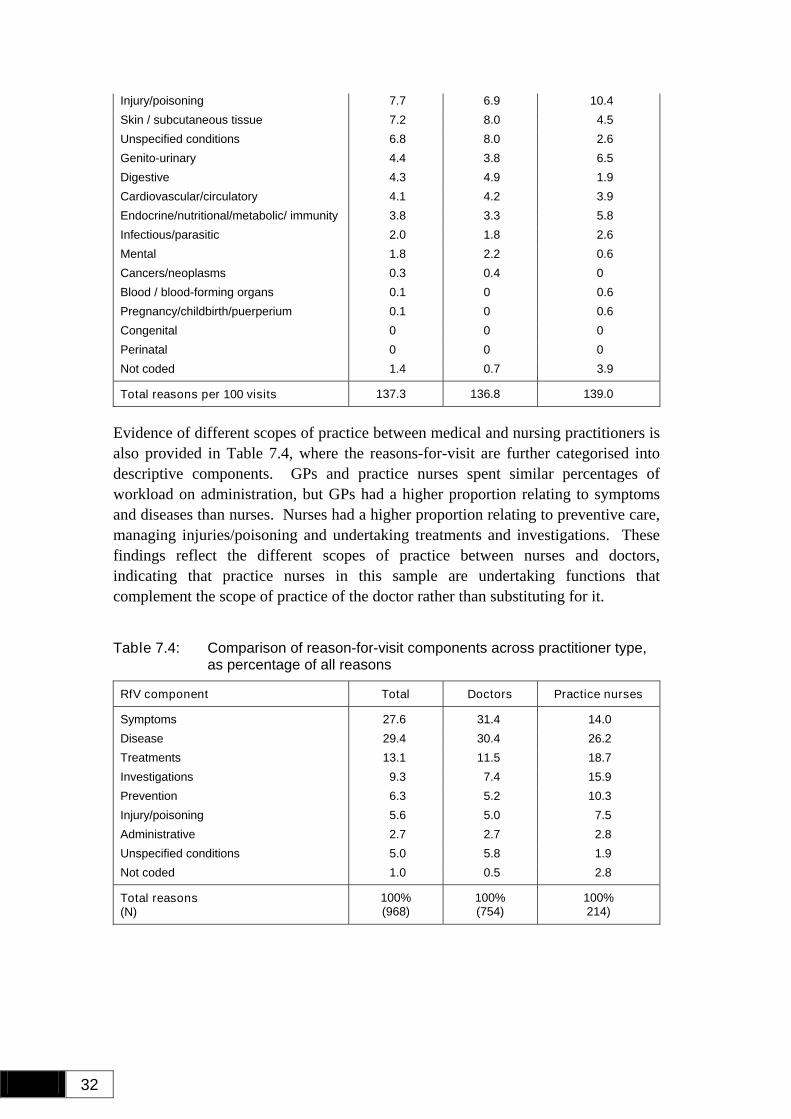
32
Injury/poisoning 7.7 6.9 10.4 Skin / subcutaneous tissue 7.2 8.0 4.5 Unspecified conditions 6.8 8.0 2.6 Genito-urinary 4.4 3.8 6.5 Digestive 4.3 4.9 1.9 Cardiovascular/circulatory 4.1 4.2 3.9 Endocrine/nutritional/metabolic/ immunity 3.8 3.3 5.8 Infectious/parasitic 2.0 1.8 2.6 Mental 1.8 2.2 0.6 Cancers/neoplasms 0.3 0.4 0 Blood / blood-forming organs 0.1 0 0.6 Pregnancy/childbirth/puerperium 0.1 0 0.6 Congenital 0 0 0 Perinatal 0 0 0 Not coded 1.4 0.7 3.9
Total reasons per 100 visits 137.3 136.8 139.0
Evidence of different scopes of practice between medical and nursing practitioners is also provided in Table 7.4, where the reasons-for-visit are further categorised into descriptive components. GPs and practice nurses spent similar percentages of workload on administration, but GPs had a higher proportion relating to symptoms and diseases than nurses. Nurses had a higher proportion relating to preventive care, managing injuries/poisoning and undertaking treatments and investigations. These findings reflect the different scopes of practice between nurses and doctors, indicating that practice nurses in this sample are undertaking functions that complement the scope of practice of the doctor rather than substituting for it.
Table 7.4: Comparison of reason-for-visit components across practitioner type, as percentage of all reasons
RfV component Total Doctors Practice nurses
Symptoms 27.6 31.4 14.0 Disease 29.4 30.4 26.2 Treatments 13.1 11.5 18.7 Investigations 9.3 7.4 15.9 Prevention 6.3 5.2 10.3 Injury/poisoning 5.6 5.0 7.5 Administrative 2.7 2.7 2.8 Unspecified conditions 5.0 5.8 1.9 Not coded 1.0 0.5 2.8
Total reasons (N)
100% (968)
100% (754)
100% 214)
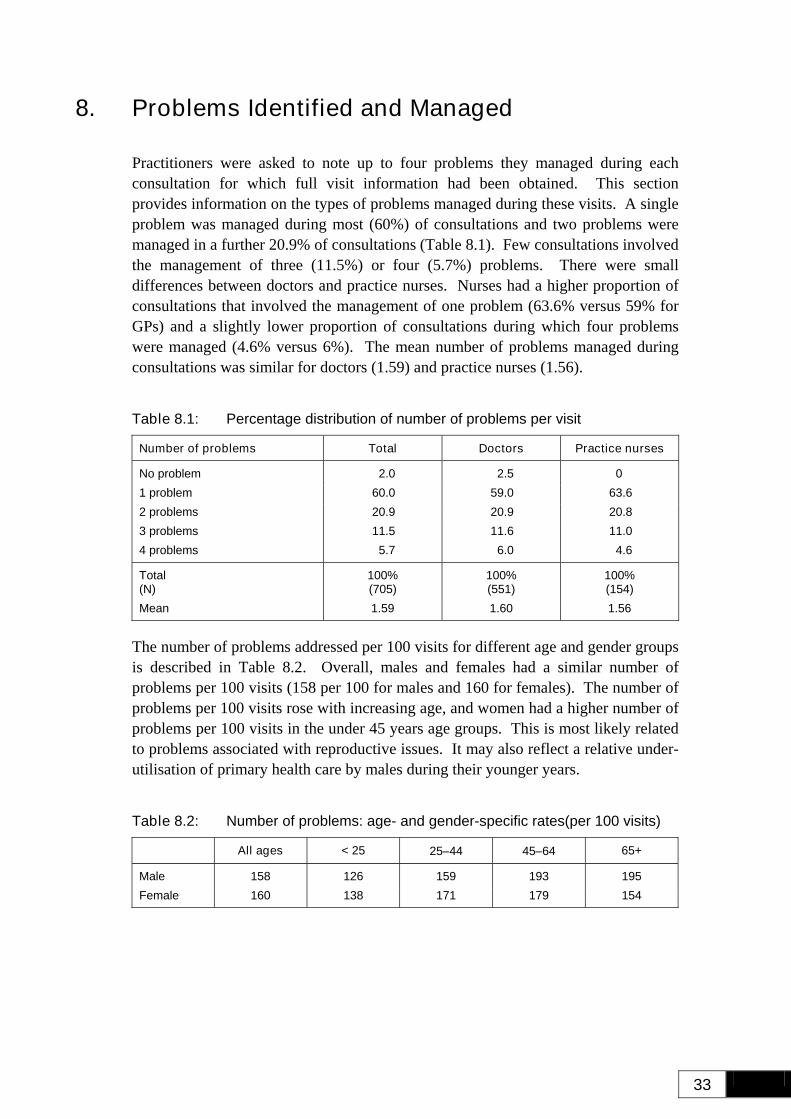
33
8. Problems Identified and Managed
Practitioners were asked to note up to four problems they managed during each consultation for which full visit information had been obtained. This section provides information on the types of problems managed during these visits. A single problem was managed during most (60%) of consultations and two problems were managed in a further 20.9% of consultations (Table 8.1). Few consultations involved the management of three (11.5%) or four (5.7%) problems. There were small differences between doctors and practice nurses. Nurses had a higher proportion of consultations that involved the management of one problem (63.6% versus 59% for GPs) and a slightly lower proportion of consultations during which four problems were managed (4.6% versus 6%). The mean number of problems managed during consultations was similar for doctors (1.59) and practice nurses (1.56).
Table 8.1: Percentage distribution of number of problems per visit
Number of problems Total Doctors Practice nurses
No problem 2.0 2.5 0 1 problem 60.0 59.0 63.6 2 problems 20.9 20.9 20.8 3 problems 11.5 11.6 11.0 4 problems 5.7 6.0 4.6
Total (N)
100% (705)
100% (551)
100% (154)
Mean 1.59 1.60 1.56
The number of problems addressed per 100 visits for different age and gender groups is described in Table 8.2. Overall, males and females had a similar number of problems per 100 visits (158 per 100 for males and 160 for females). The number of problems per 100 visits rose with increasing age, and women had a higher number of problems per 100 visits in the under 45 years age groups. This is most likely related to problems associated with reproductive issues. It may also reflect a relative under-utilisation of primary health care by males during their younger years.
Table 8.2: Number of problems: age- and gender-specific rates(per 100 visits)
All ages < 25 25−44 45−64 65+
Male 158 126 159 193 195 Female 160 138 171 179 154
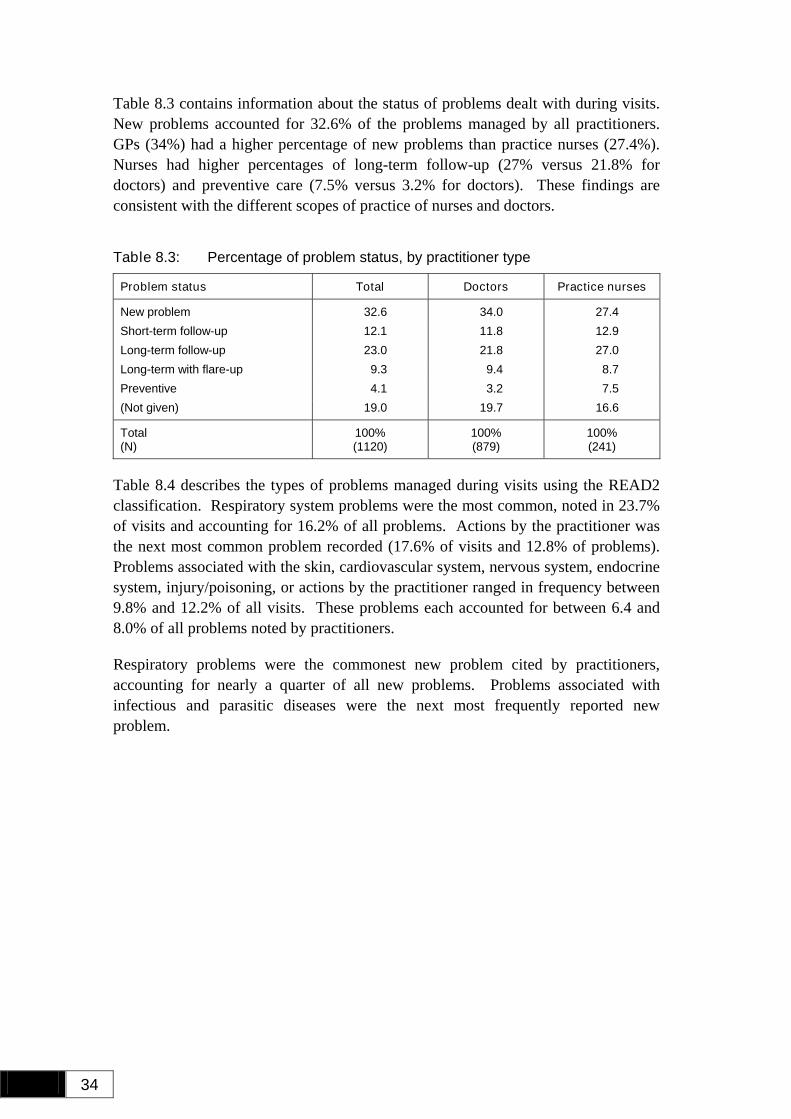
34
Table 8.3 contains information about the status of problems dealt with during visits. New problems accounted for 32.6% of the problems managed by all practitioners. GPs (34%) had a higher percentage of new problems than practice nurses (27.4%). Nurses had higher percentages of long-term follow-up (27% versus 21.8% for doctors) and preventive care (7.5% versus 3.2% for doctors). These findings are consistent with the different scopes of practice of nurses and doctors.
Table 8.3: Percentage of problem status, by practitioner type
Problem status Total Doctors Practice nurses
New problem 32.6 34.0 27.4 Short-term follow-up 12.1 11.8 12.9 Long-term follow-up 23.0 21.8 27.0 Long-term with flare-up 9.3 9.4 8.7 Preventive 4.1 3.2 7.5 (Not given) 19.0 19.7 16.6
Total (N)
100% (1120)
100% (879)
100% (241)
Table 8.4 describes the types of problems managed during visits using the READ2 classification. Respiratory system problems were the most common, noted in 23.7% of visits and accounting for 16.2% of all problems. Actions by the practitioner was the next most common problem recorded (17.6% of visits and 12.8% of problems). Problems associated with the skin, cardiovascular system, nervous system, endocrine system, injury/poisoning, or actions by the practitioner ranged in frequency between 9.8% and 12.2% of all visits. These problems each accounted for between 6.4 and 8.0% of all problems noted by practitioners.
Respiratory problems were the commonest new problem cited by practitioners, accounting for nearly a quarter of all new problems. Problems associated with infectious and parasitic diseases were the next most frequently reported new problem.
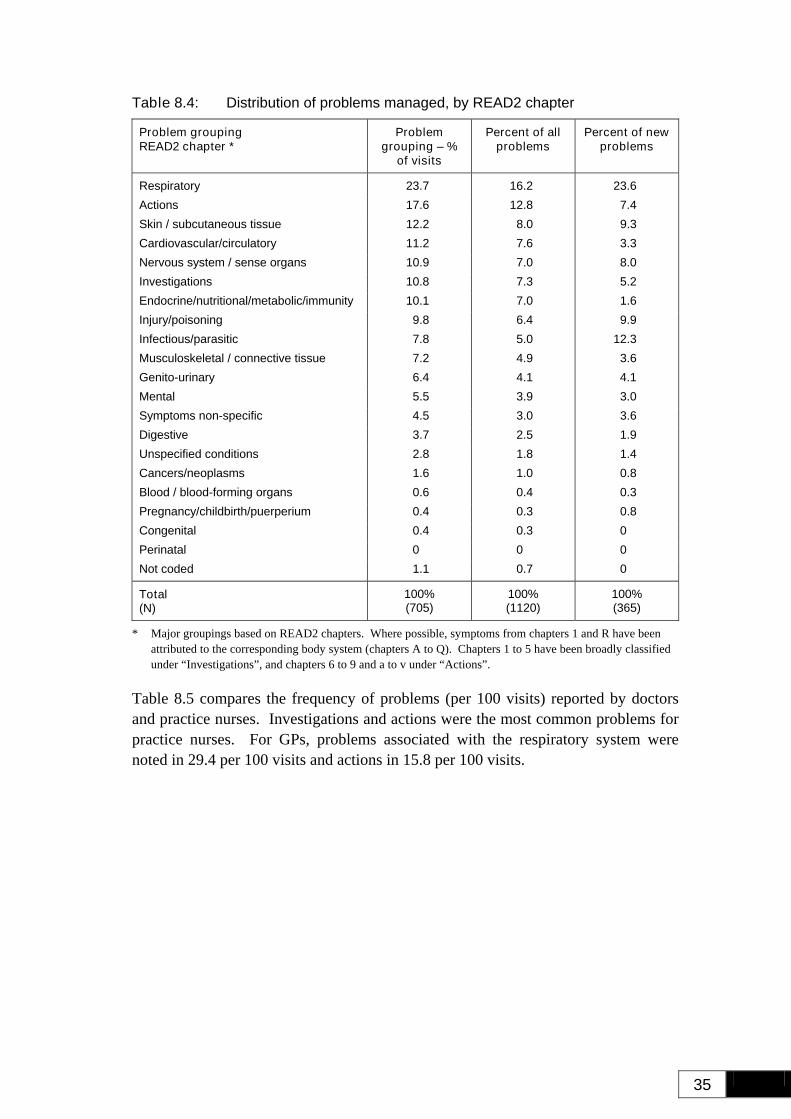
35
Table 8.4: Distribution of problems managed, by READ2 chapter
Problem grouping READ2 chapter *
Problem grouping – %
of visits
Percent of all problems
Percent of new problems
Respiratory 23.7 16.2 23.6 Actions 17.6 12.8 7.4 Skin / subcutaneous tissue 12.2 8.0 9.3 Cardiovascular/circulatory 11.2 7.6 3.3 Nervous system / sense organs 10.9 7.0 8.0 Investigations 10.8 7.3 5.2 Endocrine/nutritional/metabolic/immunity 10.1 7.0 1.6 Injury/poisoning 9.8 6.4 9.9 Infectious/parasitic 7.8 5.0 12.3 Musculoskeletal / connective tissue 7.2 4.9 3.6 Genito-urinary 6.4 4.1 4.1 Mental 5.5 3.9 3.0 Symptoms non-specific 4.5 3.0 3.6 Digestive 3.7 2.5 1.9 Unspecified conditions 2.8 1.8 1.4 Cancers/neoplasms 1.6 1.0 0.8 Blood / blood-forming organs 0.6 0.4 0.3 Pregnancy/childbirth/puerperium 0.4 0.3 0.8 Congenital 0.4 0.3 0 Perinatal 0 0 0 Not coded 1.1 0.7 0
Total (N)
100% (705)
100% (1120)
100% (365)
* Major groupings based on READ2 chapters. Where possible, symptoms from chapters 1 and R have been attributed to the corresponding body system (chapters A to Q). Chapters 1 to 5 have been broadly classified under “Investigations”, and chapters 6 to 9 and a to v under “Actions”.
Table 8.5 compares the frequency of problems (per 100 visits) reported by doctors and practice nurses. Investigations and actions were the most common problems for practice nurses. For GPs, problems associated with the respiratory system were noted in 29.4 per 100 visits and actions in 15.8 per 100 visits.
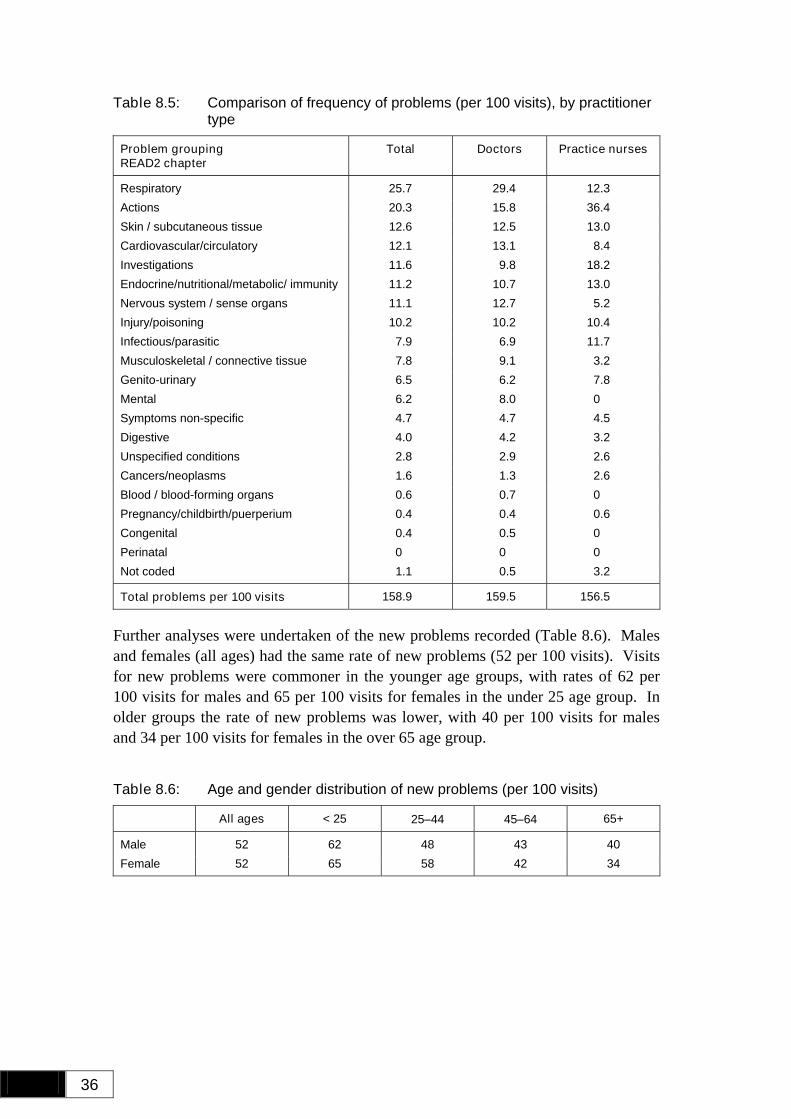
36
Table 8.5: Comparison of frequency of problems (per 100 visits), by practitioner type
Problem grouping READ2 chapter
Total Doctors Practice nurses
Respiratory 25.7 29.4 12.3 Actions 20.3 15.8 36.4 Skin / subcutaneous tissue 12.6 12.5 13.0 Cardiovascular/circulatory 12.1 13.1 8.4 Investigations 11.6 9.8 18.2 Endocrine/nutritional/metabolic/ immunity 11.2 10.7 13.0 Nervous system / sense organs 11.1 12.7 5.2 Injury/poisoning 10.2 10.2 10.4 Infectious/parasitic 7.9 6.9 11.7 Musculoskeletal / connective tissue 7.8 9.1 3.2 Genito-urinary 6.5 6.2 7.8 Mental 6.2 8.0 0 Symptoms non-specific 4.7 4.7 4.5 Digestive 4.0 4.2 3.2 Unspecified conditions 2.8 2.9 2.6 Cancers/neoplasms 1.6 1.3 2.6 Blood / blood-forming organs 0.6 0.7 0 Pregnancy/childbirth/puerperium 0.4 0.4 0.6 Congenital 0.4 0.5 0 Perinatal 0 0 0 Not coded 1.1 0.5 3.2
Total problems per 100 visits 158.9 159.5 156.5
Further analyses were undertaken of the new problems recorded (Table 8.6). Males and females (all ages) had the same rate of new problems (52 per 100 visits). Visits for new problems were commoner in the younger age groups, with rates of 62 per 100 visits for males and 65 per 100 visits for females in the under 25 age group. In older groups the rate of new problems was lower, with 40 per 100 visits for males and 34 per 100 visits for females in the over 65 age group.
Table 8.6: Age and gender distribution of new problems (per 100 visits)
All ages < 25 25−44 45−64 65+
Male 52 62 48 43 40 Female 52 65 58 42 34
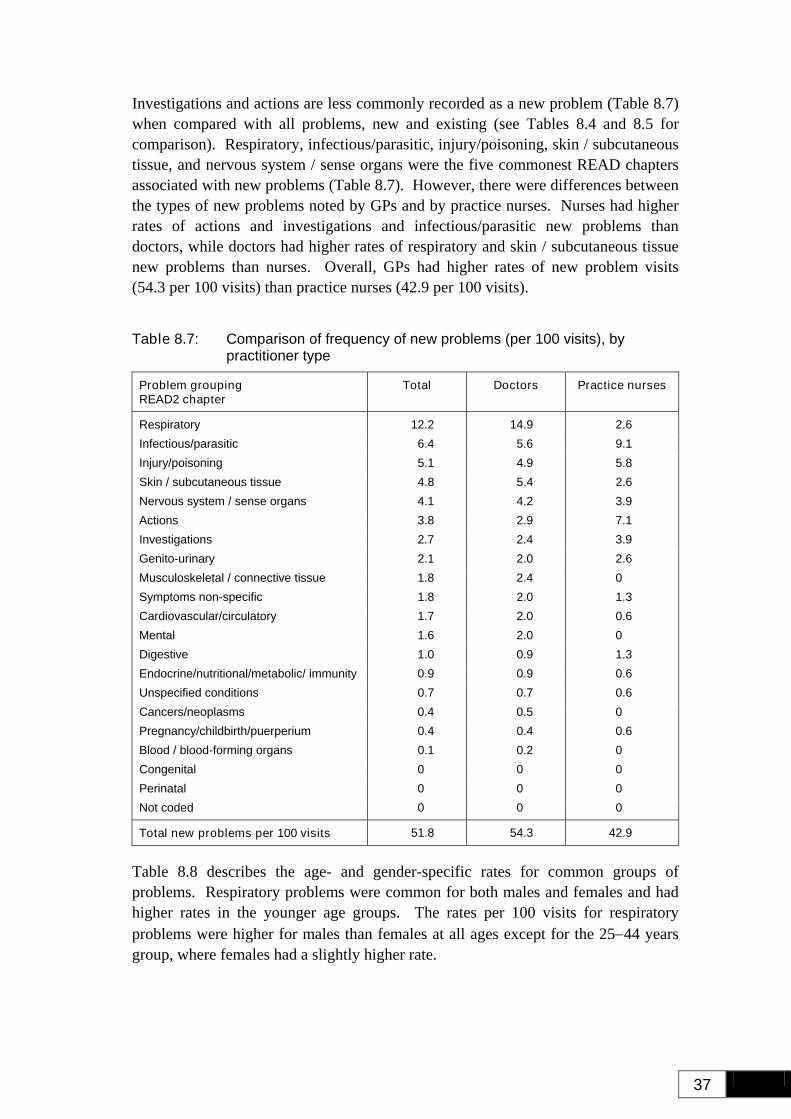
37
Investigations and actions are less commonly recorded as a new problem (Table 8.7) when compared with all problems, new and existing (see Tables 8.4 and 8.5 for comparison). Respiratory, infectious/parasitic, injury/poisoning, skin / subcutaneous tissue, and nervous system / sense organs were the five commonest READ chapters associated with new problems (Table 8.7). However, there were differences between the types of new problems noted by GPs and by practice nurses. Nurses had higher rates of actions and investigations and infectious/parasitic new problems than doctors, while doctors had higher rates of respiratory and skin / subcutaneous tissue new problems than nurses. Overall, GPs had higher rates of new problem visits (54.3 per 100 visits) than practice nurses (42.9 per 100 visits).
Table 8.7: Comparison of frequency of new problems (per 100 visits), by practitioner type
Problem grouping READ2 chapter
Total Doctors Practice nurses
Respiratory 12.2 14.9 2.6 Infectious/parasitic 6.4 5.6 9.1 Injury/poisoning 5.1 4.9 5.8 Skin / subcutaneous tissue 4.8 5.4 2.6 Nervous system / sense organs 4.1 4.2 3.9 Actions 3.8 2.9 7.1 Investigations 2.7 2.4 3.9 Genito-urinary 2.1 2.0 2.6 Musculoskeletal / connective tissue 1.8 2.4 0 Symptoms non-specific 1.8 2.0 1.3 Cardiovascular/circulatory 1.7 2.0 0.6 Mental 1.6 2.0 0 Digestive 1.0 0.9 1.3 Endocrine/nutritional/metabolic/ immunity 0.9 0.9 0.6 Unspecified conditions 0.7 0.7 0.6 Cancers/neoplasms 0.4 0.5 0 Pregnancy/childbirth/puerperium 0.4 0.4 0.6 Blood / blood-forming organs 0.1 0.2 0 Congenital 0 0 0 Perinatal 0 0 0 Not coded 0 0 0
Total new problems per 100 visits 51.8 54.3 42.9
Table 8.8 describes the age- and gender-specific rates for common groups of problems. Respiratory problems were common for both males and females and had higher rates in the younger age groups. The rates per 100 visits for respiratory problems were higher for males than females at all ages except for the 25−44 years group, where females had a slightly higher rate.
38
For skin problems, rates were similar for both genders (15 per 100 visits for males and 11 per 100 visits for females) apart from the 25−44 and over 65 years age groups, where males had higher rates of skin problems.
For cardiovascular problems, over all ages rates were higher in males than in females. Rates also rose with increasing age. These findings are consistent with current epidemiological knowledge.
In general, rates of nervous system / sense organ problems were low and similar for both genders and all age groups, except for males aged 25−44 (who had a much higher rate, 27 per 100 visits).
Rates of injury and poisoning were higher for males than females, with the exception of the over 65 years age group (where there were similar rates). For males the rate of injury/poisoning problems reduced over 65 years of age. This pattern was not evident for females, for whom the rates remained similar across all age groups.
The rates of endocrine/nutritional/metabolic/immunity problems for males and females (all ages combined) were the same. The rate increased with age until 65 years and over, which had lower rates than the 45−64 years group. The pattern of increase with age is to be expected as the prevalence of conditions in this category (such as diabetes and obesity) rises with age. The lower rates in the over 65 years group is not expected, and may reflect the higher Māori mortality rates in the 45−64 years age group (i.e. people with diabetes may have higher mortality rates in the 45−64 years age group and therefore do not survive to be 65 years or older).
For infectious/parasitic problems, the overall rates (all ages) for males and females were the same (8 per 100 visits). However, these problems were more common in the young (under 25 years). Rates of musculoskeletal problems were low for both males and females. There were no clear gender- or age-related patterns in the rates of these types of problems. However, rates of genito-urinary problems were higher in females of all ages. In females the rates peaked in the 25−44 years age group.
Overall rates of mental health problems were similar for males and females (7 per 100 for females and 5 per 100 visits for males). For both males and females the rates were highest in the 25−44 years age groups.
Age- and gender-specific rates of digestive and cancer/neoplasms were low. For digestive problems there were no apparent age-related trends, but the rates of digestive problems may be higher in females. It is difficult to comment on age and gender patterns for cancer/neoplasm problems as the rates are so low that there may be some degree of inaccuracy due to the relatively small numbers of visits in this section of the survey.
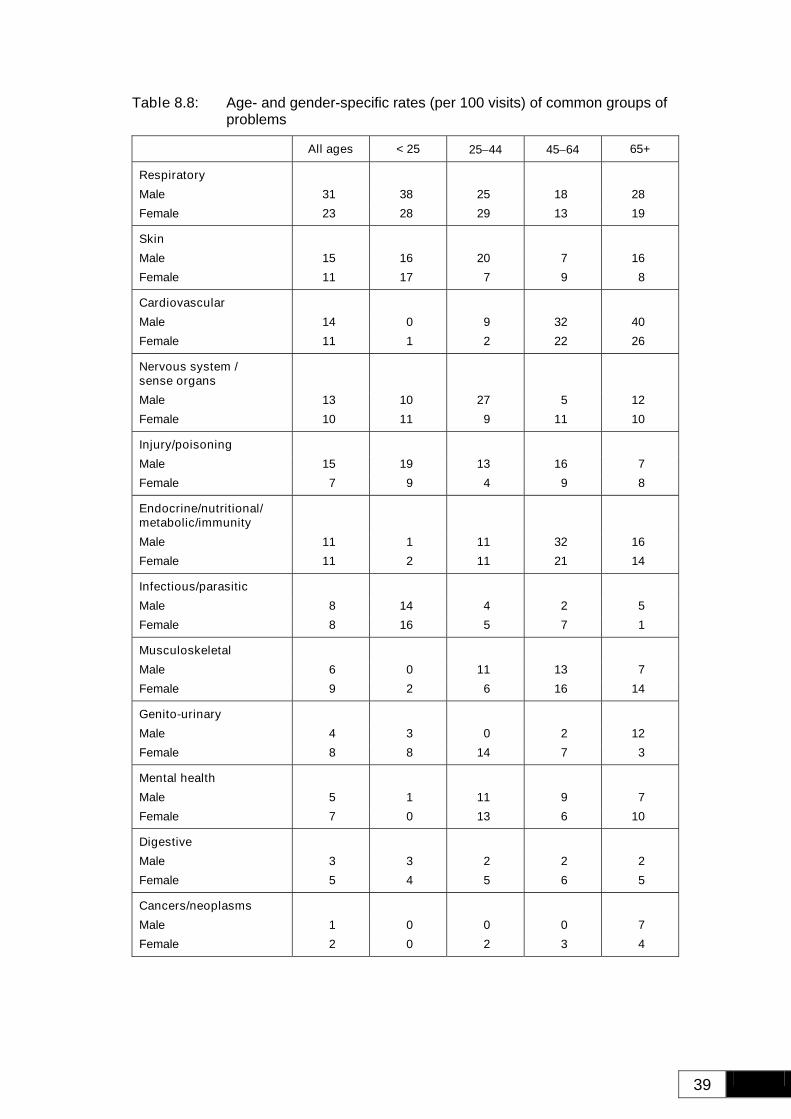
39
Table 8.8: Age- and gender-specific rates (per 100 visits) of common groups of problems
All ages < 25 25−44 45−64 65+
Respiratory Male 31 38 25 18 28 Female 23 28 29 13 19
Skin Male 15 16 20 7 16 Female 11 17 7 9 8
Cardiovascular Male 14 0 9 32 40 Female 11 1 2 22 26
Nervous system / sense organs
Male 13 10 27 5 12 Female 10 11 9 11 10
Injury/poisoning Male 15 19 13 16 7 Female 7 9 4 9 8
Endocrine/nutritional/ metabolic/immunity
Male 11 1 11 32 16 Female 11 2 11 21 14
Infectious/parasitic Male 8 14 4 2 5 Female 8 16 5 7 1
Musculoskeletal Male 6 0 11 13 7 Female 9 2 6 16 14
Genito-urinary Male 4 3 0 2 12 Female 8 8 14 7 3
Mental health Male 5 1 11 9 7 Female 7 0 13 6 10
Digestive Male 3 3 2 2 2 Female 5 4 5 6 5
Cancers/neoplasms Male 1 0 0 0 7 Female 2 0 2 3 4
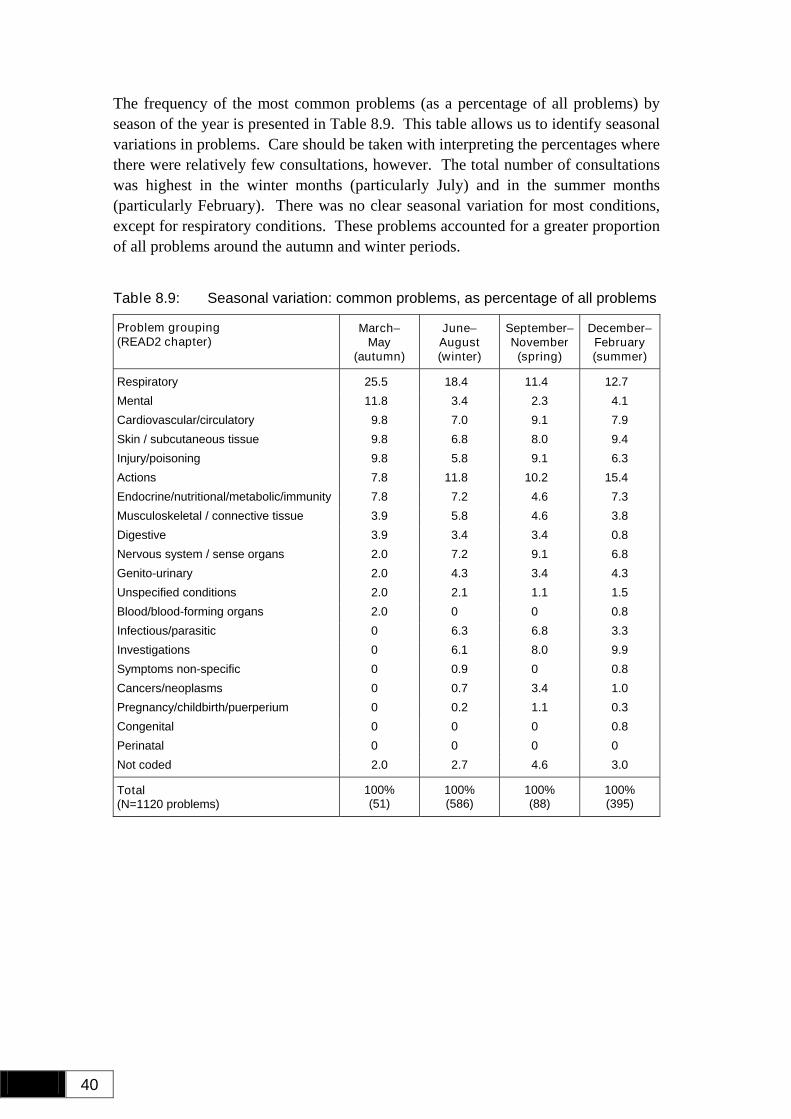
40
The frequency of the most common problems (as a percentage of all problems) by season of the year is presented in Table 8.9. This table allows us to identify seasonal variations in problems. Care should be taken with interpreting the percentages where there were relatively few consultations, however. The total number of consultations was highest in the winter months (particularly July) and in the summer months (particularly February). There was no clear seasonal variation for most conditions, except for respiratory conditions. These problems accounted for a greater proportion of all problems around the autumn and winter periods.
Table 8.9: Seasonal variation: common problems, as percentage of all problems
Problem grouping (READ2 chapter)
March− May
(autumn)
June− August (winter)
September− November
(spring)
December− February (summer)
Respiratory 25.5 18.4 11.4 12.7 Mental 11.8 3.4 2.3 4.1 Cardiovascular/circulatory 9.8 7.0 9.1 7.9 Skin / subcutaneous tissue 9.8 6.8 8.0 9.4 Injury/poisoning 9.8 5.8 9.1 6.3 Actions 7.8 11.8 10.2 15.4 Endocrine/nutritional/metabolic/immunity 7.8 7.2 4.6 7.3 Musculoskeletal / connective tissue 3.9 5.8 4.6 3.8 Digestive 3.9 3.4 3.4 0.8 Nervous system / sense organs 2.0 7.2 9.1 6.8 Genito-urinary 2.0 4.3 3.4 4.3 Unspecified conditions 2.0 2.1 1.1 1.5 Blood/blood-forming organs 2.0 0 0 0.8 Infectious/parasitic 0 6.3 6.8 3.3 Investigations 0 6.1 8.0 9.9 Symptoms non-specific 0 0.9 0 0.8 Cancers/neoplasms 0 0.7 3.4 1.0 Pregnancy/childbirth/puerperium 0 0.2 1.1 0.3 Congenital 0 0 0 0.8 Perinatal 0 0 0 0 Not coded 2.0 2.7 4.6 3.0
Total (N=1120 problems)
100% (51)
100% (586)
100% (88)
100% (395)
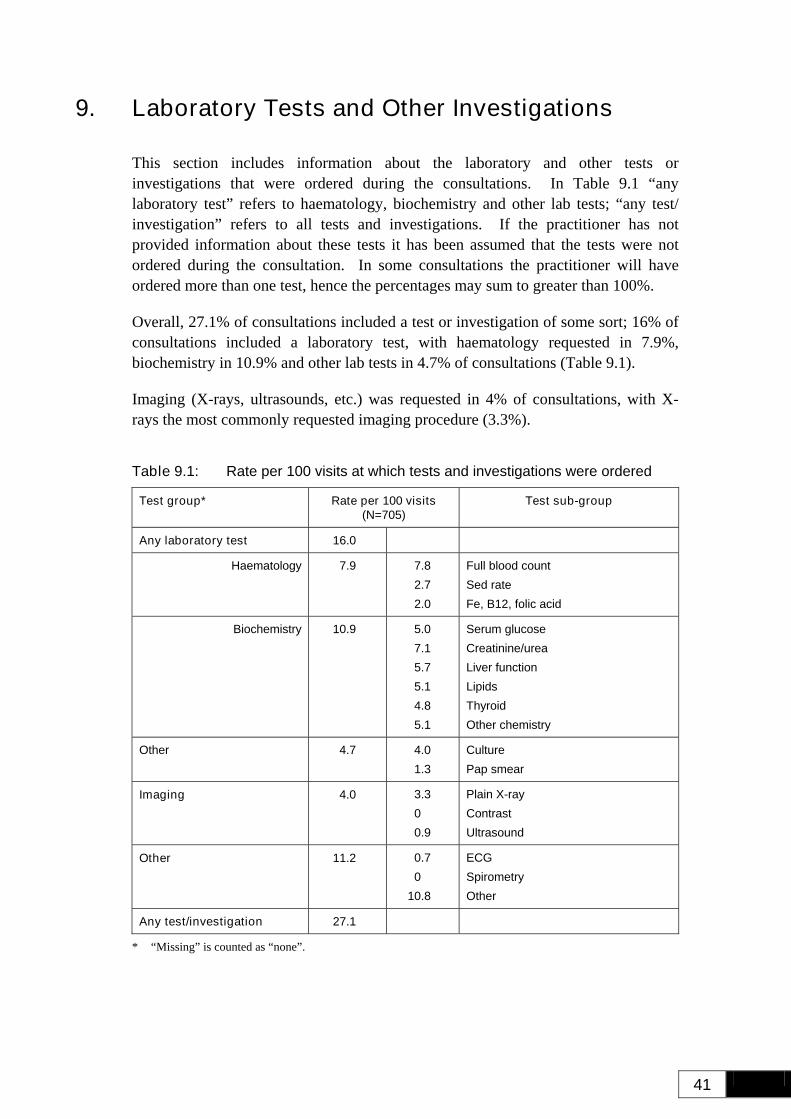
41
9. Laboratory Tests and Other Investigations
This section includes information about the laboratory and other tests or investigations that were ordered during the consultations. In Table 9.1 “any laboratory test” refers to haematology, biochemistry and other lab tests; “any test/ investigation” refers to all tests and investigations. If the practitioner has not provided information about these tests it has been assumed that the tests were not ordered during the consultation. In some consultations the practitioner will have ordered more than one test, hence the percentages may sum to greater than 100%.
Overall, 27.1% of consultations included a test or investigation of some sort; 16% of consultations included a laboratory test, with haematology requested in 7.9%, biochemistry in 10.9% and other lab tests in 4.7% of consultations (Table 9.1).
Imaging (X-rays, ultrasounds, etc.) was requested in 4% of consultations, with X-rays the most commonly requested imaging procedure (3.3%).
Table 9.1: Rate per 100 visits at which tests and investigations were ordered
Test group* Rate per 100 visits (N=705)
Test sub-group
Any laboratory test 16.0
Haematology 7.9 7.8 2.7 2.0
Full blood count Sed rate Fe, B12, folic acid
Biochemistry 10.9 5.0 7.1 5.7 5.1 4.8 5.1
Serum glucose Creatinine/urea Liver function Lipids Thyroid Other chemistry
Other 4.7 4.0 1.3
Culture Pap smear
Imaging 4.0 3.3 0 0.9
Plain X-ray Contrast Ultrasound
Other 11.2 0.7 0
10.8
ECG Spirometry Other
Any test/investigation 27.1
* “Missing” is counted as “none”.
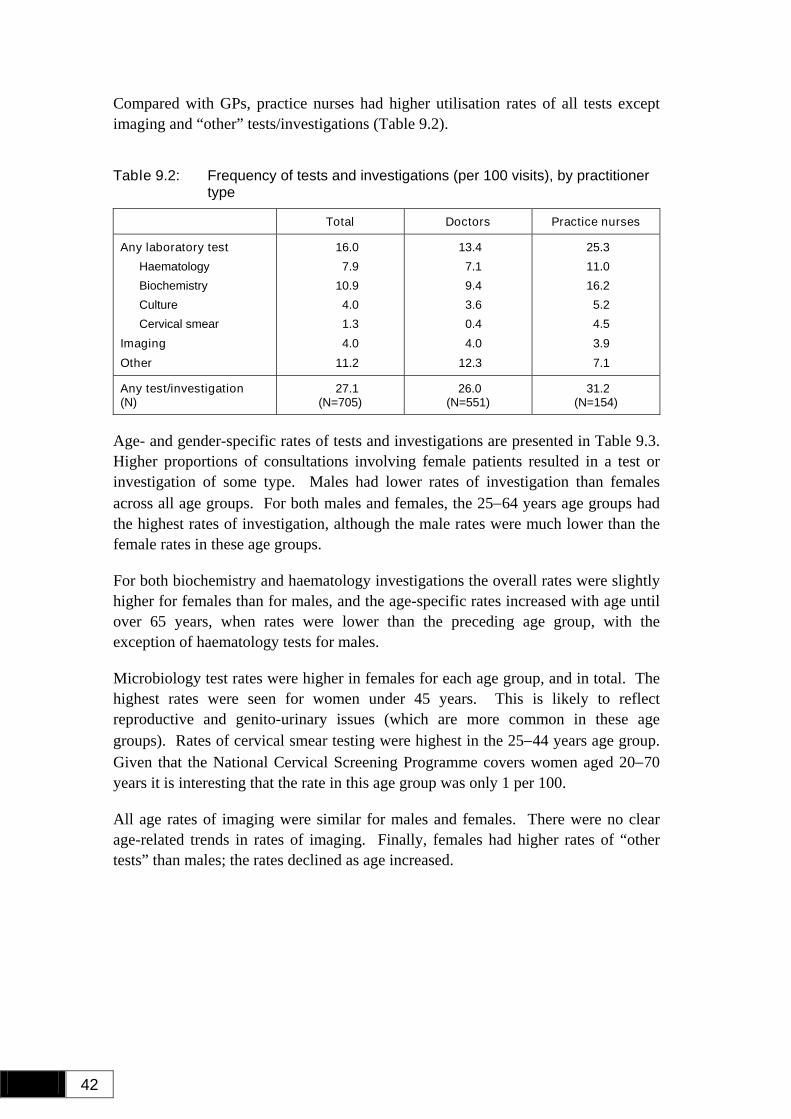
42
Compared with GPs, practice nurses had higher utilisation rates of all tests except imaging and “other” tests/investigations (Table 9.2).
Table 9.2: Frequency of tests and investigations (per 100 visits), by practitioner type
Total Doctors Practice nurses
Any laboratory test Haematology Biochemistry Culture Cervical smear
Imaging Other
16.0 7.9
10.9 4.0 1.3 4.0
11.2
13.4 7.1 9.4 3.6 0.4 4.0
12.3
25.3 11.0 16.2 5.2 4.5 3.9 7.1
Any test/investigation (N)
27.1 (N=705)
26.0 (N=551)
31.2 (N=154)
Age- and gender-specific rates of tests and investigations are presented in Table 9.3. Higher proportions of consultations involving female patients resulted in a test or investigation of some type. Males had lower rates of investigation than females across all age groups. For both males and females, the 25−64 years age groups had the highest rates of investigation, although the male rates were much lower than the female rates in these age groups.
For both biochemistry and haematology investigations the overall rates were slightly higher for females than for males, and the age-specific rates increased with age until over 65 years, when rates were lower than the preceding age group, with the exception of haematology tests for males.
Microbiology test rates were higher in females for each age group, and in total. The highest rates were seen for women under 45 years. This is likely to reflect reproductive and genito-urinary issues (which are more common in these age groups). Rates of cervical smear testing were highest in the 25−44 years age group. Given that the National Cervical Screening Programme covers women aged 20−70 years it is interesting that the rate in this age group was only 1 per 100.
All age rates of imaging were similar for males and females. There were no clear age-related trends in rates of imaging. Finally, females had higher rates of “other tests” than males; the rates declined as age increased.
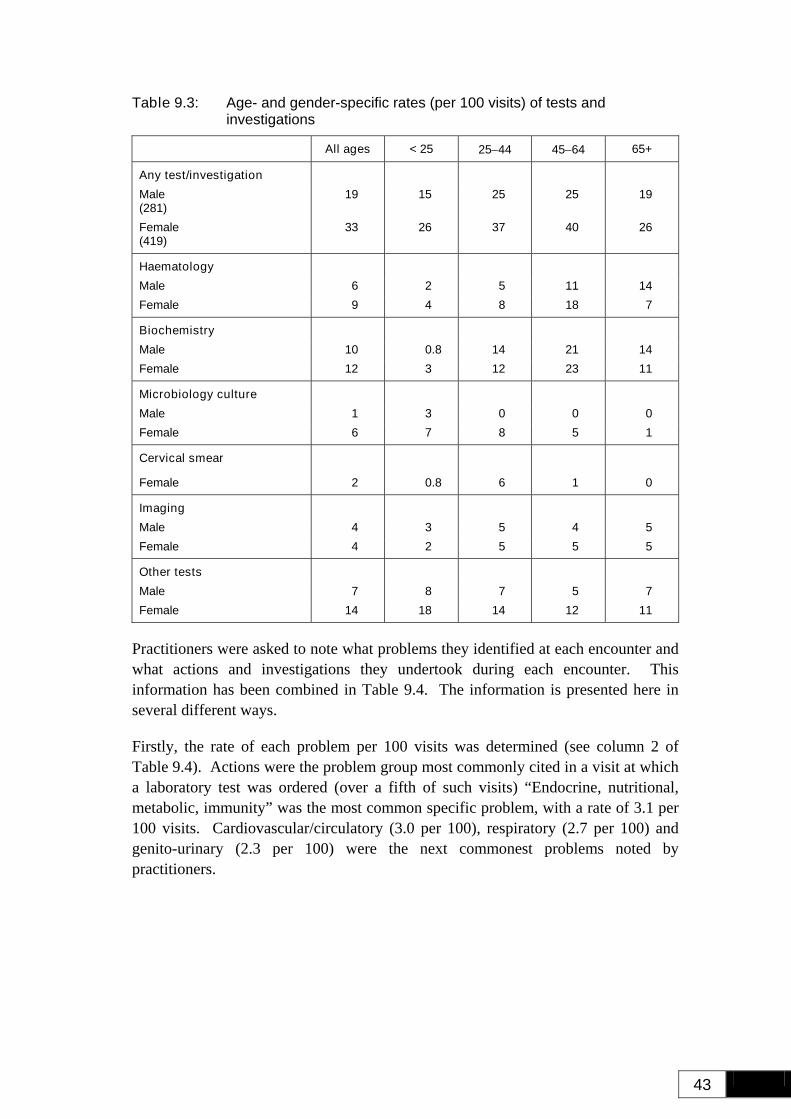
43
Table 9.3: Age- and gender-specific rates (per 100 visits) of tests and investigations
All ages < 25 25−44 45−64 65+
Any test/investigation Male (281)
19 15 25 25 19
Female (419)
33 26 37 40 26
Haematology Male 6 2 5 11 14 Female 9 4 8 18 7
Biochemistry Male 10 0.8 14 21 14 Female 12 3 12 23 11
Microbiology culture Male 1 3 0 0 0 Female 6 7 8 5 1
Cervical smear
Female 2 0.8 6 1 0
Imaging Male 4 3 5 4 5 Female 4 2 5 5 5
Other tests Male 7 8 7 5 7 Female 14 18 14 12 11
Practitioners were asked to note what problems they identified at each encounter and what actions and investigations they undertook during each encounter. This information has been combined in Table 9.4. The information is presented here in several different ways.
Firstly, the rate of each problem per 100 visits was determined (see column 2 of Table 9.4). Actions were the problem group most commonly cited in a visit at which a laboratory test was ordered (over a fifth of such visits) “Endocrine, nutritional, metabolic, immunity” was the most common specific problem, with a rate of 3.1 per 100 visits. Cardiovascular/circulatory (3.0 per 100), respiratory (2.7 per 100) and genito-urinary (2.3 per 100) were the next commonest problems noted by practitioners.
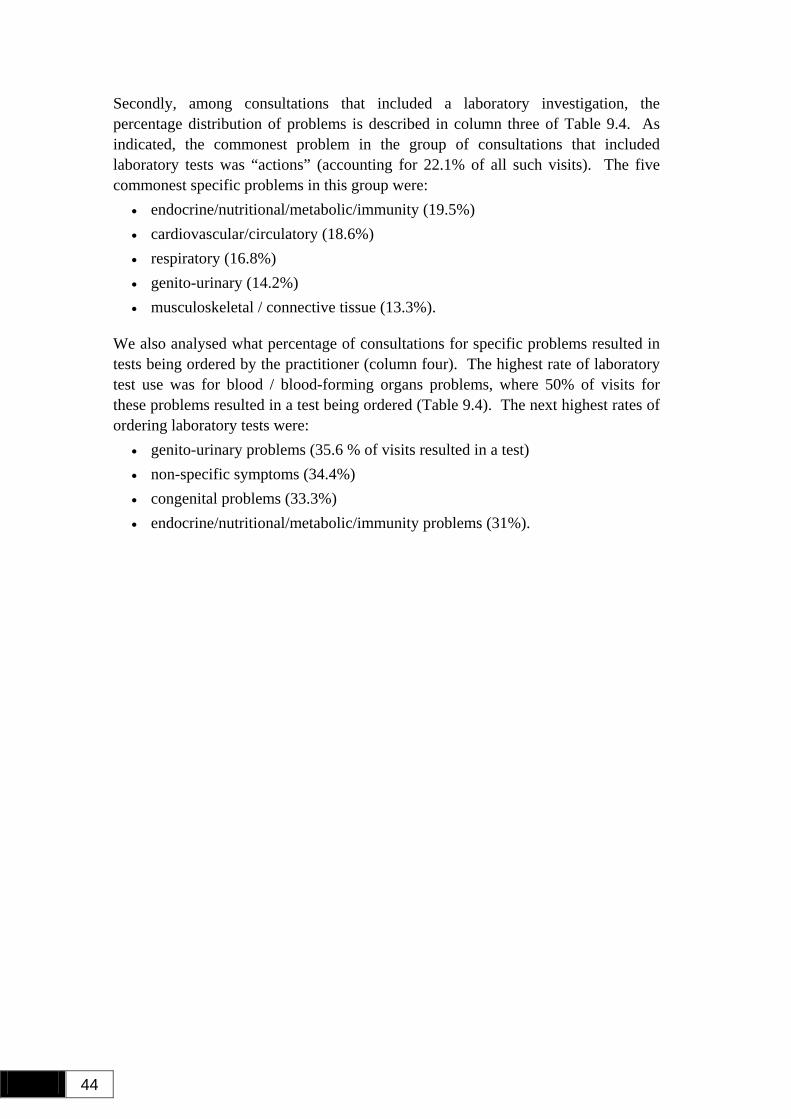
44
Secondly, among consultations that included a laboratory investigation, the percentage distribution of problems is described in column three of Table 9.4. As indicated, the commonest problem in the group of consultations that included laboratory tests was “actions” (accounting for 22.1% of all such visits). The five commonest specific problems in this group were:
• endocrine/nutritional/metabolic/immunity (19.5%) • cardiovascular/circulatory (18.6%) • respiratory (16.8%) • genito-urinary (14.2%) • musculoskeletal / connective tissue (13.3%).
We also analysed what percentage of consultations for specific problems resulted in tests being ordered by the practitioner (column four). The highest rate of laboratory test use was for blood / blood-forming organs problems, where 50% of visits for these problems resulted in a test being ordered (Table 9.4). The next highest rates of ordering laboratory tests were:
• genito-urinary problems (35.6 % of visits resulted in a test) • non-specific symptoms (34.4%) • congenital problems (33.3%) • endocrine/nutritional/metabolic/immunity problems (31%).
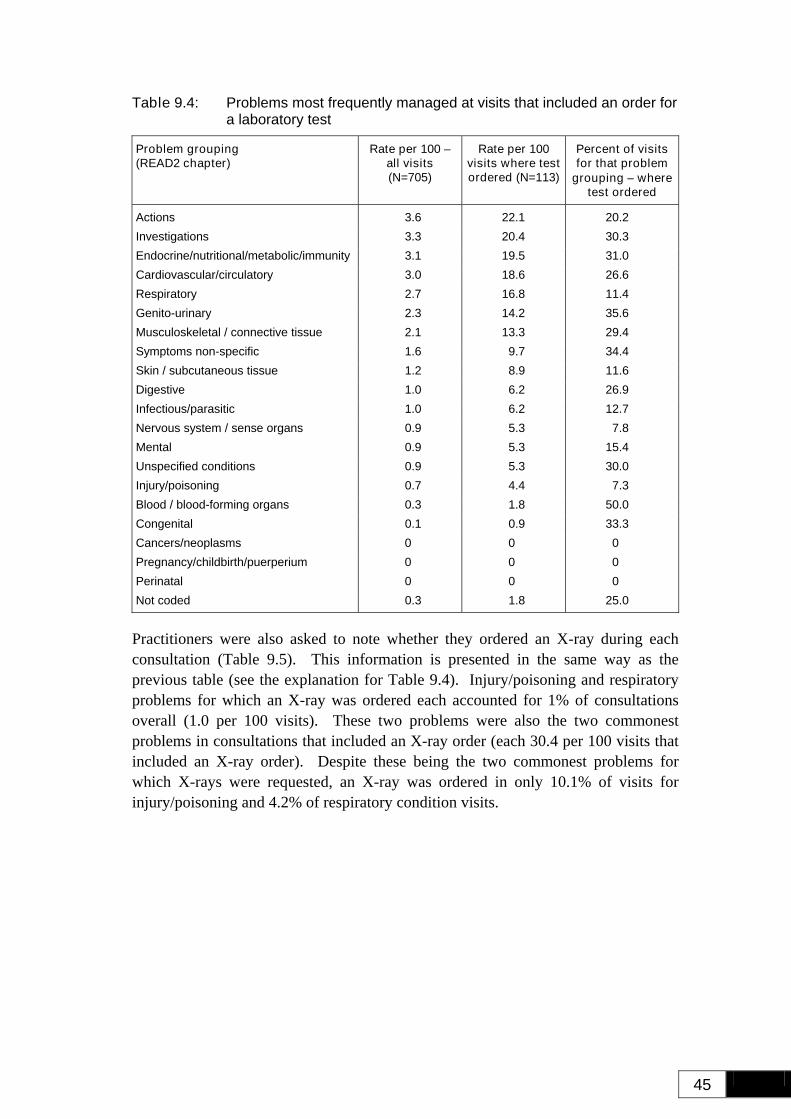
45
Table 9.4: Problems most frequently managed at visits that included an order for a laboratory test
Problem grouping (READ2 chapter)
Rate per 100 – all visits (N=705)
Rate per 100 visits where test ordered (N=113)
Percent of visits for that problem
grouping − where test ordered
Actions 3.6 22.1 20.2 Investigations 3.3 20.4 30.3 Endocrine/nutritional/metabolic/immunity 3.1 19.5 31.0 Cardiovascular/circulatory 3.0 18.6 26.6 Respiratory 2.7 16.8 11.4 Genito-urinary 2.3 14.2 35.6 Musculoskeletal / connective tissue 2.1 13.3 29.4 Symptoms non-specific 1.6 9.7 34.4 Skin / subcutaneous tissue 1.2 8.9 11.6 Digestive 1.0 6.2 26.9 Infectious/parasitic 1.0 6.2 12.7 Nervous system / sense organs 0.9 5.3 7.8 Mental 0.9 5.3 15.4 Unspecified conditions 0.9 5.3 30.0 Injury/poisoning 0.7 4.4 7.3 Blood / blood-forming organs 0.3 1.8 50.0 Congenital 0.1 0.9 33.3 Cancers/neoplasms 0 0 0 Pregnancy/childbirth/puerperium 0 0 0 Perinatal 0 0 0 Not coded 0.3 1.8 25.0
Practitioners were also asked to note whether they ordered an X-ray during each consultation (Table 9.5). This information is presented in the same way as the previous table (see the explanation for Table 9.4). Injury/poisoning and respiratory problems for which an X-ray was ordered each accounted for 1% of consultations overall (1.0 per 100 visits). These two problems were also the two commonest problems in consultations that included an X-ray order (each 30.4 per 100 visits that included an X-ray order). Despite these being the two commonest problems for which X-rays were requested, an X-ray was ordered in only 10.1% of visits for injury/poisoning and 4.2% of respiratory condition visits.
46
Table 9.5: Problems most frequently managed at visits that included an order for an X-ray
Problem grouping (READ2 chapter)
Rate per 100 − all visits
(N=705)
Rate per 100 visits where X-
ray ordered (N=23)
Percent of visits for that problem
grouping − where X-ray ordered
Injury/poisoning 1.0 30.4 10.1 Respiratory system 1.0 30.4 4.2 Musculoskeletal / connective tissue 0.6 17.4 7.8 Actions 0.4 13.0 2.4 Investigations 0.3 8.7 2.6 Cardiovascular/circulatory 0.3 8.7 2.5 Symptoms non-specific 0.3 8.7 6.3 Unspecified conditions 0.3 8.7 10.0 Digestive system 0.1 4.4 3.9 Nervous system / sense organs 0.1 4.4 1.3 Endocrine/nutritional/metabolic/immunity 0.1 4.4 1.4 Infectious/parasitic 0.1 4.4 1.8 Cancers/neoplasms 0.1 4.4 9.1 Skin / subcutaneous tissue 0.1 4.4 1.2 Mental 0 0 0 Genito-urinary system 0 0 0 Blood / blood-forming organs 0 0 0 Pregnancy/childbirth/puerperium 0 0 0 Congenital 0 0 0 Perinatal 0 0 0 Not coded 0.1 4.4 12.5
47
10. Pharmacological Treatment
Sections 10 and 11 provide information about the types of treatments that were utilised by practitioners. Section 10 begins with some basic descriptive information about the treatments used (Tables 10.1 and 10.2). Information about drug treatments follows (Tables 10.3 to 10.27). Section 11 provides detailed information about non-drug treatments.
Non-drug treatments (actions) were recorded for up to four problems per patient visit. However, only one action of each type (e.g. administration) was counted for each problem. Similarly, drug treatments (actions) were recorded for up to four problems per patient visit. However, all drugs prescribed for each problem were included in the dataset. Drugs have been classified according to the Pharmacodes/ATC system.
Table 10.1 describes the percentage of visits that included specific types of treatment. Overall, no treatment (drug or other treatment) was required in 14.3% of visits. A higher percentage of visits to doctors (16.5%) compared with practice nurses (6.5%) involved no treatment. Prescriptions were provided in 61.6% of consultations. A higher percentage of visits to doctors (64.9%) resulted in the writing of a prescription than visits to practice nurses (49.3%). This finding was reversed for non-drug treatments, which were used in 55.3% of doctors’ visits, 79.9% of visits to practice nurses, and in 60.7% of all visits.
Overall, 36.6% of visits included both drug (prescription) and non-drug (other) treatments. The percentage of visits to doctors (36.8%) and practice nurses (35.7%) that involved both prescriptions and other treatments were similar. A higher percentage of visits to doctors (28.1%) than nurses (13.6%) resulted in the writing of a prescription, and visits that resulted in prescriptions only accounted for 25.0% of all visits. Non-drug treatments alone were used in 24.1% of all visits. Visits to practice nurses (44.2%) more frequently included use of non-drug treatments than did visits to doctors (18.5%).
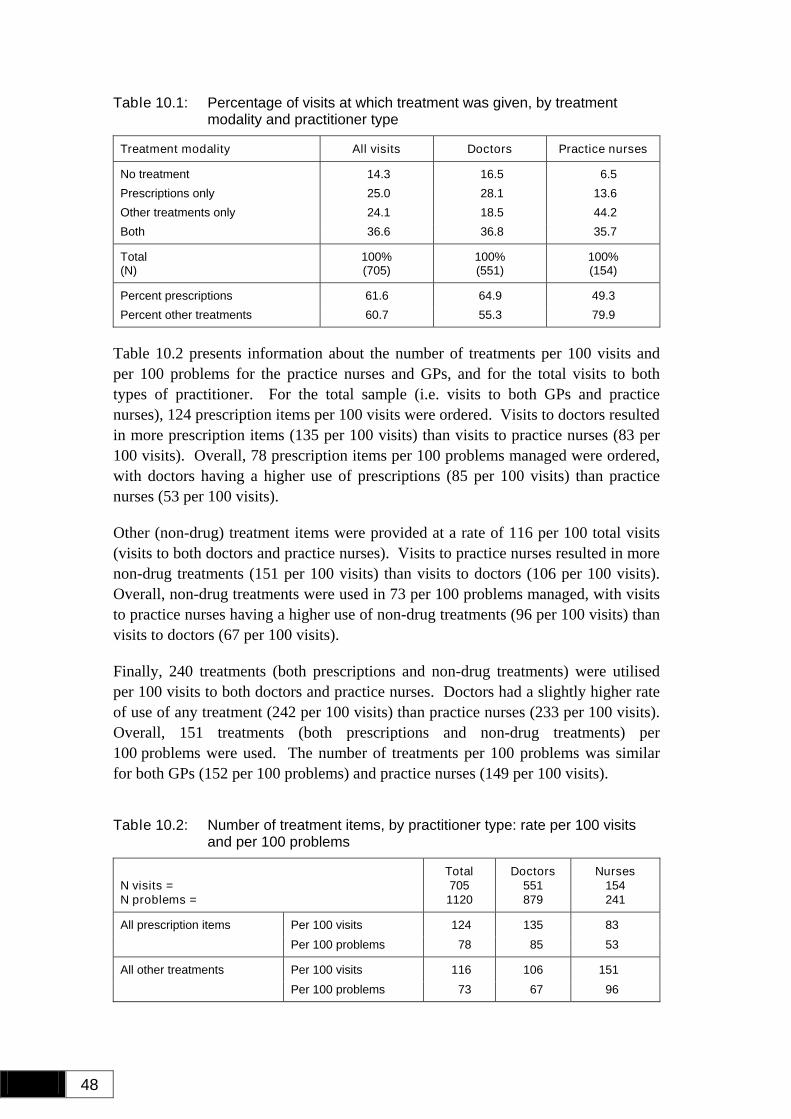
48
Table 10.1: Percentage of visits at which treatment was given, by treatment modality and practitioner type
Treatment modality All visits Doctors Practice nurses
No treatment 14.3 16.5 6.5 Prescriptions only 25.0 28.1 13.6 Other treatments only 24.1 18.5 44.2 Both 36.6 36.8 35.7
Total (N)
100% (705)
100% (551)
100% (154)
Percent prescriptions 61.6 64.9 49.3 Percent other treatments 60.7 55.3 79.9
Table 10.2 presents information about the number of treatments per 100 visits and per 100 problems for the practice nurses and GPs, and for the total visits to both types of practitioner. For the total sample (i.e. visits to both GPs and practice nurses), 124 prescription items per 100 visits were ordered. Visits to doctors resulted in more prescription items (135 per 100 visits) than visits to practice nurses (83 per 100 visits). Overall, 78 prescription items per 100 problems managed were ordered, with doctors having a higher use of prescriptions (85 per 100 visits) than practice nurses (53 per 100 visits).
Other (non-drug) treatment items were provided at a rate of 116 per 100 total visits (visits to both doctors and practice nurses). Visits to practice nurses resulted in more non-drug treatments (151 per 100 visits) than visits to doctors (106 per 100 visits). Overall, non-drug treatments were used in 73 per 100 problems managed, with visits to practice nurses having a higher use of non-drug treatments (96 per 100 visits) than visits to doctors (67 per 100 visits).
Finally, 240 treatments (both prescriptions and non-drug treatments) were utilised per 100 visits to both doctors and practice nurses. Doctors had a slightly higher rate of use of any treatment (242 per 100 visits) than practice nurses (233 per 100 visits). Overall, 151 treatments (both prescriptions and non-drug treatments) per 100 problems were used. The number of treatments per 100 problems was similar for both GPs (152 per 100 problems) and practice nurses (149 per 100 visits).
Table 10.2: Number of treatment items, by practitioner type: rate per 100 visits and per 100 problems
N visits = N problems =
Total 705 1120
Doctors 551 879
Nurses 154 241
Per 100 visits 124 135 83 All prescription items Per 100 problems 78 85 53
Per 100 visits 116 106 151 All other treatments Per 100 problems 73 67 96
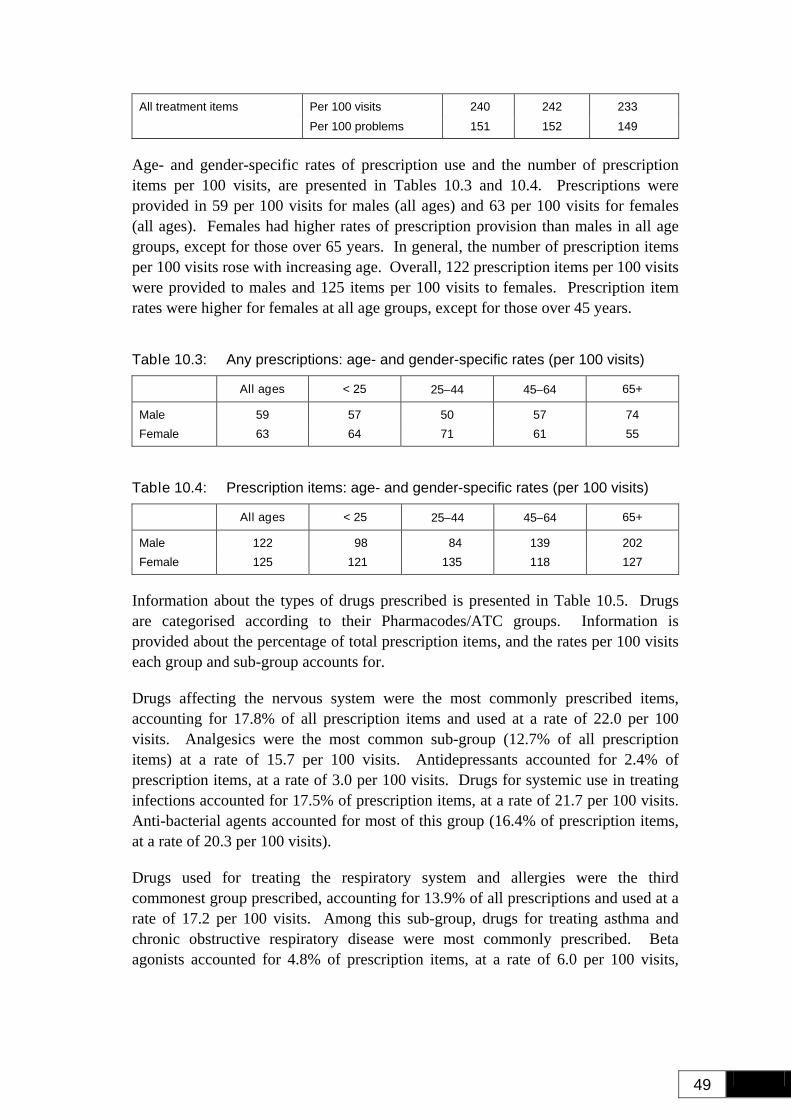
49
Per 100 visits 240 242 233 All treatment items Per 100 problems 151 152 149
Age- and gender-specific rates of prescription use and the number of prescription items per 100 visits, are presented in Tables 10.3 and 10.4. Prescriptions were provided in 59 per 100 visits for males (all ages) and 63 per 100 visits for females (all ages). Females had higher rates of prescription provision than males in all age groups, except for those over 65 years. In general, the number of prescription items per 100 visits rose with increasing age. Overall, 122 prescription items per 100 visits were provided to males and 125 items per 100 visits to females. Prescription item rates were higher for females at all age groups, except for those over 45 years.
Table 10.3: Any prescriptions: age- and gender-specific rates (per 100 visits)
All ages < 25 25−44 45−64 65+
Male 59 57 50 57 74 Female 63 64 71 61 55
Table 10.4: Prescription items: age- and gender-specific rates (per 100 visits)
All ages < 25 25−44 45−64 65+
Male 122 98 84 139 202 Female 125 121 135 118 127
Information about the types of drugs prescribed is presented in Table 10.5. Drugs are categorised according to their Pharmacodes/ATC groups. Information is provided about the percentage of total prescription items, and the rates per 100 visits each group and sub-group accounts for.
Drugs affecting the nervous system were the most commonly prescribed items, accounting for 17.8% of all prescription items and used at a rate of 22.0 per 100 visits. Analgesics were the most common sub-group (12.7% of all prescription items) at a rate of 15.7 per 100 visits. Antidepressants accounted for 2.4% of prescription items, at a rate of 3.0 per 100 visits. Drugs for systemic use in treating infections accounted for 17.5% of prescription items, at a rate of 21.7 per 100 visits. Anti-bacterial agents accounted for most of this group (16.4% of prescription items, at a rate of 20.3 per 100 visits).
Drugs used for treating the respiratory system and allergies were the third commonest group prescribed, accounting for 13.9% of all prescriptions and used at a rate of 17.2 per 100 visits. Among this sub-group, drugs for treating asthma and chronic obstructive respiratory disease were most commonly prescribed. Beta agonists accounted for 4.8% of prescription items, at a rate of 6.0 per 100 visits,
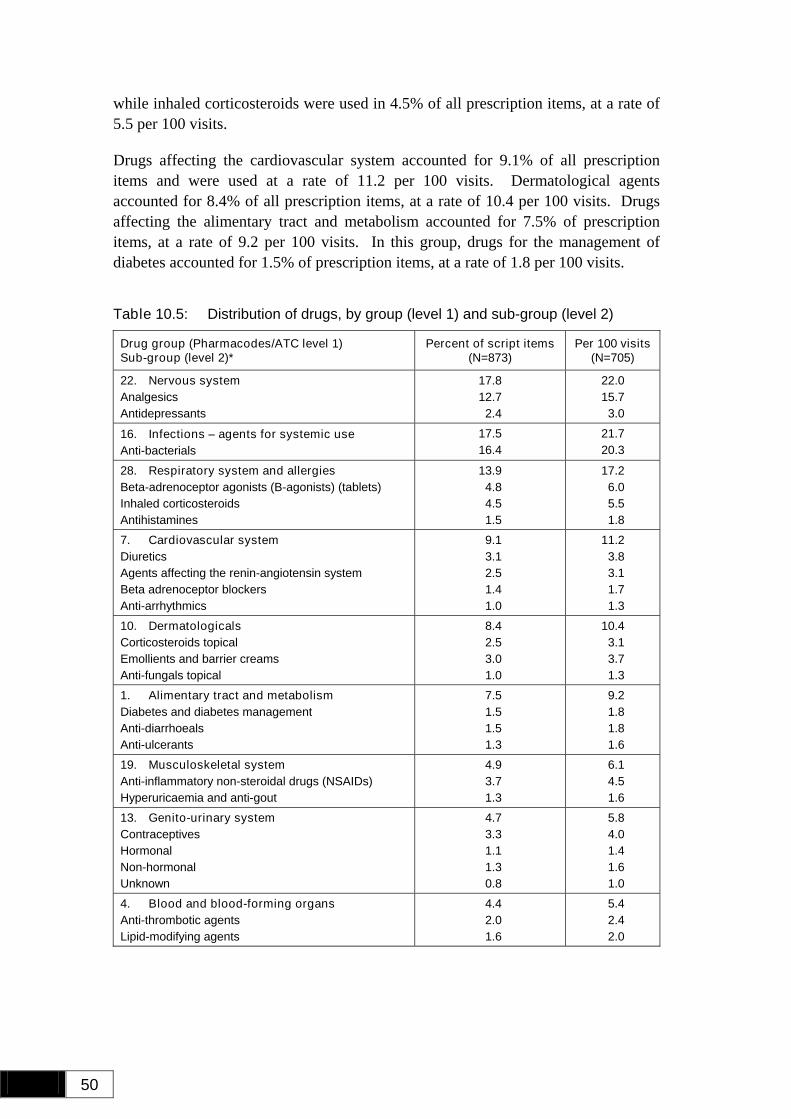
50
while inhaled corticosteroids were used in 4.5% of all prescription items, at a rate of 5.5 per 100 visits.
Drugs affecting the cardiovascular system accounted for 9.1% of all prescription items and were used at a rate of 11.2 per 100 visits. Dermatological agents accounted for 8.4% of all prescription items, at a rate of 10.4 per 100 visits. Drugs affecting the alimentary tract and metabolism accounted for 7.5% of prescription items, at a rate of 9.2 per 100 visits. In this group, drugs for the management of diabetes accounted for 1.5% of prescription items, at a rate of 1.8 per 100 visits.
Table 10.5: Distribution of drugs, by group (level 1) and sub-group (level 2)
Drug group (Pharmacodes/ATC level 1) Sub-group (level 2)*
Percent of script items(N=873)
Per 100 visits (N=705)
22. Nervous system Analgesics Antidepressants
17.8 12.7 2.4
22.0 15.7 3.0
16. Infections − agents for systemic use Anti-bacterials
17.5 16.4
21.7 20.3
28. Respiratory system and allergies Beta-adrenoceptor agonists (B-agonists) (tablets) Inhaled corticosteroids Antihistamines
13.9 4.8 4.5 1.5
17.2 6.0 5.5 1.8
7. Cardiovascular system Diuretics Agents affecting the renin-angiotensin system Beta adrenoceptor blockers Anti-arrhythmics
9.1 3.1 2.5 1.4 1.0
11.2 3.8 3.1 1.7 1.3
10. Dermatologicals Corticosteroids topical Emollients and barrier creams Anti-fungals topical
8.4 2.5 3.0 1.0
10.4 3.1 3.7 1.3
1. Alimentary tract and metabolism Diabetes and diabetes management Anti-diarrhoeals Anti-ulcerants
7.5 1.5 1.5 1.3
9.2 1.8 1.8 1.6
19. Musculoskeletal system Anti-inflammatory non-steroidal drugs (NSAIDs) Hyperuricaemia and anti-gout
4.9 3.7 1.3
6.1 4.5 1.6
13. Genito-urinary system Contraceptives Hormonal Non-hormonal Unknown
4.7 3.3 1.1 1.3 0.8
5.8 4.0 1.4 1.6 1.0
4. Blood and blood-forming organs Anti-thrombotic agents Lipid-modifying agents
4.4 2.0 1.6
5.4 2.4 2.0
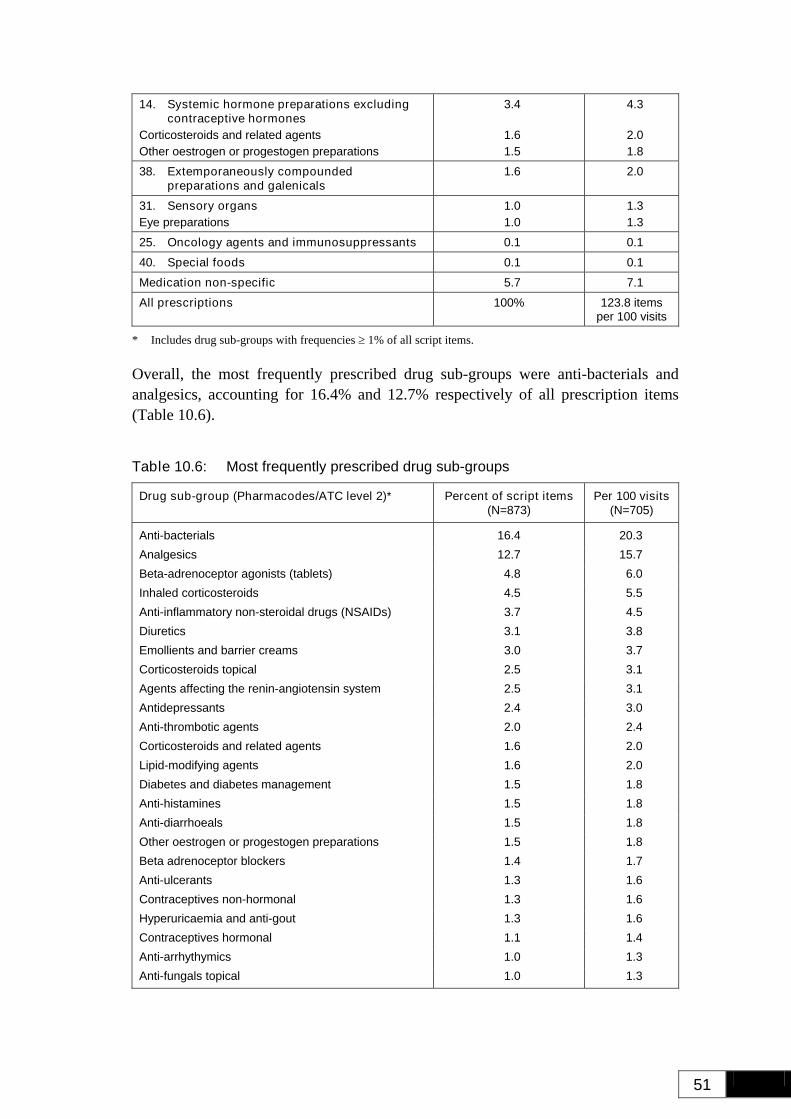
51
14. Systemic hormone preparations excluding contraceptive hormones
Corticosteroids and related agents Other oestrogen or progestogen preparations
3.4
1.6 1.5
4.3
2.0 1.8
38. Extemporaneously compounded preparations and galenicals
1.6 2.0
31. Sensory organs Eye preparations
1.0 1.0
1.3 1.3
25. Oncology agents and immunosuppressants 0.1 0.1 40. Special foods 0.1 0.1 Medication non-specific 5.7 7.1 All prescriptions 100% 123.8 items
per 100 visits
* Includes drug sub-groups with frequencies ≥ 1% of all script items.
Overall, the most frequently prescribed drug sub-groups were anti-bacterials and analgesics, accounting for 16.4% and 12.7% respectively of all prescription items (Table 10.6).
Table 10.6: Most frequently prescribed drug sub-groups
Drug sub-group (Pharmacodes/ATC level 2)* Percent of script items (N=873)
Per 100 visits(N=705)
Anti-bacterials 16.4 20.3 Analgesics 12.7 15.7 Beta-adrenoceptor agonists (tablets) 4.8 6.0 Inhaled corticosteroids 4.5 5.5 Anti-inflammatory non-steroidal drugs (NSAIDs) 3.7 4.5 Diuretics 3.1 3.8 Emollients and barrier creams 3.0 3.7 Corticosteroids topical 2.5 3.1 Agents affecting the renin-angiotensin system 2.5 3.1 Antidepressants 2.4 3.0 Anti-thrombotic agents 2.0 2.4 Corticosteroids and related agents 1.6 2.0 Lipid-modifying agents 1.6 2.0 Diabetes and diabetes management 1.5 1.8 Anti-histamines 1.5 1.8 Anti-diarrhoeals 1.5 1.8 Other oestrogen or progestogen preparations 1.5 1.8 Beta adrenoceptor blockers 1.4 1.7 Anti-ulcerants 1.3 1.6 Contraceptives non-hormonal 1.3 1.6 Hyperuricaemia and anti-gout 1.3 1.6 Contraceptives hormonal 1.1 1.4 Anti-arrhythymics 1.0 1.3 Anti-fungals topical 1.0 1.3
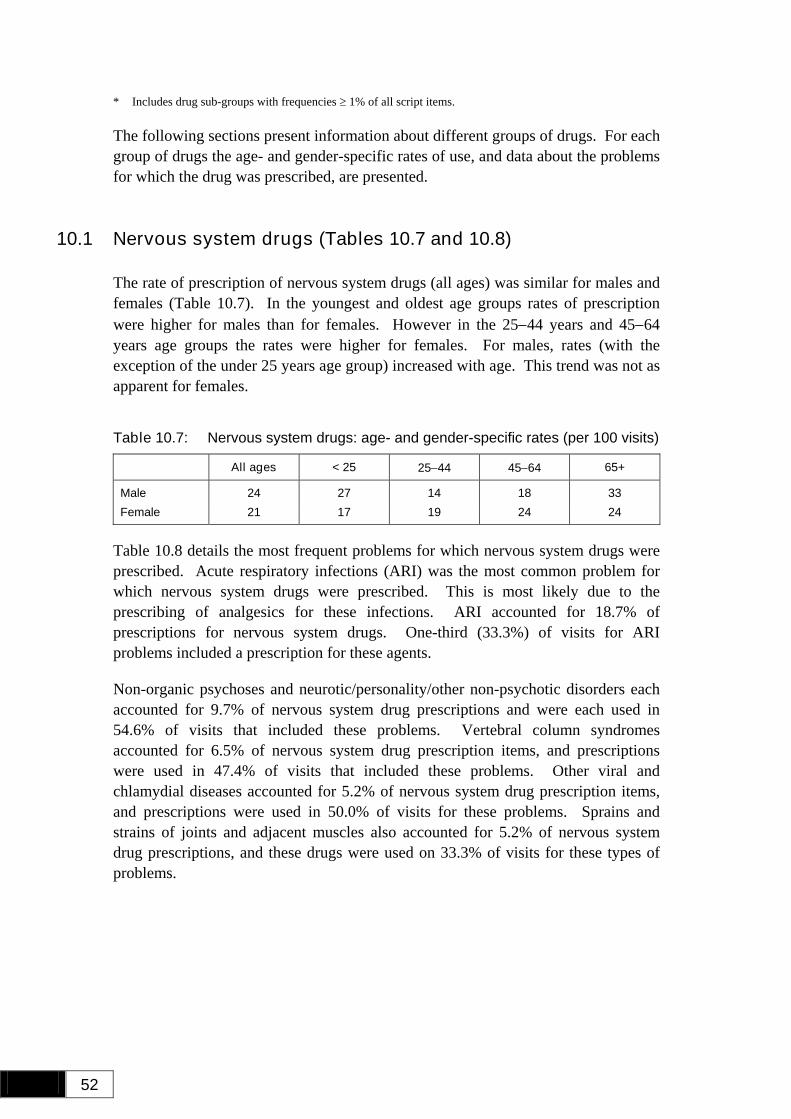
52
* Includes drug sub-groups with frequencies ≥ 1% of all script items.
The following sections present information about different groups of drugs. For each group of drugs the age- and gender-specific rates of use, and data about the problems for which the drug was prescribed, are presented.
10.1 Nervous system drugs (Tables 10.7 and 10.8)
The rate of prescription of nervous system drugs (all ages) was similar for males and females (Table 10.7). In the youngest and oldest age groups rates of prescription were higher for males than for females. However in the 25−44 years and 45−64 years age groups the rates were higher for females. For males, rates (with the exception of the under 25 years age group) increased with age. This trend was not as apparent for females.
Table 10.7: Nervous system drugs: age- and gender-specific rates (per 100 visits)
All ages < 25 25−44 45−64 65+
Male 24 27 14 18 33 Female 21 17 19 24 24
Table 10.8 details the most frequent problems for which nervous system drugs were prescribed. Acute respiratory infections (ARI) was the most common problem for which nervous system drugs were prescribed. This is most likely due to the prescribing of analgesics for these infections. ARI accounted for 18.7% of prescriptions for nervous system drugs. One-third (33.3%) of visits for ARI problems included a prescription for these agents.
Non-organic psychoses and neurotic/personality/other non-psychotic disorders each accounted for 9.7% of nervous system drug prescriptions and were each used in 54.6% of visits that included these problems. Vertebral column syndromes accounted for 6.5% of nervous system drug prescription items, and prescriptions were used in 47.4% of visits that included these problems. Other viral and chlamydial diseases accounted for 5.2% of nervous system drug prescription items, and prescriptions were used in 50.0% of visits for these problems. Sprains and strains of joints and adjacent muscles also accounted for 5.2% of nervous system drug prescriptions, and these drugs were used on 33.3% of visits for these types of problems.
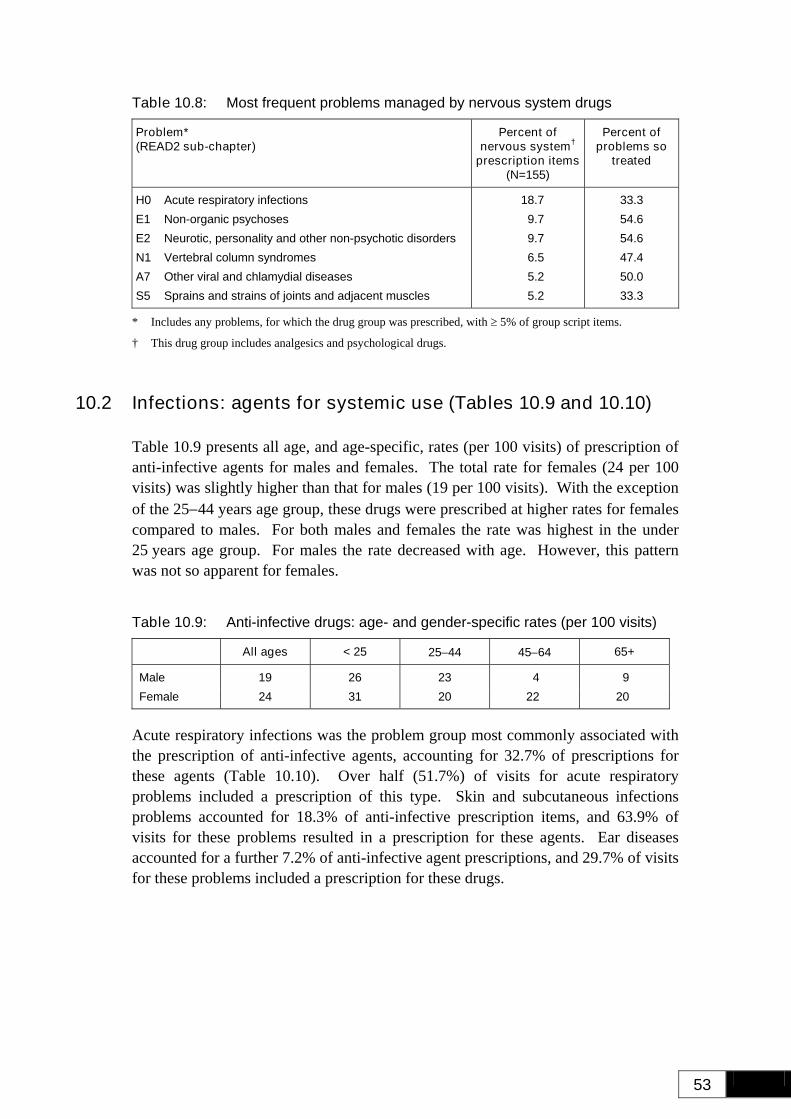
53
Table 10.8: Most frequent problems managed by nervous system drugs
Problem* (READ2 sub-chapter)
Percent of nervous system†
prescription items (N=155)
Percent of problems so
treated
H0 Acute respiratory infections E1 Non-organic psychoses E2 Neurotic, personality and other non-psychotic disorders N1 Vertebral column syndromes A7 Other viral and chlamydial diseases S5 Sprains and strains of joints and adjacent muscles
18.7 9.7 9.7 6.5 5.2 5.2
33.3 54.6 54.6 47.4 50.0 33.3
* Includes any problems, for which the drug group was prescribed, with ≥ 5% of group script items.
† This drug group includes analgesics and psychological drugs.
10.2 Infections: agents for systemic use (Tables 10.9 and 10.10)
Table 10.9 presents all age, and age-specific, rates (per 100 visits) of prescription of anti-infective agents for males and females. The total rate for females (24 per 100 visits) was slightly higher than that for males (19 per 100 visits). With the exception of the 25−44 years age group, these drugs were prescribed at higher rates for females compared to males. For both males and females the rate was highest in the under 25 years age group. For males the rate decreased with age. However, this pattern was not so apparent for females.
Table 10.9: Anti-infective drugs: age- and gender-specific rates (per 100 visits)
All ages < 25 25−44 45−64 65+
Male 19 26 23 4 9 Female 24 31 20 22 20
Acute respiratory infections was the problem group most commonly associated with the prescription of anti-infective agents, accounting for 32.7% of prescriptions for these agents (Table 10.10). Over half (51.7%) of visits for acute respiratory problems included a prescription of this type. Skin and subcutaneous infections problems accounted for 18.3% of anti-infective prescription items, and 63.9% of visits for these problems resulted in a prescription for these agents. Ear diseases accounted for a further 7.2% of anti-infective agent prescriptions, and 29.7% of visits for these problems included a prescription for these drugs.
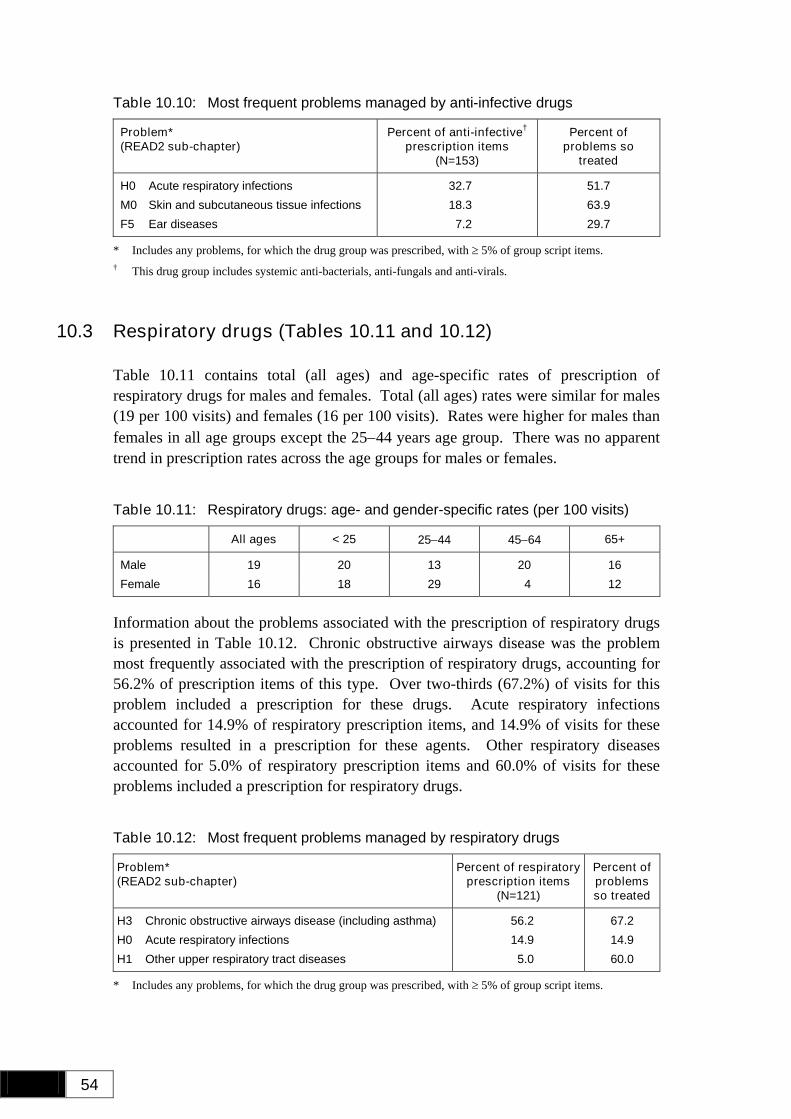
54
Table 10.10: Most frequent problems managed by anti-infective drugs
Problem* (READ2 sub-chapter)
Percent of anti-infective† prescription items
(N=153)
Percent of problems so
treated
H0 Acute respiratory infections M0 Skin and subcutaneous tissue infections F5 Ear diseases
32.7 18.3 7.2
51.7 63.9 29.7
* Includes any problems, for which the drug group was prescribed, with ≥ 5% of group script items. † This drug group includes systemic anti-bacterials, anti-fungals and anti-virals.
10.3 Respiratory drugs (Tables 10.11 and 10.12)
Table 10.11 contains total (all ages) and age-specific rates of prescription of respiratory drugs for males and females. Total (all ages) rates were similar for males (19 per 100 visits) and females (16 per 100 visits). Rates were higher for males than females in all age groups except the 25−44 years age group. There was no apparent trend in prescription rates across the age groups for males or females.
Table 10.11: Respiratory drugs: age- and gender-specific rates (per 100 visits)
All ages < 25 25−44 45−64 65+
Male 19 20 13 20 16 Female 16 18 29 4 12
Information about the problems associated with the prescription of respiratory drugs is presented in Table 10.12. Chronic obstructive airways disease was the problem most frequently associated with the prescription of respiratory drugs, accounting for 56.2% of prescription items of this type. Over two-thirds (67.2%) of visits for this problem included a prescription for these drugs. Acute respiratory infections accounted for 14.9% of respiratory prescription items, and 14.9% of visits for these problems resulted in a prescription for these agents. Other respiratory diseases accounted for 5.0% of respiratory prescription items and 60.0% of visits for these problems included a prescription for respiratory drugs.
Table 10.12: Most frequent problems managed by respiratory drugs
Problem* (READ2 sub-chapter)
Percent of respiratory prescription items
(N=121)
Percent of problems so treated
H3 Chronic obstructive airways disease (including asthma) H0 Acute respiratory infections H1 Other upper respiratory tract diseases
56.2 14.9 5.0
67.2 14.9 60.0
* Includes any problems, for which the drug group was prescribed, with ≥ 5% of group script items.
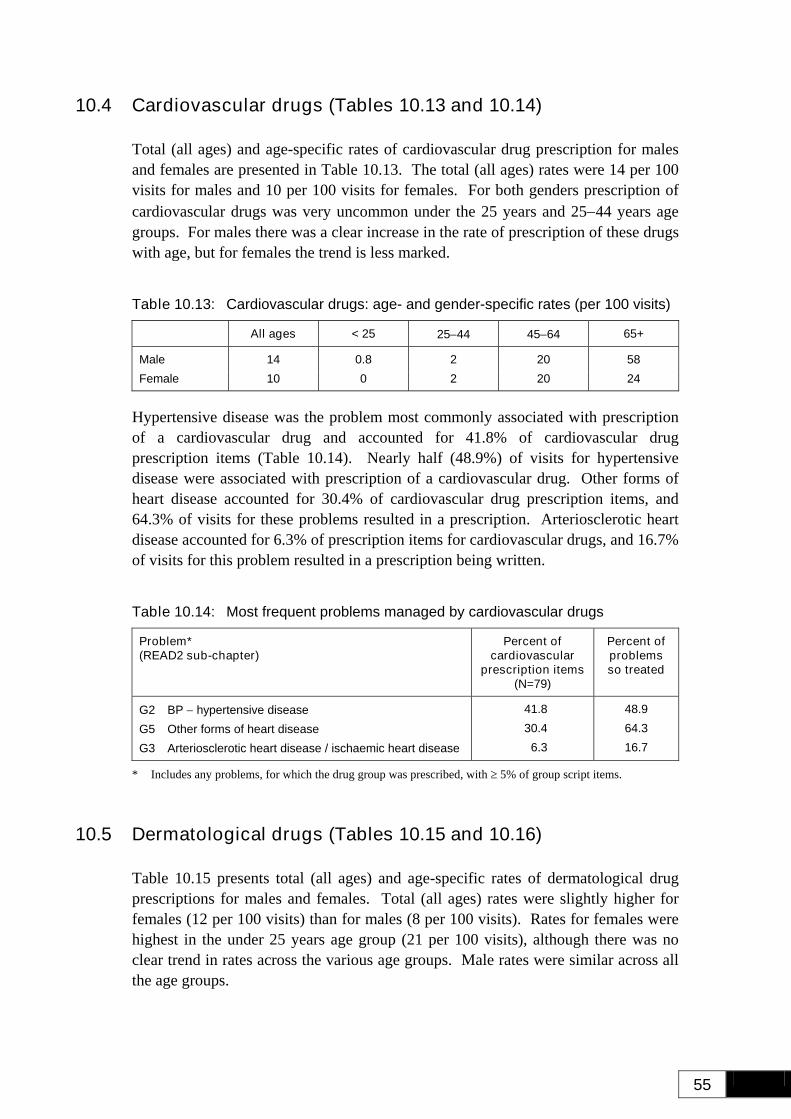
55
10.4 Cardiovascular drugs (Tables 10.13 and 10.14)
Total (all ages) and age-specific rates of cardiovascular drug prescription for males and females are presented in Table 10.13. The total (all ages) rates were 14 per 100 visits for males and 10 per 100 visits for females. For both genders prescription of cardiovascular drugs was very uncommon under the 25 years and 25−44 years age groups. For males there was a clear increase in the rate of prescription of these drugs with age, but for females the trend is less marked.
Table 10.13: Cardiovascular drugs: age- and gender-specific rates (per 100 visits)
All ages < 25 25−44 45−64 65+
Male 14 0.8 2 20 58 Female 10 0 2 20 24
Hypertensive disease was the problem most commonly associated with prescription of a cardiovascular drug and accounted for 41.8% of cardiovascular drug prescription items (Table 10.14). Nearly half (48.9%) of visits for hypertensive disease were associated with prescription of a cardiovascular drug. Other forms of heart disease accounted for 30.4% of cardiovascular drug prescription items, and 64.3% of visits for these problems resulted in a prescription. Arteriosclerotic heart disease accounted for 6.3% of prescription items for cardiovascular drugs, and 16.7% of visits for this problem resulted in a prescription being written.
Table 10.14: Most frequent problems managed by cardiovascular drugs
Problem* (READ2 sub-chapter)
Percent of cardiovascular
prescription items (N=79)
Percent of problems so treated
G2 BP − hypertensive disease G5 Other forms of heart disease G3 Arteriosclerotic heart disease / ischaemic heart disease
41.8 30.4 6.3
48.9 64.3 16.7
* Includes any problems, for which the drug group was prescribed, with ≥ 5% of group script items.
10.5 Dermatological drugs (Tables 10.15 and 10.16)
Table 10.15 presents total (all ages) and age-specific rates of dermatological drug prescriptions for males and females. Total (all ages) rates were slightly higher for females (12 per 100 visits) than for males (8 per 100 visits). Rates for females were highest in the under 25 years age group (21 per 100 visits), although there was no clear trend in rates across the various age groups. Male rates were similar across all the age groups.
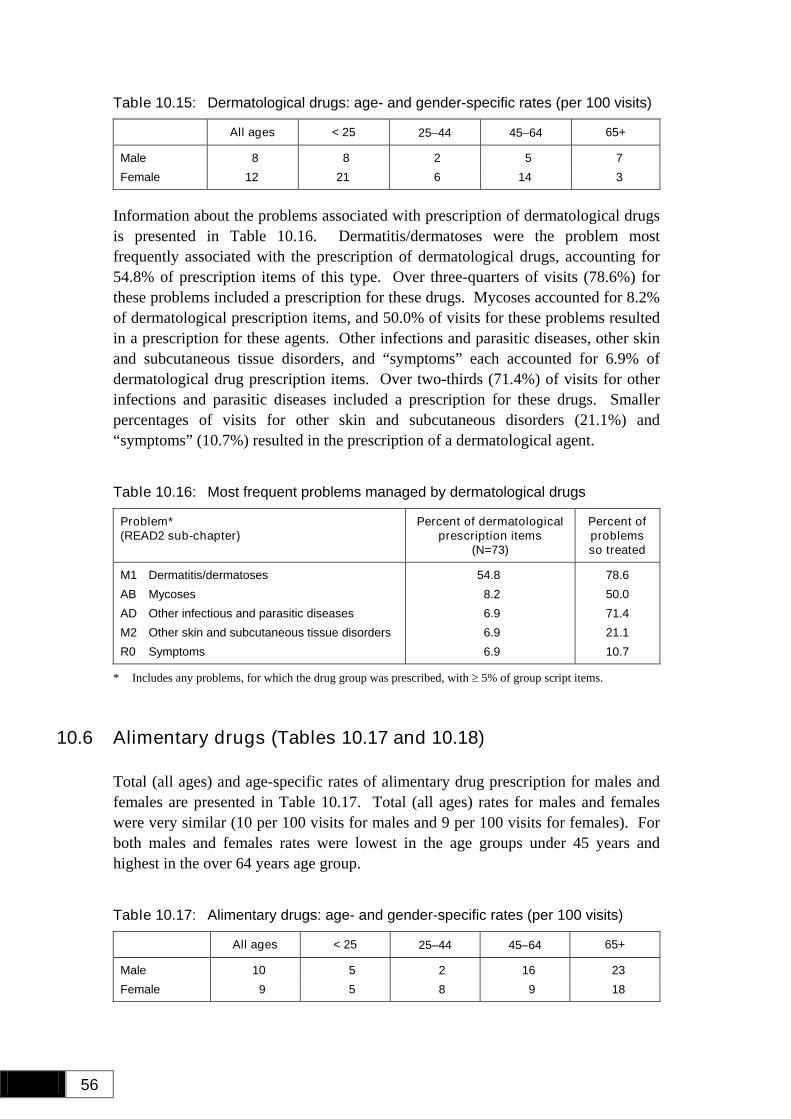
56
Table 10.15: Dermatological drugs: age- and gender-specific rates (per 100 visits)
All ages < 25 25−44 45−64 65+
Male 8 8 2 5 7 Female 12 21 6 14 3
Information about the problems associated with prescription of dermatological drugs is presented in Table 10.16. Dermatitis/dermatoses were the problem most frequently associated with the prescription of dermatological drugs, accounting for 54.8% of prescription items of this type. Over three-quarters of visits (78.6%) for these problems included a prescription for these drugs. Mycoses accounted for 8.2% of dermatological prescription items, and 50.0% of visits for these problems resulted in a prescription for these agents. Other infections and parasitic diseases, other skin and subcutaneous tissue disorders, and “symptoms” each accounted for 6.9% of dermatological drug prescription items. Over two-thirds (71.4%) of visits for other infections and parasitic diseases included a prescription for these drugs. Smaller percentages of visits for other skin and subcutaneous disorders (21.1%) and “symptoms” (10.7%) resulted in the prescription of a dermatological agent.
Table 10.16: Most frequent problems managed by dermatological drugs
Problem* (READ2 sub-chapter)
Percent of dermatological prescription items
(N=73)
Percent of problems so treated
M1 Dermatitis/dermatoses AB Mycoses AD Other infectious and parasitic diseases M2 Other skin and subcutaneous tissue disorders R0 Symptoms
54.8 8.2 6.9 6.9 6.9
78.6 50.0 71.4 21.1 10.7
* Includes any problems, for which the drug group was prescribed, with ≥ 5% of group script items.
10.6 Alimentary drugs (Tables 10.17 and 10.18)
Total (all ages) and age-specific rates of alimentary drug prescription for males and females are presented in Table 10.17. Total (all ages) rates for males and females were very similar (10 per 100 visits for males and 9 per 100 visits for females). For both males and females rates were lowest in the age groups under 45 years and highest in the over 64 years age group.
Table 10.17: Alimentary drugs: age- and gender-specific rates (per 100 visits)
All ages < 25 25−44 45−64 65+
Male 10 5 2 16 23 Female 9 5 8 9 18
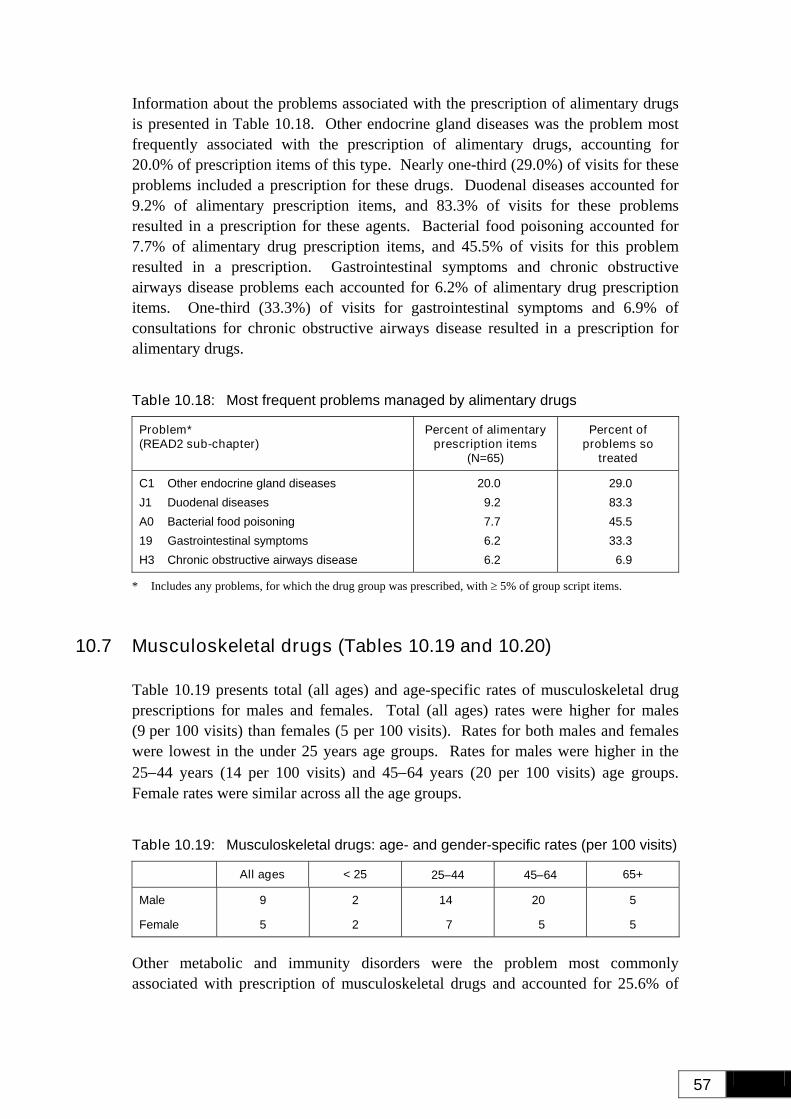
57
Information about the problems associated with the prescription of alimentary drugs is presented in Table 10.18. Other endocrine gland diseases was the problem most frequently associated with the prescription of alimentary drugs, accounting for 20.0% of prescription items of this type. Nearly one-third (29.0%) of visits for these problems included a prescription for these drugs. Duodenal diseases accounted for 9.2% of alimentary prescription items, and 83.3% of visits for these problems resulted in a prescription for these agents. Bacterial food poisoning accounted for 7.7% of alimentary drug prescription items, and 45.5% of visits for this problem resulted in a prescription. Gastrointestinal symptoms and chronic obstructive airways disease problems each accounted for 6.2% of alimentary drug prescription items. One-third (33.3%) of visits for gastrointestinal symptoms and 6.9% of consultations for chronic obstructive airways disease resulted in a prescription for alimentary drugs.
Table 10.18: Most frequent problems managed by alimentary drugs
Problem* (READ2 sub-chapter)
Percent of alimentary prescription items
(N=65)
Percent of problems so
treated
C1 Other endocrine gland diseases J1 Duodenal diseases A0 Bacterial food poisoning 19 Gastrointestinal symptoms H3 Chronic obstructive airways disease
20.0 9.2 7.7 6.2 6.2
29.0 83.3 45.5 33.3 6.9
* Includes any problems, for which the drug group was prescribed, with ≥ 5% of group script items.
10.7 Musculoskeletal drugs (Tables 10.19 and 10.20)
Table 10.19 presents total (all ages) and age-specific rates of musculoskeletal drug prescriptions for males and females. Total (all ages) rates were higher for males (9 per 100 visits) than females (5 per 100 visits). Rates for both males and females were lowest in the under 25 years age groups. Rates for males were higher in the 25−44 years (14 per 100 visits) and 45−64 years (20 per 100 visits) age groups. Female rates were similar across all the age groups.
Table 10.19: Musculoskeletal drugs: age- and gender-specific rates (per 100 visits)
All ages < 25 25−44 45−64 65+
Male 9 2 14 20 5
Female 5 2 7 5 5
Other metabolic and immunity disorders were the problem most commonly associated with prescription of musculoskeletal drugs and accounted for 25.6% of
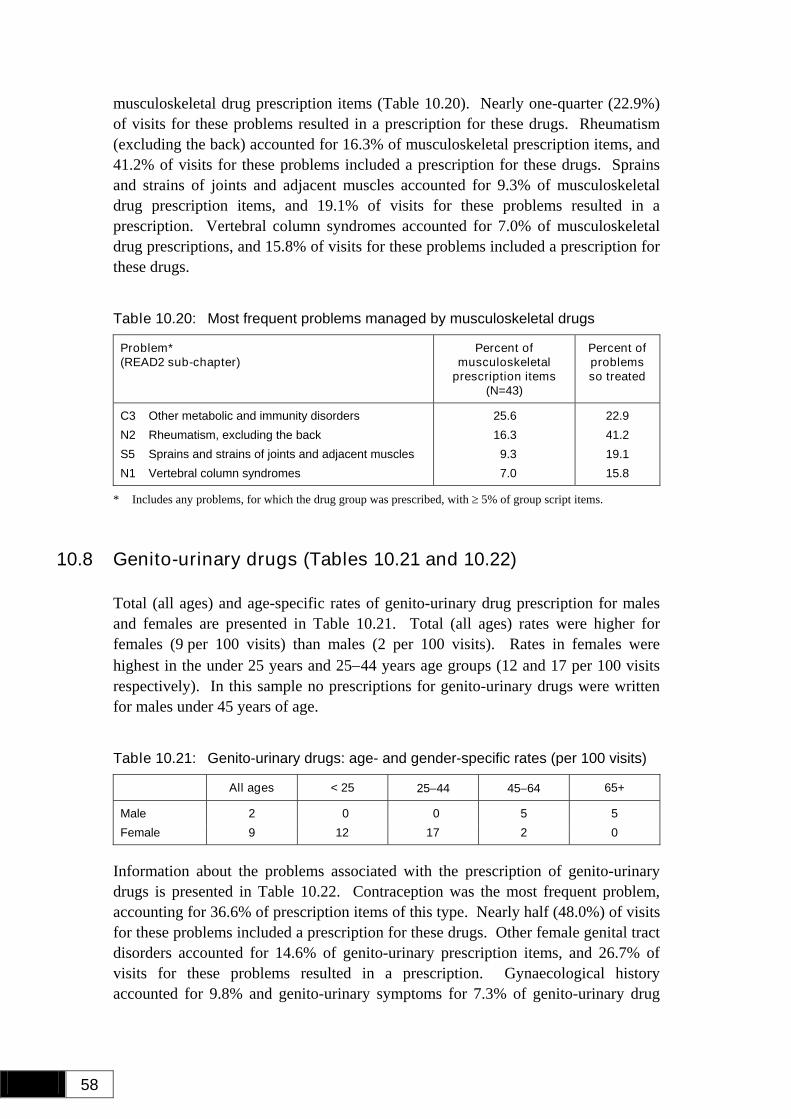
58
musculoskeletal drug prescription items (Table 10.20). Nearly one-quarter (22.9%) of visits for these problems resulted in a prescription for these drugs. Rheumatism (excluding the back) accounted for 16.3% of musculoskeletal prescription items, and 41.2% of visits for these problems included a prescription for these drugs. Sprains and strains of joints and adjacent muscles accounted for 9.3% of musculoskeletal drug prescription items, and 19.1% of visits for these problems resulted in a prescription. Vertebral column syndromes accounted for 7.0% of musculoskeletal drug prescriptions, and 15.8% of visits for these problems included a prescription for these drugs.
Table 10.20: Most frequent problems managed by musculoskeletal drugs
Problem* (READ2 sub-chapter)
Percent of musculoskeletal
prescription items (N=43)
Percent of problems so treated
C3 Other metabolic and immunity disorders N2 Rheumatism, excluding the back S5 Sprains and strains of joints and adjacent muscles N1 Vertebral column syndromes
25.6 16.3 9.3 7.0
22.9 41.2 19.1 15.8
* Includes any problems, for which the drug group was prescribed, with ≥ 5% of group script items.
10.8 Genito-urinary drugs (Tables 10.21 and 10.22)
Total (all ages) and age-specific rates of genito-urinary drug prescription for males and females are presented in Table 10.21. Total (all ages) rates were higher for females (9 per 100 visits) than males (2 per 100 visits). Rates in females were highest in the under 25 years and 25−44 years age groups (12 and 17 per 100 visits respectively). In this sample no prescriptions for genito-urinary drugs were written for males under 45 years of age.
Table 10.21: Genito-urinary drugs: age- and gender-specific rates (per 100 visits)
All ages < 25 25−44 45−64 65+
Male 2 0 0 5 5 Female 9 12 17 2 0
Information about the problems associated with the prescription of genito-urinary drugs is presented in Table 10.22. Contraception was the most frequent problem, accounting for 36.6% of prescription items of this type. Nearly half (48.0%) of visits for these problems included a prescription for these drugs. Other female genital tract disorders accounted for 14.6% of genito-urinary prescription items, and 26.7% of visits for these problems resulted in a prescription. Gynaecological history accounted for 9.8% and genito-urinary symptoms for 7.3% of genito-urinary drug
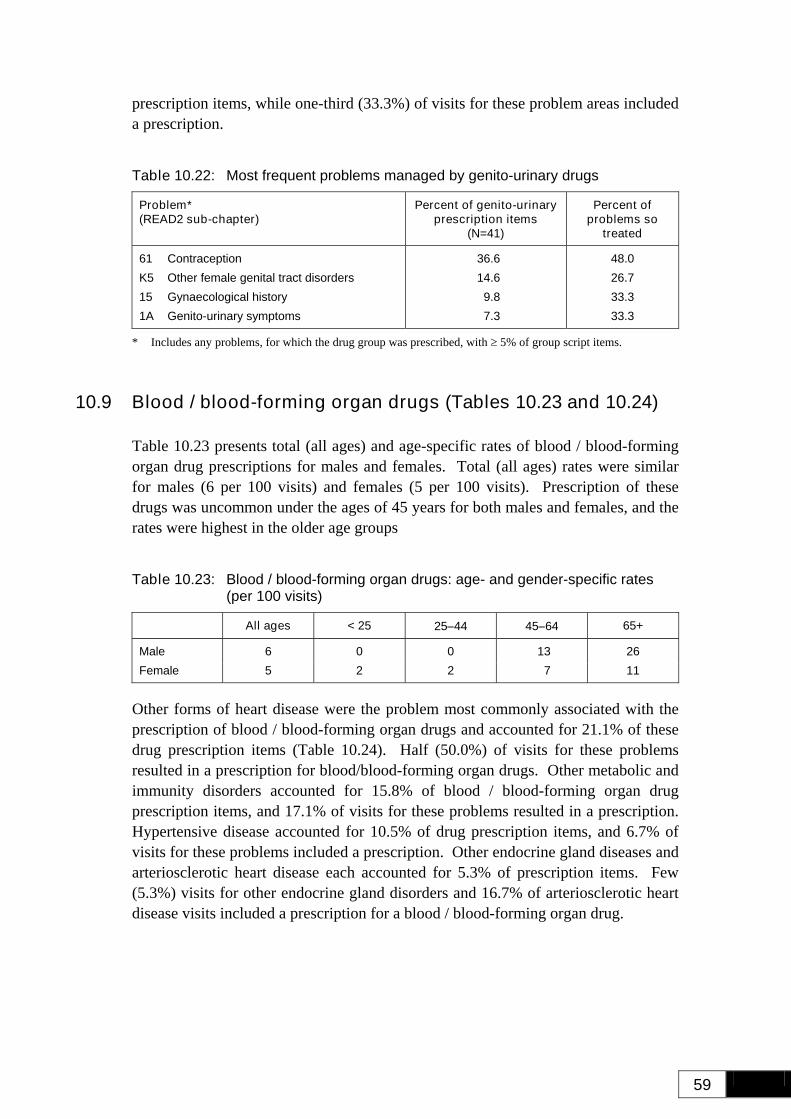
59
prescription items, while one-third (33.3%) of visits for these problem areas included a prescription.
Table 10.22: Most frequent problems managed by genito-urinary drugs
Problem* (READ2 sub-chapter)
Percent of genito-urinary prescription items
(N=41)
Percent of problems so
treated
61 Contraception K5 Other female genital tract disorders 15 Gynaecological history 1A Genito-urinary symptoms
36.6 14.6 9.8 7.3
48.0 26.7 33.3 33.3
* Includes any problems, for which the drug group was prescribed, with ≥ 5% of group script items.
10.9 Blood / blood-forming organ drugs (Tables 10.23 and 10.24)
Table 10.23 presents total (all ages) and age-specific rates of blood / blood-forming organ drug prescriptions for males and females. Total (all ages) rates were similar for males (6 per 100 visits) and females (5 per 100 visits). Prescription of these drugs was uncommon under the ages of 45 years for both males and females, and the rates were highest in the older age groups
Table 10.23: Blood / blood-forming organ drugs: age- and gender-specific rates (per 100 visits)
All ages < 25 25−44 45−64 65+
Male 6 0 0 13 26 Female 5 2 2 7 11
Other forms of heart disease were the problem most commonly associated with the prescription of blood / blood-forming organ drugs and accounted for 21.1% of these drug prescription items (Table 10.24). Half (50.0%) of visits for these problems resulted in a prescription for blood/blood-forming organ drugs. Other metabolic and immunity disorders accounted for 15.8% of blood / blood-forming organ drug prescription items, and 17.1% of visits for these problems resulted in a prescription. Hypertensive disease accounted for 10.5% of drug prescription items, and 6.7% of visits for these problems included a prescription. Other endocrine gland diseases and arteriosclerotic heart disease each accounted for 5.3% of prescription items. Few (5.3%) visits for other endocrine gland disorders and 16.7% of arteriosclerotic heart disease visits included a prescription for a blood / blood-forming organ drug.
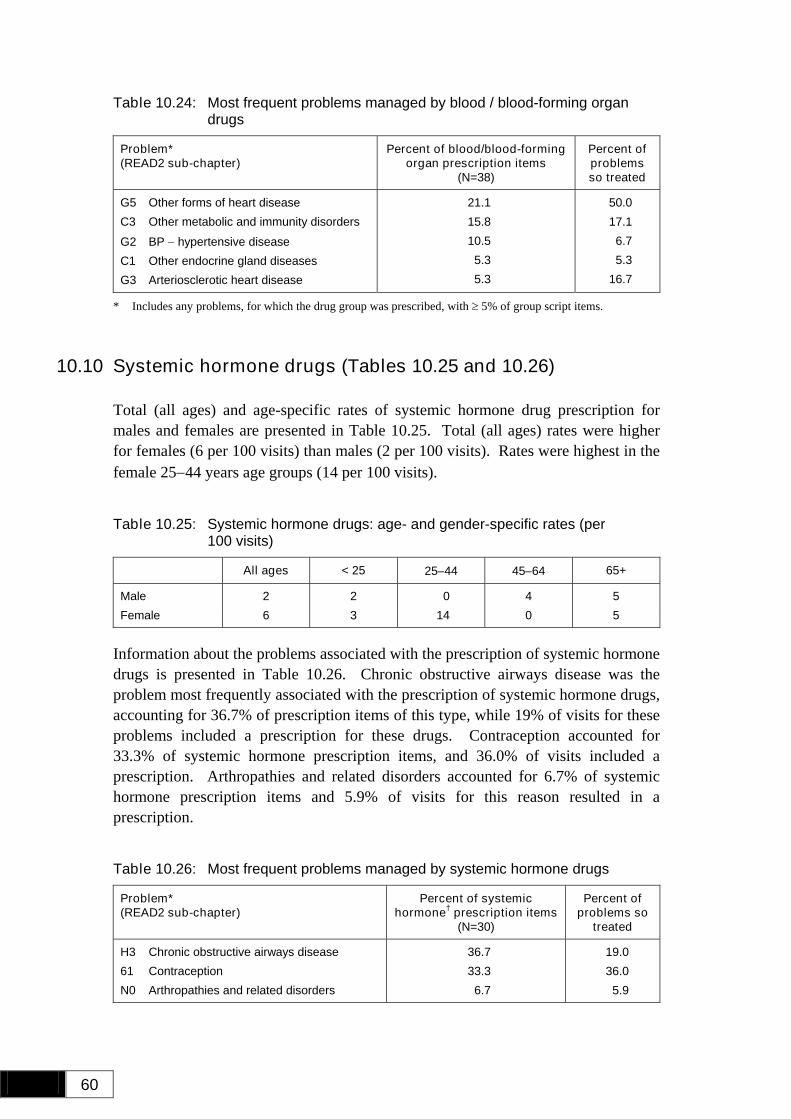
60
Table 10.24: Most frequent problems managed by blood / blood-forming organ drugs
Problem* (READ2 sub-chapter)
Percent of blood/blood-forming organ prescription items
(N=38)
Percent of problems so treated
G5 Other forms of heart disease C3 Other metabolic and immunity disorders G2 BP − hypertensive disease C1 Other endocrine gland diseases G3 Arteriosclerotic heart disease
21.1 15.8 10.5 5.3 5.3
50.0 17.1 6.7 5.3
16.7
* Includes any problems, for which the drug group was prescribed, with ≥ 5% of group script items.
10.10 Systemic hormone drugs (Tables 10.25 and 10.26)
Total (all ages) and age-specific rates of systemic hormone drug prescription for males and females are presented in Table 10.25. Total (all ages) rates were higher for females (6 per 100 visits) than males (2 per 100 visits). Rates were highest in the female 25−44 years age groups (14 per 100 visits).
Table 10.25: Systemic hormone drugs: age- and gender-specific rates (per 100 visits)
All ages < 25 25−44 45−64 65+
Male 2 2 0 4 5 Female 6 3 14 0 5
Information about the problems associated with the prescription of systemic hormone drugs is presented in Table 10.26. Chronic obstructive airways disease was the problem most frequently associated with the prescription of systemic hormone drugs, accounting for 36.7% of prescription items of this type, while 19% of visits for these problems included a prescription for these drugs. Contraception accounted for 33.3% of systemic hormone prescription items, and 36.0% of visits included a prescription. Arthropathies and related disorders accounted for 6.7% of systemic hormone prescription items and 5.9% of visits for this reason resulted in a prescription.
Table 10.26: Most frequent problems managed by systemic hormone drugs
Problem* (READ2 sub-chapter)
Percent of systemic hormone† prescription items
(N=30)
Percent of problems so
treated
H3 Chronic obstructive airways disease 61 Contraception N0 Arthropathies and related disorders
36.7 33.3 6.7
19.0 36.0 5.9
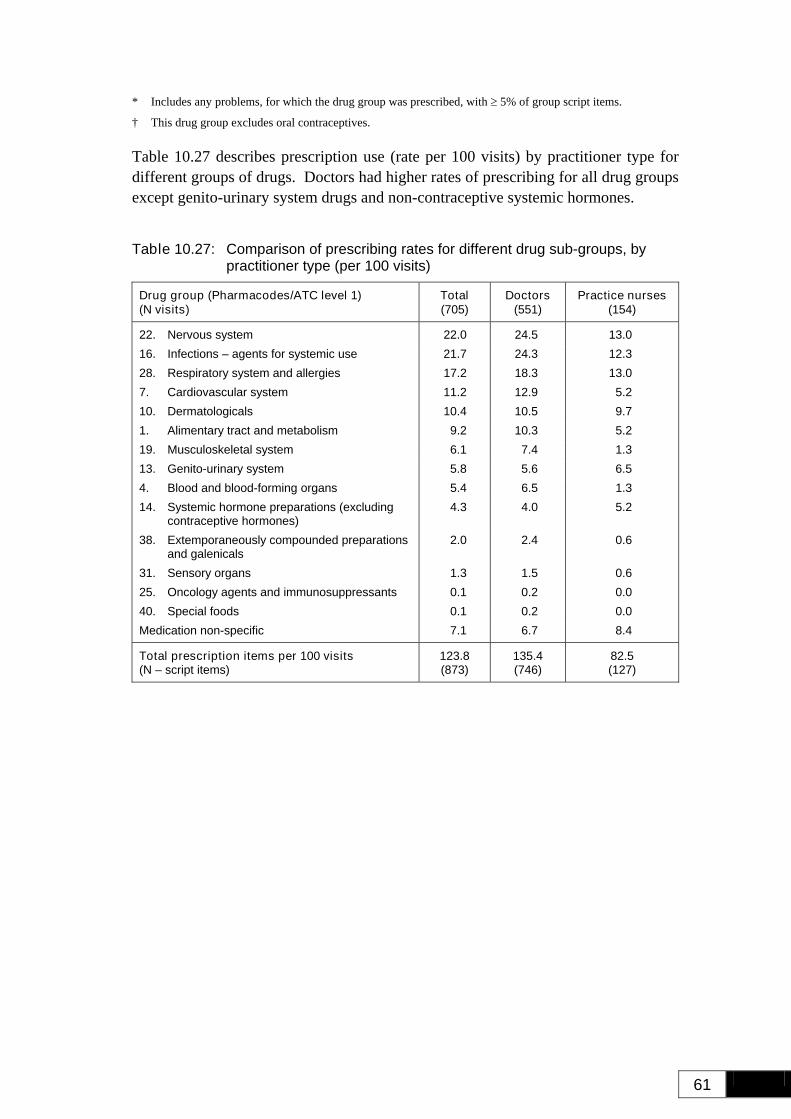
61
* Includes any problems, for which the drug group was prescribed, with ≥ 5% of group script items.
† This drug group excludes oral contraceptives.
Table 10.27 describes prescription use (rate per 100 visits) by practitioner type for different groups of drugs. Doctors had higher rates of prescribing for all drug groups except genito-urinary system drugs and non-contraceptive systemic hormones.
Table 10.27: Comparison of prescribing rates for different drug sub-groups, by practitioner type (per 100 visits)
Drug group (Pharmacodes/ATC level 1) (N visits)
Total (705)
Doctors (551)
Practice nurses(154)
22. Nervous system 22.0 24.5 13.0 16. Infections – agents for systemic use 21.7 24.3 12.3 28. Respiratory system and allergies 17.2 18.3 13.0 7. Cardiovascular system 11.2 12.9 5.2 10. Dermatologicals 10.4 10.5 9.7 1. Alimentary tract and metabolism 9.2 10.3 5.2 19. Musculoskeletal system 6.1 7.4 1.3 13. Genito-urinary system 5.8 5.6 6.5 4. Blood and blood-forming organs 5.4 6.5 1.3 14. Systemic hormone preparations (excluding
contraceptive hormones) 4.3 4.0 5.2
38. Extemporaneously compounded preparations and galenicals
2.0 2.4 0.6
31. Sensory organs 1.3 1.5 0.6 25. Oncology agents and immunosuppressants 0.1 0.2 0.0 40. Special foods 0.1 0.2 0.0 Medication non-specific 7.1 6.7 8.4
Total prescription items per 100 visits (N – script items)
123.8 (873)
135.4 (746)
82.5 (127)
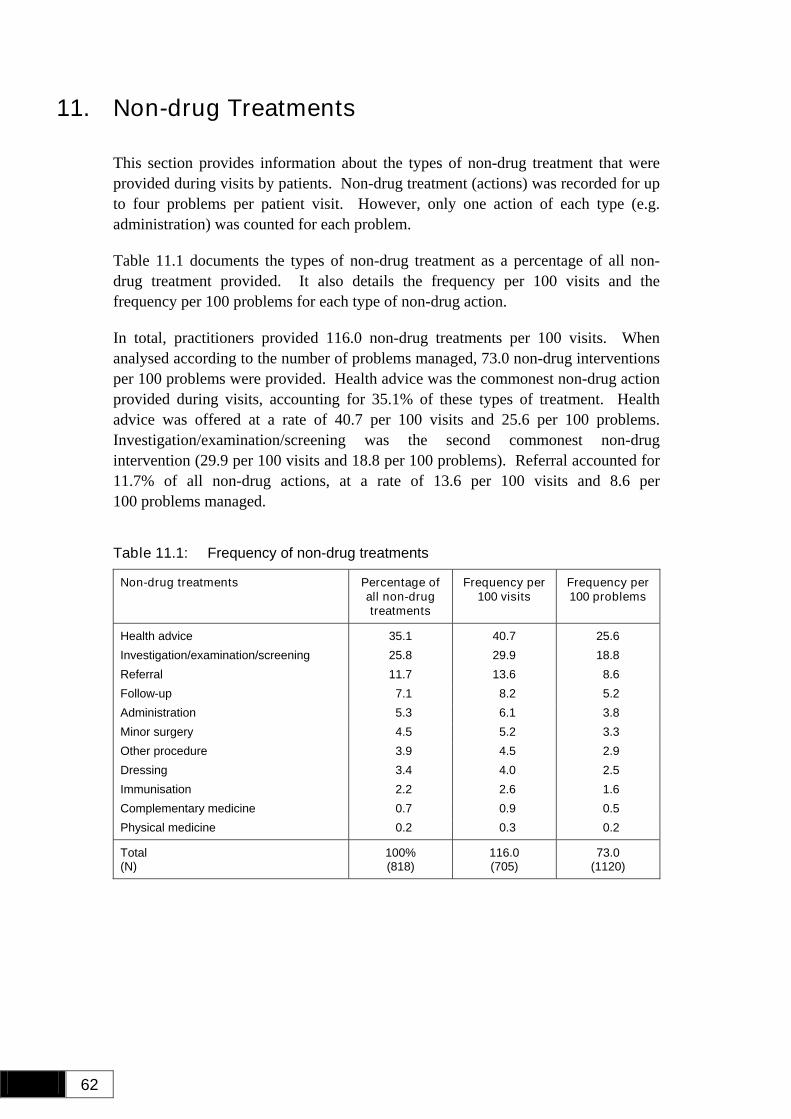
62
11. Non-drug Treatments
This section provides information about the types of non-drug treatment that were provided during visits by patients. Non-drug treatment (actions) was recorded for up to four problems per patient visit. However, only one action of each type (e.g. administration) was counted for each problem.
Table 11.1 documents the types of non-drug treatment as a percentage of all non-drug treatment provided. It also details the frequency per 100 visits and the frequency per 100 problems for each type of non-drug action.
In total, practitioners provided 116.0 non-drug treatments per 100 visits. When analysed according to the number of problems managed, 73.0 non-drug interventions per 100 problems were provided. Health advice was the commonest non-drug action provided during visits, accounting for 35.1% of these types of treatment. Health advice was offered at a rate of 40.7 per 100 visits and 25.6 per 100 problems. Investigation/examination/screening was the second commonest non-drug intervention (29.9 per 100 visits and 18.8 per 100 problems). Referral accounted for 11.7% of all non-drug actions, at a rate of 13.6 per 100 visits and 8.6 per 100 problems managed.
Table 11.1: Frequency of non-drug treatments
Non-drug treatments Percentage of all non-drug treatments
Frequency per 100 visits
Frequency per 100 problems
Health advice 35.1 40.7 25.6 Investigation/examination/screening 25.8 29.9 18.8 Referral 11.7 13.6 8.6 Follow-up 7.1 8.2 5.2 Administration 5.3 6.1 3.8 Minor surgery 4.5 5.2 3.3 Other procedure 3.9 4.5 2.9 Dressing 3.4 4.0 2.5 Immunisation 2.2 2.6 1.6 Complementary medicine 0.7 0.9 0.5 Physical medicine 0.2 0.3 0.2
Total (N)
100% (818)
116.0 (705)
73.0 (1120)
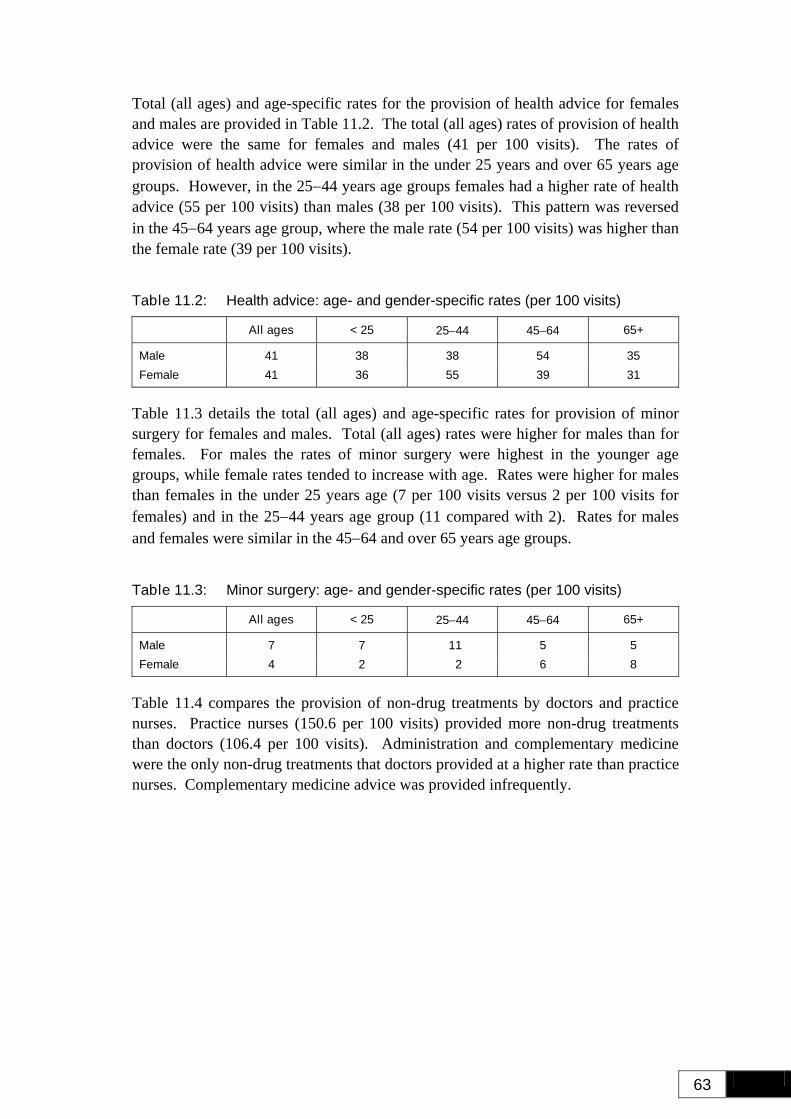
63
Total (all ages) and age-specific rates for the provision of health advice for females and males are provided in Table 11.2. The total (all ages) rates of provision of health advice were the same for females and males (41 per 100 visits). The rates of provision of health advice were similar in the under 25 years and over 65 years age groups. However, in the 25−44 years age groups females had a higher rate of health advice (55 per 100 visits) than males (38 per 100 visits). This pattern was reversed in the 45−64 years age group, where the male rate (54 per 100 visits) was higher than the female rate (39 per 100 visits).
Table 11.2: Health advice: age- and gender-specific rates (per 100 visits)
All ages < 25 25−44 45−64 65+
Male 41 38 38 54 35 Female 41 36 55 39 31
Table 11.3 details the total (all ages) and age-specific rates for provision of minor surgery for females and males. Total (all ages) rates were higher for males than for females. For males the rates of minor surgery were highest in the younger age groups, while female rates tended to increase with age. Rates were higher for males than females in the under 25 years age (7 per 100 visits versus 2 per 100 visits for females) and in the 25−44 years age group (11 compared with 2). Rates for males and females were similar in the 45−64 and over 65 years age groups.
Table 11.3: Minor surgery: age- and gender-specific rates (per 100 visits)
All ages < 25 25−44 45−64 65+
Male 7 7 11 5 5 Female 4 2 2 6 8
Table 11.4 compares the provision of non-drug treatments by doctors and practice nurses. Practice nurses (150.6 per 100 visits) provided more non-drug treatments than doctors (106.4 per 100 visits). Administration and complementary medicine were the only non-drug treatments that doctors provided at a higher rate than practice nurses. Complementary medicine advice was provided infrequently.
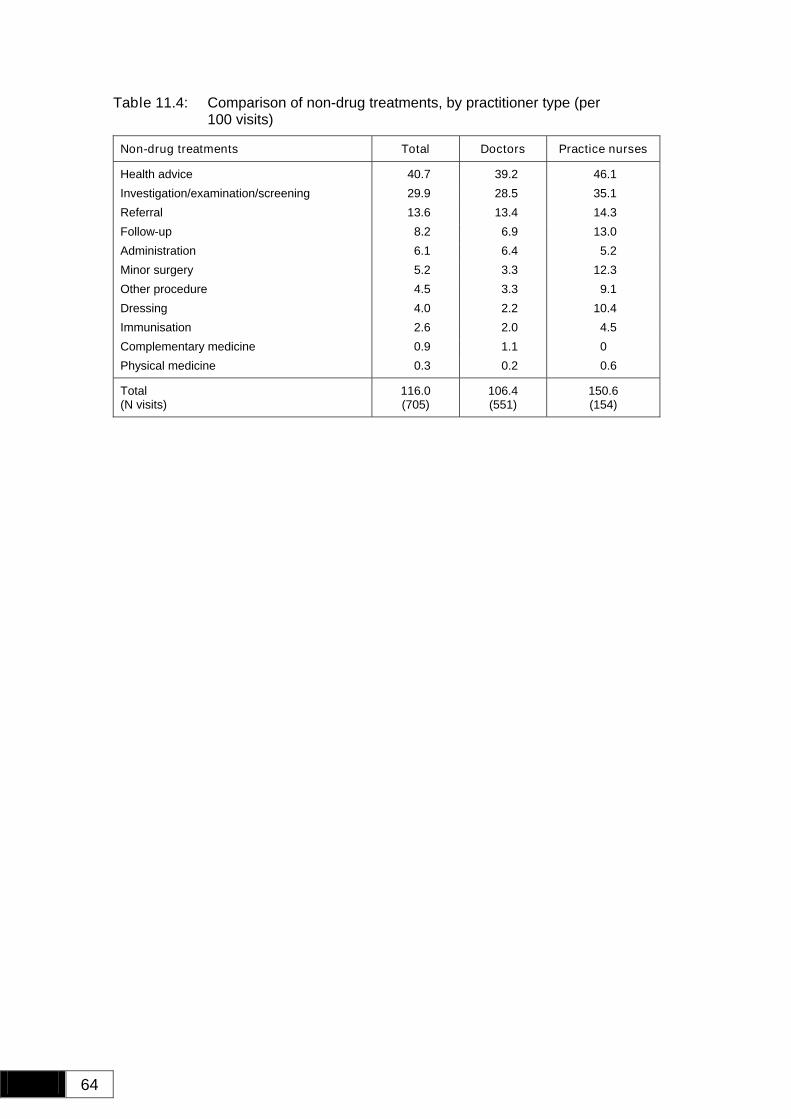
64
Table 11.4: Comparison of non-drug treatments, by practitioner type (per 100 visits)
Non-drug treatments Total Doctors Practice nurses
Health advice 40.7 39.2 46.1 Investigation/examination/screening 29.9 28.5 35.1 Referral 13.6 13.4 14.3 Follow-up 8.2 6.9 13.0 Administration 6.1 6.4 5.2 Minor surgery 5.2 3.3 12.3 Other procedure 4.5 3.3 9.1 Dressing 4.0 2.2 10.4 Immunisation 2.6 2.0 4.5 Complementary medicine 0.9 1.1 0 Physical medicine 0.3 0.2 0.6
Total (N visits)
116.0 (705)
106.4 (551)
150.6 (154)
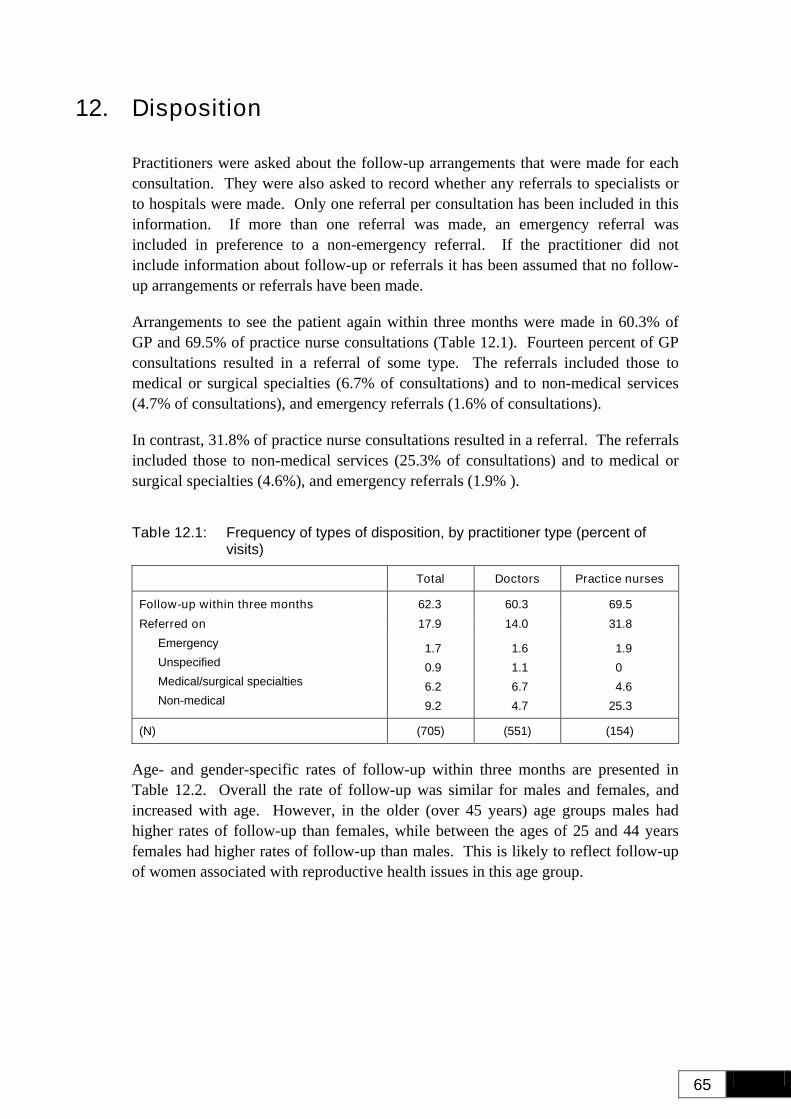
65
12. Disposition
Practitioners were asked about the follow-up arrangements that were made for each consultation. They were also asked to record whether any referrals to specialists or to hospitals were made. Only one referral per consultation has been included in this information. If more than one referral was made, an emergency referral was included in preference to a non-emergency referral. If the practitioner did not include information about follow-up or referrals it has been assumed that no follow-up arrangements or referrals have been made.
Arrangements to see the patient again within three months were made in 60.3% of GP and 69.5% of practice nurse consultations (Table 12.1). Fourteen percent of GP consultations resulted in a referral of some type. The referrals included those to medical or surgical specialties (6.7% of consultations) and to non-medical services (4.7% of consultations), and emergency referrals (1.6% of consultations).
In contrast, 31.8% of practice nurse consultations resulted in a referral. The referrals included those to non-medical services (25.3% of consultations) and to medical or surgical specialties (4.6%), and emergency referrals (1.9% ).
Table 12.1: Frequency of types of disposition, by practitioner type (percent of visits)
Total Doctors Practice nurses
Follow-up within three months 62.3 60.3 69.5 Referred on 17.9 14.0 31.8
Emergency Unspecified Medical/surgical specialties Non-medical
1.7 0.9 6.2 9.2
1.6 1.1 6.7 4.7
1.9 0 4.6
25.3
(N) (705) (551) (154)
Age- and gender-specific rates of follow-up within three months are presented in Table 12.2. Overall the rate of follow-up was similar for males and females, and increased with age. However, in the older (over 45 years) age groups males had higher rates of follow-up than females, while between the ages of 25 and 44 years females had higher rates of follow-up than males. This is likely to reflect follow-up of women associated with reproductive health issues in this age group.
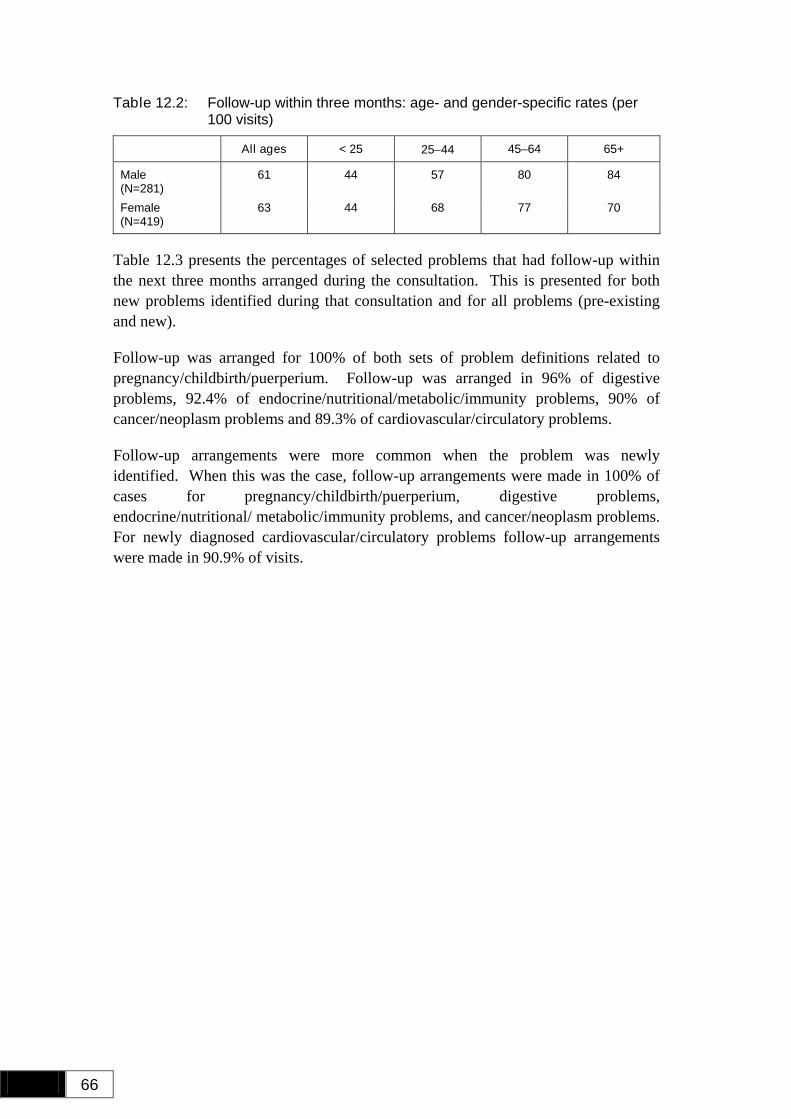
66
Table 12.2: Follow-up within three months: age- and gender-specific rates (per 100 visits)
All ages < 25 25−44 45–64 65+
Male (N=281)
61 44 57 80 84
Female (N=419)
63 44 68 77 70
Table 12.3 presents the percentages of selected problems that had follow-up within the next three months arranged during the consultation. This is presented for both new problems identified during that consultation and for all problems (pre-existing and new).
Follow-up was arranged for 100% of both sets of problem definitions related to pregnancy/childbirth/puerperium. Follow-up was arranged in 96% of digestive problems, 92.4% of endocrine/nutritional/metabolic/immunity problems, 90% of cancer/neoplasm problems and 89.3% of cardiovascular/circulatory problems.
Follow-up arrangements were more common when the problem was newly identified. When this was the case, follow-up arrangements were made in 100% of cases for pregnancy/childbirth/puerperium, digestive problems, endocrine/nutritional/ metabolic/immunity problems, and cancer/neoplasm problems. For newly diagnosed cardiovascular/circulatory problems follow-up arrangements were made in 90.9% of visits.
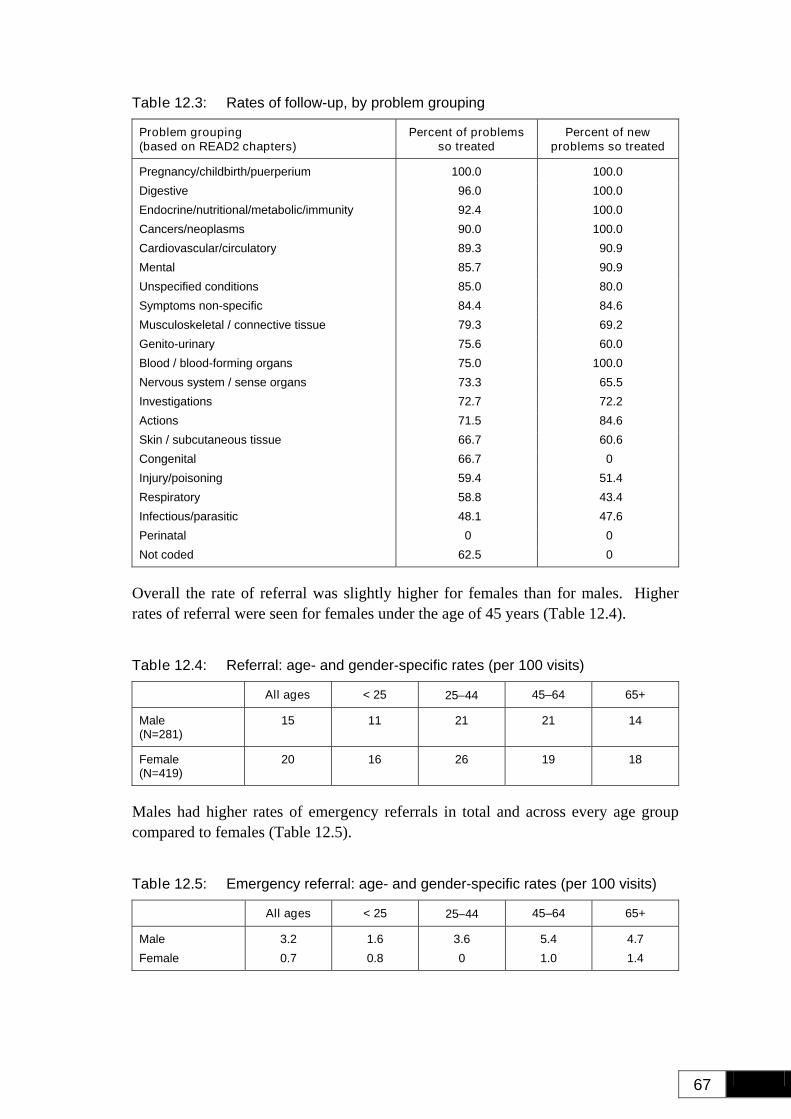
67
Table 12.3: Rates of follow-up, by problem grouping
Problem grouping (based on READ2 chapters)
Percent of problems so treated
Percent of new problems so treated
Pregnancy/childbirth/puerperium 100.0 100.0 Digestive 96.0 100.0 Endocrine/nutritional/metabolic/immunity 92.4 100.0 Cancers/neoplasms 90.0 100.0 Cardiovascular/circulatory 89.3 90.9 Mental 85.7 90.9 Unspecified conditions 85.0 80.0 Symptoms non-specific 84.4 84.6 Musculoskeletal / connective tissue 79.3 69.2 Genito-urinary 75.6 60.0 Blood / blood-forming organs 75.0 100.0 Nervous system / sense organs 73.3 65.5 Investigations 72.7 72.2 Actions 71.5 84.6 Skin / subcutaneous tissue 66.7 60.6 Congenital 66.7 0 Injury/poisoning 59.4 51.4 Respiratory 58.8 43.4 Infectious/parasitic 48.1 47.6 Perinatal 0 0 Not coded 62.5 0
Overall the rate of referral was slightly higher for females than for males. Higher rates of referral were seen for females under the age of 45 years (Table 12.4).
Table 12.4: Referral: age- and gender-specific rates (per 100 visits)
All ages < 25 25−44 45–64 65+
Male (N=281)
15 11 21 21 14
Female (N=419)
20 16 26 19 18
Males had higher rates of emergency referrals in total and across every age group compared to females (Table 12.5).
Table 12.5: Emergency referral: age- and gender-specific rates (per 100 visits)
All ages < 25 25−44 45–64 65+
Male 3.2 1.6 3.6 5.4 4.7 Female 0.7 0.8 0 1.0 1.4
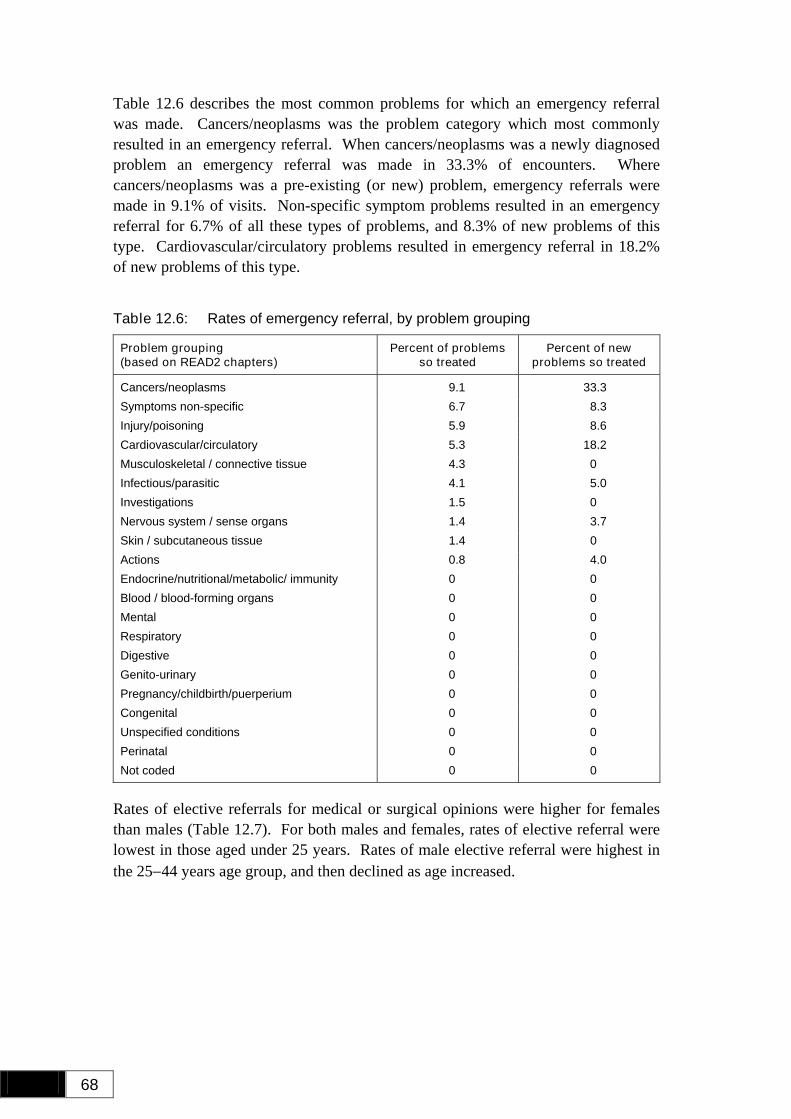
68
Table 12.6 describes the most common problems for which an emergency referral was made. Cancers/neoplasms was the problem category which most commonly resulted in an emergency referral. When cancers/neoplasms was a newly diagnosed problem an emergency referral was made in 33.3% of encounters. Where cancers/neoplasms was a pre-existing (or new) problem, emergency referrals were made in 9.1% of visits. Non-specific symptom problems resulted in an emergency referral for 6.7% of all these types of problems, and 8.3% of new problems of this type. Cardiovascular/circulatory problems resulted in emergency referral in 18.2% of new problems of this type.
Table 12.6: Rates of emergency referral, by problem grouping
Problem grouping (based on READ2 chapters)
Percent of problems so treated
Percent of new problems so treated
Cancers/neoplasms 9.1 33.3 Symptoms non-specific 6.7 8.3 Injury/poisoning 5.9 8.6 Cardiovascular/circulatory 5.3 18.2 Musculoskeletal / connective tissue 4.3 0 Infectious/parasitic 4.1 5.0 Investigations 1.5 0 Nervous system / sense organs 1.4 3.7 Skin / subcutaneous tissue 1.4 0 Actions 0.8 4.0 Endocrine/nutritional/metabolic/ immunity 0 0 Blood / blood-forming organs 0 0 Mental 0 0 Respiratory 0 0 Digestive 0 0 Genito-urinary 0 0 Pregnancy/childbirth/puerperium 0 0 Congenital 0 0 Unspecified conditions 0 0 Perinatal 0 0 Not coded 0 0
Rates of elective referrals for medical or surgical opinions were higher for females than males (Table 12.7). For both males and females, rates of elective referral were lowest in those aged under 25 years. Rates of male elective referral were highest in the 25−44 years age group, and then declined as age increased.
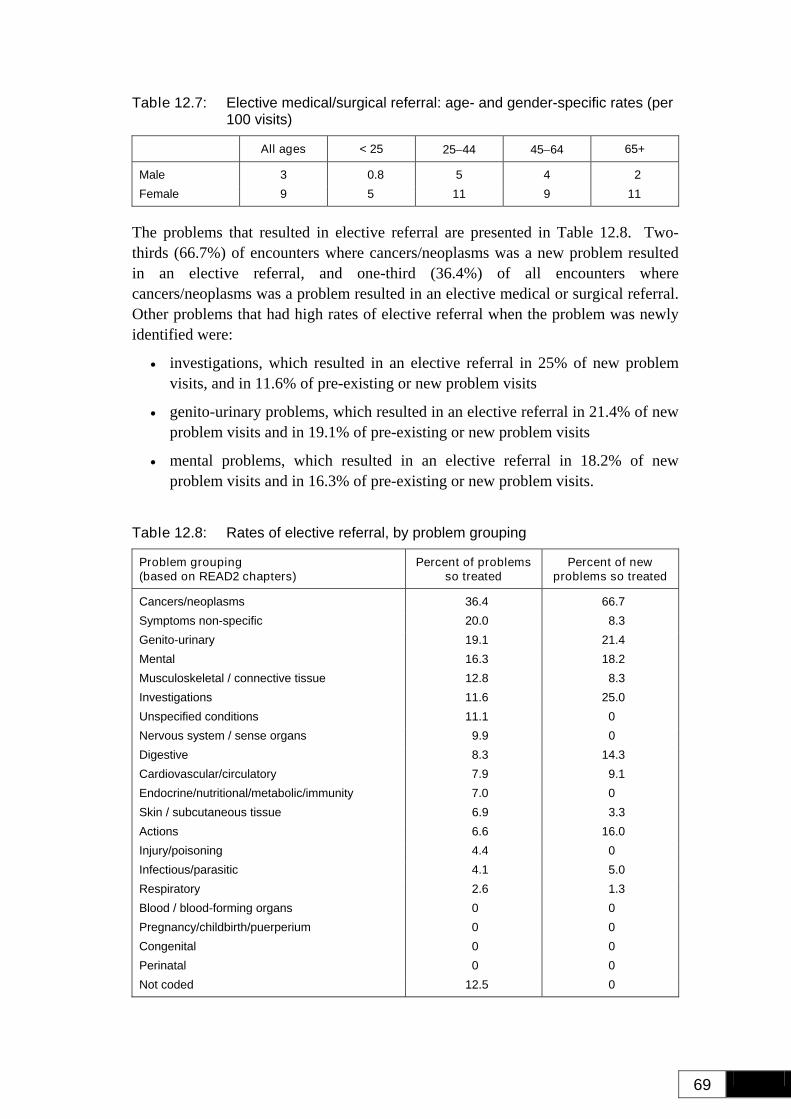
69
Table 12.7: Elective medical/surgical referral: age- and gender-specific rates (per 100 visits)
All ages < 25 25−44 45−64 65+
Male 3 0.8 5 4 2 Female 9 5 11 9 11
The problems that resulted in elective referral are presented in Table 12.8. Two-thirds (66.7%) of encounters where cancers/neoplasms was a new problem resulted in an elective referral, and one-third (36.4%) of all encounters where cancers/neoplasms was a problem resulted in an elective medical or surgical referral. Other problems that had high rates of elective referral when the problem was newly identified were:
• investigations, which resulted in an elective referral in 25% of new problem visits, and in 11.6% of pre-existing or new problem visits
• genito-urinary problems, which resulted in an elective referral in 21.4% of new problem visits and in 19.1% of pre-existing or new problem visits
• mental problems, which resulted in an elective referral in 18.2% of new problem visits and in 16.3% of pre-existing or new problem visits.
Table 12.8: Rates of elective referral, by problem grouping
Problem grouping (based on READ2 chapters)
Percent of problems so treated
Percent of new problems so treated
Cancers/neoplasms 36.4 66.7 Symptoms non-specific 20.0 8.3 Genito-urinary 19.1 21.4 Mental 16.3 18.2 Musculoskeletal / connective tissue 12.8 8.3 Investigations 11.6 25.0 Unspecified conditions 11.1 0 Nervous system / sense organs 9.9 0 Digestive 8.3 14.3 Cardiovascular/circulatory 7.9 9.1 Endocrine/nutritional/metabolic/immunity 7.0 0 Skin / subcutaneous tissue 6.9 3.3 Actions 6.6 16.0 Injury/poisoning 4.4 0 Infectious/parasitic 4.1 5.0 Respiratory 2.6 1.3 Blood / blood-forming organs 0 0 Pregnancy/childbirth/puerperium 0 0 Congenital 0 0 Perinatal 0 0 Not coded 12.5 0
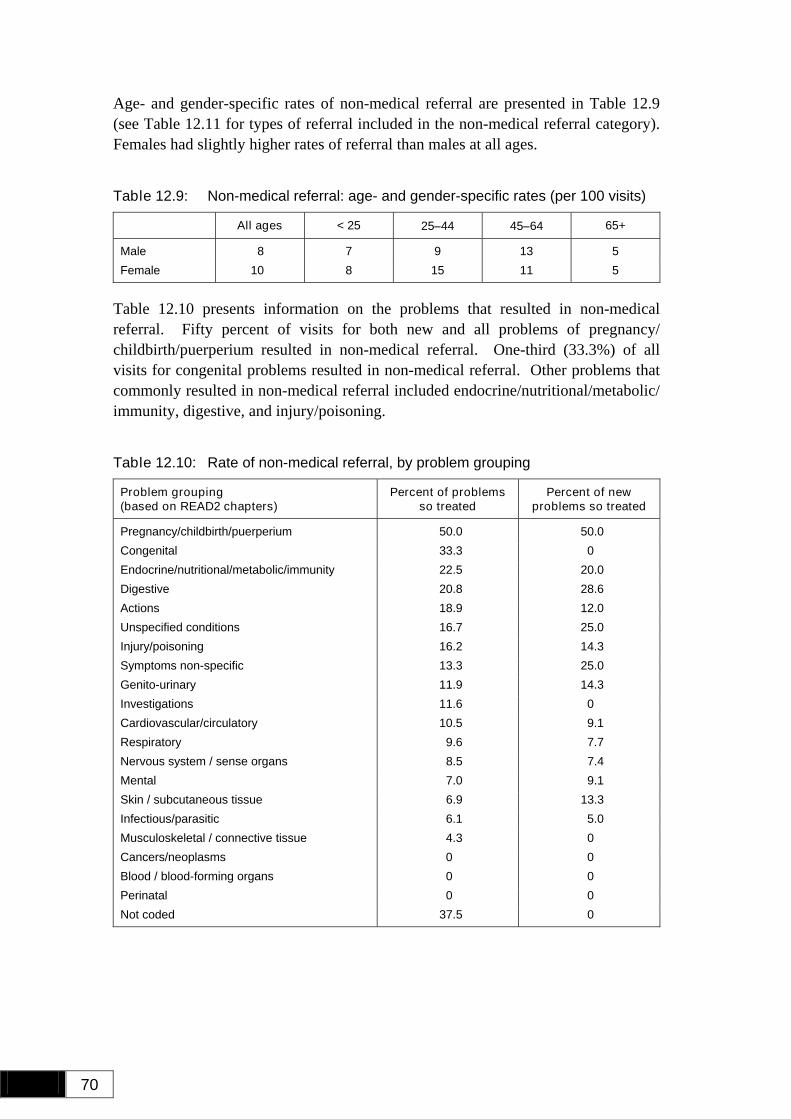
70
Age- and gender-specific rates of non-medical referral are presented in Table 12.9 (see Table 12.11 for types of referral included in the non-medical referral category). Females had slightly higher rates of referral than males at all ages.
Table 12.9: Non-medical referral: age- and gender-specific rates (per 100 visits)
All ages < 25 25−44 45−64 65+
Male 8 7 9 13 5 Female 10 8 15 11 5
Table 12.10 presents information on the problems that resulted in non-medical referral. Fifty percent of visits for both new and all problems of pregnancy/ childbirth/puerperium resulted in non-medical referral. One-third (33.3%) of all visits for congenital problems resulted in non-medical referral. Other problems that commonly resulted in non-medical referral included endocrine/nutritional/metabolic/ immunity, digestive, and injury/poisoning.
Table 12.10: Rate of non-medical referral, by problem grouping
Problem grouping (based on READ2 chapters)
Percent of problems so treated
Percent of new problems so treated
Pregnancy/childbirth/puerperium 50.0 50.0 Congenital 33.3 0 Endocrine/nutritional/metabolic/immunity 22.5 20.0 Digestive 20.8 28.6 Actions 18.9 12.0 Unspecified conditions 16.7 25.0 Injury/poisoning 16.2 14.3 Symptoms non-specific 13.3 25.0 Genito-urinary 11.9 14.3 Investigations 11.6 0 Cardiovascular/circulatory 10.5 9.1 Respiratory 9.6 7.7 Nervous system / sense organs 8.5 7.4 Mental 7.0 9.1 Skin / subcutaneous tissue 6.9 13.3 Infectious/parasitic 6.1 5.0 Musculoskeletal / connective tissue 4.3 0 Cancers/neoplasms 0 0 Blood / blood-forming organs 0 0 Perinatal 0 0 Not coded 37.5 0
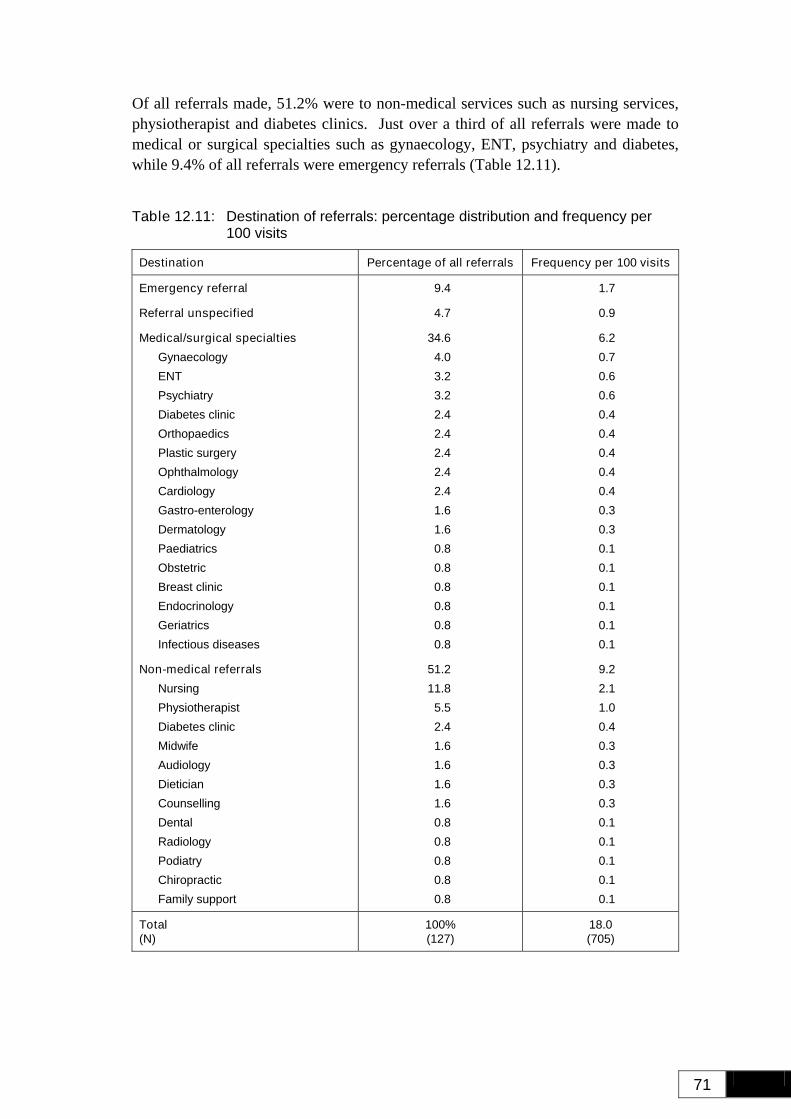
71
Of all referrals made, 51.2% were to non-medical services such as nursing services, physiotherapist and diabetes clinics. Just over a third of all referrals were made to medical or surgical specialties such as gynaecology, ENT, psychiatry and diabetes, while 9.4% of all referrals were emergency referrals (Table 12.11).
Table 12.11: Destination of referrals: percentage distribution and frequency per 100 visits
Destination Percentage of all referrals Frequency per 100 visits
Emergency referral
Referral unspecified
Medical/surgical specialties Gynaecology ENT Psychiatry Diabetes clinic Orthopaedics Plastic surgery Ophthalmology Cardiology Gastro-enterology Dermatology Paediatrics Obstetric Breast clinic Endocrinology Geriatrics Infectious diseases
Non-medical referrals Nursing Physiotherapist Diabetes clinic Midwife Audiology Dietician Counselling Dental Radiology Podiatry Chiropractic Family support
9.4
4.7
34.6 4.0 3.2 3.2 2.4 2.4 2.4 2.4 2.4 1.6 1.6 0.8 0.8 0.8 0.8 0.8 0.8
51.2 11.8 5.5 2.4 1.6 1.6 1.6 1.6 0.8 0.8 0.8 0.8 0.8
1.7
0.9
6.2 0.7 0.6 0.6 0.4 0.4 0.4 0.4 0.4 0.3 0.3 0.1 0.1 0.1 0.1 0.1 0.1
9.2 2.1 1.0 0.4 0.3 0.3 0.3 0.3 0.1 0.1 0.1 0.1 0.1
Total (N)
100% (127)
18.0 (705)
72
13. Comparison of Māori, Community-governed, and Private GP Providers
This section provides some information that compares Māori providers with community-governed non-profit (CGNP) and private GPs. When comparing Māori and private providers the reader needs to bear in mind the relative youth of Māori providers when compared with (in particular) the “private” (sole trader or private partnership) model of practice.
Although this section makes comparisons between Māori, CGNP and private GP providers, the results are evaluative and should be interpreted with some caution. No statistical tests of significance have been undertaken, so we cannot state whether any apparent differences between provider types are significant or not (refer to the subsection ‘Statistical considerations’ in section 2.9).
13.1 Organisational and management characteristics
Table 13.1 describes the organisational and management characteristics of the three types of practices involved in the survey. These data are drawn from the questionnaires completed by practices participating in NatMedCa.
The Māori provider practices had a mean 2.5 full-time equivalent (FTE) doctors, 1.9 FTE nurses and 2.1 FTE community health workers. Compared with CGNP practices, Māori providers had fewer medical and nursing staff. This finding was reversed for community health workers. Māori provider practices had a mean 2.1 FTE community health workers: private GPs had none and CGNP practices had 0.4.
Accessibility, in terms of hours of operation, also varied across the three practice types. Māori provider practices were open on average 43.9 hours per week, which is lower than both private (48.9 hours) and CGNP (45.1 hours) practices. Thirty percent of Māori provider practices opened for evening surgery, compared with 33.3% of CGNP practices and 41.9% of private GP practices. Fewer Māori provider practices (20%) were open for weekend surgeries, compared with 66.7% of CGNP practices and 33.3% of private GPs. These findings may reflect the lower medical and nursing staffing found in Māori provider practices, or may result from funding constraints.
All Māori provider and CGNP practices, and 97.0% of private GP practices, operated booking (appointment) systems.
Over two-thirds (68.4%) of patients attending Māori provider practices were Māori. Māori accounted for 18.1% of patients attending CGNP practices. This is slightly
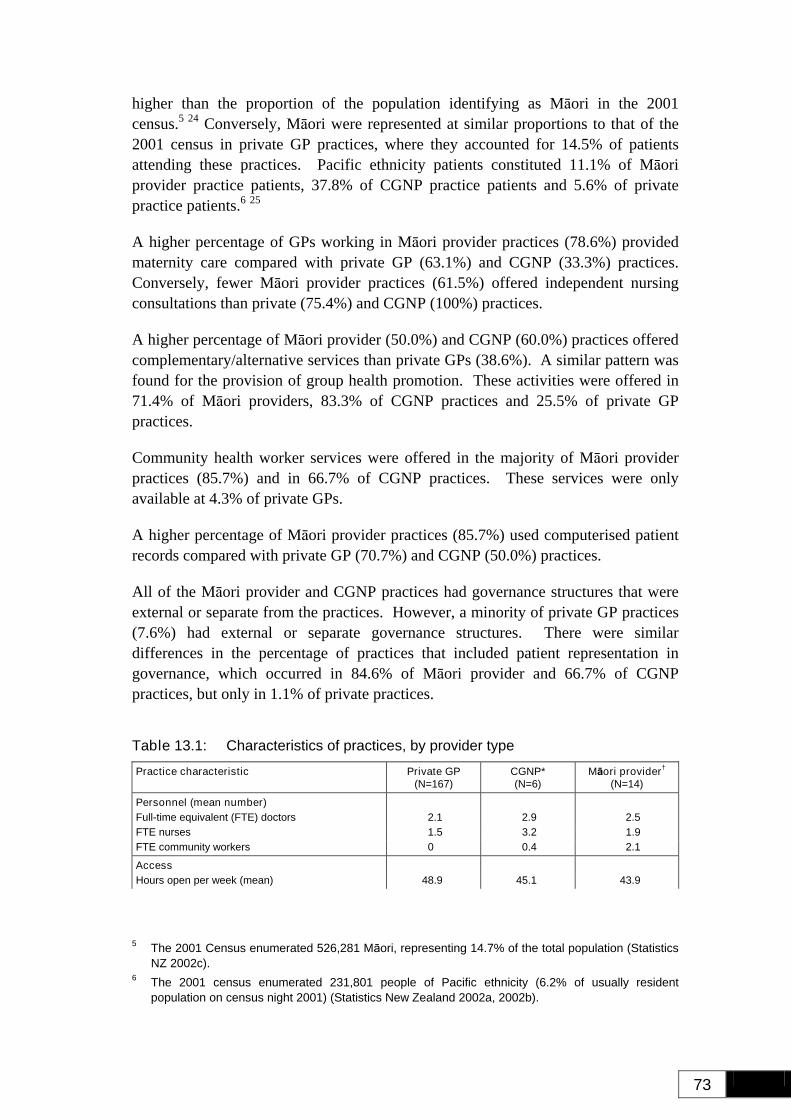
73
higher than the proportion of the population identifying as Māori in the 2001 census.5 24 Conversely, Māori were represented at similar proportions to that of the 2001 census in private GP practices, where they accounted for 14.5% of patients attending these practices. Pacific ethnicity patients constituted 11.1% of Māori provider practice patients, 37.8% of CGNP practice patients and 5.6% of private practice patients.6 25
A higher percentage of GPs working in Māori provider practices (78.6%) provided maternity care compared with private GP (63.1%) and CGNP (33.3%) practices. Conversely, fewer Māori provider practices (61.5%) offered independent nursing consultations than private (75.4%) and CGNP (100%) practices.
A higher percentage of Māori provider (50.0%) and CGNP (60.0%) practices offered complementary/alternative services than private GPs (38.6%). A similar pattern was found for the provision of group health promotion. These activities were offered in 71.4% of Māori providers, 83.3% of CGNP practices and 25.5% of private GP practices.
Community health worker services were offered in the majority of Māori provider practices (85.7%) and in 66.7% of CGNP practices. These services were only available at 4.3% of private GPs.
A higher percentage of Māori provider practices (85.7%) used computerised patient records compared with private GP (70.7%) and CGNP (50.0%) practices.
All of the Māori provider and CGNP practices had governance structures that were external or separate from the practices. However, a minority of private GP practices (7.6%) had external or separate governance structures. There were similar differences in the percentage of practices that included patient representation in governance, which occurred in 84.6% of Māori provider and 66.7% of CGNP practices, but only in 1.1% of private practices.
Table 13.1: Characteristics of practices, by provider type
Practice characteristic Private GP (N=167)
CGNP* (N=6)
Māori provider† (N=14)
Personnel (mean number) Full-time equivalent (FTE) doctors 2.1 2.9 2.5 FTE nurses 1.5 3.2 1.9 FTE community workers 0 0.4 2.1
Access Hours open per week (mean) 48.9 45.1 43.9
5 The 2001 Census enumerated 526,281 Māori, representing 14.7% of the total population (Statistics
NZ 2002c). 6 The 2001 census enumerated 231,801 people of Pacific ethnicity (6.2% of usually resident
population on census night 2001) (Statistics New Zealand 2002a, 2002b).
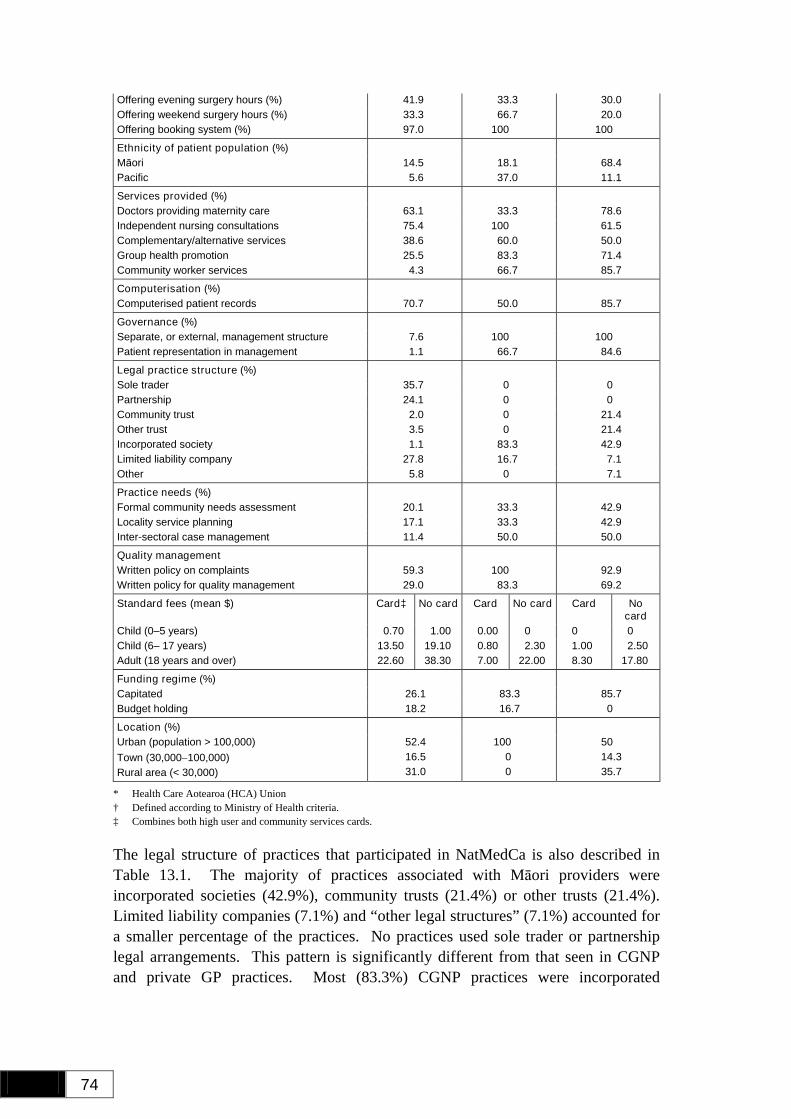
74
Offering evening surgery hours (%) 41.9 33.3 30.0 Offering weekend surgery hours (%) 33.3 66.7 20.0 Offering booking system (%) 97.0 100 100
Ethnicity of patient population (%) Māori 14.5 18.1 68.4 Pacific 5.6 37.0 11.1
Services provided (%) Doctors providing maternity care 63.1 33.3 78.6 Independent nursing consultations 75.4 100 61.5 Complementary/alternative services 38.6 60.0 50.0 Group health promotion 25.5 83.3 71.4 Community worker services 4.3 66.7 85.7
Computerisation (%) Computerised patient records 70.7 50.0 85.7
Governance (%) Separate, or external, management structure 7.6 100 100 Patient representation in management 1.1 66.7 84.6
Legal practice structure (%) Sole trader 35.7 0 0 Partnership 24.1 0 0 Community trust 2.0 0 21.4 Other trust 3.5 0 21.4 Incorporated society 1.1 83.3 42.9 Limited liability company 27.8 16.7 7.1 Other 5.8 0 7.1
Practice needs (%) Formal community needs assessment 20.1 33.3 42.9 Locality service planning 17.1 33.3 42.9 Inter-sectoral case management 11.4 50.0 50.0
Quality management Written policy on complaints 59.3 100 92.9 Written policy for quality management 29.0 83.3 69.2
Standard fees (mean $) Card‡ No card Card No card Card No card
Child (0–5 years) 0.70 1.00 0.00 0 0 0 Child (6– 17 years) 13.50 19.10 0.80 2.30 1.00 2.50 Adult (18 years and over) 22.60 38.30 7.00 22.00 8.30 17.80
Funding regime (%) Capitated 26.1 83.3 85.7 Budget holding 18.2 16.7 0
Location (%) Urban (population > 100,000) Town (30,000−100,000) Rural area (< 30,000)
52.4 16.5 31.0
100 0 0
50 14.3 35.7
* Health Care Aotearoa (HCA) Union † Defined according to Ministry of Health criteria. ‡ Combines both high user and community services cards.
The legal structure of practices that participated in NatMedCa is also described in Table 13.1. The majority of practices associated with Māori providers were incorporated societies (42.9%), community trusts (21.4%) or other trusts (21.4%). Limited liability companies (7.1%) and “other legal structures” (7.1%) accounted for a smaller percentage of the practices. No practices used sole trader or partnership legal arrangements. This pattern is significantly different from that seen in CGNP and private GP practices. Most (83.3%) CGNP practices were incorporated
75
societies, with the remainder (16.7%) being limited liability companies. Private practices were usually limited liability companies (27.8%), partnerships (24.1%) and sole traders (35.7%). Smaller percentages were community trusts (2.0%), other trusts (3.5%), incorporated societies (1.1%), and other legal structures (5.8 %).
A greater percentage of practices associated with Māori providers had undertaken a formal community needs assessment (42.9%), utilised locality service planning (42.9%) and inter-sectoral case management (50%). These findings were similar to those of CGNP practices, for whom one-third (33.3%) had undertaken a formal community needs assessment and made use of locality service planning and 50% used inter-sectoral case management. A small percentage of private practices had undertaken these activities: only 20.1% undertook a formal community needs assessment, 17.1% made use of locality service planning and 11.4% made use of inter-sectoral case management.
Nearly all (92.9%) of Māori provider practices had a written policy about complaints and 69.2% had a written policy about quality management. In comparison, all CGNPs had written policies on complaints and 83.3% had a written policy on quality management. GP private practices had much lower percentages, with 59.3% having a written policy on complaints and 29.0% a policy for quality management.
Fee structures were also different. Māori provider practice mean fees were $0 for children aged 0–5 years, $1.00 for card-holding and $2.50 for non-card-holding children aged 6–17, and $8.30 for card-holding and $17.80 for non-card-holding adults. Fee structures in CGNP practices were similar, except that non-card-holding adults had a mean fee that was slightly higher at $22.00. Fees in private practices were higher apart from children aged nought to five (mean fee $0.70 for card holders and $1.00 for non-card holders). Card-holding and non-card-holding children aged 6–17 years and adults were charged much higher in private practices.
Most Māori provider practices (85.7%) were capitated and none were funded using budget-holding mechanisms. Similarly, most CGNP practices (83.3%) were capitated, although 16.7% had budget-holding. Only about a quarter (26.1%) of private practices were capitated and a further 18.2% were budget-holding.
Over a third (35.7%) of Māori provider practices were located in rural areas. Likewise about one-third (31.0%) of private GPs were in rural areas, but no CGNP practices were located in rural areas.
Table 13.2 provides information about the general practitioners working in each of the three practice types. Māori provider practices had lower percentages of New Zealand European doctors than both CGNP and private practices. CGNP and Māori providers had similar percentages of Māori GPs working for them. A very small percentage of GPs working in private services were of Māori or Pacific ethnicity. GPs of Asian and “other” ethnicity accounted for a higher proportion of GPs in Māori providers.
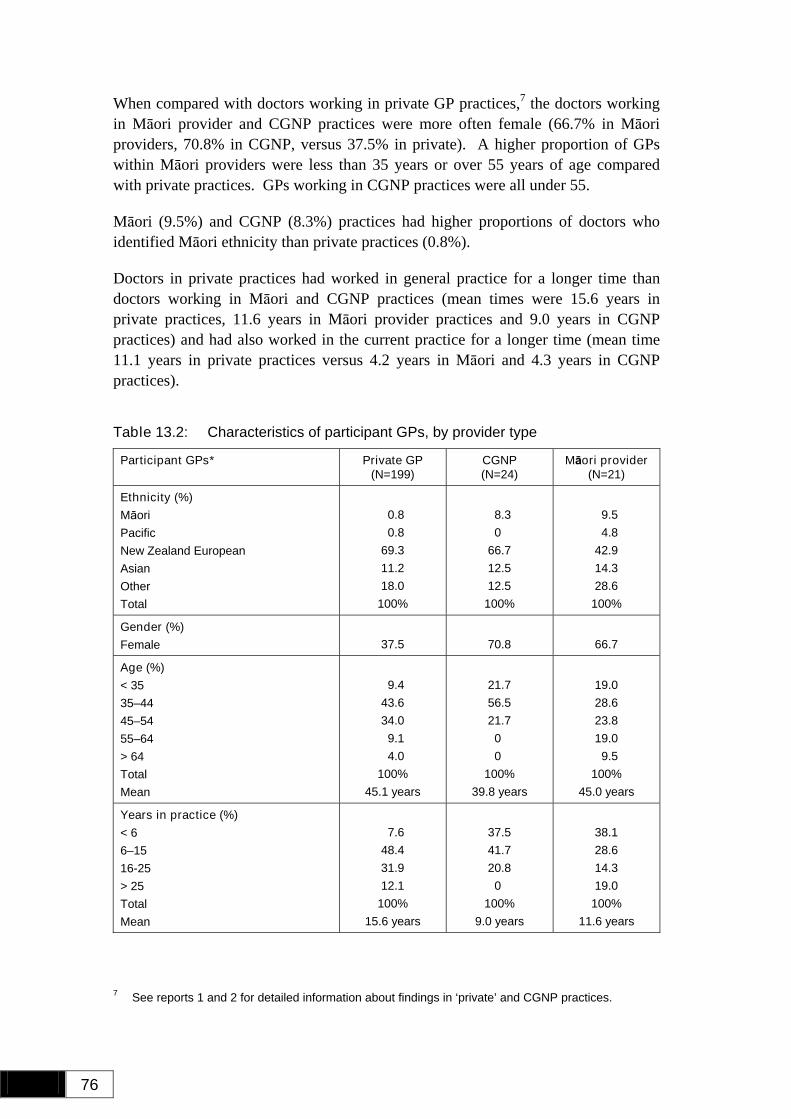
76
When compared with doctors working in private GP practices,7 the doctors working in Māori provider and CGNP practices were more often female (66.7% in Māori providers, 70.8% in CGNP, versus 37.5% in private). A higher proportion of GPs within Māori providers were less than 35 years or over 55 years of age compared with private practices. GPs working in CGNP practices were all under 55.
Māori (9.5%) and CGNP (8.3%) practices had higher proportions of doctors who identified Māori ethnicity than private practices (0.8%).
Doctors in private practices had worked in general practice for a longer time than doctors working in Māori and CGNP practices (mean times were 15.6 years in private practices, 11.6 years in Māori provider practices and 9.0 years in CGNP practices) and had also worked in the current practice for a longer time (mean time 11.1 years in private practices versus 4.2 years in Māori and 4.3 years in CGNP practices).
Table 13.2: Characteristics of participant GPs, by provider type
Participant GPs* Private GP (N=199)
CGNP (N=24)
Māori provider (N=21)
Ethnicity (%) Māori Pacific New Zealand European Asian Other Total
0.8 0.8
69.3 11.2 18.0
100%
8.3 0
66.7 12.5 12.5
100%
9.5 4.8
42.9 14.3 28.6
100%
Gender (%) Female
37.5
70.8
66.7
Age (%) < 35 35–44 45–54 55–64 > 64 Total Mean
9.4
43.6 34.0 9.1 4.0
100% 45.1 years
21.7 56.5 21.7 0 0
100% 39.8 years
19.0 28.6 23.8 19.0 9.5
100% 45.0 years
Years in practice (%) < 6 6–15 16-25 > 25 Total Mean
7.6
48.4 31.9 12.1
100% 15.6 years
37.5 41.7 20.8 0
100% 9.0 years
38.1 28.6 14.3 19.0
100% 11.6 years
7 See reports 1 and 2 for detailed information about findings in ‘private’ and CGNP practices.
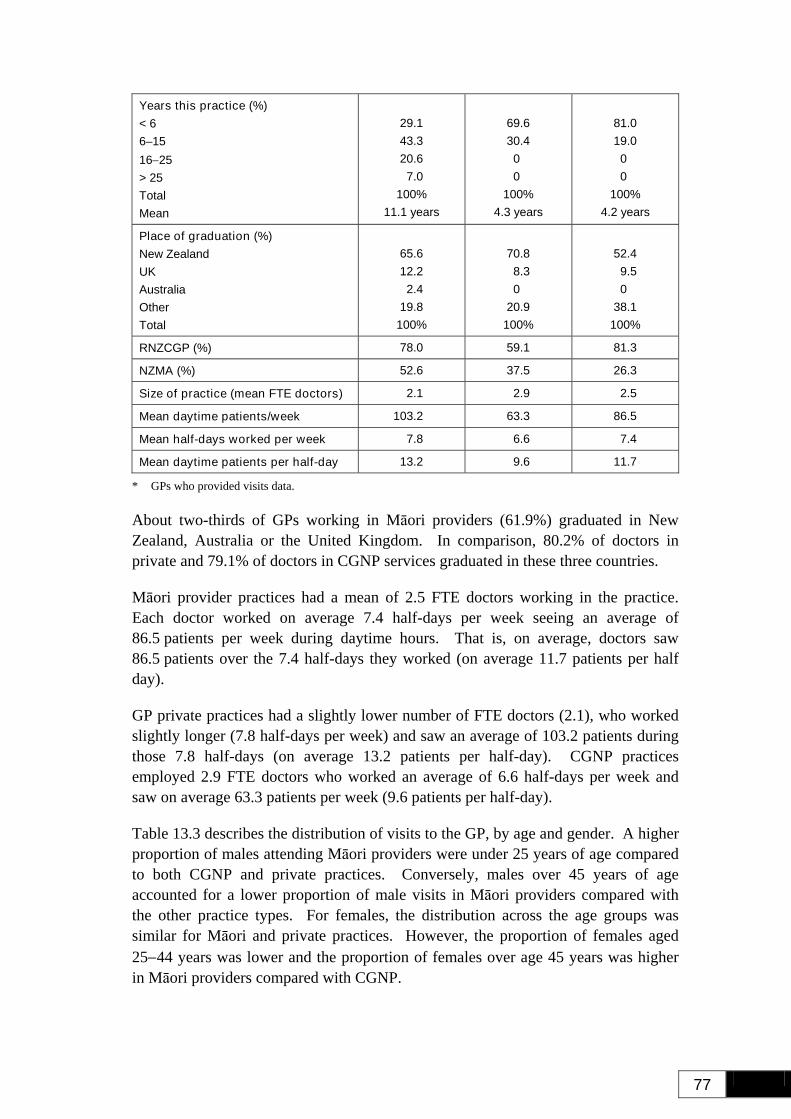
77
Years this practice (%) < 6 6–15 16−25 > 25 Total Mean
29.1 43.3 20.6 7.0
100% 11.1 years
69.6 30.4 0 0
100% 4.3 years
81.0 19.0 0 0
100% 4.2 years
Place of graduation (%) New Zealand UK Australia Other Total
65.6 12.2 2.4
19.8 100%
70.8 8.3 0
20.9 100%
52.4 9.5 0
38.1 100%
RNZCGP (%) 78.0 59.1 81.3
NZMA (%) 52.6 37.5 26.3
Size of practice (mean FTE doctors) 2.1 2.9 2.5
Mean daytime patients/week 103.2 63.3 86.5
Mean half-days worked per week 7.8 6.6 7.4
Mean daytime patients per half-day 13.2 9.6 11.7
* GPs who provided visits data.
About two-thirds of GPs working in Māori providers (61.9%) graduated in New Zealand, Australia or the United Kingdom. In comparison, 80.2% of doctors in private and 79.1% of doctors in CGNP services graduated in these three countries.
Māori provider practices had a mean of 2.5 FTE doctors working in the practice. Each doctor worked on average 7.4 half-days per week seeing an average of 86.5 patients per week during daytime hours. That is, on average, doctors saw 86.5 patients over the 7.4 half-days they worked (on average 11.7 patients per half day).
GP private practices had a slightly lower number of FTE doctors (2.1), who worked slightly longer (7.8 half-days per week) and saw an average of 103.2 patients during those 7.8 half-days (on average 13.2 patients per half-day). CGNP practices employed 2.9 FTE doctors who worked an average of 6.6 half-days per week and saw on average 63.3 patients per week (9.6 patients per half-day).
Table 13.3 describes the distribution of visits to the GP, by age and gender. A higher proportion of males attending Māori providers were under 25 years of age compared to both CGNP and private practices. Conversely, males over 45 years of age accounted for a lower proportion of male visits in Māori providers compared with the other practice types. For females, the distribution across the age groups was similar for Māori and private practices. However, the proportion of females aged 25−44 years was lower and the proportion of females over age 45 years was higher in Māori providers compared with CGNP.
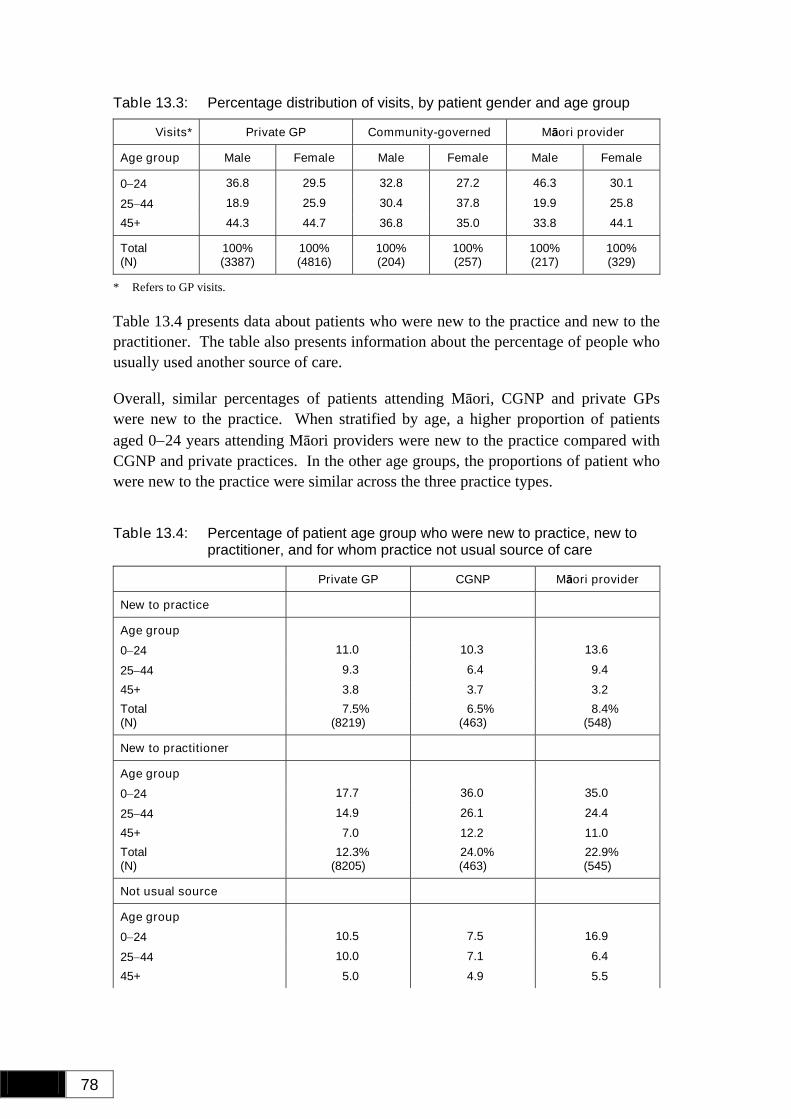
78
Table 13.3: Percentage distribution of visits, by patient gender and age group
Visits* Private GP Community-governed Māori provider
Age group Male Female Male Female Male Female
0−24 36.8 29.5 32.8 27.2 46.3 30.1
25−44 18.9 25.9 30.4 37.8 19.9 25.8 45+ 44.3 44.7 36.8 35.0 33.8 44.1
Total (N)
100% (3387)
100% (4816)
100% (204)
100% (257)
100% (217)
100% (329)
* Refers to GP visits.
Table 13.4 presents data about patients who were new to the practice and new to the practitioner. The table also presents information about the percentage of people who usually used another source of care.
Overall, similar percentages of patients attending Māori, CGNP and private GPs were new to the practice. When stratified by age, a higher proportion of patients aged 0−24 years attending Māori providers were new to the practice compared with CGNP and private practices. In the other age groups, the proportions of patient who were new to the practice were similar across the three practice types.
Table 13.4: Percentage of patient age group who were new to practice, new to practitioner, and for whom practice not usual source of care
Private GP CGNP Māori provider
New to practice
Age group
0−24 11.0 10.3 13.6
25−44 9.3 6.4 9.4 45+ 3.8 3.7 3.2 Total (N)
7.5% (8219)
6.5% (463)
8.4% (548)
New to practitioner
Age group
0−24 17.7 36.0 35.0
25−44 14.9 26.1 24.4 45+ 7.0 12.2 11.0 Total (N)
12.3% (8205)
24.0% (463)
22.9% (545)
Not usual source
Age group
0−24 10.5 7.5 16.9
25−44 10.0 7.1 6.4 45+ 5.0 4.9 5.5
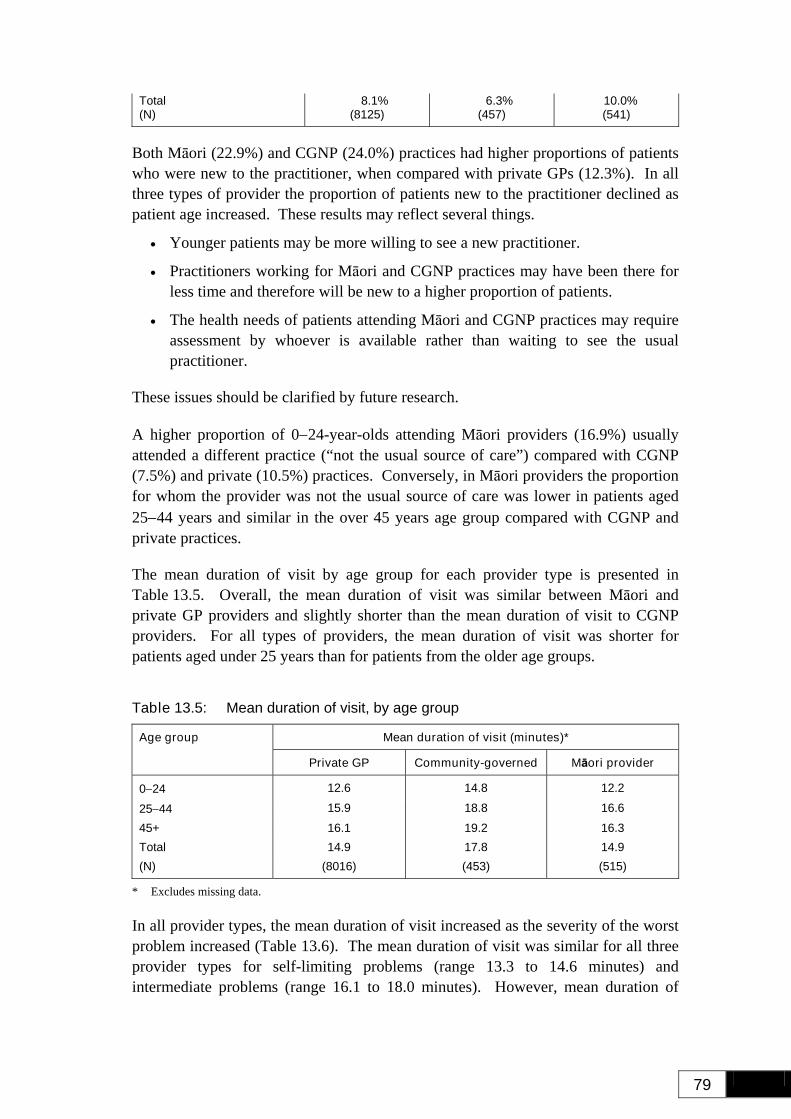
79
Total (N)
8.1% (8125)
6.3% (457)
10.0% (541)
Both Māori (22.9%) and CGNP (24.0%) practices had higher proportions of patients who were new to the practitioner, when compared with private GPs (12.3%). In all three types of provider the proportion of patients new to the practitioner declined as patient age increased. These results may reflect several things.
• Younger patients may be more willing to see a new practitioner.
• Practitioners working for Māori and CGNP practices may have been there for less time and therefore will be new to a higher proportion of patients.
• The health needs of patients attending Māori and CGNP practices may require assessment by whoever is available rather than waiting to see the usual practitioner.
These issues should be clarified by future research.
A higher proportion of 0−24-year-olds attending Māori providers (16.9%) usually attended a different practice (“not the usual source of care”) compared with CGNP (7.5%) and private (10.5%) practices. Conversely, in Māori providers the proportion for whom the provider was not the usual source of care was lower in patients aged 25−44 years and similar in the over 45 years age group compared with CGNP and private practices.
The mean duration of visit by age group for each provider type is presented in Table 13.5. Overall, the mean duration of visit was similar between Māori and private GP providers and slightly shorter than the mean duration of visit to CGNP providers. For all types of providers, the mean duration of visit was shorter for patients aged under 25 years than for patients from the older age groups.
Table 13.5: Mean duration of visit, by age group
Mean duration of visit (minutes)* Age group
Private GP Community-governed Māori provider
0−24 12.6 14.8 12.2
25−44 15.9 18.8 16.6 45+ 16.1 19.2 16.3 Total 14.9 17.8 14.9 (N) (8016) (453) (515)
* Excludes missing data.
In all provider types, the mean duration of visit increased as the severity of the worst problem increased (Table 13.6). The mean duration of visit was similar for all three provider types for self-limiting problems (range 13.3 to 14.6 minutes) and intermediate problems (range 16.1 to 18.0 minutes). However, mean duration of
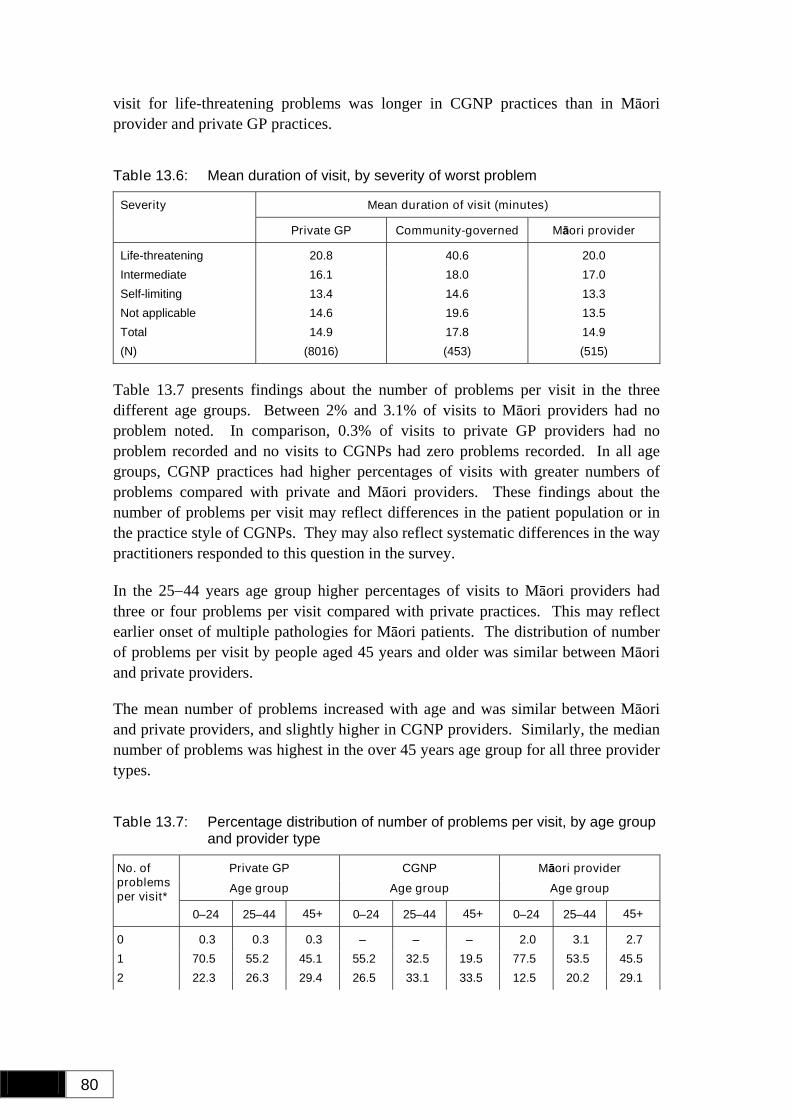
80
visit for life-threatening problems was longer in CGNP practices than in Māori provider and private GP practices.
Table 13.6: Mean duration of visit, by severity of worst problem
Mean duration of visit (minutes) Severity
Private GP Community-governed Māori provider
Life-threatening 20.8 40.6 20.0 Intermediate 16.1 18.0 17.0 Self-limiting 13.4 14.6 13.3 Not applicable 14.6 19.6 13.5 Total 14.9 17.8 14.9 (N) (8016) (453) (515)
Table 13.7 presents findings about the number of problems per visit in the three different age groups. Between 2% and 3.1% of visits to Māori providers had no problem noted. In comparison, 0.3% of visits to private GP providers had no problem recorded and no visits to CGNPs had zero problems recorded. In all age groups, CGNP practices had higher percentages of visits with greater numbers of problems compared with private and Māori providers. These findings about the number of problems per visit may reflect differences in the patient population or in the practice style of CGNPs. They may also reflect systematic differences in the way practitioners responded to this question in the survey.
In the 25−44 years age group higher percentages of visits to Māori providers had three or four problems per visit compared with private practices. This may reflect earlier onset of multiple pathologies for Māori patients. The distribution of number of problems per visit by people aged 45 years and older was similar between Māori and private providers.
The mean number of problems increased with age and was similar between Māori and private providers, and slightly higher in CGNP providers. Similarly, the median number of problems was highest in the over 45 years age group for all three provider types.
Table 13.7: Percentage distribution of number of problems per visit, by age group and provider type
Private GP CGNP Māori provider Age group Age group Age group
No. of problems per visit*
0−24 25−44 45+ 0−24 25−44 45+ 0−24 25−44 45+
0 0.3 0.3 0.3 – – – 2.0 3.1 2.7 1 70.5 55.2 45.1 55.2 32.5 19.5 77.5 53.5 45.5 2 22.3 26.3 29.4 26.5 33.1 33.5 12.5 20.2 29.1
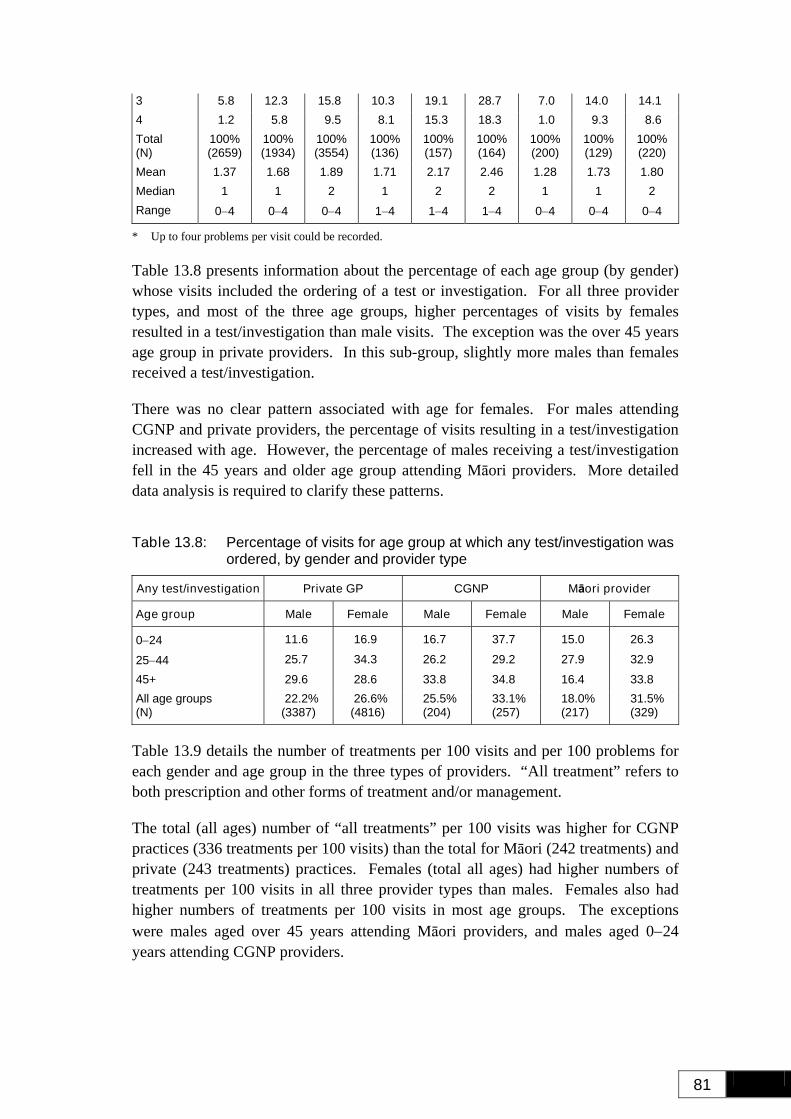
81
3 5.8 12.3 15.8 10.3 19.1 28.7 7.0 14.0 14.1 4 1.2 5.8 9.5 8.1 15.3 18.3 1.0 9.3 8.6 Total (N)
100%(2659)
100% (1934)
100%(3554)
100%(136)
100%(157)
100%(164)
100% (200)
100% (129)
100%(220)
Mean 1.37 1.68 1.89 1.71 2.17 2.46 1.28 1.73 1.80 Median 1 1 2 1 2 2 1 1 2 Range 0−4 0−4 0−4 1−4 1−4 1−4 0−4 0−4 0−4
* Up to four problems per visit could be recorded.
Table 13.8 presents information about the percentage of each age group (by gender) whose visits included the ordering of a test or investigation. For all three provider types, and most of the three age groups, higher percentages of visits by females resulted in a test/investigation than male visits. The exception was the over 45 years age group in private providers. In this sub-group, slightly more males than females received a test/investigation.
There was no clear pattern associated with age for females. For males attending CGNP and private providers, the percentage of visits resulting in a test/investigation increased with age. However, the percentage of males receiving a test/investigation fell in the 45 years and older age group attending Māori providers. More detailed data analysis is required to clarify these patterns.
Table 13.8: Percentage of visits for age group at which any test/investigation was ordered, by gender and provider type
Any test/investigation Private GP CGNP Māori provider
Age group Male Female Male Female Male Female
0−24 11.6 16.9 16.7 37.7 15.0 26.3
25−44 25.7 34.3 26.2 29.2 27.9 32.9 45+ 29.6 28.6 33.8 34.8 16.4 33.8 All age groups (N)
22.2% (3387)
26.6% (4816)
25.5% (204)
33.1% (257)
18.0% (217)
31.5% (329)
Table 13.9 details the number of treatments per 100 visits and per 100 problems for each gender and age group in the three types of providers. “All treatment” refers to both prescription and other forms of treatment and/or management.
The total (all ages) number of “all treatments” per 100 visits was higher for CGNP practices (336 treatments per 100 visits) than the total for Māori (242 treatments) and private (243 treatments) practices. Females (total all ages) had higher numbers of treatments per 100 visits in all three provider types than males. Females also had higher numbers of treatments per 100 visits in most age groups. The exceptions were males aged over 45 years attending Māori providers, and males aged 0−24 years attending CGNP providers.
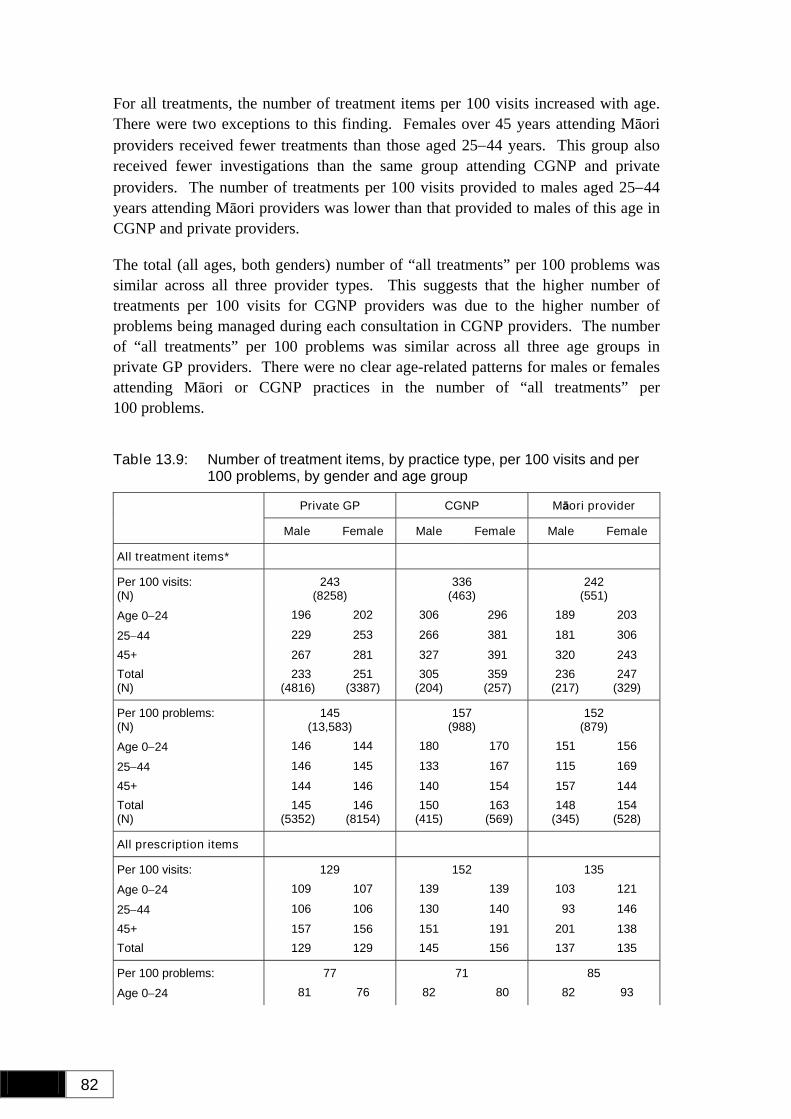
82
For all treatments, the number of treatment items per 100 visits increased with age. There were two exceptions to this finding. Females over 45 years attending Māori providers received fewer treatments than those aged 25−44 years. This group also received fewer investigations than the same group attending CGNP and private providers. The number of treatments per 100 visits provided to males aged 25−44 years attending Māori providers was lower than that provided to males of this age in CGNP and private providers.
The total (all ages, both genders) number of “all treatments” per 100 problems was similar across all three provider types. This suggests that the higher number of treatments per 100 visits for CGNP providers was due to the higher number of problems being managed during each consultation in CGNP providers. The number of “all treatments” per 100 problems was similar across all three age groups in private GP providers. There were no clear age-related patterns for males or females attending Māori or CGNP practices in the number of “all treatments” per 100 problems.
Table 13.9: Number of treatment items, by practice type, per 100 visits and per 100 problems, by gender and age group
Private GP CGNP Māori provider
Male Female Male Female Male Female
All treatment items*
Per 100 visits: (N)
243 (8258)
336 (463)
242 (551)
Age 0−24 196 202 306 296 189 203
25−44 229 253 266 381 181 306 45+ 267 281 327 391 320 243 Total (N)
233 (4816)
251 (3387)
305 (204)
359 (257)
236 (217)
247 (329)
Per 100 problems: (N)
145 (13,583)
157 (988)
152 (879)
Age 0−24 146 144 180 170 151 156
25−44 146 145 133 167 115 169 45+ 144 146 140 154 157 144 Total (N)
145 (5352)
146 (8154)
150 (415)
163 (569)
148 (345)
154 (528)
All prescription items
Per 100 visits: 129 152 135 Age 0−24 109 107 139 139 103 121
25−44 106 106 130 140 93 146 45+ 157 156 151 191 201 138 Total 129 129 145 156 137 135
Per 100 problems: 77 71 85 Age 0−24 81 76 82 80 82 93
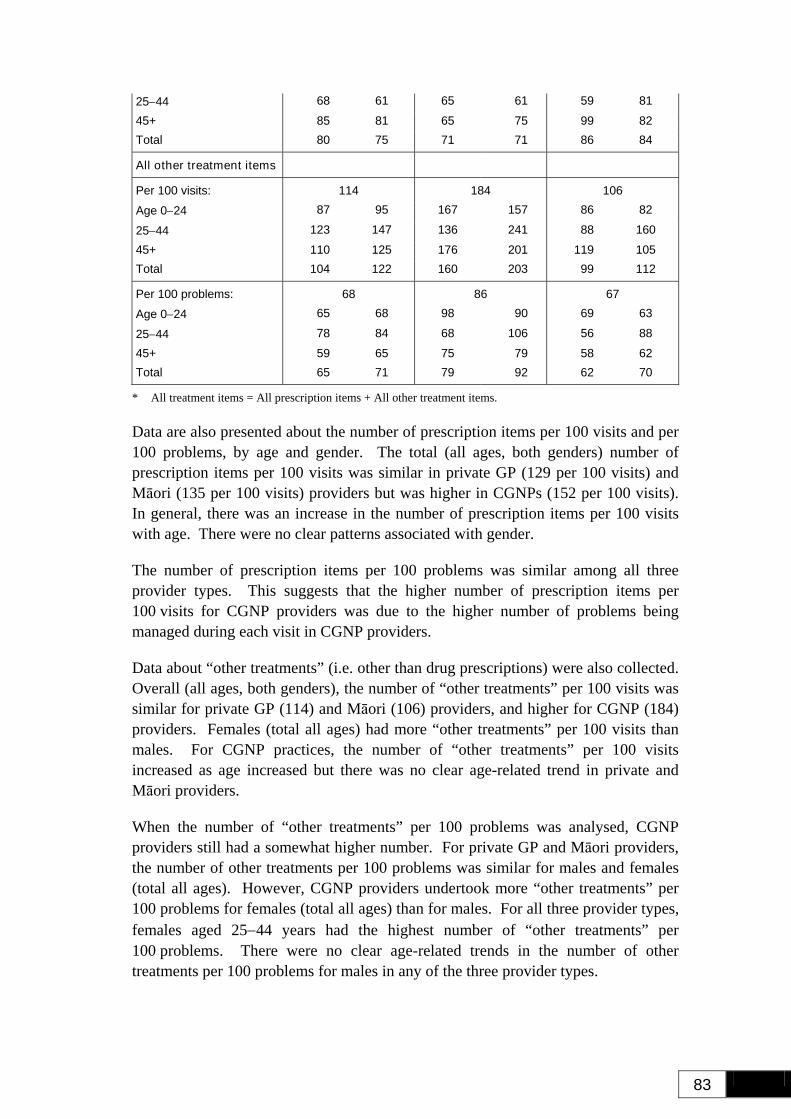
83
25−44 68 61 65 61 59 81 45+ 85 81 65 75 99 82 Total 80 75 71 71 86 84
All other treatment items
Per 100 visits: 114 184 106 Age 0−24 87 95 167 157 86 82
25−44 123 147 136 241 88 160 45+ 110 125 176 201 119 105 Total 104 122 160 203 99 112
Per 100 problems: 68 86 67 Age 0−24 65 68 98 90 69 63
25−44 78 84 68 106 56 88 45+ 59 65 75 79 58 62 Total 65 71 79 92 62 70
* All treatment items = All prescription items + All other treatment items.
Data are also presented about the number of prescription items per 100 visits and per 100 problems, by age and gender. The total (all ages, both genders) number of prescription items per 100 visits was similar in private GP (129 per 100 visits) and Māori (135 per 100 visits) providers but was higher in CGNPs (152 per 100 visits). In general, there was an increase in the number of prescription items per 100 visits with age. There were no clear patterns associated with gender.
The number of prescription items per 100 problems was similar among all three provider types. This suggests that the higher number of prescription items per 100 visits for CGNP providers was due to the higher number of problems being managed during each visit in CGNP providers.
Data about “other treatments” (i.e. other than drug prescriptions) were also collected. Overall (all ages, both genders), the number of “other treatments” per 100 visits was similar for private GP (114) and Māori (106) providers, and higher for CGNP (184) providers. Females (total all ages) had more “other treatments” per 100 visits than males. For CGNP practices, the number of “other treatments” per 100 visits increased as age increased but there was no clear age-related trend in private and Māori providers.
When the number of “other treatments” per 100 problems was analysed, CGNP providers still had a somewhat higher number. For private GP and Māori providers, the number of other treatments per 100 problems was similar for males and females (total all ages). However, CGNP providers undertook more “other treatments” per 100 problems for females (total all ages) than for males. For all three provider types, females aged 25−44 years had the highest number of “other treatments” per 100 problems. There were no clear age-related trends in the number of other treatments per 100 problems for males in any of the three provider types.
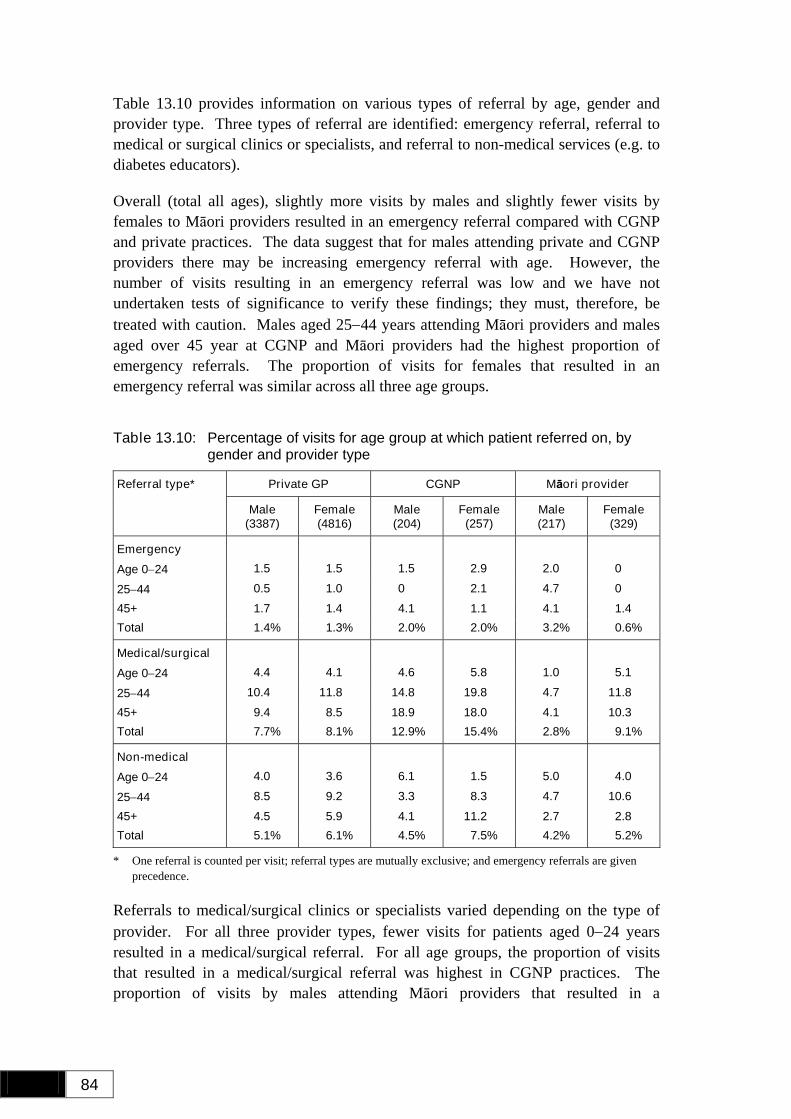
84
Table 13.10 provides information on various types of referral by age, gender and provider type. Three types of referral are identified: emergency referral, referral to medical or surgical clinics or specialists, and referral to non-medical services (e.g. to diabetes educators).
Overall (total all ages), slightly more visits by males and slightly fewer visits by females to Māori providers resulted in an emergency referral compared with CGNP and private practices. The data suggest that for males attending private and CGNP providers there may be increasing emergency referral with age. However, the number of visits resulting in an emergency referral was low and we have not undertaken tests of significance to verify these findings; they must, therefore, be treated with caution. Males aged 25−44 years attending Māori providers and males aged over 45 year at CGNP and Māori providers had the highest proportion of emergency referrals. The proportion of visits for females that resulted in an emergency referral was similar across all three age groups.
Table 13.10: Percentage of visits for age group at which patient referred on, by gender and provider type
Private GP CGNP Māori provider Referral type*
Male (3387)
Female (4816)
Male (204)
Female (257)
Male (217)
Female (329)
Emergency
Age 0−24 1.5 1.5 1.5 2.9 2.0 0
25−44 0.5 1.0 0 2.1 4.7 0 45+ 1.7 1.4 4.1 1.1 4.1 1.4 Total 1.4% 1.3% 2.0% 2.0% 3.2% 0.6%
Medical/surgical
Age 0−24 4.4 4.1 4.6 5.8 1.0 5.1
25−44 10.4 11.8 14.8 19.8 4.7 11.8 45+ 9.4 8.5 18.9 18.0 4.1 10.3 Total 7.7% 8.1% 12.9% 15.4% 2.8% 9.1%
Non-medical
Age 0−24 4.0 3.6 6.1 1.5 5.0 4.0
25−44 8.5 9.2 3.3 8.3 4.7 10.6 45+ 4.5 5.9 4.1 11.2 2.7 2.8 Total 5.1% 6.1% 4.5% 7.5% 4.2% 5.2%
* One referral is counted per visit; referral types are mutually exclusive; and emergency referrals are given precedence.
Referrals to medical/surgical clinics or specialists varied depending on the type of provider. For all three provider types, fewer visits for patients aged 0−24 years resulted in a medical/surgical referral. For all age groups, the proportion of visits that resulted in a medical/surgical referral was highest in CGNP practices. The proportion of visits by males attending Māori providers that resulted in a
85
medical/surgical referral was lower than that of males attending other providers. This, in combination with the higher emergency referral rate seen in males attending Māori providers, suggests males attending Māori providers may be presenting with more severe and urgent problems. Further research is required to clarify these issues. The proportion of visits that resulted in a medical/surgical referral was similar for females attending CGNP and private practices.
The proportion of visits that resulted in a non-medical referral was similar for males and females in all three provider types, with the exception of females attending CGNP providers (who had a slightly higher rate of referral). There were no clear age-related trends in non-medical referrals, with the possible exception of females attending CGNP providers (where there was an increase in the rate of referral with age). Non-medical referral for both males and females aged over 45 years appeared lower for Māori providers. This result needs to be interpreted with caution as numbers are low and no statistical tests have been undertaken.
We also analysed data on the investigation and management of a specific health condition. In order to undertake this analysis it was necessary to use those visits associated with a single problem at presentation. The only problem that had sufficient numbers of visits (where the problem was the only one recorded) to allow reliable analysis was acute respiratory infection (ARI). Visits for ARI included new problems (first visits for this problem) and all visits (first and subsequent visits for this problem). Data on the management of ARI are presented in Table 13.11.
Tests/investigations were ordered for 19.6% of ARI problems in Māori providers, 13.0% of ARI problems in CGNP providers, and 7.8% of ARI problems in private GP providers. A drug was prescribed for 80.4% of ARI problems of Māori, 73.9% of CGNP and 82.5% of private providers. Anti-bacterial agents were most commonly prescribed in private (49.5% of ARI problems) and Māori (39.1% of ARI problems) providers, while analgesic drugs were more commonly prescribed in CGNP providers (60.9% analgesic versus 21.7% anti-bacterial).
For visits where ARI was a new problem, a higher percentage of these problems were managed by requesting a test or investigation in Māori (17.2%) and CGNP (15.0%) providers than in private GP (6.3%) providers. Three-quarters of new ARI problems in Māori and CGNP providers, and over 80% of private GP providers, were prescribed drugs. Analgesics were the most common drug prescribed in Māori and CGNP providers. However, anti-bacterial drugs were the most commonly prescribed drugs by private GPs. Referral was also more common in Māori and CGNP practices than in private GP practices.
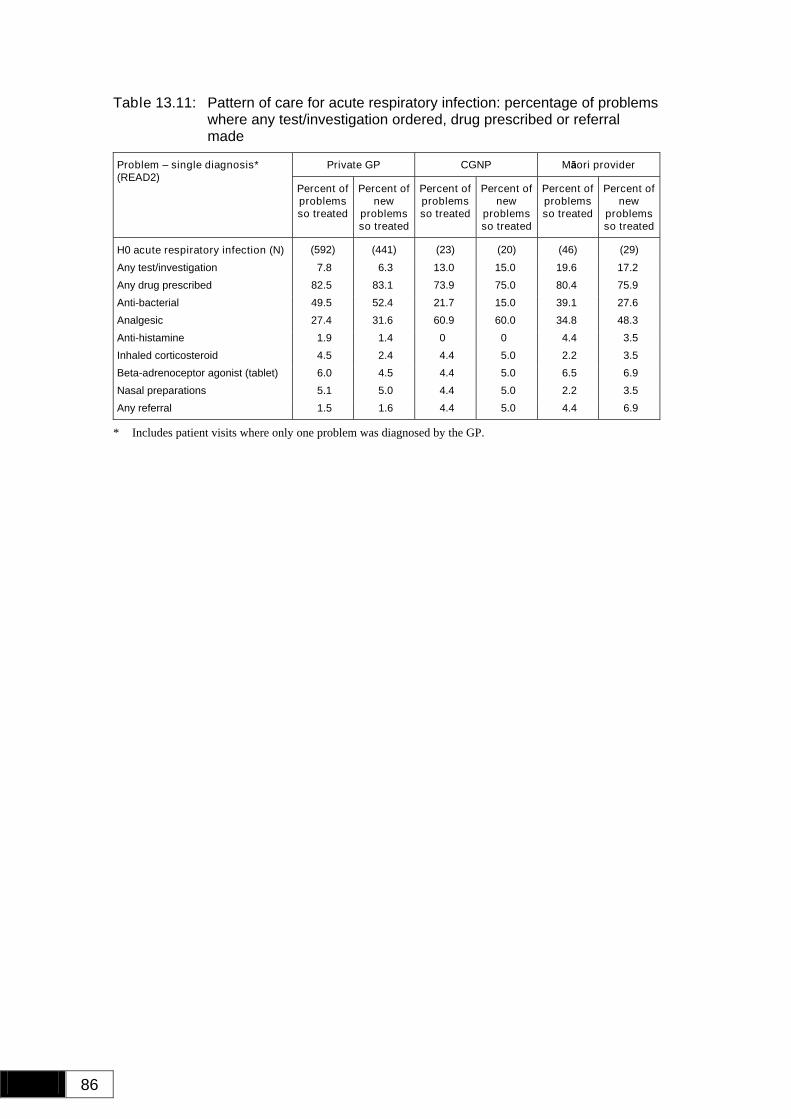
86
Table 13.11: Pattern of care for acute respiratory infection: percentage of problems where any test/investigation ordered, drug prescribed or referral made
Private GP CGNP Māori provider Problem – single diagnosis* (READ2)
Percent of problems so treated
Percent of new
problems so treated
Percent of problems so treated
Percent of new
problems so treated
Percent of problems so treated
Percent of new
problems so treated
H0 acute respiratory infection (N) (592) (441) (23) (20) (46) (29) Any test/investigation 7.8 6.3 13.0 15.0 19.6 17.2 Any drug prescribed 82.5 83.1 73.9 75.0 80.4 75.9 Anti-bacterial 49.5 52.4 21.7 15.0 39.1 27.6 Analgesic 27.4 31.6 60.9 60.0 34.8 48.3 Anti-histamine 1.9 1.4 0 0 4.4 3.5 Inhaled corticosteroid 4.5 2.4 4.4 5.0 2.2 3.5 Beta-adrenoceptor agonist (tablet) 6.0 4.5 4.4 5.0 6.5 6.9 Nasal preparations 5.1 5.0 4.4 5.0 2.2 3.5 Any referral 1.5 1.6 4.4 5.0 4.4 6.9
* Includes patient visits where only one problem was diagnosed by the GP.
87
14. Discussion and Conclusions
This survey aimed to provide information about primary health care and the activities of doctors and nurses working in primary health care across the country in 2001/02. This is the first national survey to collect this type of data about practices that are operated by Māori health providers. To our knowledge previous quantitative data about Māori providers are limited to a Master of General Practice thesis written by Dr Tony Ruakere.27
Tests of statistical significance have not been undertaken, so the results of analyses where comparisons have been undertaken must be interpreted with caution.
14.1 Summary of results
Organisational characteristics. The legal basis of Māori and CGNP practices was markedly different from that of private GPs. The majority of the Māori providers were trusts or incorporated societies and a similar pattern is noted in CGNP practices. In comparison, the majority of private practices were sole trader, partnership or limited liability companies. Consistent with these findings, there were notable differences in management structures and community involvement in governance. All Māori provider practices had separate or external management and the majority had community representation in governance/management. This finding was similar to that for the CGNP practices, but markedly different from private GPs. A higher percentage of Māori provider practices had undertaken formal community needs assessments, and used locality service planning and inter-sectoral case management. When compared with private GP providers, a higher percentage of Māori providers had written policies on complaints and quality management and operated computerised patient records.
Not surprisingly, the percentage of Māori patients was substantially higher in Māori providers than in the other two practice types, though non-Māori patients also used Māori provider services. Interestingly, the percentage of patients attending private GPs was slightly lower than the proportion of the population who identified as Māori in the 2001 Census.
Except for the under six years age group, there were large differences in the fee structures between Māori and private GP providers, with the fees being much lower in Māori practices.
88
Māori provider practices had fewer full-time equivalent (FTE) medical and nursing staff than CGNP practices, and community health workers were a significant component of Māori provider practice staff. Māori providers were open slightly fewer hours during the working week and a smaller percentage were open for weekend and evening surgeries. This may be related to funding levels or to staffing levels, with lower numbers of medical and nursing staff making evening and weekend clinics difficult.
Compared with private GPs, higher proportions of Māori provider practices provided maternity care, group health promotion, and complementary/alternative care. However, fewer Māori provider practices offered independent practice nurse services. Further work will be required to clarify the reasons for this finding, although it may be related to the lower nursing FTE level, which in turn may result in nurses being required to undertake work that complements and supports the doctor’s role rather than undertaking independent functions.
Doctors working in Māori provider practices tended to be young, relatively new to both general practice and to the Māori provider practice, and female, and a higher percentage had qualified outside New Zealand. Māori provider practices were “youthful”, with the majority having been established within the last decade. This youthfulness may partially explain the shorter mean length of time the doctors had worked in the Māori provider practices. It is not known whether turn-over of doctors in Māori providers contributes to these findings and it is not possible to answer that question from this survey. High proportions of doctors in Māori provider practices had completed, or were completing, FRNZCGP qualifications.
The mean number of half-days worked was lower than that of private practices. The average number of patients seen was slightly higher than that of CGNP and slightly lower than that of private GP practices. Until statistical testing is undertaken it is not known if these findings are significant. If the findings are significant, a number of factors may be important in explaining the differences. For example, female GPs often work part-time and most of the GPs in Māori providers are women. Māori providers may run satellite clinics staffed by their GPs. These clinics may only have GPs on site for a limited number of hours per week and the time required to travel to and from the base to the satellite clinic further reduces the number of hours the doctor is available. Finally, the characteristics of patients attending Māori provider practices may be different and result in different consultation characteristics than those seen in other practices. Preliminary data analysis comparing Māori providers and private GPs suggest mean consultation times for each age group are similar, as are mean consultation times for severity of worst problem, and the distribution of the number of problems by age groups. However, further analyses that adjust simultaneously for the number and severity of problems, as well as the case mix of problems, are required to fully understand data on consultation characteristics such as duration.
89
The mean patients seen per half-day session by Māori provider nurses was lower than that of private practice nurses (15.0) and higher than that of CGNP nurses (6.5). Care must be taken when interpreting these findings, as the case mix (socio-economic and health characteristics of the patient population) and the types of functions the nurses perform must be taken into account. This analysis has yet to be undertaken.
Patient information. Children under the age of five years accounted for a significant proportion of the patient population (14.7%), while people over the age of 75 years accounted for a smaller proportion (5.5%). Between these ages each 10-year age band accounted for similar percentages (between 9.6 and 12.7%) of the patient population. Māori made up a significant proportion of the patient population.
High deprivation is associated with worse health status and higher health need. Over 77% of the patients seen in this survey lived in households from high deprivation (deciles 8, 9 and 10) areas. Nationally about 56% of Māori and 21% of New Zealand Europeans live in the three most deprived deciles. 28 These data suggest that Māori providers are located in high deprivation areas and/or the Māori providers are delivering accessible and acceptable services to people from high deprivation areas. Practice nurses saw a higher proportion of patients from high deprivation areas compared with doctors (58.4%). Only 5.7% of nurse consultations involved patients residing in decile 1−7 areas. This suggests that Māori providers provide significant access to practice nurses for patients from high deprivation areas.
Two-thirds of consultations (67.6%) involved patients with Community Services Cards (CSCs). Possession of High User Cards (HUCs) was uncommon. Only three-quarters of patients residing in medium and high deprivation deciles had CSCs or HUCs. This finding is interesting for three reasons. Firstly, it is believed that Māori within each deprivation decile have lower average incomes than non-Māori within the same decile (personal communication, B Robson, 8/9/03). This would suggest that more Māori might be eligible for a CSC. Secondly, it is known that not all people who are eligible to hold a CSC have obtained one. Finally, work undertaken by Howell and Hackwell estimates that 7.41% of Pākehā children but only 3.23% of Māori children who live in beneficiary families receive a Disability Allowance.29 It is possible that similar disparities in respect to obtaining and holding CSCs also exist. The majority of patients were assessed (by the practitioner) as having good social support.
Over 90% of patients regarded the Māori provider practices as the usual source of care. About a quarter of patients were new to the provider and 7.4% were new to the practice. Slightly less than half (45.9%) of the patients (adults and children) were high users of GP services (attended the GP on six or more occasions in the previous 12 months). Female patients had slightly more visits in the preceding year, and a higher percentage of female patients were high users when compared with male patients. While some of this difference may be due to women attending more for
90
reproductive health issues, it may also reflect a relative under-use by or depleted numbers of, particularly middle-aged, men. In total, 11.8% of consultations lasted longer than 20 minutes (8.9% doctors and 21.9% nurses).
Reasons-for-visits and problems managed. The number of reasons-for-visit was similar for males (1.35 per visit) and females (1.39 per visit). The four most common reasons noted were action, respiratory reasons, investigations and non-specific symptoms.
The number of problems managed during each visit was similar for males and females, and increased with age. Women had a higher number of problems per 100 visits in the under 45 years age groups. This is most likely related to problems associated with reproductive issues. It may also reflect a relative under-utilisation of primary health care by males during their younger years. bout one-third of problems managed during consultations were newly identified. Doctors saw a higher percentage of new problems than nurses. Conversely, nurses saw a higher percentage of long-term, follow-up, and preventive care than doctors. These findings are consistent with the different scopes of practice of nurses and doctors. The four commonest problems managed were respiratory problems, actions, skin / subcutaneous tissue, and cardiovascular/circulatory problems.
Investigation, treatment and referral. Overall 27.1% of consultations included a test or investigation of some sort, 16% included a laboratory test, and imaging (such as X-rays and ultrasounds) was requested in 4% of consultations. Males had lower rates of investigation than females across all age groups.
Most visits resulted in some form of treatment. One-quarter (25%) of visits resulted in treatment with prescriptions only, 24.1% in non-drug treatment only, 36.6% in both prescriptions and non-drug treatment, and only 14.3% were not associated with any form of treatment or intervention.
Arrangements to see the patient again within three months were made in most visits (62.3%). Slightly more nurse visits (69.5%) resulted in follow-up arrangements than doctor visits (60.3%). Overall, 17.9% of visits resulted in a referral of some type. A higher percentage of nurse visits (compared with doctors) resulted in non-medical referrals, while a higher percentage of doctor visits resulted in a medical/surgical referral. Overall, 1.7% of visits resulted in an emergency referral, with the percentage of visits resulting in emergency referral being similar for nurses and doctors.
91
Comparisons across provider types. Some analyses comparing Māori providers with CGNP and private GP providers were undertaken. Care must be taken when interpreting the results of these analyses for two reasons. Firstly, the sampling framework used to enrol participants did not allow for a specific Māori sample and some Māori providers may have been missed. The sample cannot, therefore, be considered to be nationally representative of Māori providers. Secondly, tests of statistical significance have not been undertaken and any apparent differences have not been subjected to statistical scrutiny.
There were some differences in operational characteristics such as hours open per week and provision of after-hours and weekend clinics; this may possibly be due to low numbers of doctors and nurses working for Māori providers. There were also some differences in governance and management characteristics, such as the number of providers with community representation on governance boards. The Māori providers who participated in the study had fewer medical and nursing staff but greater FTE numbers of community health workers. There were also some significant differences between staff in Māori and other providers. In particular, there was a higher proportion of female medical staff, and medical staff working for Māori providers had fewer years experience both in general practice and at the specific provider they were working for.
Māori providers had greater proportions of Māori patients than other providers, and the age distribution of patients attending Māori providers differed from that of CGNP and private GP providers. Māori providers also had a higher proportion of younger patients. Similar percentages of patients in Māori, CGNP and private GP practices were new to the practice, although a higher percentage of patients in Māori providers were new to the practitioner compared with private GPs. Similar percentages of patients did not regard the Māori provider as the usual source of care compared with the other two types of provider, except for the 0−24 years age group (which had a higher percentage of “not the usual source of care” in Māori providers). Mean durations of visit were similar for Māori and private GP providers, both overall and stratifying for severity of the worst problem. A higher proportion of visits by the 25−44 years age group attending Māori providers involved three or four different problems compared with private GPs. This may reflect earlier onset of multiple pathologies in patients attending Māori providers.
In general, females were more likely to receive a test or investigation than males in all three providers. For males, the percentage of visits associated with ordering a test/investigation increased with age for CGNP and private GP providers, but decreased in the over 45 years age group attending Māori providers.
92
Data on treatments provided are presented for each of the three provider types by age and gender, per 100 visits and per 100 problems. In general, results show that patients attending CGNPs received greater numbers of all treatments, prescriptions, and other treatments per 100 visits compared with Māori and private GP providers. However, this difference is probably due to the higher number of problems seen in CGNP patient visits, as the difference disappears for most age and gender groups when data per 100 problems are examined.
The total (all ages) number of treatment items per 100 problems was similar between Māori and private GP providers for “all treatment items” and “other treatment items”. However, the number of prescription items per 100 problems was slightly higher for Māori providers.
Some differences in referral rates were also noted. In particular a higher percentage of visits by males attending Māori providers resulted in emergency referrals (compared with the other two provider types). Conversely, fewer visits by males attending Māori providers resulted in a medical/surgical referral. The percentage of visits that resulted in non-medical referrals was similar across all three provider types.
Finally, while the comparisons provide some very interesting data, it is difficult to draw conclusions about standards of care. For example, it is impossible to determine whether high rates of investigation or treatment provision are appropriate or are over-servicing. Similarly, it is not possible to state whether low rates of investigation or treatment provision are appropriate or reflect poor care.
14.2 Practice nurses
We also set out to capture data about the role of nurses working in Healthcare Aotearoa-affiliated practices who saw patients independently using their own booking system. Initially we referred to these nurses as “independent nurse practitioners”. We have since changed this term to “practice nurse” because the definition of independent nurse practitioner we used is different from the definition of an independent nurse practitioner used by the nursing association. Readers should also be aware that the data presented in this report are representative of work done by nurses who work in the manner described above within Healthcare Aotearoa-affiliated practices. It is not representative of work done by practice nurses working with private GPs.
14.3 Policy implications
Discussion of possible policy implications arising from these data is limited to some general comments, as the sample of Māori providers is not nationally representative
93
of all Māori providers. That is, the data presented can only be said to represent the participating Māori providers and not Māori providers in general. Therefore caution should be taken before attempting to formulate policy from these data.
Generally speaking, the data provided here lend support to the policy of Māori provider development. The participating providers’ patient register contained higher proportions of Māori than CGNP and private GPs’ registers. In addition, the proportion of patients attending Māori providers who live in high deprivation areas (as defined by the New Zealand Index of Deprivation) is high. These findings suggest that Māori providers are increasing access to care for these populations. The findings of this survey provide evidence that the services and care given by the Mäori provider organisations that participated in the survey are of a similar standard to those delivered by other types of providers. In some areas, particularly organisational/governance/management, ethnicity profile of staff, utilisation of community health workers, and the patient register profile, Mäori providers are out-performing other providers with respect to alignment with government policy, addressing barriers to accessing care and fostering an environment that is conducive to achieving Mäori health gain.
Māori providers had a higher percentage of doctors who were Māori themselves working in their services. However, the percentage of Māori doctors working for Māori providers was still less than the percentage of Māori in the total population. These findings highlight the extreme under-representation of Māori in the medical workforce and lend support to on-going policies that support Māori health workforce development.
Finally, the findings relating to organisational and governance issues (for example, community representation, inclusion of community health workers as core components of staff, community needs assessments) and the patient profile (high Mäori population, high deprivation population) are consistent with the Primary Health Care Strategy.
14.4 Strengths and limitations
Errors of interpretation may be introduced if specific sub-sample analyses are carried out and reported when the initial sampling strategy did not include a specific, representative sample of that sub-group (target sampling). This is the case with the Māori provider sub-group. Although the total NatMedCa sample is nationally representative, the Māori provider sample is not representative of all Māori providers because those who participated were part of the nationally representative sample of all providers rather than a specific sample that was representative of Māori providers. It is possible that, because of these sampling issues, systematic bias may have been introduced. However, it is not possible to predict the size or direction of any introduced bias.
94
14.5 Conclusions
This paper reports data from Māori providers participating in NatMedCa and is the first time quantitative data about a sample of Māori providers have been published. While this is an important step, the limitations of the study, particularly concerning representativeness, need to be considered. Nevertheless, it provides useful insights into the work of Māori providers. In many areas Māori providers are performing very much on a par with private GPs, and in some areas are doing better.
95
References 1. Durie M. Whaiora Māori Health Development. Auckland: Oxford University
Press, 1998.
2. Department of Health. Hui Whakaoranga Māori Health Planning Workshop, Hoani Waititi Marae 19�22 March 1984. Wellington: Department of Health, 1984.
3. Te Puni Kōkiri. Te Ara Ahu Whakamua: Proceedings of the Māori Health Decade Hui. Rotorua: Te Puni Kōkiri, 1994.
4. Crengle S. The development of Māori primary health care services. Pacific Health Dialog 2000; 7(1): 48�53.
5. Crengle S. Māori Primary health care Services: A paper prepared for the National Health Committee. Wellington: National Health Committee, 1999.
6. Penney L. Hauora Ngati Hine: An analysis of the processes involved in the development and implementation of a hapū based primary health care service. Community Health. Auckland: University of Auckland, 1996.
7. Crengle S. Mā Papatuanuku, ka Tipu ngā Rākau: A case study of the well child health programme provided by Te Whānau o Waipareira Trust. Community Health. Auckland: University of Auckland, 1997.
8. Gribben B. Do access factors affect utilisation of general practitioner services in south Auckland? New Zealand Medical Journal 1992; 105(945): 453�5.
9. Pōmare E, Keefe-Ormsby V. Hauora III: Māori Standards of Health. Wellington: Te Ropū Rangahau Hauora A Eru Pōmare, Wellington School of Medicine, 1995.
10. Davis PB. Office encounters in general practice in the Hamilton health district. II: Ethnic group patterns among employed males, 15-64. New Zealand Medical Journal 1986; 99(800): 265�8.
11. Davis PB. Office encounters in general practice in the Hamilton health district. IV: Ethnic group patterns among females, 15�64. New Zealand Medical Journal 1987a; 100(819): 127�30.
12. Davis PB. Office encounters in general practice in the Hamilton health district. V: Social class and ethnic group patterns among children, 0�14. New Zealand Medical Journal 1987b; 100(833): 615�17.
13. Malcolm L. Inequities in access to and utilisation of primary medical care services for Māori and low income New Zealanders. [Comment]. New Zealand Medical Journal 1996; 109(1030): 356�8.
14. Davis P, Lay-Yee R, Sinclair O, Gribben G. Māori/non-Mäori patterns of contact, expressed morbidity and resource use in general practice: Data from the Waikato Medical Care Survey 1991-2. New Zealand Medical Journal 1997; 100: 390�2.
15. Ministry of Health. Taking the Pulse: The 1996/97 New Zealand Health Survey. Wellington: Ministry of Health, 1999.
96
16. Raymont A, Lay-Yee R, Davis P. The National Primary Medical Care Survey (NatMedCa): 2001/02. Report 1: Family Doctors: Methodology and description of the activity of private GPs. Wellington: Ministry of Health, Occasional Paper, 2004.
17. Scott IK, Gilmore LL, Madarasz J. CoMedCa Progress Report. Auckland: University of Auckland, 1980.
18. RNZCGP. A Summary of Management Provided by North Canterbury GPs. Christchurch: Research Committee, Canterbury Faculty, RNZCGP, 1984.
19. McAvoy B, Davis P, Raymont A, Gribben B. The Waikato Medical Care (WaiMedCa) Survey 1991-1992. New Zealand Medical Journal 1994; 107(986 Pt 2): 388�433.
20. Salmond C, Crampton P, Sutton F. NZDep96 Index of Deprivation. Research Report No. 8. Wellington: Health Services Research Centre, 1998.
21. Crampton P, Dowell A, Bowers S. Third sector primary health care in New Zealand. New Zealand Medical Journal 2000; 113: 92�6.
22. Crampton P, Lay-Yee R, Davis P. The National Primary Medical Care Survey (NatMedCa): 2001/02. Report 2: Primary health care in Community-governed Non-profits: The work of doctors and nurses. Wellington: Ministry of Health, Occasional Paper, 2004.
23. Fleming DM. The measurement of morbidity in general practice. Journal of Epidemiology and Community Health 1991; 45(3): 180�3.
24. Statistics New Zealand. Population Summary for the Māori Ethnic Group Census Usually Resident Population Counts, 1991, 1996, 2001 and Selected Summary Characteristics for the Census Usually Resident Population Count, 1991, 1996, 2001. 2002c. http://www.stats.govt.nz/
25. Statistics New Zealand. 2001 Census: Population and Dwelling Statistics (2001): Reference Reports. 2002a. http://www.statisticsnz.govt.nz/
26. Statistics New Zealand. 2001 Census Snapshot 6 (Pacific Peoples) Media Release. 2002b. http://www.statisticsnz.govt.nz/
27. Ruakere T. A comparative study of Māori use of an iwi general practice and a mainstream general practice. Proceedings of Te Oru Rangahau. Palmerston North: Te Pūtahi-ā-Toi, School of Māori Studies, 1998.
28. Crampton P, Salmond C, Kirkpatrick R, Scarborough R, and Skelly C (eds). Degrees of Deprivation in New Zealand: An atlas of socioeconomic difference. Auckland, David Bateman Ltd, 2000 125p [ISBN 1-86953-460-3].
29. Howell G, Hackwell K. Why don�t Māori and Pacific children get the Disability Allowance. Presented at: Public Health Association Conference, Ngaruawahia, 2003.
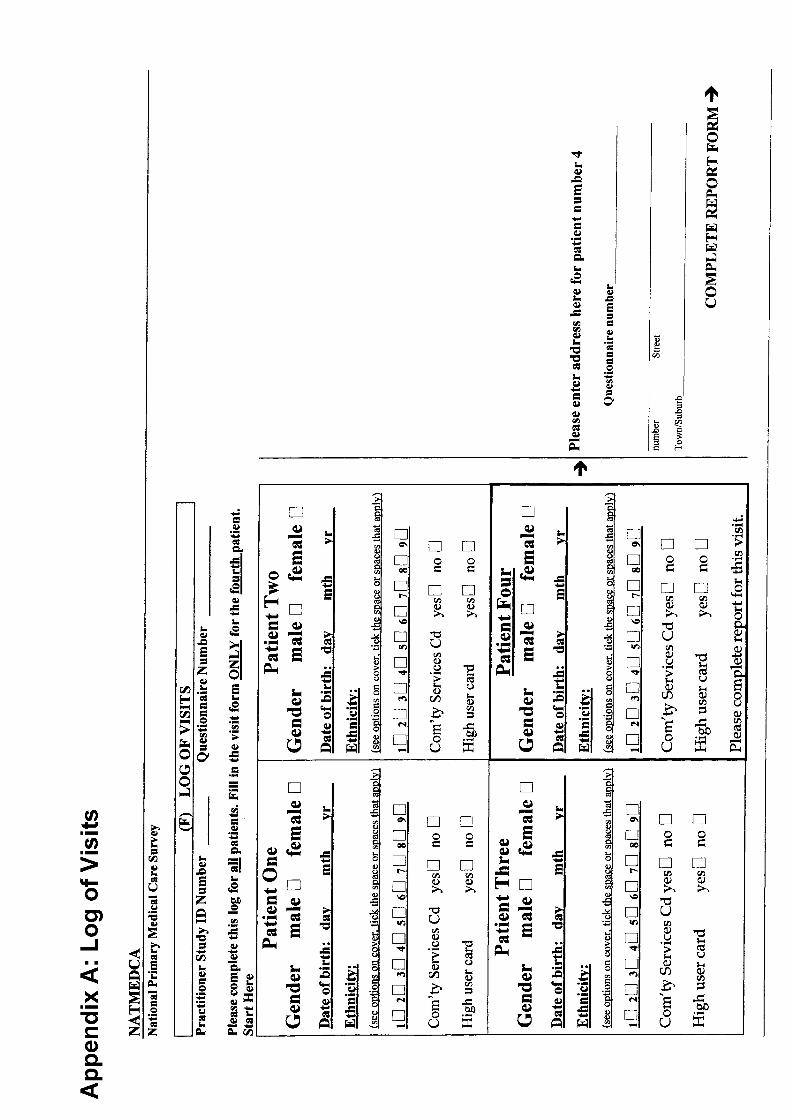
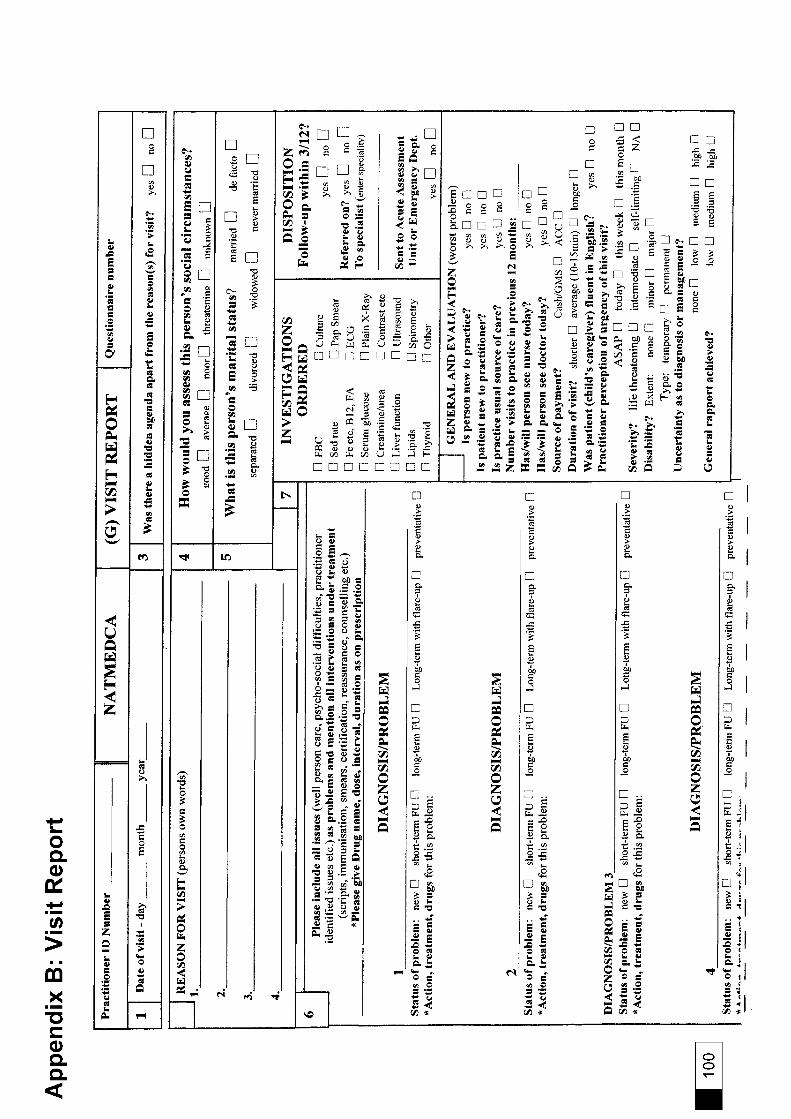
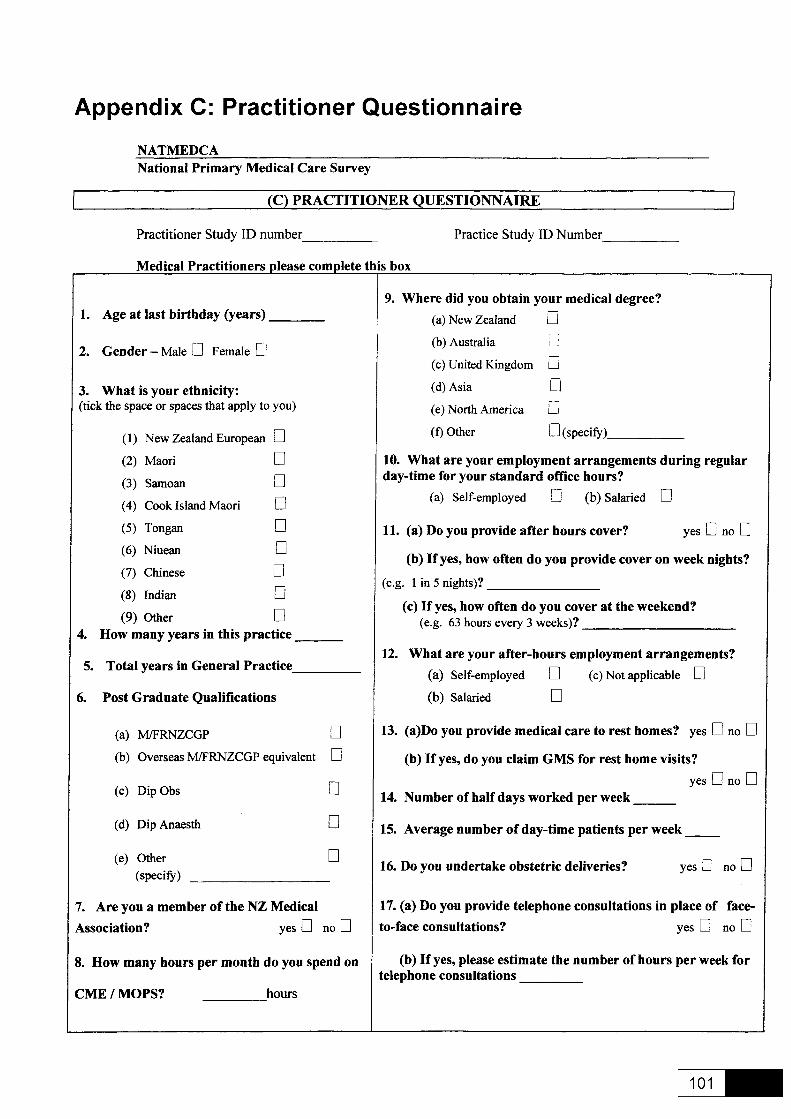
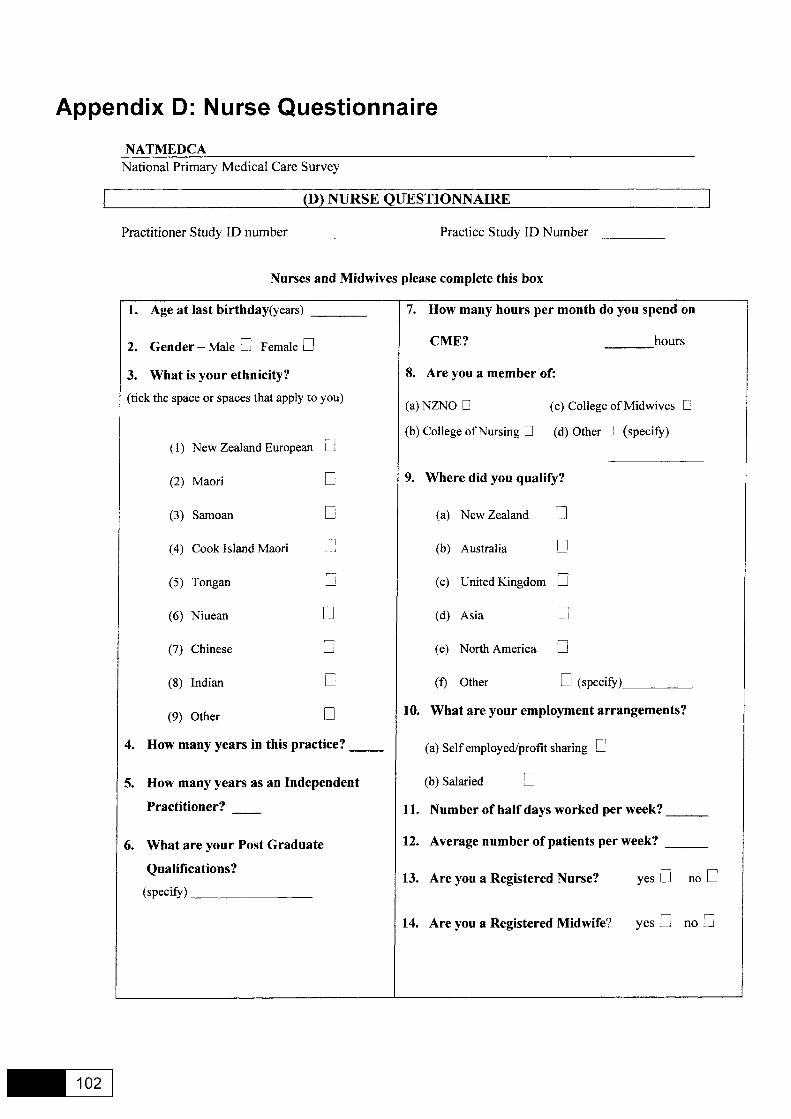
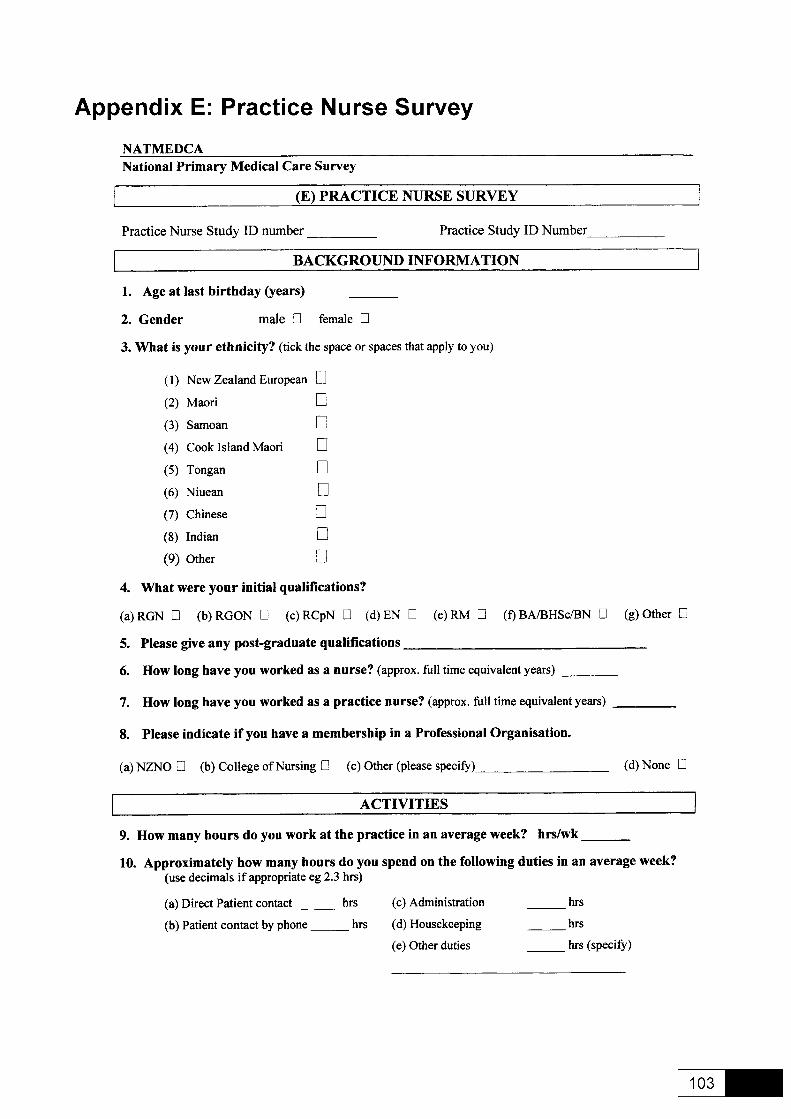
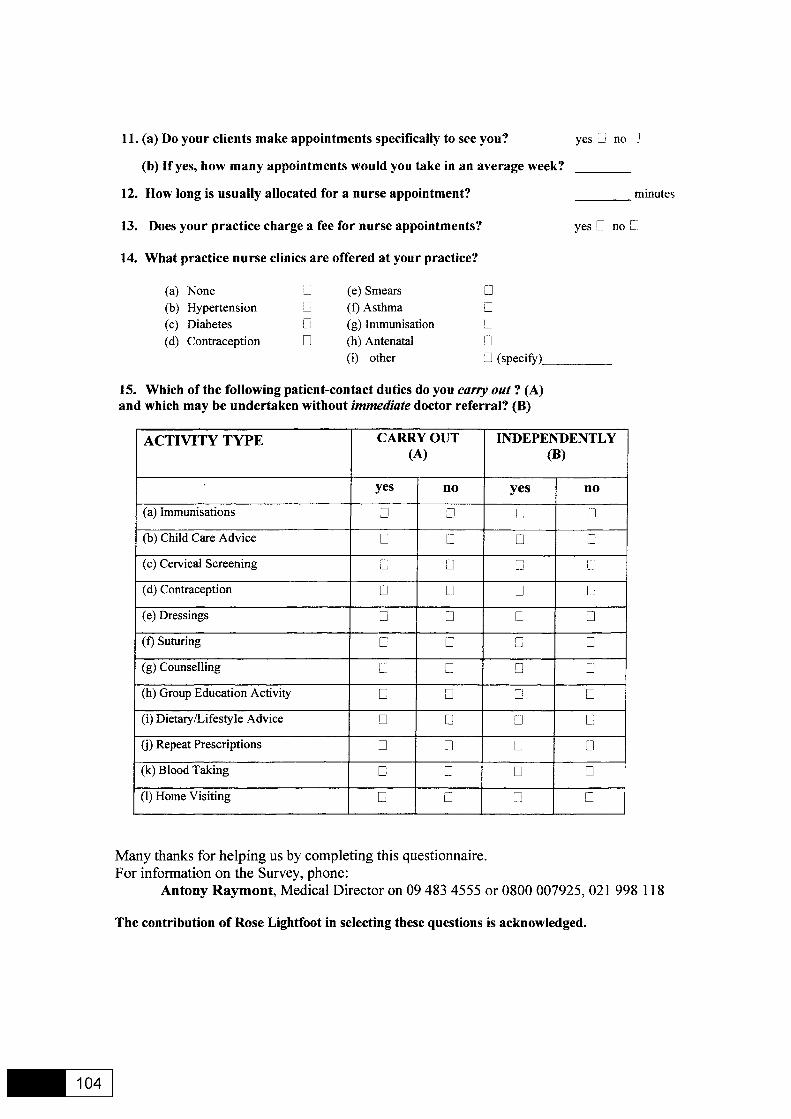

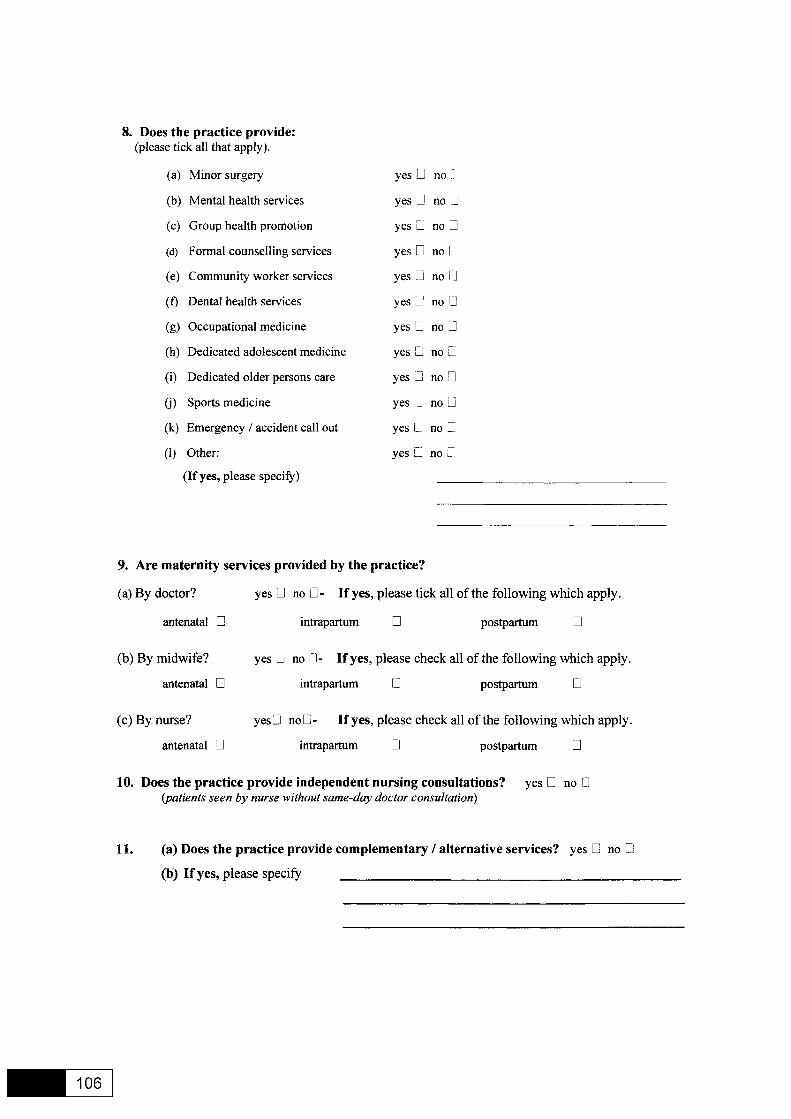
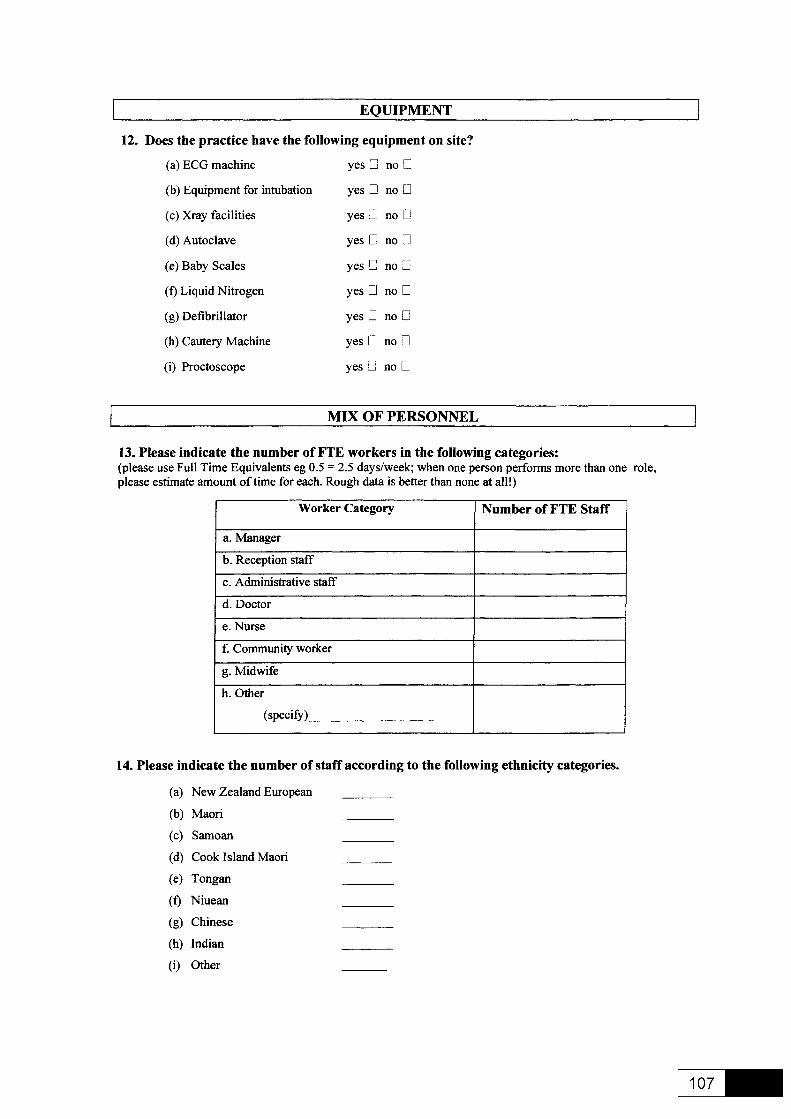
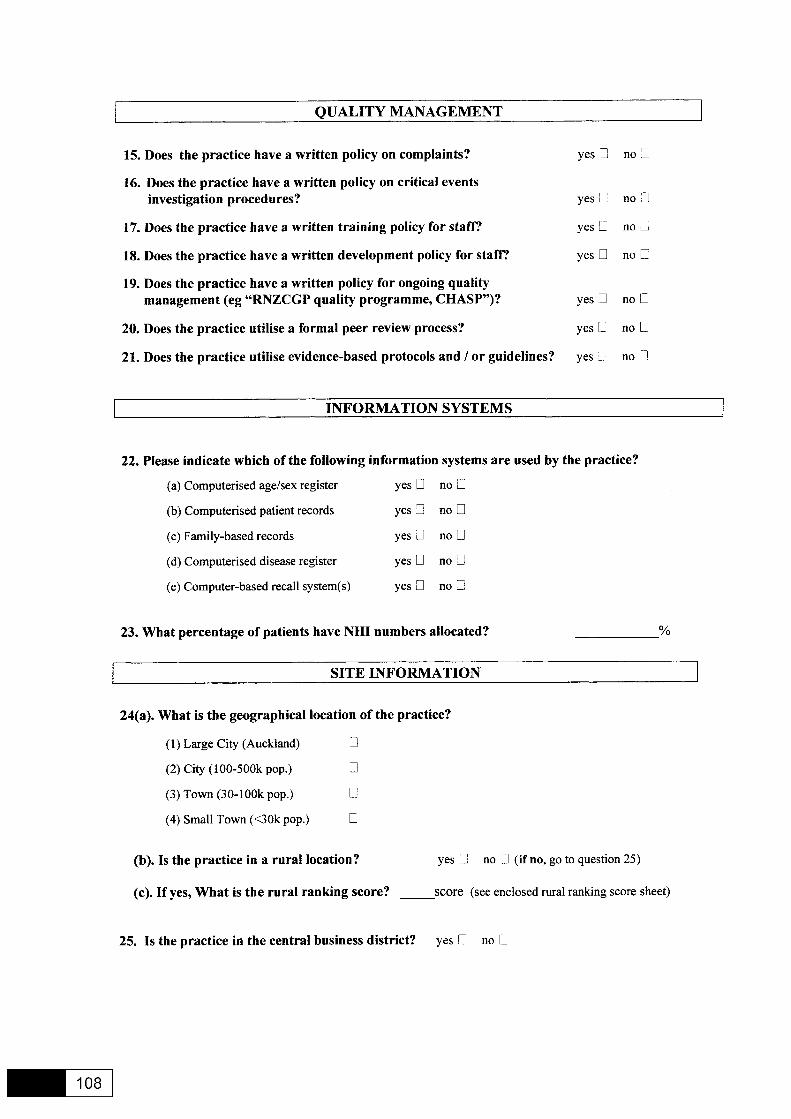
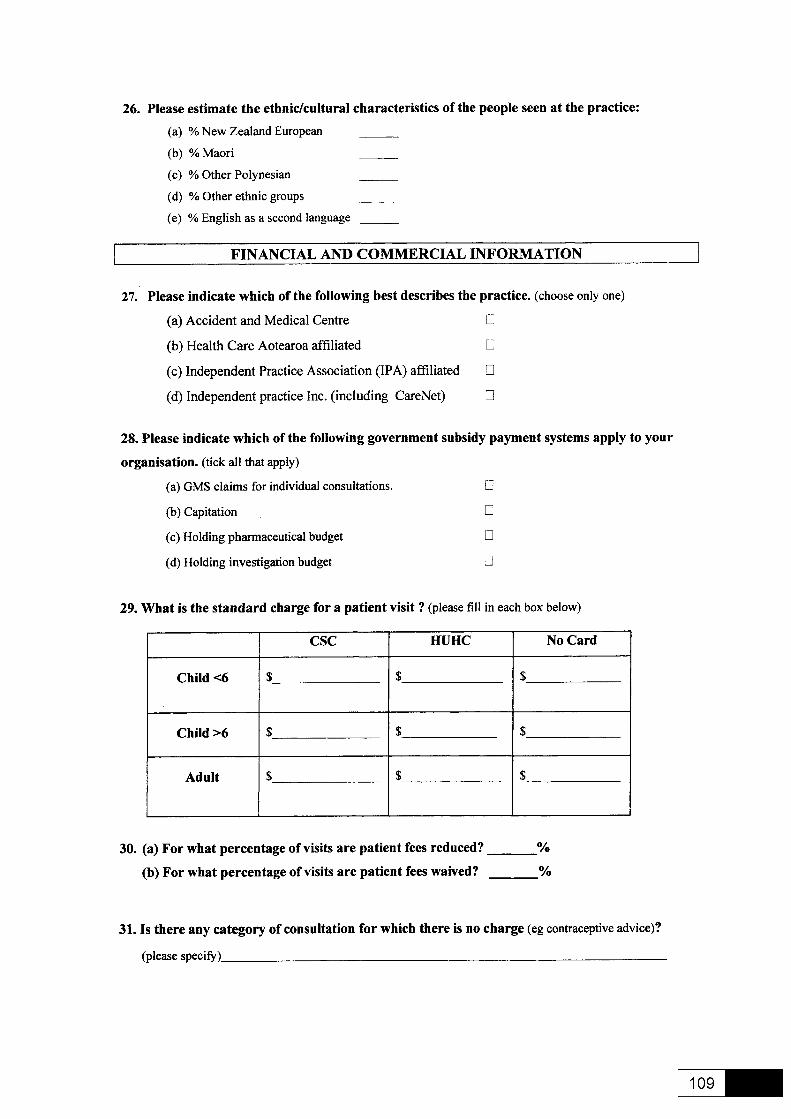
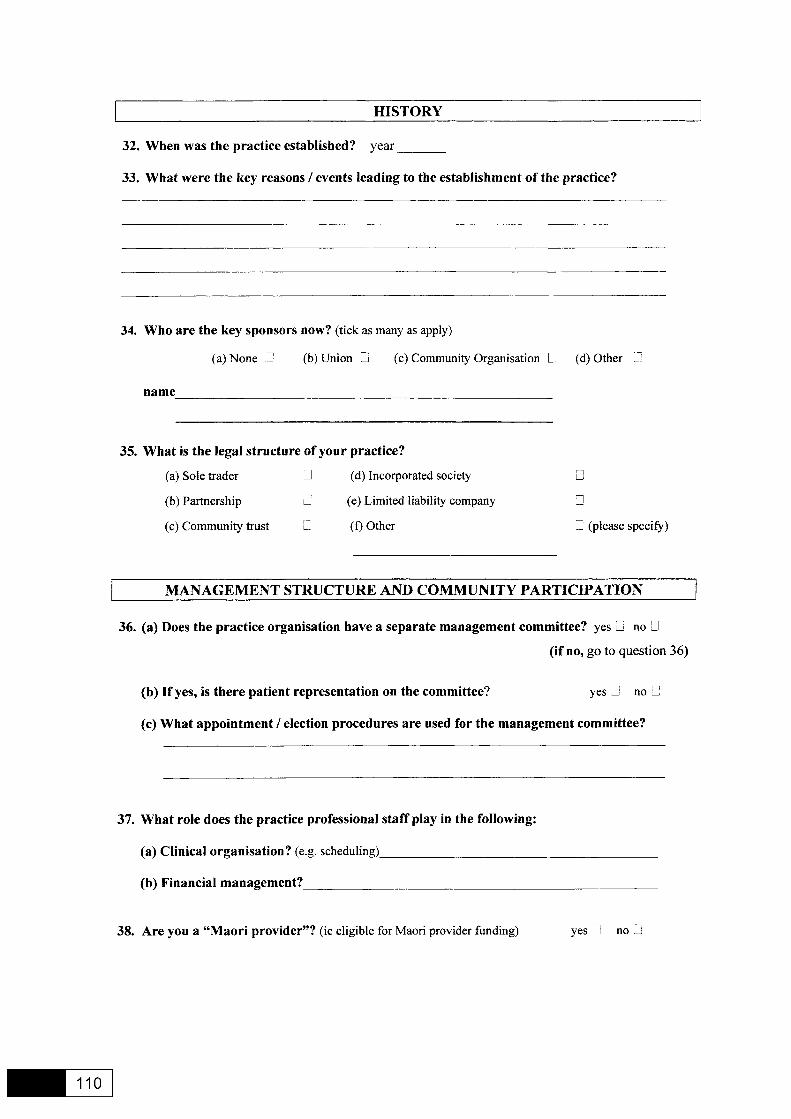
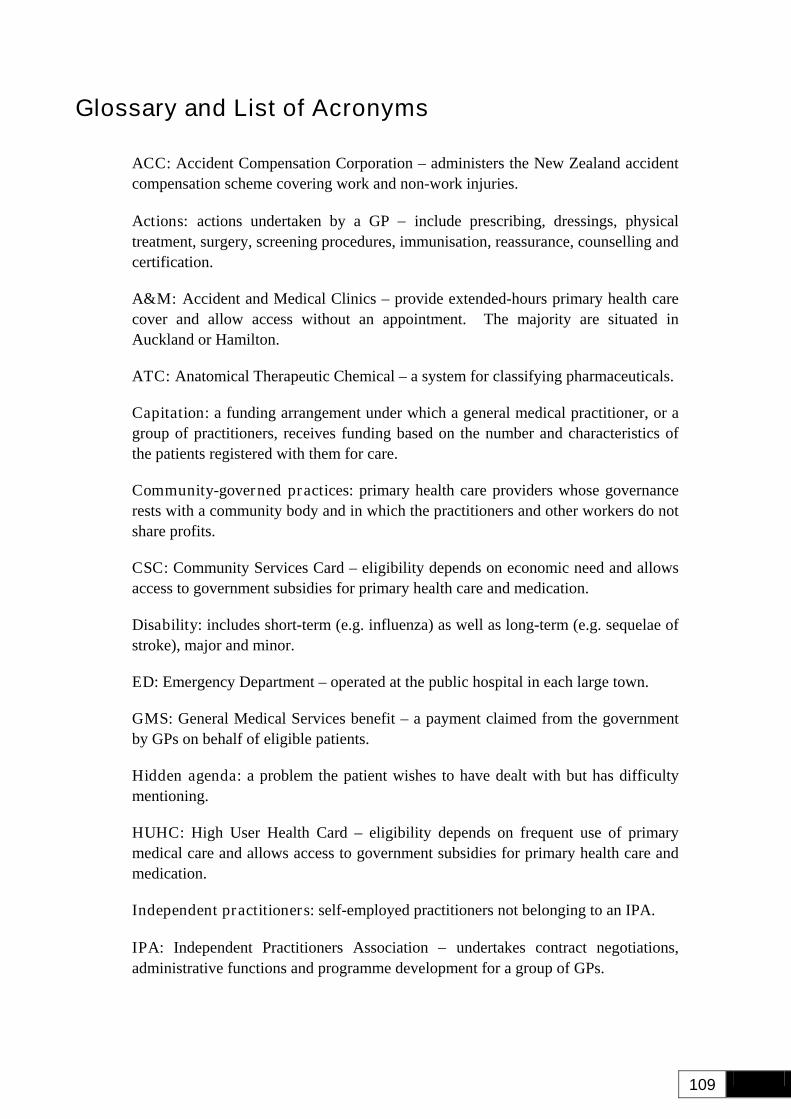
109
Glossary and List of Acronyms
ACC: Accident Compensation Corporation – administers the New Zealand accident compensation scheme covering work and non-work injuries.
Actions: actions undertaken by a GP − include prescribing, dressings, physical treatment, surgery, screening procedures, immunisation, reassurance, counselling and certification.
A&M: Accident and Medical Clinics – provide extended-hours primary health care cover and allow access without an appointment. The majority are situated in Auckland or Hamilton.
ATC: Anatomical Therapeutic Chemical – a system for classifying pharmaceuticals.
Capitation: a funding arrangement under which a general medical practitioner, or a group of practitioners, receives funding based on the number and characteristics of the patients registered with them for care.
Community-governed practices: primary health care providers whose governance rests with a community body and in which the practitioners and other workers do not share profits.
CSC: Community Services Card – eligibility depends on economic need and allows access to government subsidies for primary health care and medication.
Disability: includes short-term (e.g. influenza) as well as long-term (e.g. sequelae of stroke), major and minor.
ED: Emergency Department – operated at the public hospital in each large town.
GMS: General Medical Services benefit – a payment claimed from the government by GPs on behalf of eligible patients.
Hidden agenda: a problem the patient wishes to have dealt with but has difficulty mentioning.
HUHC: High User Health Card – eligibility depends on frequent use of primary medical care and allows access to government subsidies for primary health care and medication.
Independent practitioners: self-employed practitioners not belonging to an IPA.
IPA: Independent Practitioners Association − undertakes contract negotiations, administrative functions and programme development for a group of GPs.
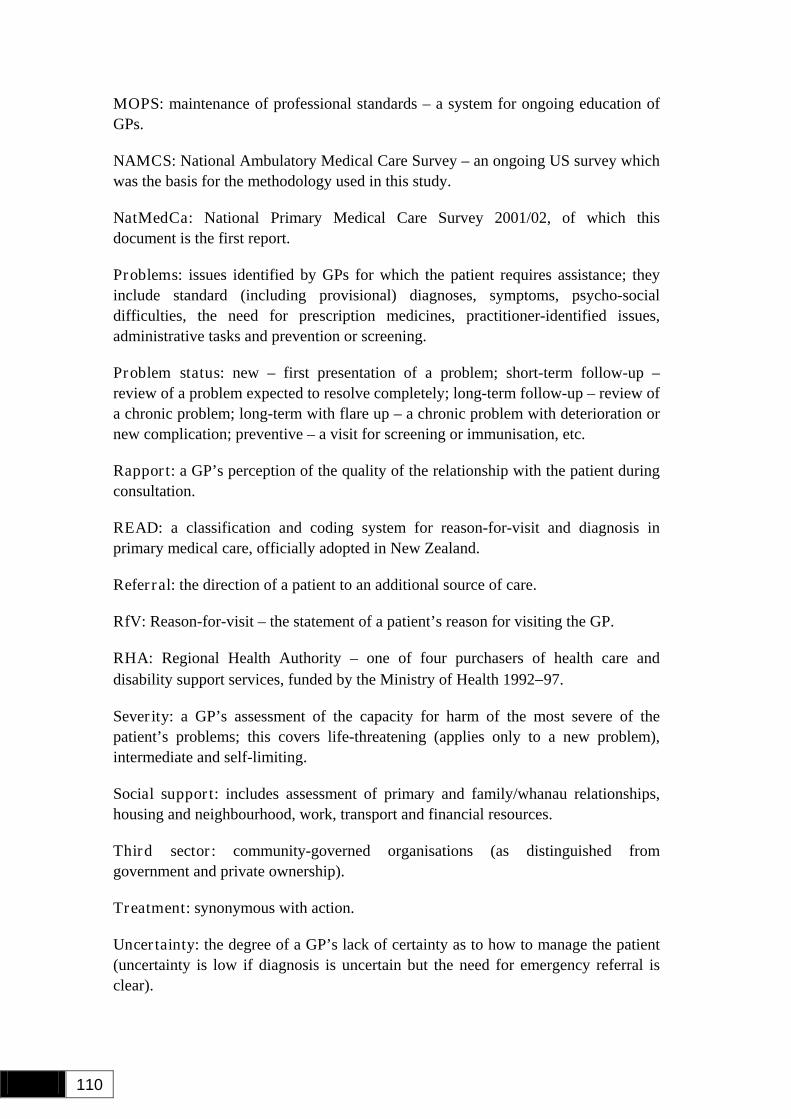
110
MOPS: maintenance of professional standards – a system for ongoing education of GPs.
NAMCS: National Ambulatory Medical Care Survey – an ongoing US survey which was the basis for the methodology used in this study.
NatMedCa: National Primary Medical Care Survey 2001/02, of which this document is the first report.
Problems: issues identified by GPs for which the patient requires assistance; they include standard (including provisional) diagnoses, symptoms, psycho-social difficulties, the need for prescription medicines, practitioner-identified issues, administrative tasks and prevention or screening.
Problem status: new – first presentation of a problem; short-term follow-up – review of a problem expected to resolve completely; long-term follow-up – review of a chronic problem; long-term with flare up – a chronic problem with deterioration or new complication; preventive – a visit for screening or immunisation, etc.
Rapport: a GP’s perception of the quality of the relationship with the patient during consultation.
READ: a classification and coding system for reason-for-visit and diagnosis in primary medical care, officially adopted in New Zealand.
Referral: the direction of a patient to an additional source of care.
RfV: Reason-for-visit – the statement of a patient’s reason for visiting the GP.
RHA: Regional Health Authority – one of four purchasers of health care and disability support services, funded by the Ministry of Health 1992−97.
Severity: a GP’s assessment of the capacity for harm of the most severe of the patient’s problems; this covers life-threatening (applies only to a new problem), intermediate and self-limiting.
Social support: includes assessment of primary and family/whanau relationships, housing and neighbourhood, work, transport and financial resources.
Third sector: community-governed organisations (as distinguished from government and private ownership).
Treatment: synonymous with action.
Uncertainty: the degree of a GP’s lack of certainty as to how to manage the patient (uncertainty is low if diagnosis is uncertain but the need for emergency referral is clear).
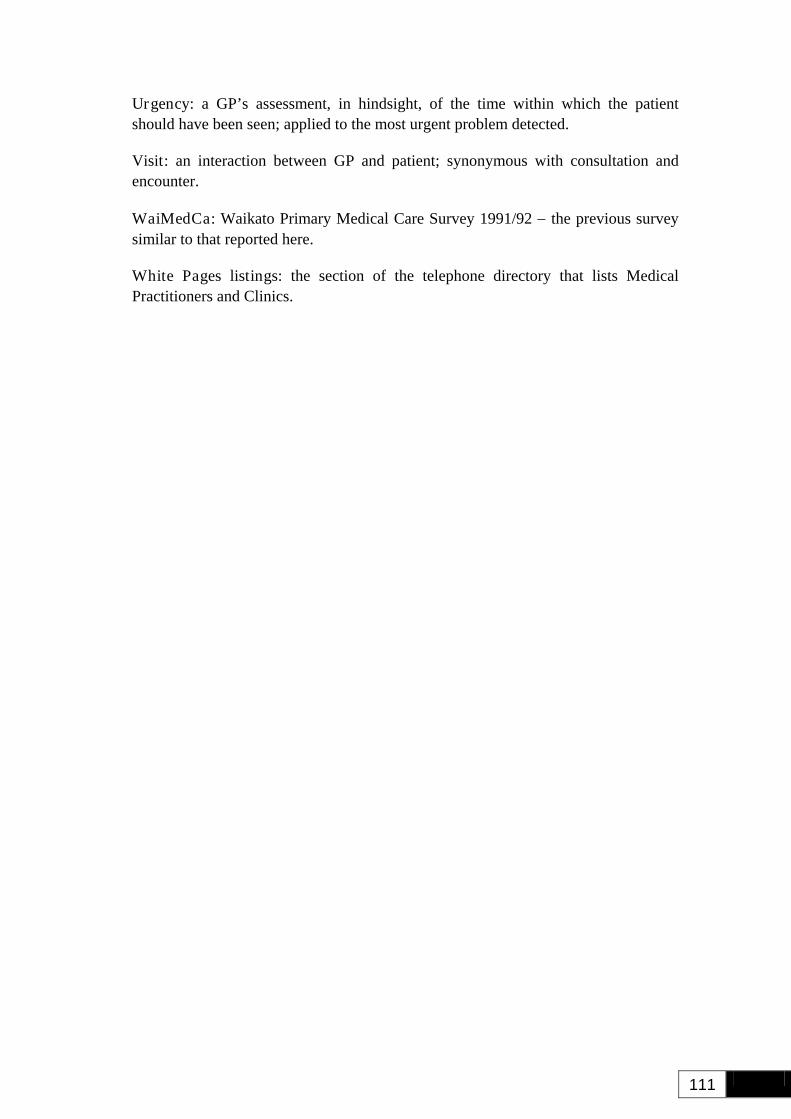
111
Urgency: a GP’s assessment, in hindsight, of the time within which the patient should have been seen; applied to the most urgent problem detected.
Visit: an interaction between GP and patient; synonymous with consultation and encounter.
WaiMedCa: Waikato Primary Medical Care Survey 1991/92 − the previous survey similar to that reported here.
White Pages listings: the section of the telephone directory that lists Medical Practitioners and Clinics.