Embed Size (px)
Citation preview

Project funded by the European Commission under the research and technological development
programme 'Integrating and strengthening the ERA' (2002-2006)
MAP Milling Project - Measure and control of
mycotoxins, pesticides and acrylamide in grain
milling sector
IGV Institute for Cereal Processing Ltd.
Arthur-Scheunert-Allee 40-41
14558 Nuthetal OT Bergholz-Rehbrücke
Germany
department
analytics/quality management
technical part
Dr. Monika Springer, Ute Meister
department
technology transfer
financial part
Ines Gromes
Training
material
about
* Mycotoxins
* Acrylamide

Project funded by the European Commission under the research and technological development
programme 'Integrating and strengthening the ERA' (2002-2006)
MAP Milling - Part mycotoxins
Assessment of rapid
methods for mycotoxins
Project funded by the European Commission under the research and technological development
programme 'Integrating and strengthening the ERA' (2002-2006)
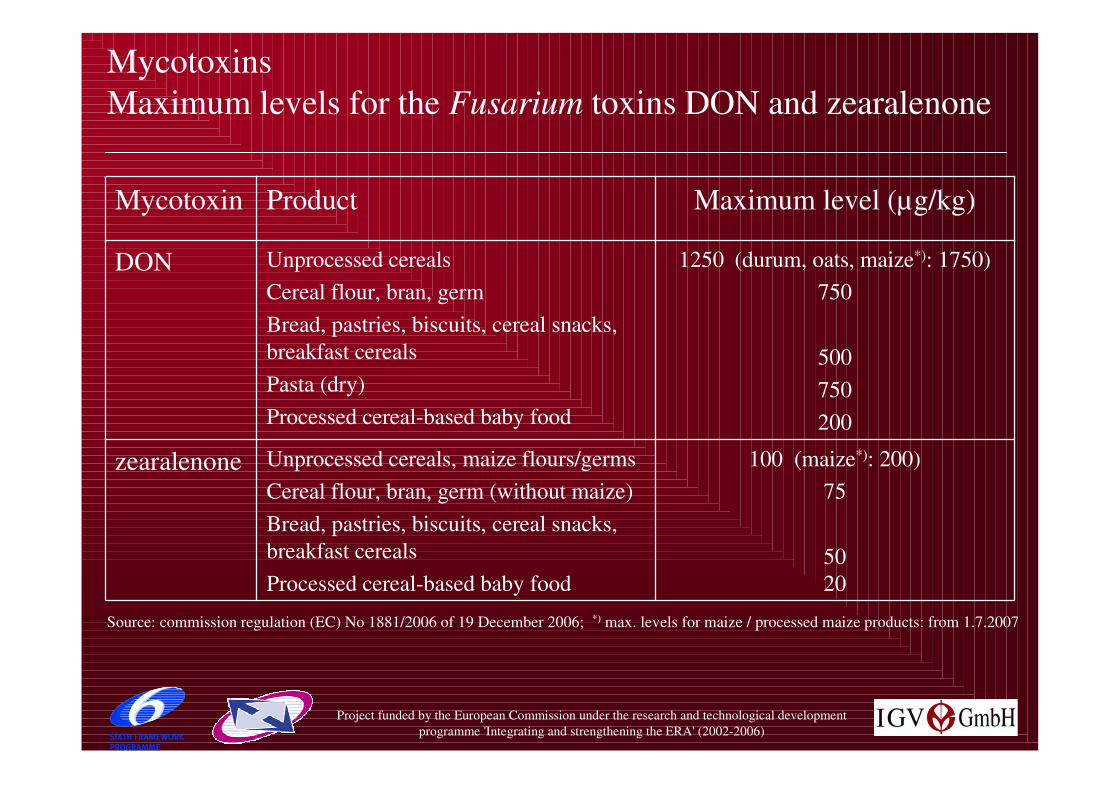
Mycotoxins
Maximum levels for the Fusarium toxins DON and zearalenone
100 (maize*): 200)
75
50
20
Unprocessed cereals, maize flours/germs
Cereal flour, bran, germ (without maize)
Bread, pastries, biscuits, cereal snacks,
breakfast cereals
Processed cereal-based baby food
zearalenone
1250 (durum, oats, maize*): 1750)
750
500
750
200
Unprocessed cereals
Cereal flour, bran, germ
Bread, pastries, biscuits, cereal snacks,
breakfast cereals
Pasta (dry)
Processed cereal-based baby food
DON
Maximum level (µg/kg)ProductMycotoxin
Source: commission regulation (EC) No 1881/2006 of 19 December 2006; *) max. levels for maize / processed maize products: from 1.7.2007

Project funded by the European Commission under the research and technological development
programme 'Integrating and strengthening the ERA' (2002-2006)
Mycotoxins
Maximum levels for other mycotoxins in cereals / cereal products
2000
1000
400
200
Unprocessed maize*)
Maize flour, germ, oil *)
Processed maize products *)
Processed cereal-based baby food *)
Fumonisin
B1+B2
5
3
0.5
Unprocessed cereals
Cereal products
Processed cereal-based baby food
OTA
2 / 4
5 / 10
0.1 / -
Cereals and cereal products
Maize for sorting or other treatment
Processed cereal-based baby food
Aflatoxin B1 /
Aflatoxins (sum)
Max. level (µg/kg)ProductMycotoxin
Source: commission regulation (EC) No 1881/2006 of 19 December 2006;*) max. levels for fumonisins in maize / processed maize products: from 1.10.2007

Project funded by the European Commission under the research and technological development
programme 'Integrating and strengthening the ERA' (2002-2006)
Mycotoxins
Maximum levels for other mycotoxins in feed
0.005 - 0.02feedingstuffsAflatoxin B1
8 (maize by-products: 12)
0.9 - 5
Cereals and cereal products
Other complementary / complete feedingstuffsDON*)
2 (maize by-products: 3)
0.1 - 0.5
Cereals and cereal products
Other complementary / complete feedingstuffsZearalenone*)
60
5 - 50
Maize and maize products
Other complementary / complete feedingstuffs
Fumonisin*)
B1+B2
0.25
0.05 - 0.1
Cereals and cereal products
Other complementary / complete feedingstuffsOTA*)
Max. level (mg/kg)ProductMycotoxin
*) guidance values

Project funded by the European Commission under the research and technological development
programme 'Integrating and strengthening the ERA' (2002-2006)
Mycotoxins
Accuracy and precision of analytical methods for mycotoxins
Performance criteria according to commission regulation (EC) No 40172006
< 20
< 20
RSDr %
< 40
< 40
RSDR %
60 to 110> 100 - < 500
70 to 120> 500
Recovery %Level µg/kg
for zearalenone:
< 25
< 40
RSDr %
< 40
< 50
RSDR %
60 to 120< 50
70 to 120> 50
Recovery %Level µg/kg
for DON:
Project funded by the European Commission under the research and technological development
programme 'Integrating and strengthening the ERA' (2002-2006)
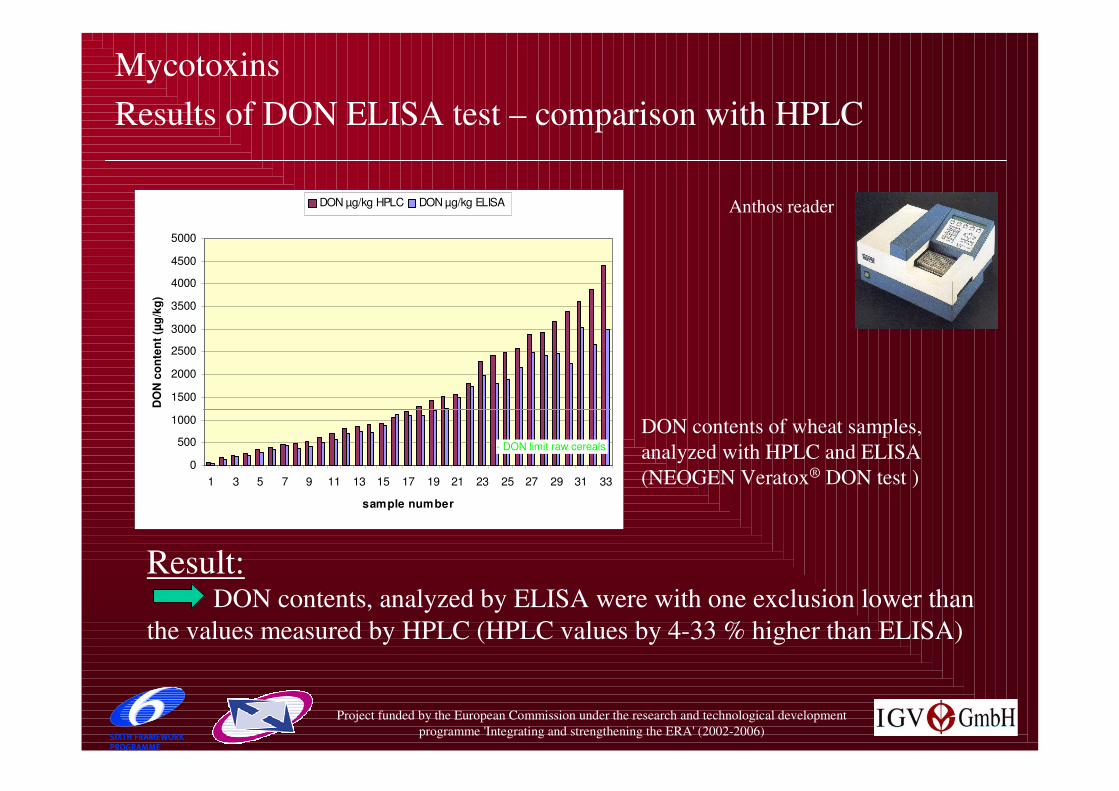
Mycotoxins
Results of DON ELISA test – comparison with HPLC
0
500
1000
1500
2000
2500
3000
3500
4000
4500
5000
1 3 5 7 9 11 13 15 17 19 21 23 25 27 29 31 33
sample number
DO
Nc
on
ten
t(µ
g/k
g)
DON µg/kg HPLC DON µg/kg ELISA
DON contents of wheat samples,
analyzed with HPLC and ELISA
(NEOGEN Veratox® DON test )
Anthos reader
Result:DON contents, analyzed by ELISA were with one exclusion lower than
the values measured by HPLC (HPLC values by 4-33 % higher than ELISA)
- DON limit raw cereals

Project funded by the European Commission under the research and technological development
programme 'Integrating and strengthening the ERA' (2002-2006)
Mycotoxins
Results of DON ELISA test – correlation with HPLC
correlation coefficients:
- 0.984 for all values
- 0.991 for the values
up to 2000 µg/kg
y = 0,7345x + 116,73
R2 = 0,9687
0
500
1000
1500
2000
2500
3000
3500
4000
0 1000 2000 3000 4000 5000
DON HPLC (µg/kg)
DO
NE
LIS
A(µ
/kg
)
Correlation between HPLC and ELISA was very good
Project funded by the European Commission under the research and technological development
programme 'Integrating and strengthening the ERA' (2002-2006)
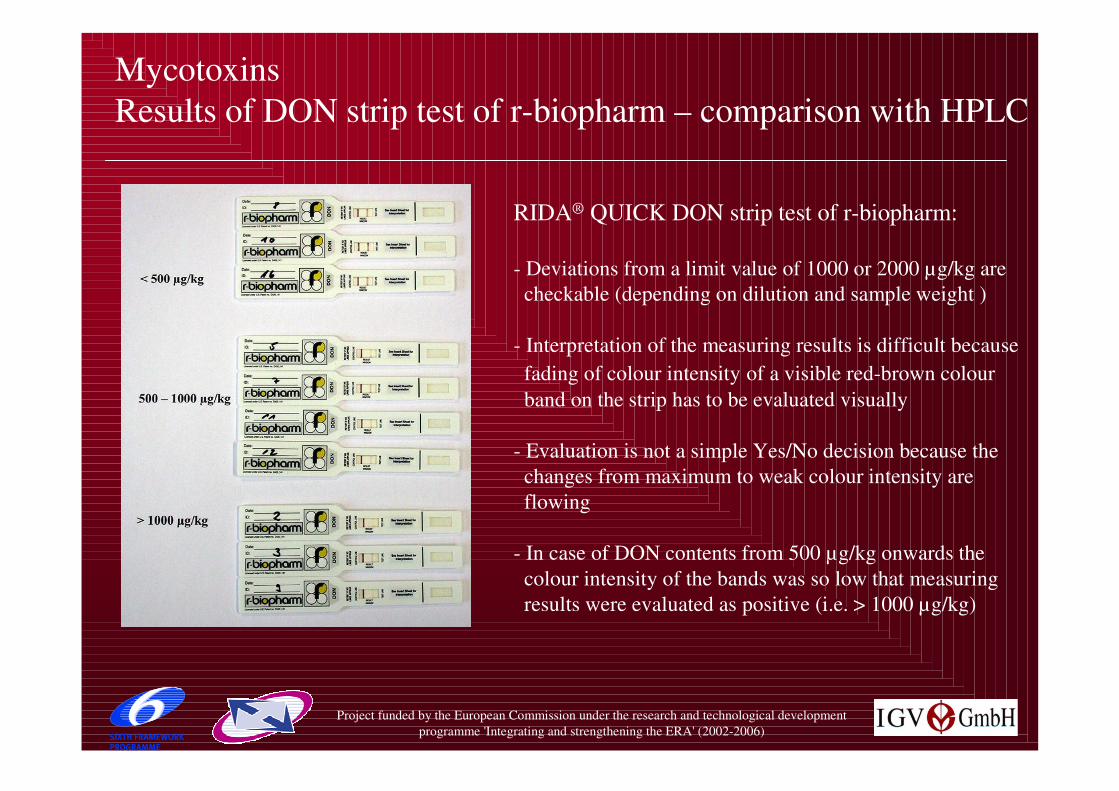
Mycotoxins
Results of DON strip test of r-biopharm – comparison with HPLC
RIDA® QUICK DON strip test of r-biopharm:
- Deviations from a limit value of 1000 or 2000 µg/kg are
checkable (depending on dilution and sample weight )
- Interpretation of the measuring results is difficult because
fading of colour intensity of a visible red-brown colour
band on the strip has to be evaluated visually
- Evaluation is not a simple Yes/No decision because the
changes from maximum to weak colour intensity are
flowing
- In case of DON contents from 500 µg/kg onwards the
colour intensity of the bands was so low that measuring
results were evaluated as positive (i.e. > 1000 µg/kg)

Project funded by the European Commission under the research and technological development
programme 'Integrating and strengthening the ERA' (2002-2006)
Mycotoxins
Results of DON strip test of r-biopharm – comparison with HPLC
Comparison of RIDA® QUICK DON strip test
(r-biopharm) with HPLC
Result:Of the total of 35 wheat samples, 9 samples had an incorrectly positive evaluation
-> Correlation between HPLC and RIDA® QUICK DON strip test was low
0
1000
2000
3000
4000
5000
6000
7000
1 3 5 7 9 11 13 15 17 19 21 23 25 27 29 31 33 35
sample number
DO
N(H
PL
C)
µg
/kg
0
1
2
resu
lts
of
dip
sti
ck
test
DON µg/kg HPLC result of dipsticks
- DON limit raw cereals

Project funded by the European Commission under the research and technological development
programme 'Integrating and strengthening the ERA' (2002-2006)
Mycotoxins
DON strip test of neogen – comparison with HPLC
REVEAL®DON strip test of neogen
0 = not detectable DON content < 0.5 mg/kg
0.5 = positive result DON content between 0.5 – 1 mg/kg
1.0 = positive result DON content between 1 – 2 mg/kg
2.0 = positive result DON content > 2 mg/kg
- in this strip test , too, differently coloured lines are obtained,
but the intensity of the lines can be measured by AccuScan reader
- Algorithms programmed into the AccuScan reader convert the
measured line density into a semi-quantitative result:
AccuScan reader

Project funded by the European Commission under the research and technological development
programme 'Integrating and strengthening the ERA' (2002-2006)
Mycotoxins
Results of DON strip test of neogen – comparison with HPLC
Comparison of neogen REVEAL®DON strip test with HPLC
0
200
400
600
800
1000
1 2 3 4 5 6 7 8 9 10 11 12
wheat samples w ith DON contents >500-1000 µg/kg
DO
N(H
PL
C)
µg
/kg
0
0,5
1
res
ult
so
fd
ips
tic
kte
st
DON µg/kg HPLC results of dip sticks
0
500
1000
1500
2000
2500
3000
3500
4000
4500
5000
1 3 5 7 9 11 13 15 17 19 21 23 25
wheat samples w ith DON contents >1000-2000 and >2000
µg/kg
DO
N(H
PL
C)
µg
/kg
0
0,5
1
1,5
2
res
ult
so
fd
ips
tic
kte
st
DON µg/kg HPLC results of dip sticks
- DON limit raw cereals
- DON limit cereal flours
- Of 56 measured samples, only 2 of 12 samples in the range
of concentrations >500 - <1000 had a too low/too high
semiquantitative result (but both samples had DON
contents in a borderland of decision: 520 respectively 909
µg/kg)
- In the range of DON-concentrations >1000 µg/kg
3 samples had a lower result than expected (2 samples had
DON contents widely above the legal limit of raw grain and
1 sample had a DON content of just above 1000 µg/kg )
Result:good correlation between HPLC and
Reveal DON strip test

Project funded by the European Commission under the research and technological development
programme 'Integrating and strengthening the ERA' (2002-2006)
Mycotoxins
Principle of Fluorescence polarisation immunoassay (FPI)
Competition of mycotoxin (red Ag)
with fluorescein labelled mycotoxin
(green Ag) for binding to antibody
(Ab)
At illumination with polarized light:
- negative samples with bound fluores-
cein labelled mycotoxin (green Ag)
show a polarized fluorescence
emission (= 100 %)
- samples with mycotoxin content show
reduced or no polarized fluorescence
emission (= 100 % - x)Source: http://www.lfl.bayern.de/labor_aktuell/artikel/12074/linkurl_0_0_0_1.pdf

Project funded by the European Commission under the research and technological development
programme 'Integrating and strengthening the ERA' (2002-2006)
Mycotoxins
Fluorescence polarisation immunoassay (FPI) for zearalenone
Prototype of the FP 470 of AOKIN AG
Calibration curve of zearalenone

Project funded by the European Commission under the research and technological development
programme 'Integrating and strengthening the ERA' (2002-2006)
Mycotoxins
Results of FPI for ZEA – comparison with HPLC
AOKIN FP 470
0
50
100
150
200
250
1 2 3 4 5 6 7 8 9 10 11 12 13 14 15 16 17 18 19 20 21 22
sample number
zeara
len
on
co
nte
nt
(µg
/kg
)
Zearalenon (µg/kg) HPLC Zearalenon (µg/kg) AOKIN FP
Zearalenone contents of wheat
samples, analyzed with HPLC and
fluorescence polarization
Result:ZEA contents, analyzed by HPLC, were confirmed by FPI with deviations of + 40 %
(positive deviations are due to the fact that zearalenone derivatives are co-detected by
antibody-based FP)
- ZEA limit raw cereals

Project funded by the European Commission under the research and technological development
programme 'Integrating and strengthening the ERA' (2002-2006)
Mycotoxins
Results of FPI for zearalenone – correlation with HPLC
y = 0,9112x + 6,3255
R2 = 0,9135
0
50
100
150
200
250
0 50 100 150 200
Zearalenon HPLC (µg/kg)
Ze
ara
len
on
FP
AO
KIN
(µg
/kg
)
Correlation between HPLC and fluorescence polarization was adequate
to a rapid method (correlation coefficient: 0.956)
Result:
Correlation between HPLC
and fluorescence polarization

Project funded by the European Commission under the research and technological development
programme 'Integrating and strengthening the ERA' (2002-2006)
Mycotoxins
Fourier transform infrared spectroscopy (FTIR )
FTIR measurements were performed with a FTIR spectrometer 8400S from Shimadzu,
fitted with a single reflection diamond ATR element (Golden Gate)

Project funded by the European Commission under the research and technological development
programme 'Integrating and strengthening the ERA' (2002-2006)
Mycotoxins
Fourier transform infrared spectroscopy (FTIR )
Mid-infrared spectrum of wheat
8001000120014001600180020002400280032003600400044001/cm
0,05
0,1
0,15
0,2
0,25
0,3
0,35
0,4
0,45
0,5
AbsThe rectangle marks the
range chosen for data
analysis according to Kos
et al. (2003) Anal Chem
75: 1211-1217
-> they observed the greatest
changes caused by mould in
the spectral range of 1800-800
cm-1 (bands of carbohydrates,
proteins, lipids).

Project funded by the European Commission under the research and technological development
programme 'Integrating and strengthening the ERA' (2002-2006)
Mycotoxins
Fourier transform infrared spectroscopy (FTIR )
Mid-infrared spectrum of wheat - unsieved sample
-> 10 measurements: 10 relatively different spectra
7501000125015001750200025003000350040004500
1/cm
0,075
0,15
0,225
0,3
0,375
0,45
Abs

Project funded by the European Commission under the research and technological development
programme 'Integrating and strengthening the ERA' (2002-2006)
Mycotoxins
Fourier transform infrared spectroscopy (FTIR )
Mid-infrared spectrum of wheat - sieved sample (112-250 µm)
-> better agreement between 10 measured spectra
7501000125015001750200025003000350040004500
1/cm
0,075
0,15
0,225
0,3
0,375
0,45
Abs

Project funded by the European Commission under the research and technological development
programme 'Integrating and strengthening the ERA' (2002-2006)
Mycotoxins
Fourier transform infrared spectroscopy (FTIR )
Mid-infrared spectrum of wheat - sieved sample (< 112 µm )
-> good agreement between 10 measured spectra
For calibration,
validation and
measurement of
unknown samples
only the sieving
fractions <112 µm
of the ground
samples were used
7501000125015001750200025003000350040004500
1/cm
0,1
0,2
0,3
0,4
0,5
Abs

Project funded by the European Commission under the research and technological development
programme 'Integrating and strengthening the ERA' (2002-2006)
Mycotoxins
DON: Correlation of HPLC / FTIR
Calibration of FTIR 8400S
with 14 wheat samples(DON contents: 60-2590 µg/kg)
Calibration
y = 0,9802x + 24,821
R2 = 0,9802
0
500
1000
1500
2000
2500
3000
0 500 1000 1500 2000 2500 3000
Actual
Pre
dic
ted
A calibration with a good correlation was achieved (correlation coefficient: 0.9901)
Result:

Project funded by the European Commission under the research and technological development
programme 'Integrating and strengthening the ERA' (2002-2006)
Mycotoxins
DON analysis possible with FTIR?
Full cross-validation (samples)
y = 0,3045x + 820,27
R2
= 0,24320
500
1000
1500
2000
2500
3000
0 500 1000 1500 2000 2500 3000
Actual
Pre
dic
ted
Full cross-validation
with 14 wheat samples(DON contents: 60-2590 µg/kg)
Correlation significantly worsened at full cross-validation (correlation coefficient
only 0.4932)
Correct predictions of the DON content of unknown samples were not possible
Obviously there is no direct connection between changes of the components of the
grain kernels (carbohydrates/proteins/fats) by moulding and the DON content (other
fungi which do not produce DON could have caused the measured changes)
Result:

Project funded by the European Commission under the research and technological development
programme 'Integrating and strengthening the ERA' (2002-2006)
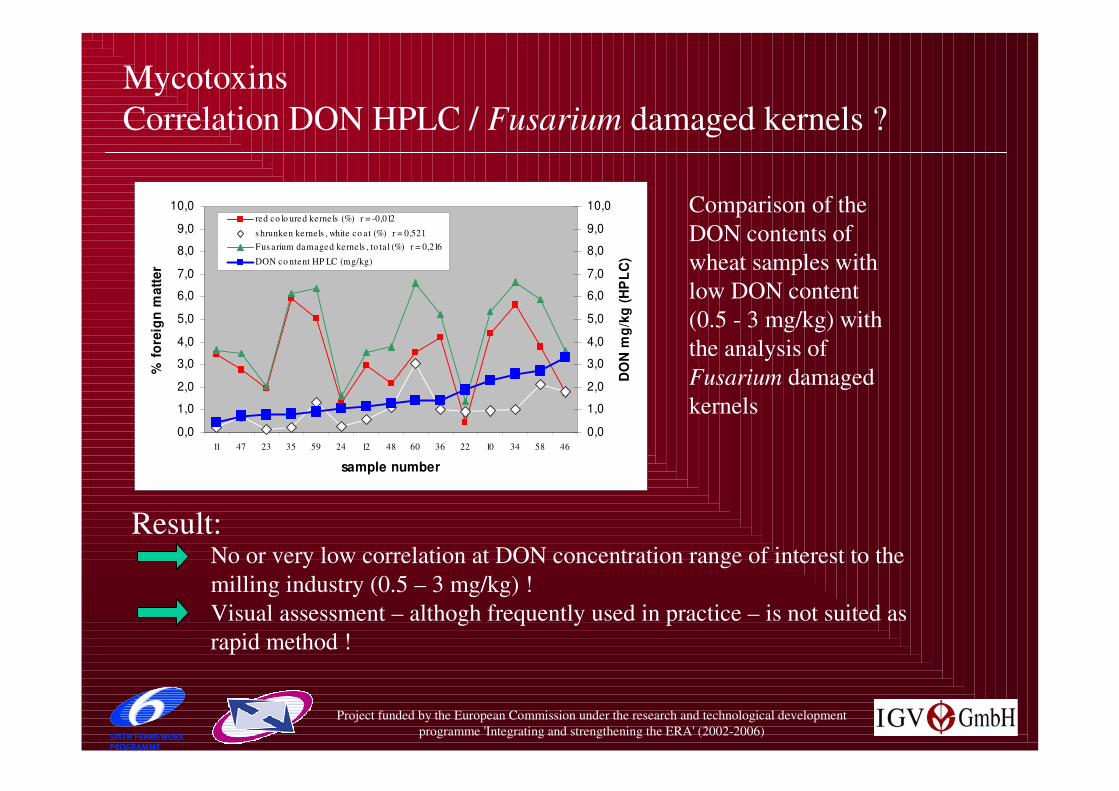
Mycotoxins
Correlation DON HPLC – Fusarium damaged kernels ?
healthy kernels, normal size
white to reddish colour, stronglyshrunken fusarium damagedkernels
kernels of normal appearancewith red tip (seldom)
dented kernels, normal size,mycel in the ventral fold
Source: http://www.lfl.bayern.de/labor_aktuell/artikel/12074/linkurl_0_0_0_1.pdf
Due to frequent
request of farmers,
grain-chandlers
and millers, the
suitability of the
visual assessment
(analysis of
Fusarium damaged
kernels) also was
compared with
HPLC.

Project funded by the European Commission under the research and technological development
programme 'Integrating and strengthening the ERA' (2002-2006)
Mycotoxins
Correlation DON HPLC / Fusarium damaged kernels ?
Comparison of the
DON contents of all
60 wheat samples
(0.5 - 34 mg/kg)
with the analysis of
Fusarium damaged
kernels
0,0
5,0
10,0
15,0
20,0
25,0
30,0
35,0
sample number
fore
ign
matt
er
(%)
0,0
5,0
10,0
15,0
20,0
25,0
30,0
35,0
DO
Nc
on
ten
tH
PL
C(m
g/k
g)
red co lo ured kerne ls (%) r = -0,191
s hrunken kerne ls , white co a t (%) r = 0,897
Fus arium damaged kerne ls , to ta l (%) r = 0,836
DON co ntent HP LC (mg/kg)
Result:Correlation between HPLC and
- white, shrunken kernels with whitish coat
- Fusarium damaged kernels (total)
No correlation between HPLC and
- red coloured kernels

Project funded by the European Commission under the research and technological development
programme 'Integrating and strengthening the ERA' (2002-2006)
Mycotoxins
Correlation DON HPLC / Fusarium damaged kernels ?
Correlation at high DON contents (4 – 34 mg/kg):
0,0
2,0
4,0
6,0
8,0
10,0
12,0
14,0
16,0
18,0
20,0
17 5 29 41 53 18 6 30 54 42 16 4 28 40 52
sample number (wheat cultivar I)
%fo
reig
nm
att
er
0,0
2,0
4,0
6,0
8,0
10,0
12,0
14,0
16,0
18,0
20,0
DO
Nm
g/k
g(H
PL
C)
red co lo ured kernels (%) r = 0,104
s hrunken kernels , white co a t (%) r = 0,933
Fus arium damaged kernels , to tal (%) r = 0,909
DON co ntent HP LC (mg/kg)
0,0
5,0
10,0
15,0
20,0
25,0
8 20 44 32 56 9 33 21 57 45 19 7 31 43 55
sample number (wheat cultivar II)
%fo
reig
nm
att
er
0,0
5,0
10,0
15,0
20,0
25,0
DO
Nm
g/k
g(H
PL
C)
DON co ntent HP LC (mg/kg)
red co lo ured ke rne ls (%) r = -0,087
s hrunken ke rne ls , white co at (%) r = 0,842
Fus a rium damaged ke rne ls , to tal (%) r = 0,695
good correlation
in wheat samples
of cultivar I
lower correlation in wheat samples of cultivar II and III :
0,0
5,0
10,0
15,0
20,0
25,0
30,0
35,0
14 2 50 38 26 3 51 15 27 13 39 1 25 49 37
sample number (wheat cultivar III)
%fo
reig
nM
att
er
0,0
5,0
10,0
15,0
20,0
25,0
30,0
35,0
DO
Nm
g/k
g(H
PL
C)
red co lo ured ce rne ls (%) r = -0,471
s hrunken kernels , white co a t (%) r = 0,824
Fus a rium damaged ke rnels , to tal (%) r = 0,691
DON co ntent HP LC (mg/kg)
Project funded by the European Commission under the research and technological development
programme 'Integrating and strengthening the ERA' (2002-2006)
Mycotoxins
Correlation DON HPLC / Fusarium damaged kernels ?
No or very low correlation at DON concentration range of interest to the
milling industry (0.5 – 3 mg/kg) !
Visual assessment – althogh frequently used in practice – is not suited as
rapid method !
0,0
1,0
2,0
3,0
4,0
5,0
6,0
7,0
8,0
9,0
10,0
11 47 23 35 59 24 12 48 60 36 22 10 34 58 46
sample number
%fo
reig
nm
att
er
0,0
1,0
2,0
3,0
4,0
5,0
6,0
7,0
8,0
9,0
10,0
DO
Nm
g/k
g(H
PL
C)
red co lo ured kerne ls (%) r = -0,012
s hrunken kernels , white co at (%) r = 0,521
Fus arium damaged kernels , to tal (%) r = 0,216
DON co ntent HP LC (mg/kg)
Comparison of the
DON contents of
wheat samples with
low DON content
(0.5 - 3 mg/kg) with
the analysis of
Fusarium damaged
kernels
Result:
Project funded by the European Commission under the research and technological development
programme 'Integrating and strengthening the ERA' (2002-2006)
Mycotoxins
Assessment of methods for mycotoxins (DON, zearalenone)
> 40 €> 50 T€high (chemist)> 1 dayimpossibler < 0,800
30 - 40 €>30 - 50 T€< 4 hr > 0,802
20 - 30 €>10 - 30 T€< 2 hr > 0,854
10 - 20 €>2 - 10 T€< 1 hr > 0,906
< 10 €< 2 T€< 30 minr > 0,958
00low< 20 minpossibler = 110
Scale:
3210106600Fus. damag. kernels
15-251024(0*/ 9)00FTIR
41 ?(4-6) ?**(6)?**6888Fluor. polarization
4788101074Dipstick neogen
4081081040Dipstick r-biopharm
40466888ELISA
reference(2)0(0)(2)(10)(10)HPLC
SummaryMaterial costs
per sample
Invest-
ment
Required expe-
rience /qualific.
RapidityControl of
legal limit
Exact
quantific.
Method
* time-consuming calibration with HPLC required for rapid measurement ** costs unknown yet
Project funded by the European Commission under the research and technological development
programme 'Integrating and strengthening the ERA' (2002-2006)
Mycotoxins
Assessment of methods for mycotoxins - conclusion
Conclusion:
The rapid methods were evaluated with respect to the possibilities to control the
legal limits for mycotoxins and also to their rapidity, the required experience /
personnel qualification and the costs for investment / analysis.
Bearing in mind these criteria the Neogen Reveal® DON strip was evaluated
best. The strip test can be used for the detection of a transgression or falling-
below a limit value.
Exact quantification of mycotoxin contents according to this test is not possible.
For this purpose only HPLC or another chromatographic method can be used.

Project funded by the European Commission under the research and technological development
programme 'Integrating and strengthening the ERA' (2002-2006)
MAP Milling - Part acrylamide
Study about acrylamide
formation and minimization

Project funded by the European Commission under the research and technological development
programme 'Integrating and strengthening the ERA' (2002-2006)
Acrylamide
Signal values for acrylamide
signal value (µg/kg)
11/01/0721/10/0517/11/0426/11/0331/01/0317/09/00
productcereals
extruded flat bread,
crisp bread
gingerbread
diabetic pastries
almond biscuit
short crust pastries
cookies for children, rusk
breakfast cereals
(cornflakes)
610
1000
n.c.
710
660
n.c.
260
610
1000
n.c.
1000
800
n.c.
260
610
1000
1000
710
575
360
200
590
1000
545
560
300
245
180
416560
10001000
197360wheat
300575
5451000
496610rye
180200maize
Project funded by the European Commission under the research and technological development
programme 'Integrating and strengthening the ERA' (2002-2006)
Acrylamide
Formation of acrylamide in food
For the formation of acrylamide several pathways have been proposed:
First pathway discussed is the Strecker pathway about aminopropionamide as intermediate
Beside Strecker pathway with aminopropionamide other ways have been found:- a biochemical way by decarboxylation of asparagines
- a thermal way (Amadori pathway) with 3-amino-propionamide
- another thermal way (Strecker pathway) with 3-hydroxy-propionamide
In all the ways, free asparagine is the pre-metabolite
Project funded by the European Commission under the research and technological development
programme 'Integrating and strengthening the ERA' (2002-2006)
Acrylamide
Formation of acrylamide in food
Strecker pathway with aminopropionamide as intermediate:
- Pathway is characterized by a series of reactions between amino acids, primary free
asparagine, and a reducing sugar (fructose or glucose)
- Reactions are part of the Maillard reaction, which also causes the browning of food
and development of taste during baking
- Heat (>140 °C) and dryness are important reaction conditions
- The high potential of aminopropionamide for acrylamide formation results from the
easy thermal elimination of NH3
- If asparagine is replaced by other amino acids (cysteine, threonine, methionine)
the acrylamide production is quite lower
- Also substitution of glucose, fructose by saccharose or lactose showed a lower
potential of acrylamide formation

Project funded by the European Commission under the research and technological development
programme 'Integrating and strengthening the ERA' (2002-2006)
Acrylamide
Aim of the project
Known, quite effective technological variations in minimization of acrylamide are
- increasing product moisture
- decreasing baking temperature and baking time
The aim of the project was:
- the investigation of the influences in raw materials to get knowledge about the
content of free asparagine
- to show links between free asparagine in cereals and acrylamide in baking or
extrusion products
Project funded by the European Commission under the research and technological development
programme 'Integrating and strengthening the ERA' (2002-2006)
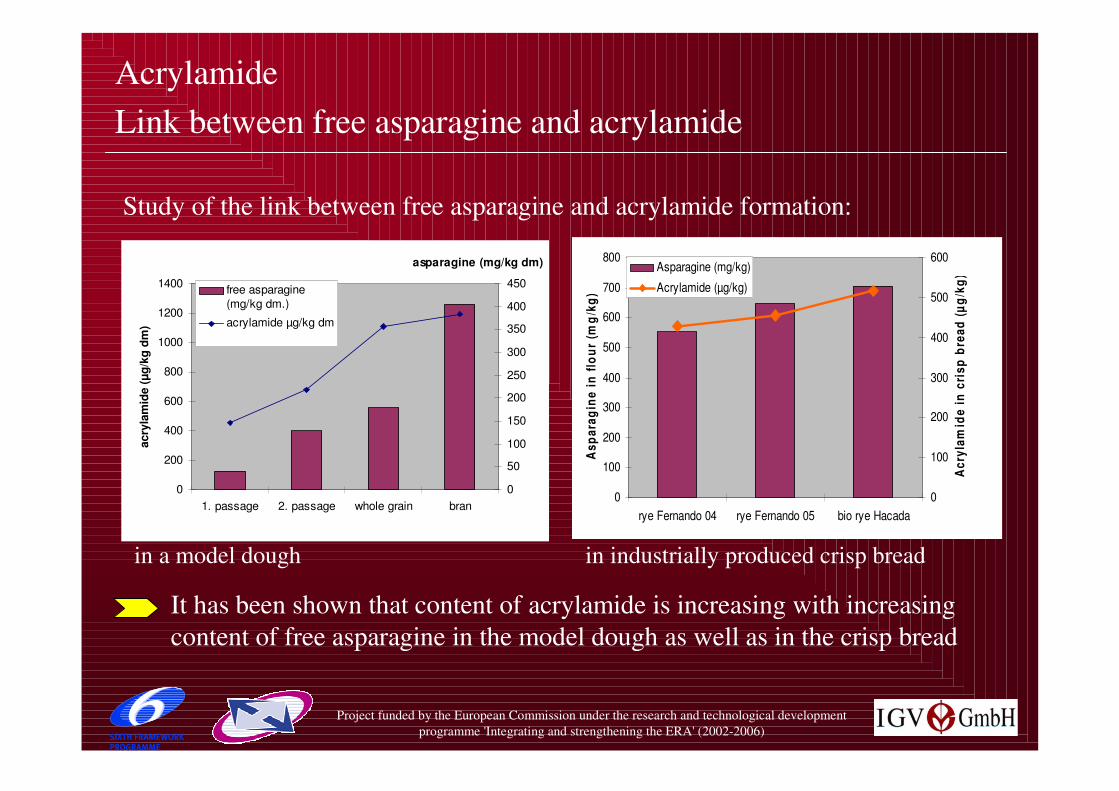
Acrylamide
Link between free asparagine and acrylamide
0
200
400
600
800
1000
1200
1400
1. passage 2. passage whole grain bran
acry
lam
ide
(µg
/kg
dm
)
0
50
100
150
200
250
300
350
400
450
asparagine (mg/kg dm)
free asparagine
(mg/kg dm.)
acrylamide µg/kg dm
0
100
200
300
400
500
600
700
800
rye Fernando 04 rye Fernando 05 bio rye Hacada
As
pa
rag
ine
infl
ou
r(m
g/k
g)
0
100
200
300
400
500
600
Ac
ryla
mid
ein
cri
sp
bre
ad
(µg
/kg
)
Asparagine (mg/kg)
Acrylamide (µg/kg)
in industrially produced crisp bread
Study of the link between free asparagine and acrylamide formation:
in a model dough
It has been shown that content of acrylamide is increasing with increasing
content of free asparagine in the model dough as well as in the crisp bread

Project funded by the European Commission under the research and technological development
programme 'Integrating and strengthening the ERA' (2002-2006)
Acrylamide
Distribution of asparagine in different grain layers
0
200
400
600
800
1000
1200
1400
1st passage 2nd passage whole grain bran
Asp
ara
gin
e(m
g/k
g)
0
0,5
1
1,5
2
2,5
3
3,5
4
To
tal
ash
(g/1
00g
)
Asparagine (mg/kg)
total ash (g/100g)
- The different types of flour are
obtained by including different
grain layers during milling
process
- They are characterised by
different mineral contents.
It has been shown that the content of free asparagine is increasing with
increasing ash content

Project funded by the European Commission under the research and technological development
programme 'Integrating and strengthening the ERA' (2002-2006)
Acrylamide
Distribution of asparagine in different kinds of grain
asparagine (mg/kg)
0,0
100,0
200,0
300,0
400,0
500,0
600,0
700,0
800,0
900,0
1.000,0
ryeoats
wheat
durum
rice
There are wide differences in content of free asparagine between the different cereals
There is an increase from the lowest content in rice and maize to the highest content
in rye
maize

Project funded by the European Commission under the research and technological development
programme 'Integrating and strengthening the ERA' (2002-2006)
Acrylamide
Lowest asparagine content in rice
370 - 489wheat
146 - 467hard wheat
47 - 95maize
459 - 880rye
504oat
13 - 20rice
mg/kg free asparagineCereal
The different kinds of grains are used for specific products:
One example in this direction is the rice tin bread
produced by PEMA Wholemeal Specialties
Heinrich-Leupoldt KG, Weißenstadt, Germany:
For extrusion products it is possible to use types of grains with low
content of asparagine, like rice or maize. But also for baked goods
cereals with a low content of asparagine should be considered as
possible ingredient.

Project funded by the European Commission under the research and technological development
programme 'Integrating and strengthening the ERA' (2002-2006)
Acrylamide
Distribution of asparagine in different rye varieties
Content of free asparagines in rye varieties
0
100
200
300
400
500
600
700
800
900
1000
Born
Born
Born
Born
Nik
ita
Avant
i
Picas
soBar
oC
ilion
fre
ies
As
pa
rag
in(m
g/k
g)
0
100
200
300
400
500
600
700
800
900
1000
Du
rch
sc
hn
itt
fre
ies
As
pa
rag
in(m
g/k
g
free asparagines (mg/kg)
average free asparagines mg/kg
But due to the scattering of the asparagine contents in rye samples of one variety
it is not possible to select rye varieties of low asparagine content.
It was shown that rye has a high
content of free asparagine.
In the survey on the frequency
of acrylamide distribution, crisp
bread made from rye belongs to
the product group with a high
content of acrylamide.
Therefore, efforts were made to
select rye varieties with a low
content of free asparagine.
Fre
easpara
gin
e(m
g/k
g)
Fre
easpara
gin
e,avera
ge
(mg/k
g)
Project funded by the European Commission under the research and technological development
programme 'Integrating and strengthening the ERA' (2002-2006)
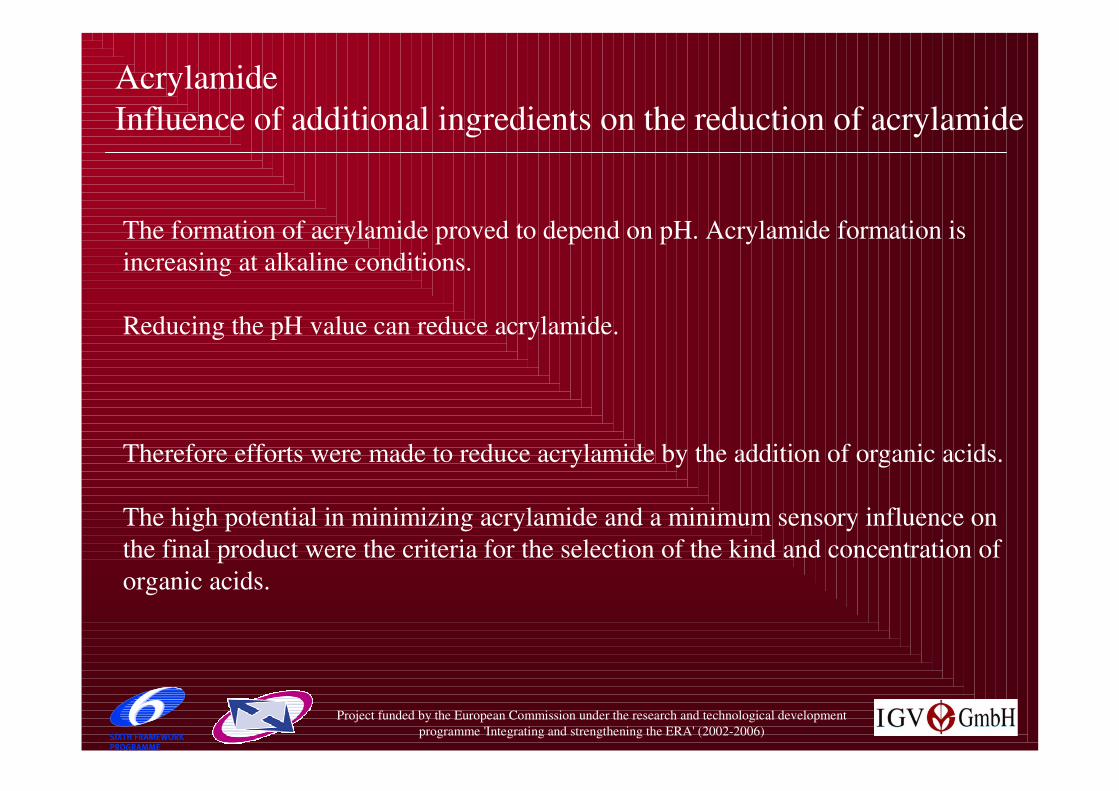
Acrylamide
Influence of additional ingredients on the reduction of acrylamide
The formation of acrylamide proved to depend on pH. Acrylamide formation is
increasing at alkaline conditions.
Reducing the pH value can reduce acrylamide.
Therefore efforts were made to reduce acrylamide by the addition of organic acids.
The high potential in minimizing acrylamide and a minimum sensory influence on
the final product were the criteria for the selection of the kind and concentration of
organic acids.

Project funded by the European Commission under the research and technological development
programme 'Integrating and strengthening the ERA' (2002-2006)
Acrylamide
Influence of organic acids
0
20
40
60
80
100
120
0,0% 0,5% 1,0% 2,0%
organic acid, conentration (%)
ac
ryla
mid
e(%
),s
tan
da
rd=
10
0% ascorbic acid
citric acid
Influence of organic acids
in a model dough
Both acids were effective to minimize acrylamide in baked products
to 25 % of standard tests without any organic acid addition

Project funded by the European Commission under the research and technological development
programme 'Integrating and strengthening the ERA' (2002-2006)
Acrylamide
Influence of organic acids
0
50
100
150
200
250
300
350
standard
recepture
ascor. acid
7 p.m.
ascor. acid
9 p.m.
ascor. acid
11 p.m.
ascor. acid
1 a.m.
ascor. acid
3 a.m.
ascor. acid
5 a.m.
acry
lam
ide(µ
g/k
g)
Influence of organic acid in
industrially produced crisp
bread
Signal value Crisp bread
11/01/2007: 496 µg/kg
Crisp bread was produced
according to two different recipes:
- standard recipe without the
addition of ascorbic acid
- recipe with the addition of
1% ascorbic acid
Samples were taken in intervals of
two hours during two production
periods, i.e. for about 12 hours
A reliable minimizing effect of appr. 30 % was achieved by the addition of 1 %
ascorbic acid without any negative effect on the sensory properties
recipe

Project funded by the European Commission under the research and technological development
programme 'Integrating and strengthening the ERA' (2002-2006)
Acrylamide
Study about acrylamide formation and minimization - Conclusions
Acrylamide can be reduced by
low content of free asparagine in raw material
• content of free asparagine in endosperm lower than in bran
• rice and maize have lower contents than wheat and rye
• Triticum durum has lower content than Triticum aestivum
• variety differences show wide scattering
addition of organic acid (ascorbic acid)
combining several reducing parameters, if possible


![Untitled-1 []...kogumik toob teieni konverentsi ettekanded ja paneeldiskussiooni. Kogumiku sissejuha-tuses tutvustame ‘valitsemise’ ja ‘hea valitsemise’ mõningad teoreetilisi](https://img.pdfslide.net/doc/110x75/60ccefcd003e4454787d0f7b/untitled-1-kogumik-toob-teieni-konverentsi-ettekanded-ja-paneeldiskussiooni.jpg)